
Abstract
The rise of the term ‘big data’ has contributed to recent advances in computational analysis techniques, such as machine learning and more broadly, artificial intelligence, which can extract patterns from large, multi-dimensional datasets. In the field of urban planning, it is pertinent to understand both how such techniques can advance our understanding of cities, and how they can be embedded within transparent and effective digital planning tools, known as planning support systems. This research specifically focuses on two related contributions. First, it investigates the role of planning support systems in supporting a participatory data analytics approach through an iterative process of developing and evaluating a planning support system environment. Second, it investigates how specifically machine learning planning support systems can be co-designed by built environment practitioners and stakeholders in this environment to solve a real planning issue in Sydney, Australia. This paper presents the results of applied research undertaken through the design and implementation of four workshops, involving 57 participants who were involved in a co-design process. The research follows a mixed-methods approach, studying a wide array of measures related to participatory analytics, task load, perceived added value, recordings and observations. The results highlight recommendations regarding the design and evaluation of planning support system environments for co-design and their coupling with machine learning techniques. It was found that consistency and transparency are highly valued and central to the design of a planning support system in this context. General attitudes towards machine learning and artificial intelligence as techniques for planners and developers were positive, as they were seen as both potentially transformative but also as simply another technique to assist with workflows. Some conceptual challenges were encountered driven by practitioners' simultaneous need for concrete scenarios for accurate predictions, paired with a desire for predictions to drive the development of these scenarios. Insights from this work can inform future planning support system evaluation and co-design studies, in particular those aiming to support democracy enhancement, greater inclusion and more efficient resource allocation through a participatory analytics approach.
Introduction
Rapid advances in analytical tools and methods used by urban planners and other built environment professionals continue to grow the emerging field of planning support science (Geertman et al., 2017). These advances extend the remit of planning support systems (PSSs) to include the use of advanced computational techniques such as machine learning (ML) on increasingly large and detailed sets of big urban data (Batty, 2013; Cheshire and Batty, 2012). PSSs can be defined as instruments which ‘collectively support all or some part of a unique planning task […] using a suite of theories, data, information, knowledge, methods and tools’ (Geertman and Stillwell, 2012: 5–7). These usually integrate a variety of computational tools, such as geographical information systems or spatial decision support systems, paying close attention to integrating these to support and facilitate group interaction and discussion on ‘long-range problems and strategic issues’ (Geertman and Stillwell, 2012).
Artificial intelligence (AI) and the decision sciences, despite having alternative perspectives, share similar origins and strive for similar goals (Horvitz et al., 1988). Both share common ground in requiring reasoning about action, when given incomplete information. Working with scarce information resources is central to solving challenging problems in AI, and indeed ‘wicked’ problems in political and decision-driven fields, such as urban planning. As many sectors of society hastily adopt AI methods (e.g. ML) due to the reduced costs of computation and the ubiquitous generation and availability of data, planners and policy makers must be cognisant of the origins of PSSs. As Geertman and Stillwell (2020) highlight, the inception of PSSs was, in part, a response by planners and policy makers to the use of top-down, black-box models (famously criticised by Lee, 1973) that were gaining momentum in the late 20th century. While the ‘Smart City’ is opening up the planning practice more widely to technological innovation (Batty, 2013), if unchecked, this undertaking represents potential historic ironies.
The aim of this applied research is to contribute to an understanding of how planners and policy makers can be involved in the design of ML techniques that support rather than replace the planning task, and what this process may look like. The remainder of the introduction frames this research by introducing relevant literature, research questions, the planning task the ML algorithm seeks to assist and its geographic context. The ‘Method’ section discusses a series of four workshops for the co-design of the ML PSS. The results of the co-design workshops are then presented in the ‘Results’ section. Challenges and opportunities of this research are discussed in the ‘Discussion’ section and concluded on in the final section.
Background
PSSs have often appeared in recent literature as interactive tools, developed with the aim of enabling both analytics and deliberation between stakeholders, supporting a communicative planning approach (Healey, 2003). These generally include hardware systems in the form of large touch sensitive screens, combined with software systems that can perform geospatial mapping and analytical processes ranging from basic statistics to fully developed urban models (Aguilar et al., 2020). These systems, combined, are generally designed to support use and visibility among groups of co-located people. Such interactive PSSs provide a platform for discussing spatial problems or evaluating planned alternatives using a shared map interface. Several studies have investigated the use of these touch tables in planning support, often with a focus on learning outcomes (Bulens and Ligtenberg, 2006; Pelzer et al., 2014; Stewart et al., 2018).
In a systematic review of interactive PSSs, Flacke et al. (2020) found that while stakeholders are involved in the use of the PSSs, in many cases they have minimal input on design of the software systems being used. This distance from the inner workings of the software potentially contributes to them ‘far from being used in everyday planning practice’. Bridging this ‘implementation gap’ is a key milestone for this field of applied research, which has been thoroughly examined over the past 15 years, notably stemming from the work of Vonk (2006) and continuing to appear in more recent works (e.g. Geertman, 2017; Silva et al., 2017; Te Brömmelstroet, 2016). Geertman (2017) highlights that while there is plenty of theoretical work discussing bottlenecks and potentials of PSSs (‘on PSS’) there is smaller, but growing, amount of applied research discussing its ability to deal with real-world planning problems (‘with PSS’).
The usability of PSSs is discussed by Russo et al. (2015). The authors highlight that usability evaluation of PSSs had previously been limited, despite the existence of open tools, frameworks and standards by the software industry for decades. Following this research, Russo (2017: 131) recommends that PSS developers should ‘[focus] on users from the beginning of the system design and development process’ and undertake ‘iterative development of the system through prototypes of increasing complexity’. These recommendations echo the importance of an iterative, agile process (Larman, 2004) that integrates and uses usability evaluation many times during the design of a software system, rather than after it. Furthermore, while there are multiple standard usability techniques for single user desktop environments, large group environments may require additional evaluation techniques which have not been fully explored.
It is also important to highlight that PSSs have had limited adoption in practice across Australia, where this research is undertaken. Pettit et al. (2018) summarises a number of these PSS tools and their applications applied throughout the country such as CommunityViz, Envision, ‘What If?’ and the AURIN portal. As we aspire to integrate more complex analytical models, such as those of ML, into PSS software, it is timely to focus on enabling their positive potential future adoption by urban planners and other key stakeholders through understanding how to enable their co-design. This is not a unique challenge to PSSs – Narayanan et al. (2018) describe that there is a growing requirement for ML developers to understand which explanations are best for which contexts. As such, the contributions of this research, while focusing on PSSs, can also be situated within other interdisciplinary contexts which require an explainable and collaborative approach to ML development.
Planning context
The context of this research is to support the planning task of where to place major transport infrastructure projects, such as highways, heavy rail and metro systems. A component of this task is understanding how land value changes as a result of the placement of these transformational projects. Once this future value is ascertained, investment in these areas can be incentivised, supporting new development, such as residences, commercial buildings and shopping centres. Furthermore, access to various urban amenities such as work, health, recreation and education are important considerations both in terms of potential impact on land value and long-term objectives of liveable, accessible and sustainable cities.
This study engaged a real-world planning exercise of locating new rail infrastructure in Western Sydney, Australia. Sydney’s metropolitan strategy, the Greater Sydney Region Plan (Greater Sydney Commission, 2018), redefines the city’s spatial framework as a ‘metropolis of three cities’ – an Eastern Harbour City, a Central River City and a Western Parkland City (for a map of this area, see supplemental Figure 1). At present, the Western Parkland City, apart from activity centres to the north and south, is predominantly greenfield land. Significant development would need to occur to meet the targets outlined in this strategy which would house upwards of 300,000 additional population in this area by 2036.
To support this growth, infrastructure improvement in this area is being investigated, such as a new ‘North-South’ rail corridor, which would form a spine along the Western Parkland City and allow connectivity between two other cities to its east. For planners, developers, designers and decision makers, there is a significant challenge in understanding how to maximise the potential of this undeveloped land to support this growth, while also enabling positive living outcomes for those who will reside and work in this area.
Research questions
Given this context, this research aims to investigate the collaborative development of ML techniques to solve planning issues and how they are realised in a PSS environment. This is done through investigating the following research questions:
How can PSS environments be evaluated in a way that captures the experience of multiple stakeholders undertaking complex urban analytics and effectively informs a co-design approach to PSS development? What unique opportunities and challenges are exposed when practitioners are engaged specifically with the task of the co-design of an ML PSS?
Method
This study follows as a mixed methods, quasi-experimental design. By using insights from both qualitative and quantitative approaches, this research explores workable solutions for the design of a PSS environment that facilitates co-design of a PSS that supports complex urban analytics, such as the use of ML techniques. This section will describe the components of the PSS environment considered for each workshop, evaluation methods employed and detail of the workshop goals and structure.
Defining a PSS environment
The first step of the method defines the environment which enabled the iterative co-design approach. For this research, the concept of a PSS environment was explored to describe key components of the co-design workshop setting, shown in Figure 1. These revisit the components of knowledge-based systems in early academic work on decision support, information systems and decision models (Duchessi and Belardo, 1987; Mennecke, 1997). Primary components of a knowledge-based system include a database, an ‘inference engine’ (model base) and a knowledge base. These are compiled through a graphical user interface (GUI) and interacted with by a ‘user’.
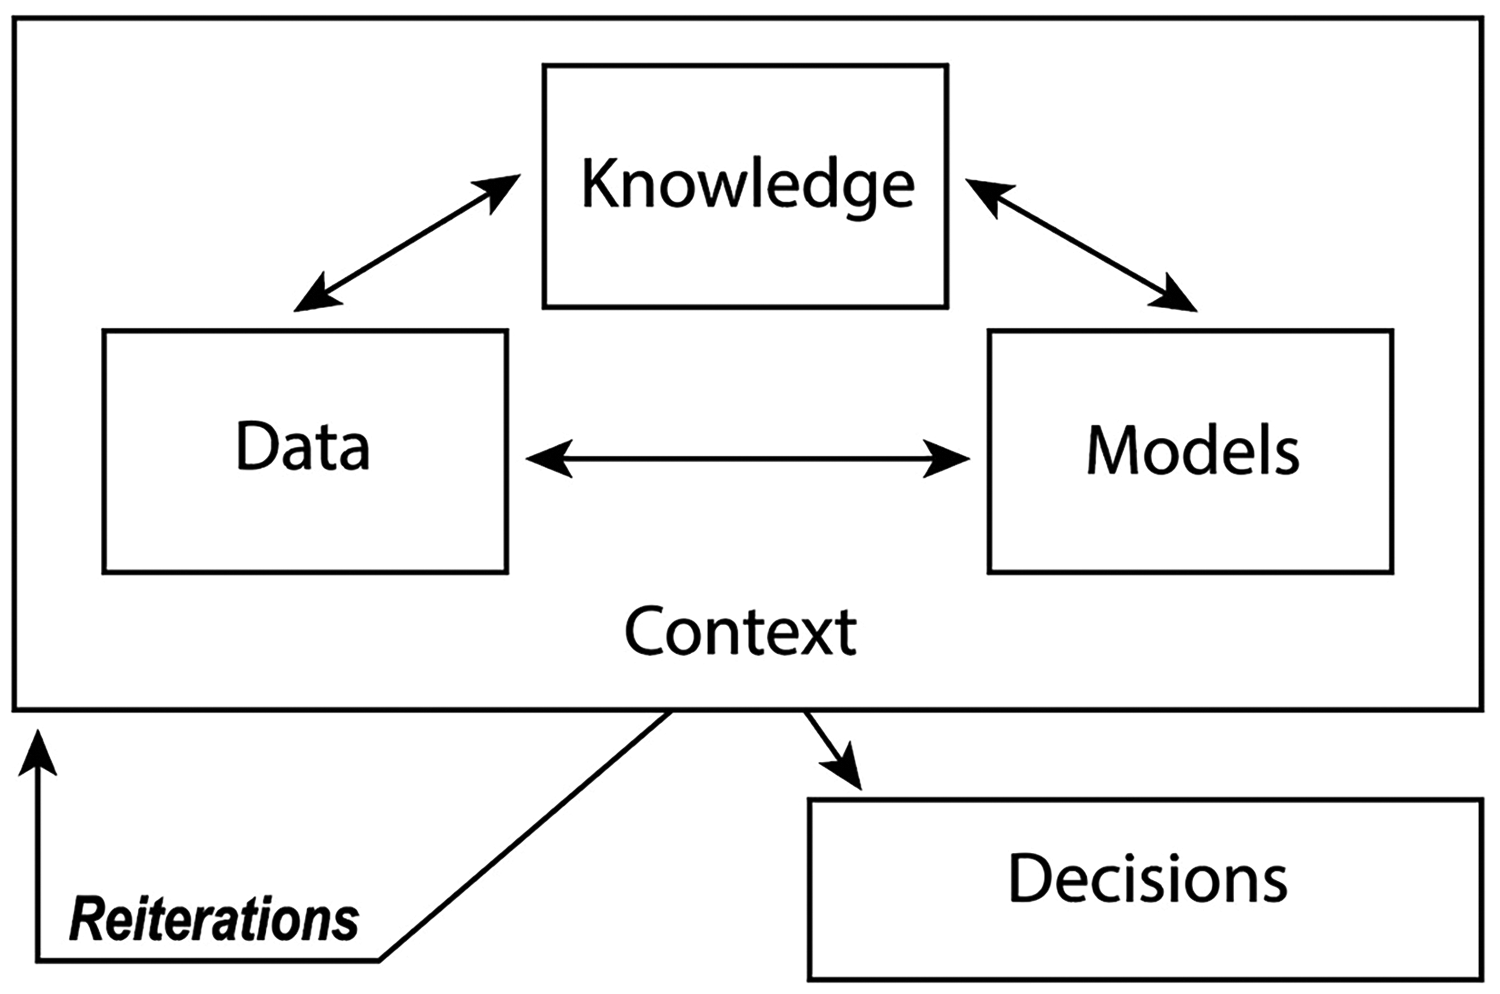
Schematic of PSS environment. PSS: planning support system.
A PSS environment resembles this, but identifies the unique components required for a planning task. This approach acknowledges that planning is a social process and it is not viable to decouple the software systems from their situational application. Further, multiple (rather than single) users are also considered. Re-iterations of the PSS environment can occur whereby data, knowledge and models may be modified. This allows users to modify the decision environment to better suit their own needs. This method acknowledges that planners and built environment professionals are central and vital to PSS development process, echoing insights from service design where consumer participation has become an integral part of uptake of products and services (Steen et al., 2011).
Database
An initial database was provided in the PSS environment to describe current and potential futures for the study area. Sydney’s population, workforce and employment projections to 2036 were collected and included as geographic data layers (Transport for NSW, 2018). The location of site constraints such as land where development implications exist due to the risk of flood was also included. High resolution imagery was obtained, which can also show historic ‘before’ and ‘after’ images of the city (Nearmap, 2019). The location of current public transport infrastructure, and several future projects that would affect Western Sydney, were also described as geographic data layers.
Historic property sales, which form the basis of the ML model, were also visualised. As this is a ‘big’ dataset of over 3,000,000 sale locations, an appropriate visualisation platform, KeplerGL, was selected. KeplerGL is a platform developed by Uber (2019) which allows high-performance, web-based data visualisations in the browser due to efficient use of the graphics processing unit. As such, users can gain an appreciation of the scale of data driving the model base.
Knowledge base
Knowledge exchange is a critical component of PSS usefulness (Pelzer et al., 2015), enabling the transfer of ‘tacit’ knowledge gained through participants’ past experience. Pelzer et al. (2016) identify that several PSS case studies include predominantly student samples. This raises questions of external validity regarding whether these are transferable to real-world planning practice. In order to address this, another key research aim was to include as many active built environment professionals as possible.
Participants for this study were recruited largely through phone and email invitation through the research team’s professional contacts and circulated within those contacts’ organisations. Specifically, individuals were contacted because of their potential interest and involvement as active professionals in the future planning of the study area. During the recruitment process, interest was high – striking a diversity of professional representation with 48% of participants working in the public sector, 40% private sector and 12% other (mainly full-time students).
The participants' current occupations ranged from federal, state and local government; industry bodies; property development companies and urban design, planning and engineering consultancies. Several postgraduate students also participated, many of whom were also actively employed with expertise in built environment fields. It should be noted that, particularly for government agencies, the nature of their attendance was highly unpredictable – one individual can turn into three attending due to increased interest from various departments, but also three into zero due to urgency of other matters. As such, a flexible structure of PSS environment and co-design approach is necessary. A more detailed overview of the participants’ background and skills from the pre-questionnaire can be found in supplemental Table 1.
Model base
Two primary functions were used to model the changes in land value and in access to amenities made by new transport intervention.
Changes in land value
Models predicting changes in land value were trained using a longitudinal dataset of approximately 3,000,000 property transactions across Greater Sydney over 17 years (2001–2017). This is further augmented by data such as property attributes (bedrooms, houses or units, viewsheds), locational attributes (such as proximity to a coastline), transport access attributes (such as walkability, public transport and vehicular access to education, health and employment opportunities by industry) as well as planning constraints such as zoning and flood overlays.
Hedonic pricing method (HPM)
In order to provide a base line model of changes in land value, the RAISE tool was used. RAISE is an existing PSS which uses HPM to quantify the impact of transport infrastructure on residential property prices, then uses this modelling to estimate changes in property values during the exploration of different hypothetical scenarios of new infrastructure provision. The RAISE model is calibrated to calculate land value uplift for present year scenarios in Sydney, including the study area of Western Sydney (Lieske et al., 2018; Pettit et al., 2020).
ML method
In the first workshop, the results of applying the ML method were applied to the greenfield area of Western Sydney in a ‘business as usual’ scenario for the year 2036. This was based on model assumptions with limited understanding of the study area. A set of artificial properties were generated for the existing greenfield land based on population forecasts, and these were valued based on predictions learned from the historical property sales. Feedback on this and the database, from the knowledge base (participants), drove the development of the ML algorithms, the scenarios displayed and the user interface. The open-source XGBoost Python library (Chen and Guestrin, 2016) was used. This creates a fast approach for gradient boosting, a commonly used supervised ML algorithm which attempts to accurately predict a target variable (here, property values), by combining the estimates of many simpler models.
Changes in access to amenities from new transport interventions
In order to provide a model for changes in access to amenities, the Conveyal Access Analyst tool was used (Conveyal, 2019). The Conveyal Access Analyst tool is an online front-end connected to a server which allows on-the-fly network analysis. This allows participants to create and test their own transport scenarios. At a rapid speed, users can create a new or modify the existing public transport networks, upload an opportunities dataset (e.g. existing or new locations of jobs, schools and hospitals) and rapidly assess the differences in cumulative accessibility between scenarios (Lock et al., 2020).
Context
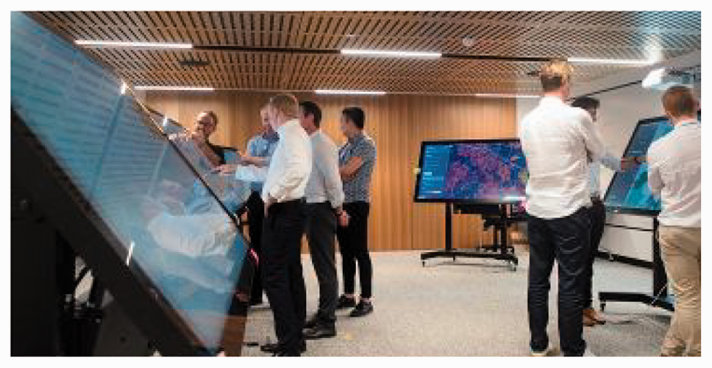
The experimental PSS environment was set up in the City Analytics Lab at the University of New South Wales, a physical space customised to support collaboration among co-located groups of people. The workshops took place in a controlled space with six large interactive multi-touch screens. The screens were capacitive touchscreens, 65-inch size with 4k resolution and 80 points of touch. Each screen used consumer-grade gaming computers, powerful enough to run a wide range of web and desktop modelling software (e.g. NVIDIA GeForce dedicated graphics cards, i7 processors, over 8 GB RAM and 64-bit Windows operating systems). The environment enables researchers to examine various kinds of collaborative interactions that take place when groups use, share and discuss digital information and tools related to urban planning.
Evaluating a PSS environment
Prior to each workshop, the participants completed pre-task self-assessment questionnaires which recorded demographic variables, familiarity with technologies and professional expertise (see supplemental Table 1 for results, and supplemental Appendix 1 for full survey). As well as this, three key components were measured immediately after each workshop: first, the degree of difficulty participants experienced when performing tasks in the PSS environment was calculated through the Task Load Index; second, the degree to which participation outcomes were achieved was rated; third, the perceived usefulness of the PSS environment (as to opposed to not using it in this context) was rated. As well as this, additional and open-ended questions about the tasks, workshop and interfaces were asked. During the workshop, general observation, audio and video recordings, and physical and digital post-it notes were also collected to assist in interpretation of findings.
Task load
As part of the post-workshop questionnaire, the task load was measured. The NASA Task Load Index or NASA-TLX (Hart and Staveland, 1988) is ‘a multi-dimensional scale designed to obtain workload estimates from one or more operators while they are performing a task or immediately afterwards’. NASA-TLX consists of six subscales: mental, physical and temporal demands, frustration, effort and performance. The NASA-TLX has been applied to assess design and processes involved in flying aircraft, driving vehicles, data entry tasks, decision-making, communication and collaboration (Hart, 2012).
In general, the subscales are combined into a single overall workload score. However, for this study the individual subscales were also assessed – a common variation of using the NASA-TLX scale (Hart, 2012). This assists in diagnosis of the source of specific workload or performance problems, which can then be taken into account for future iterations of the tool and workshop design. To date, the NASA-TLX has had very limited application in studies specific to the built environment.
Participatory analytics
A categorisation system for ‘participatory analytics’ was implemented during these workshops. Filonik (2017) describes ‘participatory analytics’ as addressing three key goals – participation, exploration and collaboration. Lock et al. (2019) describe this in the context of urban data platforms, with key outcomes of information-attainment, participation, engagement and usefulness. The questions aim to provide an evaluation measure of these outcomes (detailed in supplemental Appendix 1), measured through a Likert Scale. The first category, ‘informative’, included questions on whether the use of the PSS environment was reliable, accessible and understandable. The second category, ‘engaging’, included questions about whether it was immersive, interactive and inciting empathy. The third category, ‘participatory’, included questions about the processes of deliberation, inclusion and influence. The final category, ‘useful’, included questions about whether it was usable and had a valid utility in the context it is being used in.
Perceived added value
Following work conducted by Pelzer et al. (2016), questions about the perceived added value of the tools were also included in this study. Participants were asked to rate which top three added values they perceived of using the tools, compared to not using them. These added values included learning about others, learning about the issue, others learning about them, better communication, better cooperation, more consensus, more efficient work, more informed work, more transparent work and more enjoyable work.
Workshop design
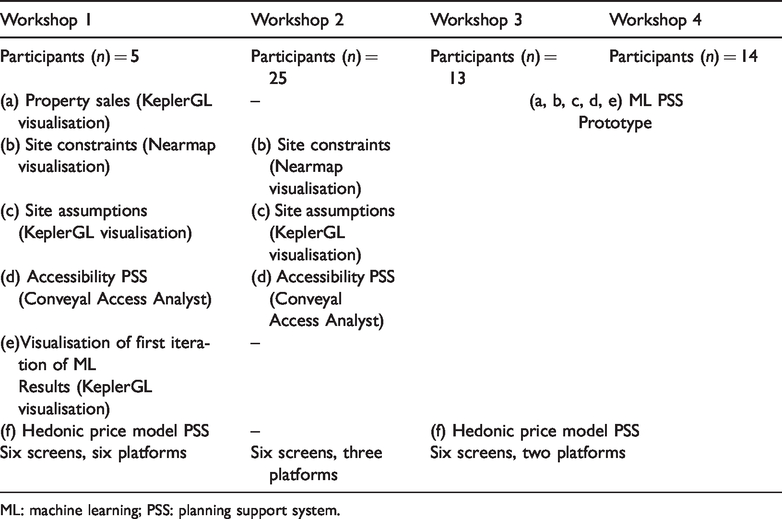
Overall, 57 total participants were involved in this study. The first workshops began with cursory use of six digital planning tools, progressing to the final workshop, involving focused use of two digital planning tools. A summary of these can be found in Table 1. Throughout the workshops, feedback on interfaces, assumptions and constraints was built into each subsequent workshop incrementally towards the design of the final ML PSS prototype. Workshops followed a standard approach starting with an overview of the study area and tools, followed by pre-workshop questionnaires, completing tasks in small groups for approximately two hours, post-workshop questionnaires and general discussion.
Evolution of PSS environment supporting ML PSS.
 Workshop 1
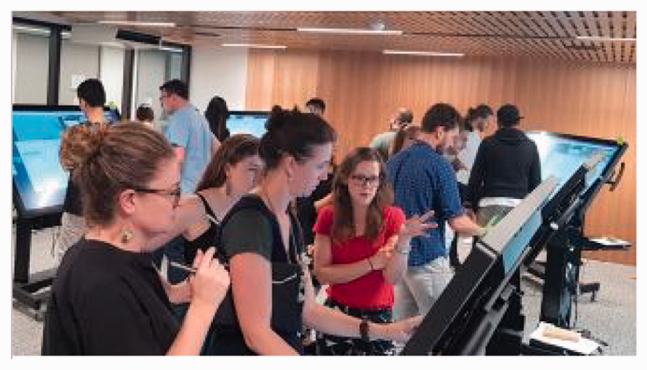 Workshop 2
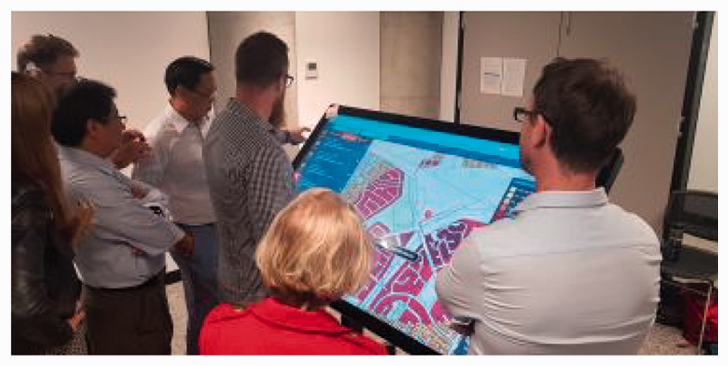 Workshop 3
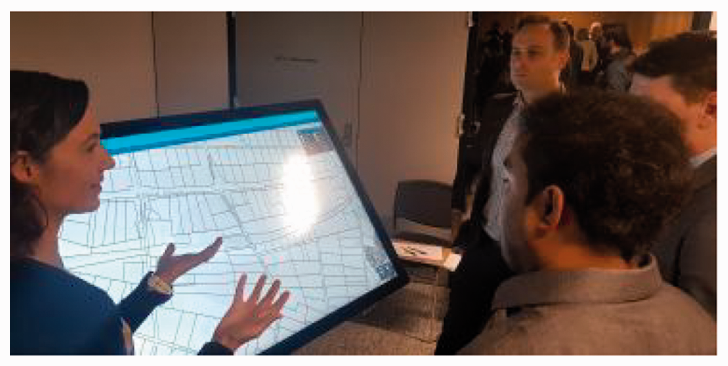 Workshop 4
ML: machine learning; PSS: planning support system.
Workshop 1 (n = 5) exposed participants to a full suite of existing data and models that can be used to inform the planning task. These included property sales data (a), site constraints (b) and population/employment forecasts (c). Once given feedback on these contextual data, participants were tasked to place future infrastructure projects into the accessibility model (d). Participants viewed initial ML results predicting property price values for a ‘no infrastructure’ scenario as well as a scenario based purely on population growth for the region (e) and compared this with the interactive hedonic price method (f).
Workshop 2 (n = 25) focused on designing future transport alignments to meet specific accessibility goals, while considering the population/employment forecasts in the Western Sydney region. Participants engaged with fewer tools and gave feedback on the data, model and knowledge bases involved in the activity. The focus of this workshop was on the PSS environment and generating futures for the ML algorithm to provide predictions for.
Following the feedback from these two workshops, Workshops 3 (n = 13) and 4 (n = 14) integrated a number of these future transport scenario which were used in both the ML algorithms and as descriptive data layers of accessibility for each scenario in the ML PSS. Participants interacted with both a fully developed hedonic price model PSS (f) and an ML PSS which integrated a wide range of comments on the previous a, b, c, d and e into a single interface. Through these interfaces, they investigated the changes in property value from future infrastructure scenarios and differences between these land valuation techniques.
Results
The following section describes the results of this research. First, it describes the findings that were primarily related to the first research question by describing the evaluation of each co-design workshop. Second, it introduces the ML PSS designed through iterative feedback from each workshop and presents a summary of practitioner feedback on the challenges and opportunities of this approach.
Evaluating the PSS environment
Task load
Investigating the task load gave a valuable overview of the overall workshop experience, while highlighting individual components to improve through sub-criteria. By the final iteration of the PSS environment there were notable reductions in frustration and effort, as well as increases in task performance. Figure 2 highlights the results of the Task Load Index (NASA-TLX) across all four workshops, by sub-criteria. Based on the work of Grier (2015: 1729) on comparing NASA-TLX values across a wide range of use cases, we compare these task load values with those of Grier’s cognitive activities, ‘tasks requiring mental action’, as a benchmark. The lowest overall mean task load value of 44 was experienced in the final workshop. This can be considered a below average load, lower than 50% of all scores investigated by Grier. The highest overall mean task load value was 63, which was in Workshop 2. This is very close to the maximum observed mean workload score of 64.9 collected by Grier for cognitive tasks and well above the workload score observed in 75% of all documented cognitive tasks.
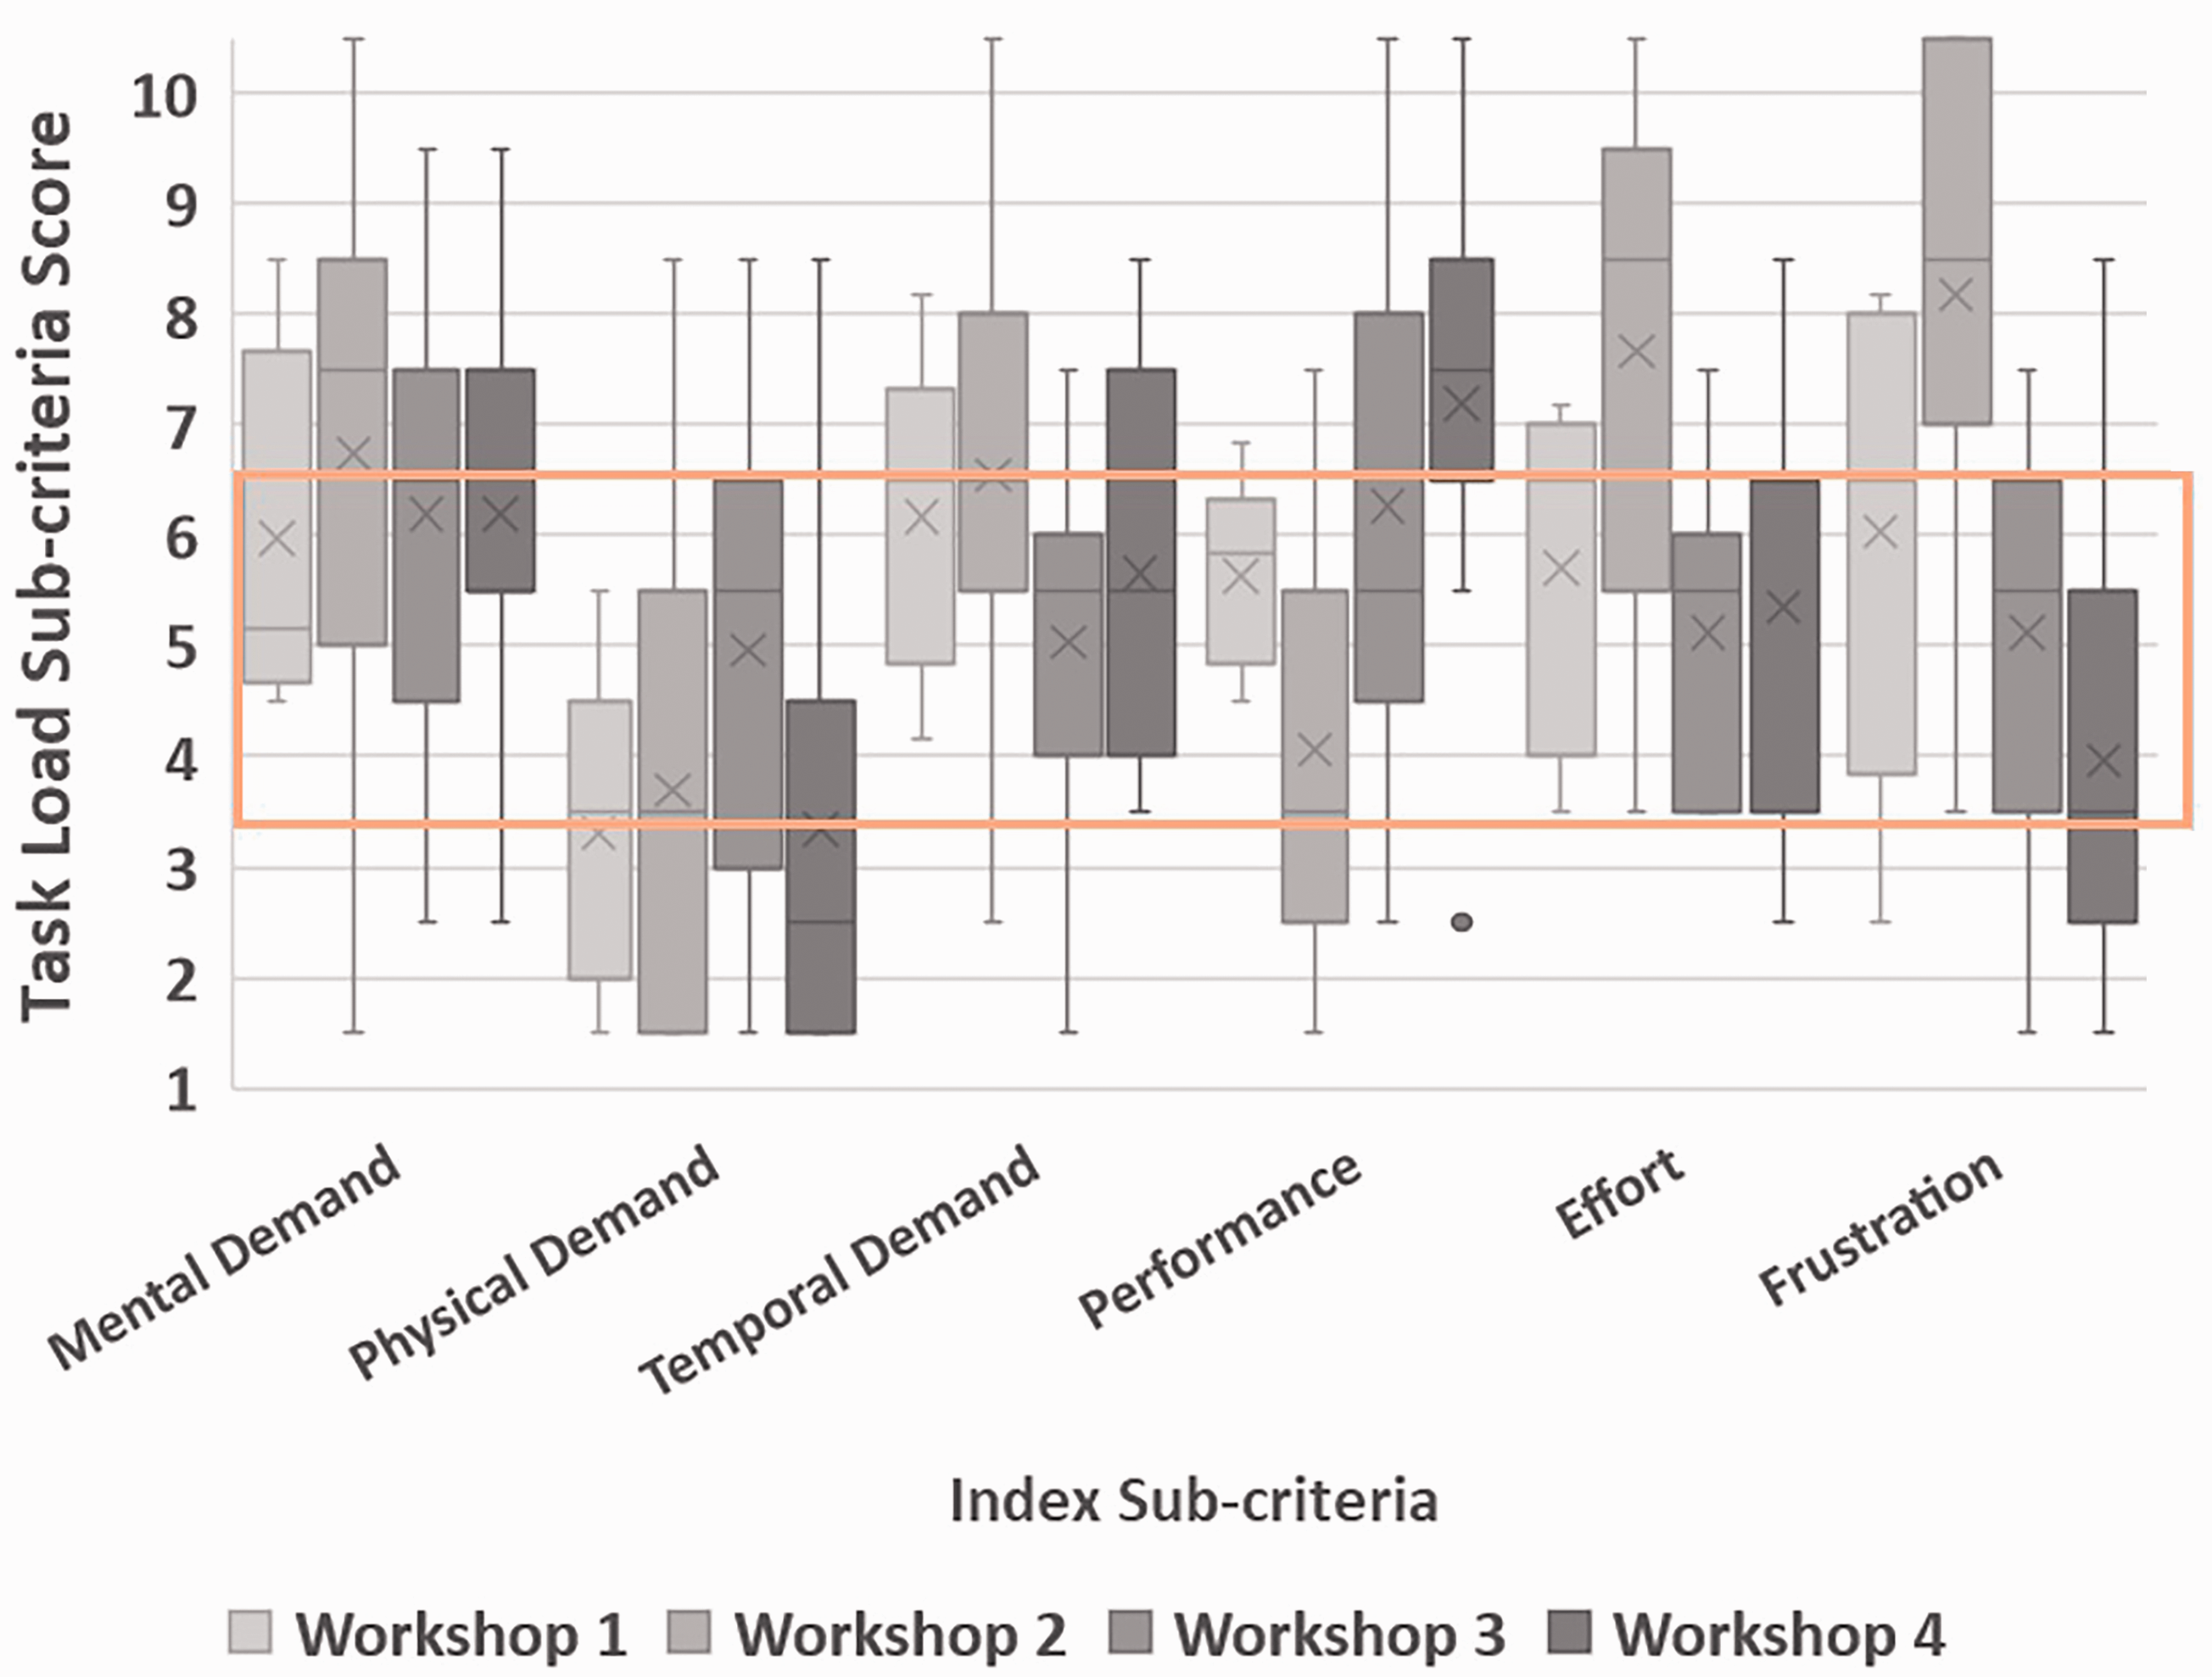
NASA-TLX by sub-criteria for each workshop.
Based on these scores, the expected range of values for performance of the sub-criteria is between 3.5 and 6.5, highlighted on the diagram. For performance, this criterion is inverted (with higher performance being the goal, in comparison with a lower task load). Mental demand was found to be quite consistent throughout all four workshops, with the averages moderate to high compared to the expected range. Although the tasks involved continuous standing, participants rated physical demand much lower than the expected range. Both Workshops 1 and 2 experienced notably higher temporal demand than Workshops 3 and 4, meaning it is likely they felt more rushed in performing their tasks. Workshops 3 and 4 showed distinctive increases in performance from 1 and 2. Effort and frustration increased in Workshop 2, while decreasing in Workshops 3 and 4. Frustration was a notable stand-out metric for Workshop 2, which was a useful finding feeding directly into the user interface design discussed later in the paper.
Participatory analytics
Participants assessed how informative, participatory and useful the PSS environment was through a series of questions discussed in the previous section. Scores were combined into an aggregate index with scores between 4 (all aspects were rated 1 out of 5) and 20 (all aspects were rated 5 out of 5). Figure 3 highlights these results, with a satisfactory workshop having an average score (shown by ‘x’) above 12/20. It was found that results were generally consistent, with every workshop well above satisfactory levels for the majority of participatory analytics criterion. It is important to note that the ‘useful’ value from these participatory analytics criteria was rated lower especially in cases when ‘frustration’ was high in the NASA-TLX, which may be particularly notable when deciphering what factors may drive perception of usefulness versus more objective utility.
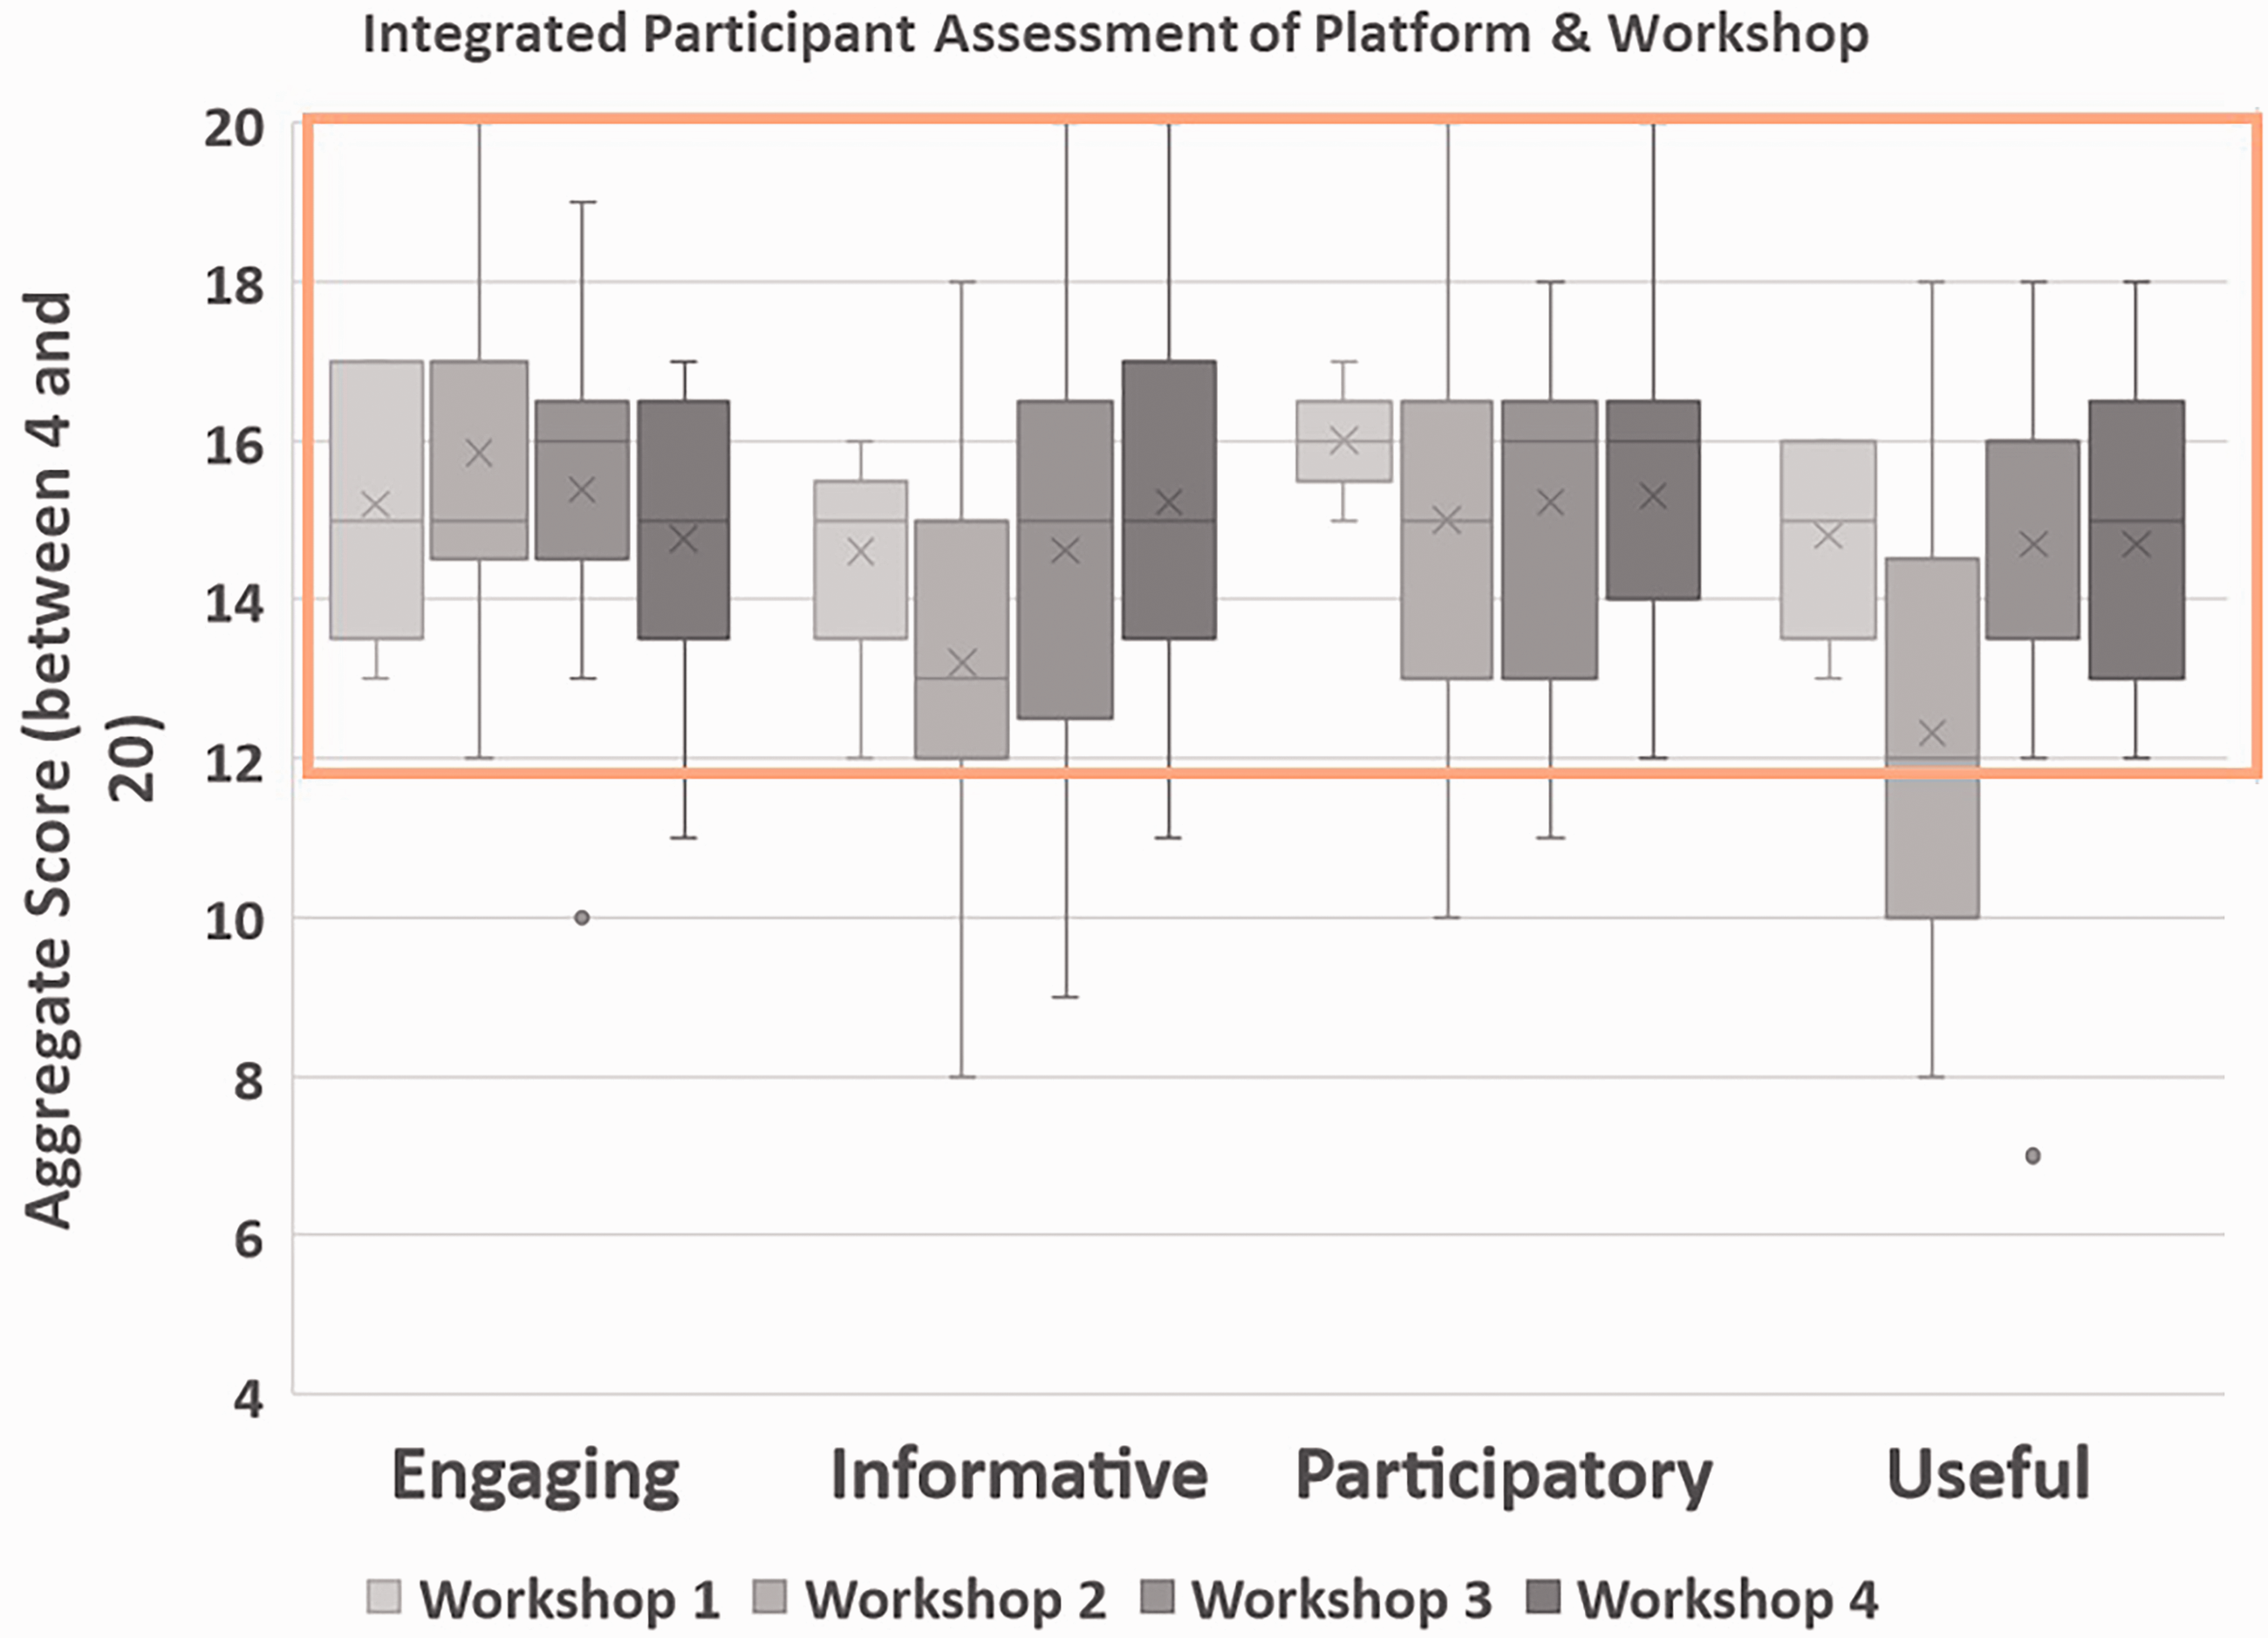
Participant assessment – participatory analytics.
Perceived added value of PSSs
Three characteristics, from all workshops, were the primary benefits of using the PSS environment compared to not using it. These characteristics were more informed work (20% of participants’ top three characteristics), learning about the issue (18%) and more transparent work (13%). These were followed by better communication, better cooperation and more efficient work (9% each). Other factors were more enjoyable work (8%), more consensus (7%) and learning about others (6%).
Written and verbal comments
Further to these measures, written and verbal comments were also considered. A total of 125 written comments in the questionnaire were recorded, approximately 30 ‘post-its’ generated per workshop (notably much fewer in Workshop 1, with fewer participants) and key verbal quotes which were transcribed during or immediately after the workshops. These are summarised as covering key themes of multi-touch display, tool outreach, consistency, perspectives on ML, model improvements, data comments, interface improvements and learning outcomes. Specific findings from these are elaborated on in the discussion and key quotes available in supplemental Appendix 2.
Designing the ML PSS
Development of the system
Aside from evaluating the PSS environment, the other core component of this research was the development of a high-fidelity prototype of an ML PSS to communicate the results of simultaneous ML algorithm development. This used scenarios, constraints and datasets curated by stakeholders during Workshops 1 and 2 to form a set of ML model results explored using a 3D interface in Workshops 3 and 4. Three transport alternatives for the year 2036 were explored. The following key functionalities (A–J) were featured in the ML PSS prototype, outlined in Figure 4. The prototype forms an artefact of an ML PSS which can be co-designed through an evolving set of PSS environments.
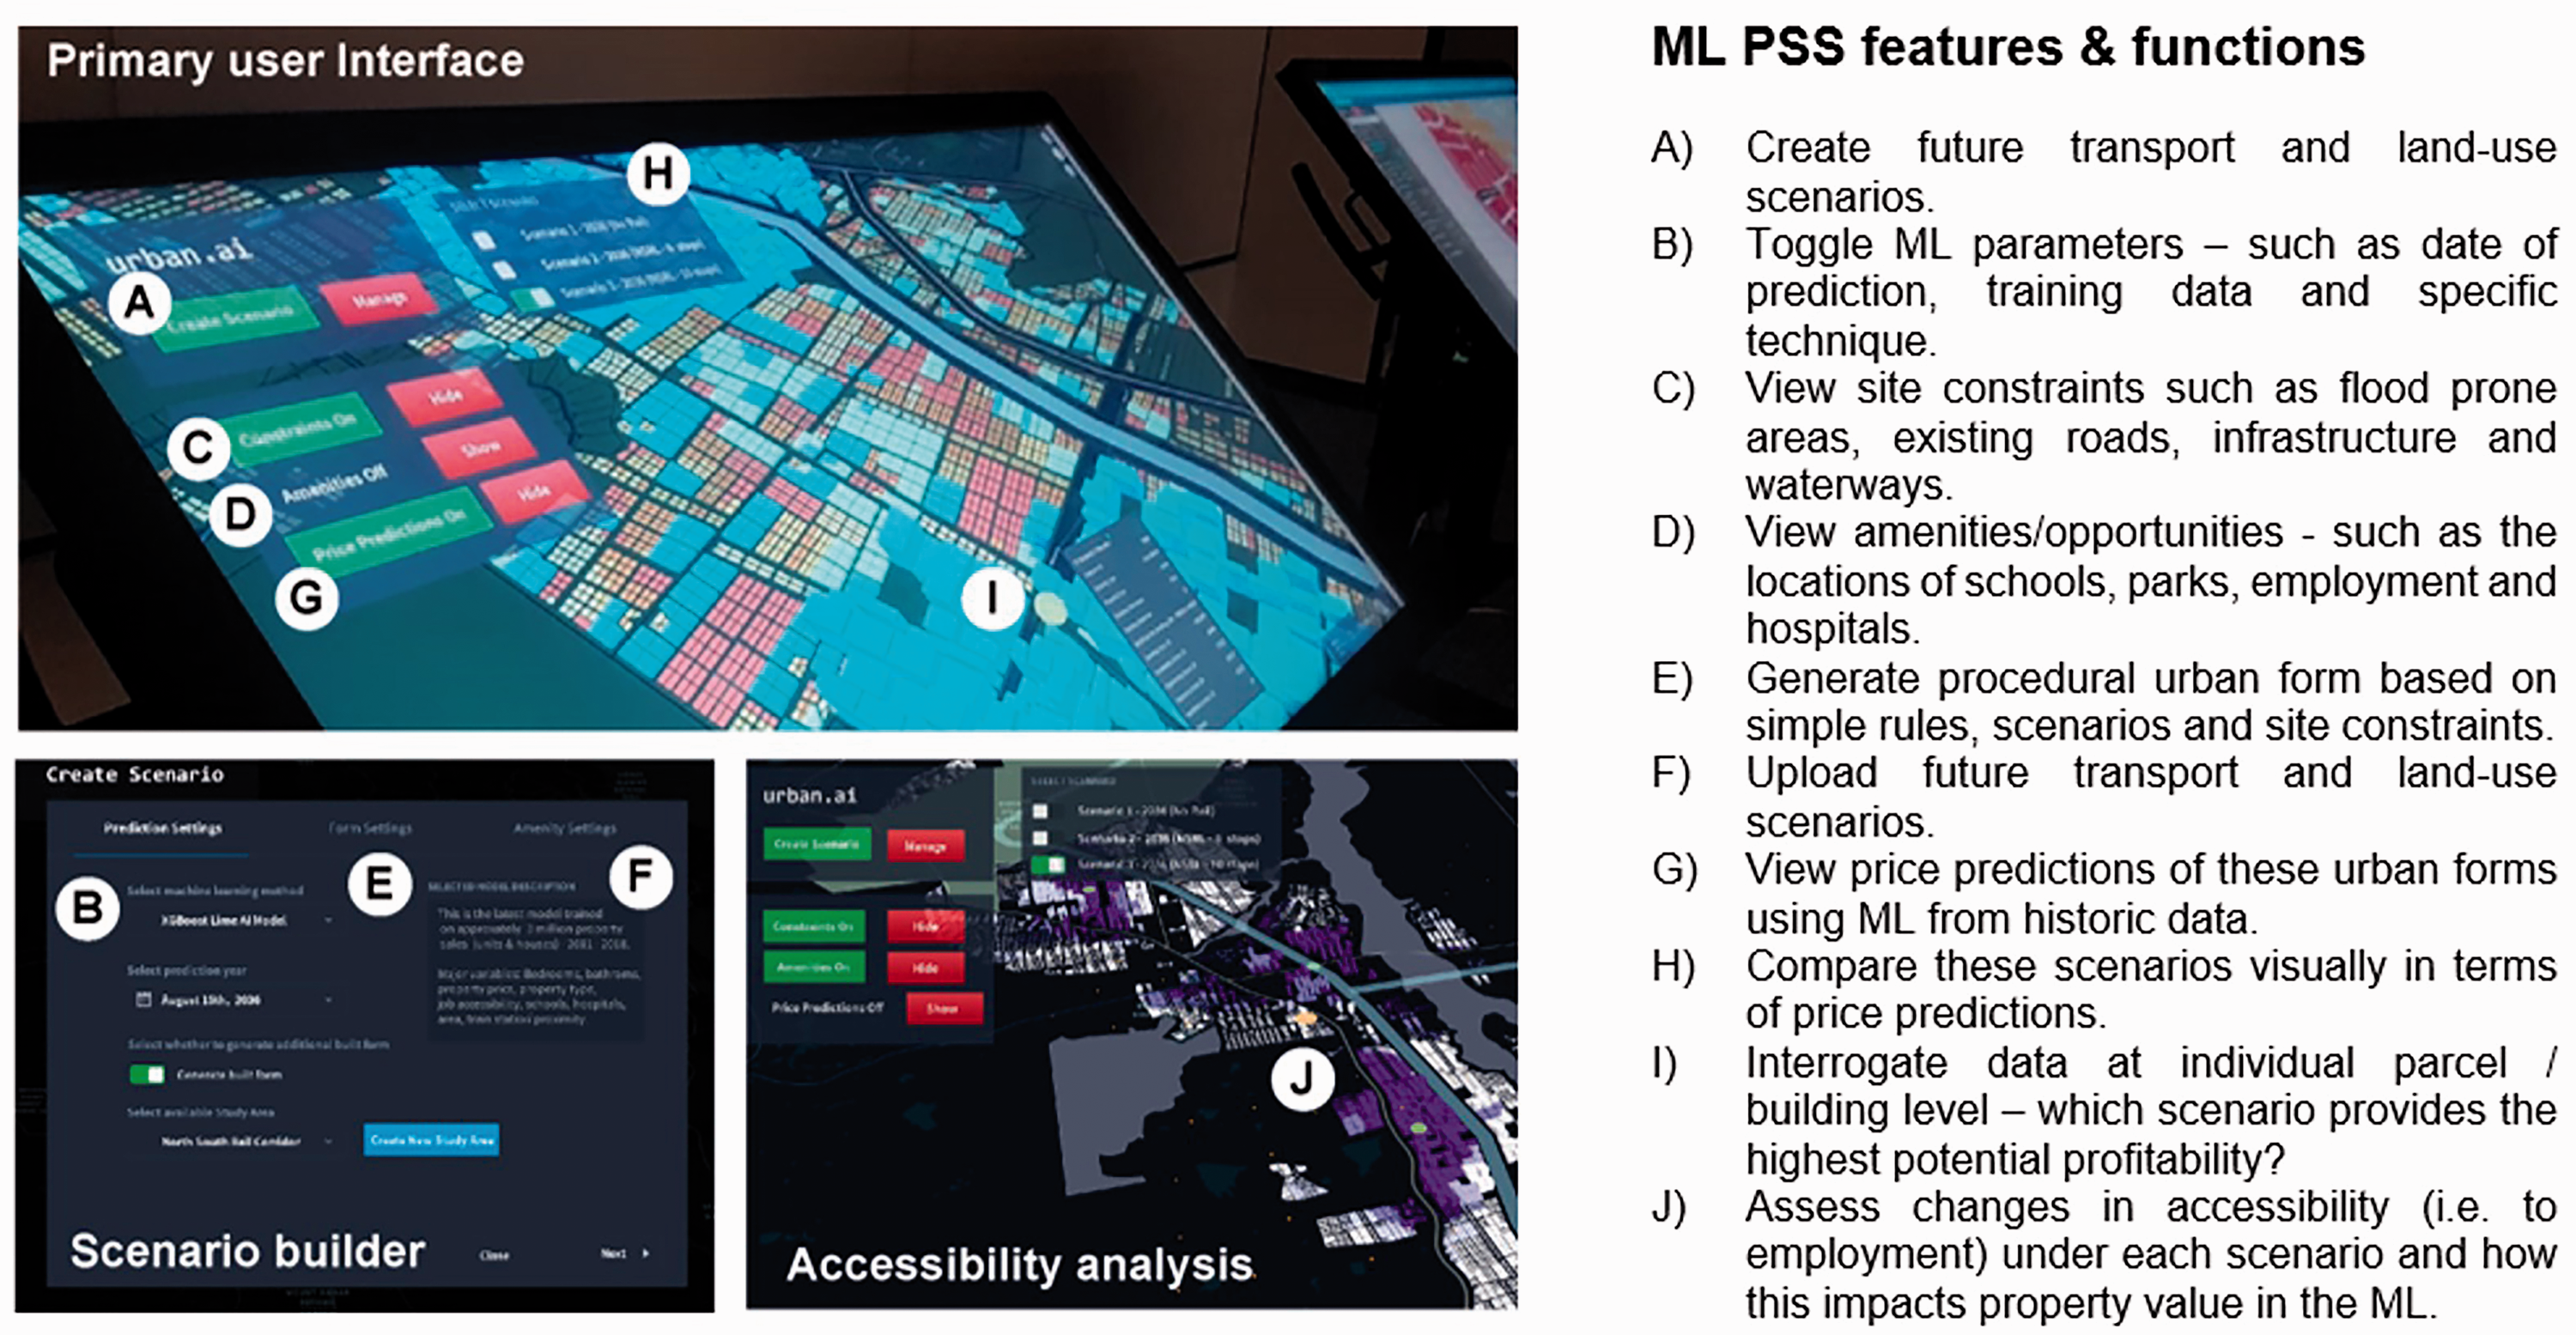
ML PSS prototype with annotations of features and functions.
The notional GUI was compiled using high resolution screenshots of a suite of KeplerGL visualisations of the ML scenario results. These are made highly interactive and shareable through prototyping software Invision (Invision, 2019). Key benefits of this format were that many stakeholders could add comments on top of the prototype and interfaces could be designed rapidly for multiple types of device. This decision to use Invision allowed users to take their time in discussing and annotating the product before being exposed to all the interactions available in the fully developed systems. Within the supplemental Appendix 3 of this research are more screenshots of the developed interface.
Discussion
The PSS environment enabled researchers and practitioners to collaborate closely on the task of co-designing an ML PSS. Four workshops were undertaken in order to understand how to design effective, engaging, useful and understandable environments and complex urban models (in this case, an ML PSS) for use by groups of planners and other built environment professionals.
The iterative approach to optimising the PSS environment showed positive results in reducing task load and maintaining consistently positive participatory analytics variables. Further, perceived added values were captured indicating the environment created can lead to more informed work, learning about the issue and more transparent work. Further to this, it created a sound prototype of an ML PSS which has had multiple iterations of feedback by built environment professionals, contextualised in a real planning issue. The following recommendations highlight a set of key issues and insights into performing future evaluations adopting this approach.
PSS environment
First, we discuss findings and recommendations regarding the first research question: How can PSS environments be evaluated in a way that captures the experience of multiple stakeholders undertaking complex urban analytics and effectively informs a co-design approach to PSS development?
Post-workshop self-assessment questionnaires
Of the three self-assessments question sets used to understand the components of a successful PSS environment, the NASA-TLX, evaluating task load, showed the most obvious variation between workshops and was found to be the most useful in diagnosing which individual elements of the PSS environment to change. While participatory analytics variables were generally positive, these were limited as they did not show significant variation between workshops and thus would require more calibration to achieve valuable results. This could involve including more questions to assess these factors or more significant differences in workshop format such as change of interactive devices used. As measures such as NASA-TLX have been around for a long time, there is more information available as to what variables to expect for task types and case studies using this can be used to inform others.
In a similar vein, this study used the same questions on perceived added value as Pelzer et al. (2016) used in a comparative case study of four PSSs using MapTables in group settings. The authors found that ‘learning about the object’ and ‘learning about others’ were perceived to be the most important added value of PSS applications. In this study, ‘more informed work’ and ‘learning about the issue’ were rated the two most important. While ‘learning’ is synonymous in both approaches, the measurement of this was slightly different. Their study allowed the selection of only one significant value, and this used a ‘top three’ approach. Notably, only 6% of the 57 participants placed ‘learning about others’ in their top three. This is likely due to the fact that our participants were aware that their actions were primarily informing the design of tools to assist in the planning task, while only indirectly to solving the planning task themselves.
High-fidelity prototyping
One essential action identified throughout the design process was to engage participants in a linear set of steps that outline the key functionality of the ML PSS prior to using it, moderated by a wireframing software (this was used in Workshops 3 and 4). It was found that this approach allows simpler interfaces with reduced functionality, but potentially gives users a much clearer understanding of the data and processes of the system to comment directly on. It was clear that this approach avoids inciting ‘analysis paralysis’ when exposed to too much information or functionality. Further, participant frustration levels were lower (shown in task load, questionnaires and observation), while they rose noticeably in previous workshops when precise or repetitive interactions are required (such as clicking a small point, typing letters and drawing detailed information).
It is recommended to use similar software in future co-design approaches, as this was effective in producing interactive, annotatable proof-of-concepts from a series of screenshots of high-quality visualisations of data, assumptions and model results. Further, it enables comments to also be added by remote users via the web – potentially extending the sample of users involved beyond co-location; as well as, in our instance, enabling practitioners to show their colleagues after the workshop. This, in turn, could assist in inciting interest beyond the workshop scenario potentially extending the learning outcomes of the PSS environment beyond the co-located environment. Future work can apply and evaluate web-based collaboration as a more integral part of co-design of PSSs.
Consistency, transparency and shareability
While questionnaires and notes were useful in diagnosing particular issues with software, data and hardware, bigger picture themes only revealed themselves through verbal comments and open-ended questions. These included certainty and transparency as benefits and suggestions for future PSSs (regardless of their inclusion of ML). Displaying data sources and assumptions and providing objective, open tools were key desires of practitioners. This was well summarised by one participant’s comment: ‘Every single time a new plan comes out, there is a new location and impact. […] Anything that can provide certainty and transparency to the planning process is extremely valuable to us’.
A key finding was that simply having authoritative modelling products underpinning PSSs used by multiple stakeholders was envisaged as potentially transformative of the planning process. Participants described a current lack of a single objective reference for proposed urban development for government agencies, the planning, architecture and construction sectors and the public. Planning is a process with many differences of opinion, and when there are also differences in data and tools this problem is exacerbated.
Coupling ML and PSS
This section discusses findings for the second research question: What unique opportunities and challenges are exposed when practitioners are engaged specifically with the task of the co-design of an ML PSS?
One of the challenges that arose from this work was that the approach relied on the construction of a specific prediction task, related to the concept of formulating prediction policy problems (Kleinberg et al., 2015). The PSS environment allowed us to formulate and refine such a problem and demonstrate its operation in the prototype PSS. However, a key conclusion from participant responses was that, in order for this to be successful, a considerable amount of detail must be communicated to users regarding the assumptions and methodology involved in generating the prediction problem, and the individual future scenarios.
Another challenge was in explaining any specific predictions made by the system for a given query location. Reponses from participants indicated that more information was required on the reasons why a certain price was predicted for a particular built element at a given location in the visualised scenario. No straightforward causal interpretation of parameters in the ML model is available, for a number of reasons, unlike in the HPM (Mullainathan and Spiess, 2017). Currently, research is being conducted on statistical methods to extract meaningful parameter estimates from ML methods which exhibit high predictive performance (Athey et al., 2019). However, it is not straightforward to add this capability to the ML algorithms used in the PSSs. An alternative is to enable the use of a second ML approach to provide an interpretable explanation of predictions, as done by Ribeiro et al. (2016).
Interestingly, there were no observed, recorded or digital comments from participants that were resistant to the ML approach. The concept of integrating ML as a modelling process was generally welcomed as simply another technique that could assist in planner and developer workflows. While this indicates that the study created a positive and productive environment for undertaking complex urban analytics, we should also be more aware of ways to ensure participants are fully aware of the limitations of these methods.
One participant commented: ‘seeing [machine learning] used in this way makes me understand how it could actually be used and really helpful when integrated into decision making’. This legibility could be due to it appearing in similar forms that one would expect a geographical information system, PSS or web mapping tool, rather than as a more abstract equation or visualisation method completely foreign to these professionals. Within written comments, several participants independently used the term to describe the workshops as the ‘future of planning’. This could indeed be true, but also potentially part of a novelty effect. It is thus recommended that future research considers more deeply the strengths and weaknesses of ML in modelling and communicating future city scenarios.
Conclusion
A significant challenge currently faced across multiple domains in society is that while computational approaches such as ‘artificial intelligence’ seek to minimise and replace the role of humans in completion of tasks, we simultaneously need to strongly reconsider the role of computation to rather enhance our ability to perform tasks transparently together in the form of ‘intelligence augmentation’ (Oppermann et al., 2019). With the growing availability of big urban data, it is important to understand how data-intensive techniques such as ML can be used in a positive and comprehensible way by built environment professionals as they apply increasingly complex computational techniques to plan future cities.
The first research question investigated a physical workshop context in which this theoretical conflict would occur for planning support. A series of evaluation techniques were implemented to assist with the facilitation of the co-design process of an ML PSS. It was found that, by the final workshop, the inclusion of the evaluation method of task load and use of wireframe annotation both notably contributed to the decoding of the experiences of workshops and requirements of an ML PSS. While initial participatory analytics questions were articulated, the results of this survey instrument did not vary enough to give more information about usefulness, engagement, informative and participatory factors (regardless of them being rated as ‘high’). Improving and extending these evaluation instruments, alongside an approach for a better understanding of model and visualisation literacy among practitioner users, would be a useful contribution to similar research.
Through the second research question, the work uncovered that there are conceptual hurdles to consider between making a prediction and making a decision using ML. A high number of underlying assumptions regarding site constraints, transport scenarios and transport policies needed to be considered in order to frame a prediction problem that an ML algorithm is capable of modelling. This is a potential issue, as these approaches seek to inform future scenarios, while simultaneously seeking to be informed by them at the same time. Further, while a key desire from participants was model transparency, the ML PSS, from the researcher’s perspective, is not accessible in its entirety. While three components – data, assumptions and outputs – were presented clearly, the drivers of price predictions could not be fully deconstructed in more intuitive ways. Having these available was already a stepping stone to transparency in modelling, articulated through positive participant responses.
Techniques such as ML represent exciting additions to the analytical toolkit available for enabling and influencing decisions in the built environment. As we develop such techniques further, we must consider how to best collaborate, co-design and communicate these approaches among the many disciplines involved in city-shaping. While the investment in complex analytical tools and collaborative interfaces is not inconsiderable, it is worth also understanding whether these will have social benefits in terms of participation, greater inclusion, more utilised quantitative techniques and more efficient resource allocation. Ultimately, the marrying of such empirical and communicative approaches can and should lead to not only more informed decisions, but also to improved outcomes for delivering liveable, sustainable and productive living environments.
Supplemental Material
sj-pdf-1-epb-10.1177_2399808320939974 - Supplemental material for Towards the collaborative development of machine learning techniques in planning support systems – a Sydney example
Supplemental material, sj-pdf-1-epb-10.1177_2399808320939974 for Towards the collaborative development of machine learning techniques in planning support systems – a Sydney example by Oliver Lock, Michael Bain and Christopher Pettit in EPB: Urban Analytics and City Science
Footnotes
Acknowledgements
Special thanks to members of project teams for their valuable assistance to this and additional parts of the wider study including UNSW CoDE (Dr Hank Haeusler, Daniel Yu), UNSW Computer Science (Yuyang Shu) and UDIA NSW (Toby Adams). Additional thanks should go to the time and active attendance by participants in this study. Further, more additional thanks to primary author's (Oliver Lock) PhD supervisors (Christopher Pettit, Tomasz Bednarz and Simone Leao) for their support and contributions to the research journey underpinning this work.
Declaration of conflicting interests
The author(s) declared no potential conflicts of interest with respect to the research, authorship, and/or publication of this article.
Funding
The author(s) disclosed receipt of the following financial support for the research, authorship, and/or publication of this article: The majority of work was funded by Oliver Lock's research funding under the UNSW Scientia PhD scholar scheme. Some components of this research described were also partially funded as part of the UrbanAI project funded by FrontierSI & UDIA NSW.
Supplemental material
Supplemental material for this article is available online.
References
Supplementary Material
Please find the following supplemental material available below.
For Open Access articles published under a Creative Commons License, all supplemental material carries the same license as the article it is associated with.
For non-Open Access articles published, all supplemental material carries a non-exclusive license, and permission requests for re-use of supplemental material or any part of supplemental material shall be sent directly to the copyright owner as specified in the copyright notice associated with the article.