
Abstract
Building height is one of the most important determinants of streetscapes. According to zoning regulations in countries such as Japan, building heights are indirectly controlled by the floor area ratio (FAR). The maximum FAR and the building coverage ratio (BCR) represent the main tools of zoning regulations, which legally regulate building shapes and volumes based on plot sizes at the district scale. If plot sizes and shapes are uniform due to zoning regulations, uniform building shapes (both their plane shapes and heights) may emerge. However, in Japan, plot sizes and shapes are not only non-uniform but irregular. Furthermore, the plot is a conceptually and analytically ambiguous concept and data regarding plot shapes and building heights are unavailable. Therefore, it is difficult to understand the relationship between variations in building heights and zoning regulations. These issues prompt the following research question: How can we estimate building height distribution under zoning regulations at the district scale? To answer this question, plot shapes are objectively defined as area Voronoi cells whose generators are building polygons and road networks. Then, the following two analyses are carried out in downtown districts of the Tokyo metropolitan region. First, the relationship between plot sizes, BCR and building heights is analysed. It is found that building heights scale sub-linearly to plot sizes. Second, following this relationship, the probability density function of building heights under zoning regulations is theoretically derived as a log-normal distribution, primarily estimated from building density, road network density, average road width, BCR and FAR. This is compared with the empirical distribution of discretised building heights and the difference is investigated. Furthermore, how to harmonise variations in building heights is discussed by considering their opportunities and external costs. These findings are expected to provide urban planners with a theoretical basis for creating harmonious streetscapes.
Introduction
Building height is one of the most important determinants of streetscapes, along with building setbacks (Bertaud and Brueckner, 2005; Harvey and Aultman-Hall, 2016; Harvey et al., 2017; Marshall, 2011). In European countries, every building’s height is directly regulated through form-based codes that consider the relation to the building’s front road width and setbacks in order to create well-arranged and harmonious streetscapes (Berghauser Pont and Haupt, 2009; Marshall, 2005). This type of regulation is called direct height regulation. On the other hand, in the United States of America (USA) and Japan, building heights are primarily but indirectly controlled by the floor area ratio (FAR), defined as the ratio of the total floor area of a building to its plot size (Batty, 2018; Bertaud, 2018; Bertaud and Brueckner, 2005). This is called indirect height regulation through zoning regulations, or simply zoning regulations. Given that the total floor area of a building is the product of the building coverage area by the number of storeys, FAR depends on both the number of storeys and the coverage area of a building, which is regulated by the building coverage ratio (BCR), defined as the ratio of a building area to its plot area (Schläpfer et al., 2015). The maximum FAR and BCR are the main tools of zoning regulations at the district scale, which legally regulate each building’s shape and volume based on plot size. Hereafter, the maximum FAR and BCR will be termed the legal FAR and BCR, respectively. Zoning regulations were originally developed to avoid nuisances as a result of mixed land uses in the USA. As road networks in the USA tend to be grid patterns and plot sizes and shapes tend to be uniform, uniform building shapes (both their plane shapes and heights) tend to emerge under the zoning regulations. However, because in Japan plot sizes and shapes are not only non-uniform but irregular, building shapes also tend to be non-uniform and irregular. Therefore, it is difficult to create well-arranged and harmonious streetscapes. In addition, the plot is a conceptually and analytically ambiguous concept, and precise data regarding plot shapes are generally unavailable (Fleischmann et al., 2020; Usui, 2019; Usui and Asami, 2020). Although more and more data regarding building geometries are now becoming available, precise data regarding building heights are generally unavailable. In the literature, building heights are measured as the number of building storeys (Arribas-Bel et al., 2019; Li et al., 2020). As a result, it is difficult to understand the relationship between variations in building heights and zoning regulations.
A building height under zoning regulations can be approximately computed by the product of the constant floor height and the ratio of the FAR to the BCR in a plot. This ratio approximates the number of storeys of a building. As the alternative of precise building heights, a building height is defined as the product (Li et al., 2020). In theory, if building owners choose the legal FAR and BCR, building heights will be almost identical because floor height tends to remain constant (around 3 m). In practice, building owners essentially want to choose the legal FAR in order to obtain as large a floor area as possible. This is because the larger the floor area, the greater the building owner’s utility and floor rent revenue. However, building owners do not always choose the legal BCR and FAR (Asami and Ohtaki, 2000; Ohba, 1995), because they desire not only a large building coverage area and floor area, but also open space that can be used as a back or front yard within their plots. Furthermore, according to the Building Standard Law of Japan (Japanese building codes), building owners can legally obtain additional FAR at the expense of providing part of their own plot as open space. According to the literature, the larger the plot size, the greater the area ratio of open space in a plot tends to increase (Asami and Ohtaki, 2000; Kawamura, 2010; Ohba, 1995). Moreover, the actual use of the FAR is defined as the ratio of the actual FAR to the legal FAR regarding either each district or each plot (Lee et al., 1997; Ohba, 1995). At the ward scale, the actual use of the FAR is approximately 0.5 (Tokyo Metropolitan Government, 2017). At the district scale, the actual use of the FAR ranges from 0.3 (where the legal FAR ranges from 300% to 500%) to 0.5 (where the legal FAR is 100%) of the legal FAR. This is because: (1) the actual FAR of a building is reduced if its front road width is narrow or a height restriction is imposed (this is explained in detail in the ‘Comparison of theoretical and empirical distribution of building heights’ Section) and (2) as the legal FAR is increased to utilise a plot more effectively, the present buildings built prior to the increase in the legal FAR may not utilise the full legal FAR. The greater the legal FAR, the greater the actual FAR tends to be (Lee et al., 1997). At the plot scale, the average actual use of the FAR is 0.65 and the standard deviation is 0.25. Furthermore, the actual use of the FAR depends on land use zones. On average, the actual use of the FAR in residential zones tends to be higher than in commercial and office zones, for instance (Ohba, 1995). Hence, the actual FAR can be regarded as uniform in the same district by multiplying the legal FAR with the actual use of the FAR. Therefore, the height of a building can be regarded as the result of the building owner’s choice of BCR by considering the plot size and the owner’s preference for the area of open space. This means that unless neither building heights nor setbacks are directly regulated, both will exhibit a statistical distribution at the district scale.
The practical motivation behind this article is to provide a framework for harmonising the building heights of a district under zoning regulations by taking into account the relationship between the variation in building heights and zoning regulations (legal BCR and FAR). Therefore, the objective of this article is to explicitly investigate the relationship between the variation in building heights and the BCR, which depends on plot sizes. According to the literature, at the district scale, plot sizes approximately follow a log-normal distribution, which is theoretically derived based on Gibrat’s law. The parameters of the log-normal distribution can be estimated primarily from gross building density (the number of buildings per unit area) and road network density (total length of road networks per unit area) (Usui and Asami, 2020). Thus, the variation in both plot sizes and BCR prevents us from understanding the variation in building heights under zoning regulations. As mentioned above, precise data regarding building heights and plot shapes are unavailable. Hence, it may be useful to estimate the statistical distribution of building heights from indices regarding building density, road network density and zoning regulations. These are the substantive motivations behind the following research question: How can we estimate building height distribution under zoning regulations at the district scale? To answer this question, plot shapes are objectively defined based on area Voronoi cells whose generators are building polygons and road networks for overcoming data limitations regarding plot shapes. Then, the following two analyses are carried out in downtown districts of the Tokyo metropolitan region. First, the allometric relationship between plot sizes, BCR and building heights is analysed. Second, the probability density function of building heights under the zoning regulations is theoretically derived and analysed.
In the literature, building height statistics have been investigated in terms of scaling and allometry. It has been observed that: (1) the average building height in North American cities can be modelled by a power-law function of their population sizes, where its scaling exponent is 0.34; and (2) the histograms of logarithmic building height values indicate a heavy-tailed distribution (Schläpfer et al., 2015). Furthermore, the size distributions of buildings in terms of their Euclidean footprint (e.g. area, perimeter, height) have been examined. It has been shown that the frequency distribution of all building heights in Greater London (approximately three million) is highly skewed to the left, reflecting the fact that this distribution is likely to follow a power law. Plot area is likely to scale as the square of height and perimeter, while perimeter and height scale probably scale with each other linearly. As for top building heights in Tokyo, there is clear evidence of log-normality at their upper end (Batty et al., 2008). Moreover, a model has been developed to determine the optimal building height that maximises a developer’s profit (revenue minus cost). Nevertheless, the relationship between building height and building coverage area has yet to be investigated, although these always interact (Chau et al., 2007). In addition, the probability density function of building height at the district scale has yet to be derived theoretically. As streetscape skeletons – the dimensions and arrangement of buildings – range widely at the district scale, understanding the relationship between variations in building heights and BCR (which depends on plot sizes) is important when developing urban design policies such as form-based codes, often involving goals and standards based on the built environmental context (Harvey et al., 2017). The findings of this article are expected not only to provide urban planners with a theoretical basis for discussing the relationship between variations in building heights and zoning regulations (BCR and FAR), building density, road network density and average road width, but also to create harmonious streetscapes under zoning regulations.
This paper is organised as follows. In the ‘Assumption and data processing regarding plots in empirical study areas’ Section, data processing regarding plots and some assumptions for deriving the probability density function of building heights are explained. In the ‘Allometric relationship between plot sizes and building heights’ Section, the allometric relationship between plot sizes, BCR and building heights is investigated. In the ‘Theoretical derivation of probability density function of building heights’ Section, the probability density function of building heights is theoretically derived. This is compared with the empirical distribution of building heights at the district scale in the ‘Comparison of theoretical and empirical distribution of building heights’ Section. In the ‘Discussion and concluding remarks’ Section, based on this comparison, how to harmonise variations in building heights is discussed and concluding remarks are mentioned.
Assumption and data processing regarding plots in empirical study areas
Assumption and data processing
In this paper, the probability density function of building heights is derived theoretically with the following assumptions: (A1) each building uses up the legal FAR; (A2) its actual BCR follows an allometric relation with its plot size; and (A3) one plot has one building. The rationale for (A3) is justified as follows. According to Japanese building codes, in order to appropriately regulate the size and the shape of a building by the BCR and the FAR in its lot, a plot basically has no more than one building, which is called the rule of one plot for one building. Thus, the number of buildings is equal to that of plots, n. This rule enables us not only to investigate the relationship between building height distribution and density indices, but also to overcome data limitations regarding plot shapes.
In the literature, it has been proposed that data regarding the shape of area Voronoi cells – whose generators are building polygons – overcome not only the potential lack of data availability regarding plot shapes, but also potential spatial coverage problems between buildings and plot layers (Fleischmann et al., 2020; Hamaina et al., 2014; Usui, 2019; Usui and Asami, 2020). Although these are the advantages of substituting area Voronoi cells for a set of data regarding actual plot shapes, the following limitation should be taken into consideration: the sizes of area Voronoi cells whose generators are building polygons tend to be more averaged than those of actual lots. In particular, this tendency is pronounced where building polygons are sparsely distributed. Apparently, adopting area Voronoi diagrams seems to result in indirect or uncertain plot sizes. However, the area Voronoi-based method is not only a consistent and replicable method but also an efficient informational proxy for cadastral plots based on an empirical case study in Zurich (Fleischmann et al., 2020). Therefore, adopting the area Voronoi-based method for defining plot shapes is rational considering data limitations and ambiguities regarding plots.
In this paper, to substitute for the set of data regarding the shape of actual plots in a district, I focus on the set of data on the shape of area Voronoi cells {V(B
i
)}, whose generators are building polygons, {B
i
}, and the centre line of road networks, R, in a district (Usui and Asami, 2020). Area Voronoi diagrams represent the extension of ordinary Voronoi diagrams, whose generators are the set of points (Okabe et al., 2000). As illustrated in Figure S1 (see online supplemental materials), the generators of area Voronoi diagrams are the set of polylines or polygons that respectively correspond to the centre line of road networks, R, and the edges of building polygons. As substitutes for the set of shapes of actual plots, I use the intersection of {V(B
i
)} and urban blocks, denoted by T
i
. Hereafter, T
i
will be called the plot of B
i
. For any B
i
, the BCR of B
i
, denoted by
Empirical study areas
This empirical study of an actual urban area is focused on a downtown ward of the Tokyo metropolitan eastern region, Sumida ward. Since the second half of the 20th century, the Tokyo metropolitan region has experienced a steady diminution in plot sizes with the continuing subdivision of plots in order to meet significant demand for housing. As a result of this process, plots with small sizes, narrow frontages and great depths are generated with insufficient road network density, especially in the northern districts of Sumida ward (Usui and Asami, 2020). In order to improve the residential environment, redevelopment projects are ongoing in Tokyo downtown districts that may drastically change plot sizes and shapes. Whereas the northern districts of Sumida ward display irregular patterns of plots as a result of unplanned urbanisation, the southern districts demonstrate a regular pattern as a result of land readjustment projects implemented after World War II. The plot patterns of the former and latter contrast with one another. From the northern and southern districts, 20 districts are selected for the empirical case study at the district scale (see Table S1 in the online supplemental materials).
Figure 1 shows the relative frequency distribution of building heights and the spatial distribution of building heights in Sumida ward. Low-rise buildings (ranging from one to three storeys), mid-rise buildings (ranging from four to five) and high-rise buildings are depicted in blue, yellow and red, respectively. As precise data regarding each building’s height are unavailable, this will be computed by the product of the constant floor height (3 m) by the building storey. Thus, although actual building height is a positive real number, building height computed in this manner is a positive integer. It is found that: (1) the relative frequency distribution of building heights is a unimodal distribution; (2) in the northern districts, low-rise buildings tend to be pronounced; and (3) in the southern districts, low-, mid- and high-rise buildings tend to be mixed. Figure S2 shows the legal BCR and FAR in Tokyo metropolitan region (see online supplemental materials). In Sumida ward, the legal BCR is either 60% or 80%, while the legal FAR ranges from 200% to 700%. The typical maximum FAR is either 200% (in the northern districts) or 300% (in the southern districts).
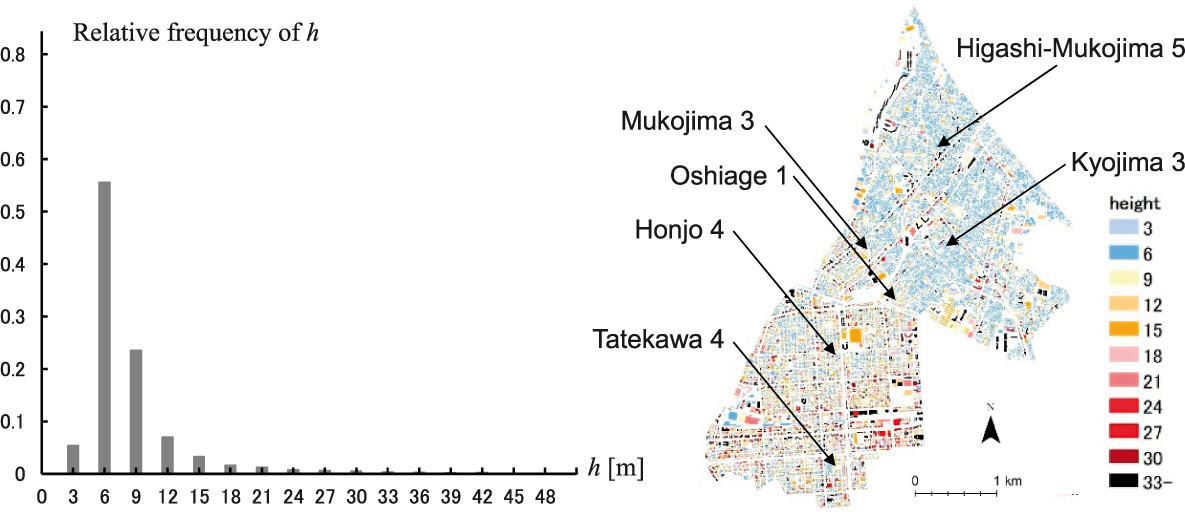
Building height distribution in Sumida ward.
Allometric relationship between plot sizes and building heights
As mentioned in the introduction, the larger the plot size, the smaller the BCR tends to be. In this section, this tendency will be investigated by focusing on the allometric relationship between plot sizes and their building coverage areas


The estimation of β, denoted by
By dividing both sides of equation (1) by s, the BCR of each plot can be estimated

Figure S4 (left) shows the relationship between the sizes and the BCR of the plots (see online supplemental materials). It can be observed that: (1) as the plot size increases, the BCR tends to decrease; and (2) its decreasing speed tends to reduce as the plot size increases. Therefore, the following two properties regarding variations in BCR need to be taken into consideration: (1) as the plot size increases, the estimated BCR,
Essentially, plot owners tend to choose the FAR of their buildings as the maximum allowed by the zoning regulations. Although as Figure S4 (left) shows, the choice of BCR tends to vary as the plot size increases, the number of storeys of a building, denoted by m, is estimated from the ratio of the legal FAR to the estimated BCR from equation (3)

where

If the actual BCR decreases by 0.1, the building height increases by approximately 0.11, which is equivalent to the actual FAR increasing by 0.11. Figure S5 shows the relationship between plot size and building height (see online supplemental materials). It can be observed that: (1) as the plot size increases,
Theoretical derivation of probability density function of building heights
As mentioned in the ‘Allometric relationship between plot sizes and building heights’ section, the variation in building heights depends on the variation in plot sizes. In the literature, the size distribution of plots has been theoretically derived as a log-normal distribution based on Gibrat’s law (Usui and Asami, 2020)

In order to derive the probability density function of building heights, we focus on equations (5) and (6). Since building heights sub-linearly scale to plot sizes (given in equation (5)), by applying stochastic variable transformation to equation (6), the probability density function of building heights can also be derived as a log-normal distribution. Stated more rigorously, as shown in Figure S5 and equation (5), the building height estimator,

By solving equation (5) in terms of s, we can obtain the following equation
Hence, from equations (6), (11) and (12), the probability density function of h can be derived as follows
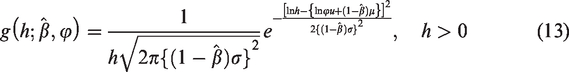
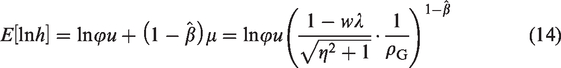

Thus,
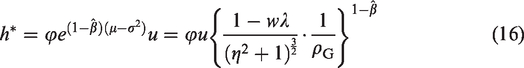
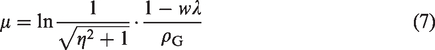
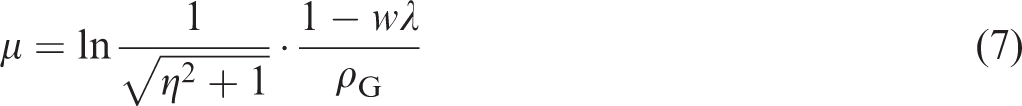
Equation (16) enables us to investigate the relationship between h* and the following indices that characterise urban form: building density, road network density, average road width, scaling exponent, constant floor height and legal FAR given by zoning regulations.
Figure S6 shows the probability density function of building heights where the values of
In summary, zoning regulations cannot avoid leading to variations in building heights. This represents a limitation of zoning regulations that indirectly regulate the shape of buildings. When discussing building heights under zoning regulations, the variation in plot sizes and the actual BCR of each plot should be considered as well as the legal FAR. In this respect, the mode of building height, h*, can be regarded as the benchmark for harmonising streetscapes because h* reflects a typical building height of a district. Although variations in building heights and h* depend not only on
Comparison of theoretical and empirical distribution of building heights
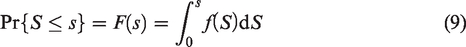
In this section, empirical building height distributions in the 20 districts of Sumida ward are compared with
Figures 2 and S7 show the relative frequency distribution of building heights (drawn as histograms), the empirically fitted log-normal distribution – which is directly estimated from a data set of building heights computed in this manner (drawn as solid lines) – and the probability density function of building heights estimated from equation (13) in 6 of the 20 districts of Sumida ward (shown in Figure 1 and Table S1). It is found that: (1) the relative frequency distribution of building heights is a unimodal distribution and (2) discretised building heights tend to follow a log-normal distribution not only in the 6 districts, but in the other 14 districts too. Bold solid lines and broken lines represent the probability density functions of building heights if
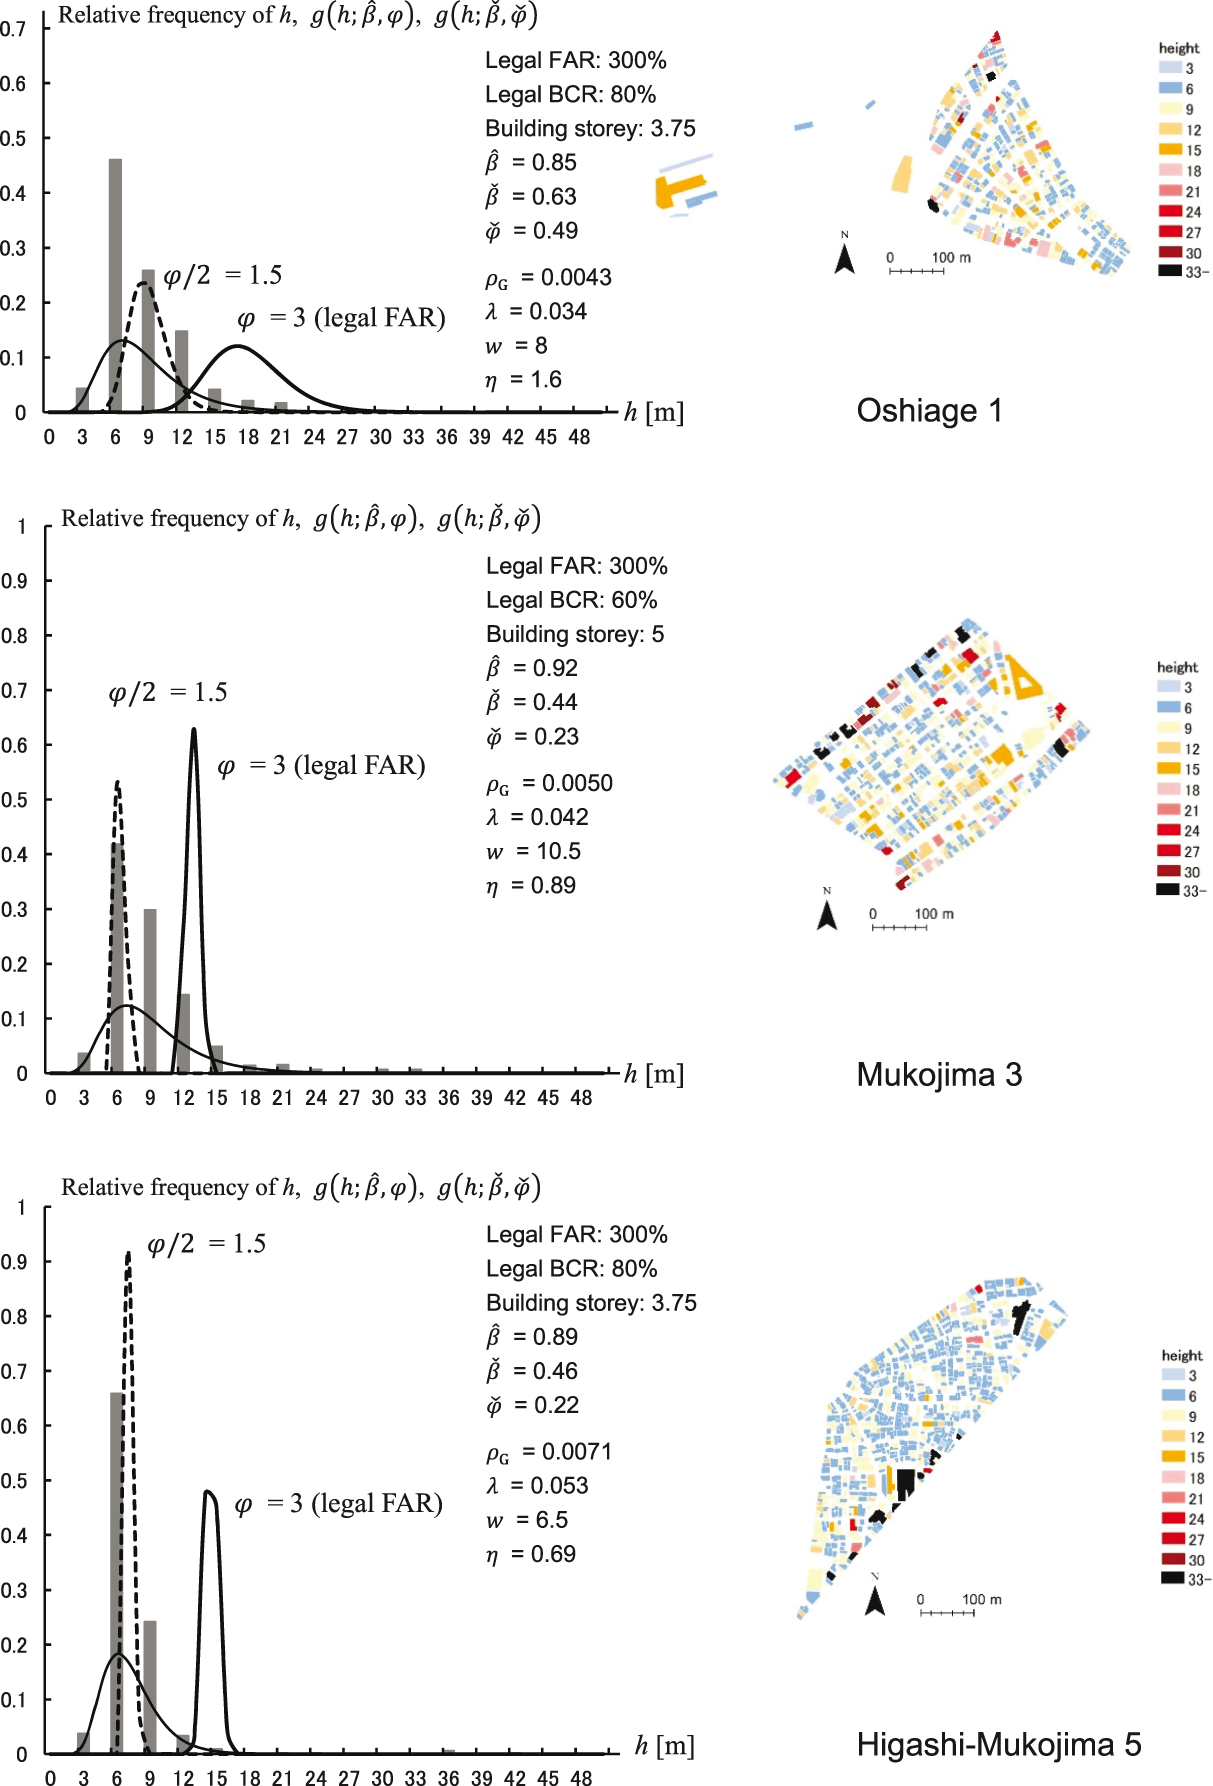
Relative frequency distribution of building heights in districts of Sumida ward. Solid lines represent empirically fitted log-normal distribution which is the same as
First, if the front road width of a building is narrower than 12 m, the maximum legal FAR of a building must be the product of 0.6 by its front road width (e.g. if the front road width of a building is 6 m, then the maximum legal FAR is 3.6 (360%)). Given that the legal BCR ranges from 60% to 80%, building heights in theory range from 14 to 18 m. Second, the front road width directly regulates building height. Each building must be within the diagonal line whose origin is on the other side of the road perimeter and its tangent is either 1.25 or 1.5. If the front road width and the tangent are 6 m and 1.5, respectively, the building height on the road perimeter must be less than 9 m. Thus, the latter way regulates building heights more strictly than the former. These two additional regulations mean that the actual use of the FAR in the neighbourhood will be 0.5.
Although the actual use of the FAR is considered,
Compared with the relative frequency distribution of building heights, it is obvious that
Finally, there are several limitations. First, as mentioned above, because precise data regarding building heights are unavailable, approximation values (discretised building height) have been adopted. However, precise data regarding building geometries are now becoming available worldwide through remote sensing technologies. Thus, this increasing data availability may help to obtain precise data regarding building heights. Second, as si tends to be more averaged than that of the actual plot of B
i
,
Discussion and concluding remarks
How to harmonise the variation in building heights?
In order to create harmonious streetscapes, it is important that they are defined quantitatively. This is because under zoning regulations, variations are inevitable. Although direct height regulations can be legally imposed, it is difficult to achieve consensus among a district’s building owners regarding the criterion for building height. Another method by which to harmonise building heights is to offer building owners incentives to do so. In this paper, the smaller the variations in building heights, the more harmonious is the building heights in a district.
Variations in building heights reflect not only inharmonious streetscapes but also the freedom of each building design within a plot under zoning regulations in a district. In particular, the smaller the value of
In this case, each building owner must work out how to deal with the difference between each building height, hi, and hc, denoted by |hi
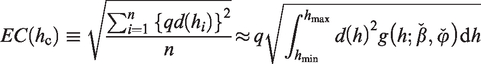
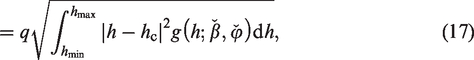
where q, hmax and hmin denote the monetary values of the cost per unit length of the building form’s external diseconomies regarding building height in a district [yen/m], the maximum and minimum building height in a district, respectively. In order to impose the greater marginal external cost on a building owner with greater d(hi), the marginal external cost is defined as {qd(hi)}2. In the integral part of equation (17), because
On the other hand, building owners can gain additional revenue regarding floor areas at the expense of harmonious building heights. Using equation (12), the floor area of a building of height, h, can be computed by s(h)[h/u], where [h/u] = m if m ≤ h/u < m + 1. Hence, the potential additional floor area in a district if hc is not set is formulated as
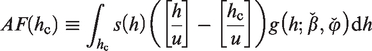
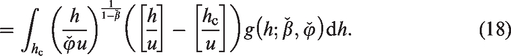
Thus, pAF(hc) is the rigorous definition of additional total revenue regarding floor areas at the expense of harmonious building heights, where p denotes the monetary value of the revenue per unit area [yen/m2]. pAF(hc) can be regarded as the opportunity cost of total floor areas where h > hc if hc is not set, OC(hc) = pAF(hc). Thus, building owners in a district want to minimise the summation of EC(hc) and OC(hc) in terms of hc

Consequently, hc* can be obtained as the optimal solution that minimises TC(hc).
Figure S9 shows the EC(hc), OC(hc) and TC(hc) as the function of hc, respectively in Higashi-Mukojima 5 (drawn by solid line, broken line and bold solid line, respectively). It is found that, (1) as q increases, hc* decreases from 18 m (q = 2,000 [yen/m]) to 9 m (q = 50,000 [yen/m]); and (2) irrespective of the value of q, EC(hc) is minimised at approximately 8 m. If TC(hc) > TC(hc*), building owners are incentivised to adjust hi to hc*. In theory, once p and q are given as monetary values, a building form’s external diseconomies regarding building height can be internalised and the variation in building heights can be harmonised through market mechanisms. However, in practice, it is difficult to ascertain the monetary values of p and q. Hence, the average rent per unit area in Higashi-Mukojima 5 (2000 [yen/m2]) is adopted as the value of p. The value of q is either 2,000, 10,000 or 50,000 [yen/m]. In fact, the monetary values of p and q depend on each district’s land use. In office and commercial zones, demand for floor areas is high, resulting in high values of p. However, in residential and historical zones, demand for floor areas is lower, resulting in low values of p. By contrast, q in these zones is higher than in office and commercial zones. This discussion is left to future research work.
Concluding remarks and future works
In this paper, the relationship between plot sizes, BCR and building heights has been analysed. It is found that building heights scale sub-linearly to plot sizes. Following this relationship, the probability density function of building heights under zoning regulations has been theoretically derived as a log-normal distribution which can be estimated primarily from the following indices that characterise urban form: building density, road network density, average road width, scaling exponent, constant floor height and the legal FAR given by zoning regulations. Although precise data regarding building heights are unavailable, the probability density functions can contribute to understanding the relationship between the aforementioned indices regarding urban form and the variation in building heights. In theory, if each building uses up the legal FAR and its actual BCR follows an allometric relation with its plot size, building height distribution is much narrower under zoning regulations. However, in practice, the variation in the BCR around the estimator makes the variation in building heights greater. This indicates the importance of setting the lower boundary regarding the BCR in order to create harmonious building heights.
Several points can be suggested for future research. First, precise data regarding building geometries are now becoming available worldwide through remote sensing technologies. This increasing data availability may help not only to obtain precise data regarding building heights without computing the product of the constant floor height (3 m) by the building storey but also to investigate the difference between observed and theoretical building height distributions. Second, although the rule of one plot for one building enables us to overcome the lack of data regarding plot shapes, there are many forms of development where this rule does not apply. Thus, if data regarding actual plot shapes are obtainable in the future, the validity of assuming this rule needs to be confirmed. Third, how to create harmonious streetscapes under zoning regulations without introducing a direct regulation of building heights should be discussed in greater detail. Although strategies to harmonise variations in building heights have been proposed considering the opportunities and external costs of tall buildings in a district, further analyses and discussion are required in order to implement them. In particular, building setbacks represent the other major determinant of streetscapes along with building height.
Supplemental Material
sj-pdf-1-epb-10.1177_2399808320977867 - Supplemental material for Building height distribution under zoning regulations: Theoretical derivation based on allometric scaling analysis and application to harmonise building heights
Supplemental material, sj-pdf-1-epb-10.1177_2399808320977867 for Building height distribution under zoning regulations: Theoretical derivation based on allometric scaling analysis and application to harmonise building heights by Hiroyuki Usui in EPB: Urban Analytics and City Science
Footnotes
Acknowledgements
The author is grateful to Professor Yasushi Asami and two anonymous referees for their extremely valuable comments and suggestions and the Tokyo Metropolitan Government for providing Tokyo metropolitan government city planning GIS data. This research was the result of the joint research with CSIS, the University of Tokyo (No. 785) and used the following data: Residential Maps provided by Zenrin, CO., Ltd.
Declaration of conflicting interests
The author(s) declared no potential conflicts of interest with respect to the research, authorship, and/or publication of this article.
Funding
The author(s) disclosed receipt of the following financial support for the research, authorship, and/or publication of this article: This work was supported by KAJIMA FOUNDATION and Japan Society for the Promotion of Science (16H01830 and 17K12978).
Supplemental material
Supplemental material for this article is available online.
Biographical note
References
Supplementary Material
Please find the following supplemental material available below.
For Open Access articles published under a Creative Commons License, all supplemental material carries the same license as the article it is associated with.
For non-Open Access articles published, all supplemental material carries a non-exclusive license, and permission requests for re-use of supplemental material or any part of supplemental material shall be sent directly to the copyright owner as specified in the copyright notice associated with the article.