
Abstract
The public transport system is considered as one of the most important subsystems in metropolises for achieving sustainability objectives by mediating resources and travel demand. Representing the various urban transport networks is crucial in understanding travel behavior and the function of the transport system. However, previous studies have ignored the coupling relationships between multi-mode transport networks and travel flows. To address this problem, we constructed a multilayer network to illustrate two modes of transport (bus and metro) by assigning weights of travel flow and efficiency. We explored the scaling of the public transport system to validate the multilayer network and offered new visions for transportation improvements by considering population. The proposed methodology was demonstrated by using public transport datasets of Shanghai, China. For both the bus network and multilayer network, the scaling of node degree versus Population were explored at 1 km * 1 km urban cells. The results suggested that in the multilayer network, the scaling relations between node degree and population can provide valuable insights into quantifying the integration between the public transport system and urban land use, which will benefit sustainable improvements to cities.
Introduction
With rapid economic and societal development, the public transport system, which comprises integrated multi-mode transport networks (e.g., buses, metro, and tram), has experienced overwhelming growth. (Ding et al., 2019; Li et al., 2019; Wang & Zhou, 2017). In metropolises, several modes of the public transport network (PTN) work together to supply the travel demands of residents (Miller et al., 2016; Rodríguez-Núñez & García-Palomares, 2014). Recently, the PTN has mainly been studied through multilayer networks to understand the structure and properties of the public transport system (Aleta et al., 2017; Zheng et al., 2018). As closer to real situations than the single-layer network, multilayer networks are valuable representations of PTN for understanding how the public transport system shapes urban land use and vice versa affects its operation (Du et al., 2016; Strano et al., 2015).
The multiplex network is a useful model in which the same set of nodes may be connected by different types of relationships. For example, Kurant and Thiran (2006) first applied a two-layer framework to facilitate the illustration and analysis of multilayer networks. Furthermore, the cooperation strength of different layers, network accessibility, ratio of speeds of network modes, and behavior of different layers were explored to illuminate the coupling relationships in multilayer transport networks (Gallotti et al., 2016; Zheng et al., 2018). These efforts typically focused on exploring the construction and application of the multilayer network. However, the weights of previous PTN representation methods generally come from simulated travel demands, ignoring the weights of real passenger flow, which can hardly represent the actual transport efficiency or capacity.
The rapid growth of the population and activity intensity in megacities have propelled an evolutional shift in urban mobility from individual-centric travel to sustainable urban mobility. Although previous studies have provided valuable insights into transport network properties, it is still challenging to combine different transport datasets into a unified framework and quantify the relation between the public transport system and urban form. To mimic a realistic scenario, we constructed a multilayer network to illustrate the multi-mode transport networks by assigning weights of travel flow (average daily ridership of stations) and efficiency (travel time between two stations). The main contributions of this study were summarized as follows: (1) We modeled the multi-mode public transport networks by assigning weights considering two factors (passenger ridership and travel time), where the topological properties can reproduce real-world traffic facts more realistically. (2) This study presented an exploratory analysis into the scaling relations between node degree and population, and offered an important implication for evaluating whether PTN could satisfy travel demand well. The results provided useful information on the coupling relationships between the public transport system and urban land use.
The subsequent sections of this paper are organized as follows: Literature review provides a literature review. Methodology describes our proposed methodology, followed by a case study in case study. Finally, we briefly conclude in conclusions with some limitations and future research directions.
Literature review
In the last decade, the public transport network (PTN) has been extensively studied through complex network theory to understand aspects of urban land use and their dynamic evolution (Barthélemy, 2011). PTN is a fundamental infrastructure network and provides various modes that satisfy the travel demands of the population. Therefore, the studies of PTN have significant implications for sustainable urban planning and interested researchers who have recognized the significance of the public transport system for structuring cities. For example, by analyzing public transport systems in 22 Polish cities with network sizes varying from 152 to 2881, Sienkiewicz and Holyst (2005) found that these networks exhibited small-world behavior and were hierarchically organized. Their work was considered as one of the earliest and comprehensive studies on the PTN using complex network theory. Zhang et al. (2015) further investigated the role of network topological properties in a PTN and provided insights into which properties perform best by giving potential network-development goals. However, previous studies focused on network models considering a single-layer network, which might yield a biased understanding of the actual multi-mode transport networks. Therefore, there is a need for a more compact representation network model considering the connections among multi-mode transport networks (Shanmukhappa et al., 2018).
Multilayer networks offer a feasible solution to this issue and provide valuable insights into how interconnected transport networks shape cities and satisfy travel demand. Kivelä et al. (2014) discussed the history of multilayer networks and presented a detailed review by introducing a general framework for multilayer network analysis. They attempted to generalize single-layer network diagnostics to multilayer networks and provided a thorough discussion about the rapidly expanding research on multilayer network models, including interconnecting networks, tensor decompositions, community structure, and dynamic processes. Compared with the single-layer network, Zanin (2015) demonstrated that the multilayer network might yield a comprehensive understanding of the actual network. Moreover, Aleta et al. (2017) presented a multilayer network model to study the interconnected structures of 9 European cities. To explore the inter-connections between different layers, Buldyrev et al. (2010) developed a framework to assess the robustness/vulnerability of layered networks against random failures. In summary, although previous studies have investigated the public transport system through the multilayer network model, most of them neglected the travel flow of passengers and hardly quantified the importance of a transportation mode for the mobility in the system (Karimi et al., 2019). It is crucial to consider the full, multimodal aspects of the public transport system, which will benefit the understanding of urban form (Ding, 2019; Ma et al., 2019). Moreover, empirical data that validates the topological properties of the multilayer network is still lacking. Therefore, empirical studies on the coupling of the public transport system and travel demand using the multilayer network are crucial and timely.
Previous studies suggest that the multilayer network view of the public transport system should be integrated into an elaborated model, by addressing the problem that different transport modes are often treated separately (Aldous & Barthelemy, 2019; Zheng et al., 2018). Inspired by these discoveries, this study proposed a versatile and quantitative model that integrated multimode transport networks using the multilayer network. The scaling of public transport system was explored to validate the weighted multilayer network and offered new visions for PTN improvements by considering population size.
Methodology
This section describes the proposed methodology in detail and gives the definitions for the entire paper to avoid possible confusion. In weighted multilayer network, we illustrate and construct the multilayer network by assigning weights of travel flow (average daily ridership of stations) and efficiency (travel time between two stations). Subsequently, we introduce the urban scaling laws, which is used to validate the multilayer network in urban scaling law. The research framework consists of three main stages: (1) Modeling multi-mode transport networks: From the perspective of complex network theory, this study constructed the multilayer network from two-mode transport networks (bus and metro) by assigning weights to edges. (2) Analysis of network metrics: Five network metrics of the multilayer network were analyzed compared to the bus network. In particular, the weighted degree, weighted BC, and weighted clustering coefficient in the multilayer network are discussed and compared. (3) Analyzing the scaling of the public transport system: To better understand the interplay between urban land use, the scaling relations of degree/weighted degree vs. population for the multilayer network and the bus network were computed and analyzed.
Weighted multilayer network
This study used the multilayer network to represent each mode of transport (bus and metro) (Gallotti & Barthelemy, 2015). Each layer of the multilayer network can be represented by a set of nodes V and edges E, where a node represents a transport station, and an edge represents the line between two adjacent stations, using L-Space model in complex network theory (Shanmukhappa et al., 2018). Moreover, a node n in metro layer can be connected to any node v in bus layer.
In the single-layer network (e.g., bus network), the adjacencies are defined by an edge set E. For each edge in the multilayer network, we need to specify the starting node layer and ending node layer, which can be defined as an edge set E
M
(a collection of pairs of potential combinations of nodes and elementary layers). Let G
b
= {V, E
b
} and G
m
= {V, E
m
}, where G
b
represents the bus network, G
m
represents the bus network. V = {1, 2, …, N} is the set of nodes and E
b
, E
m
⊆ V×V are two sets of edges between nodes. Therefore, G
b
and G
m
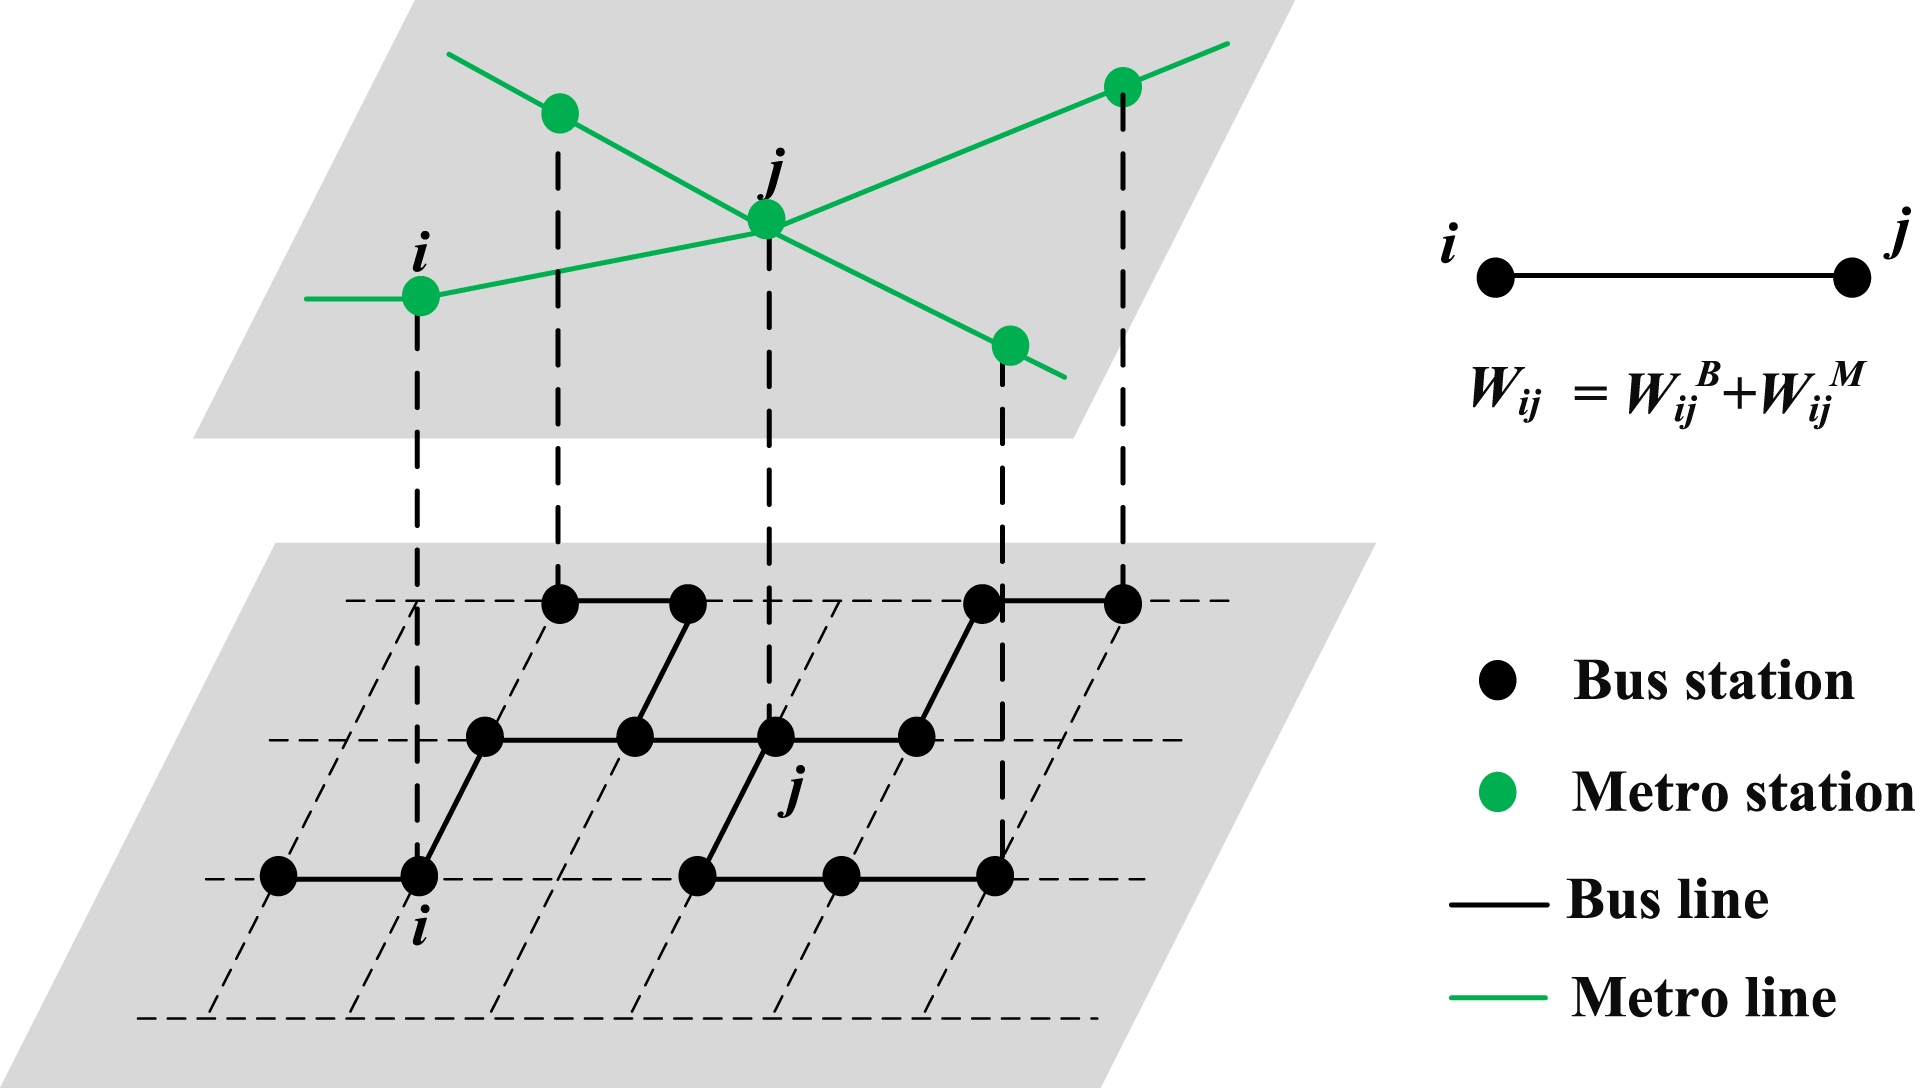
constitute the multilayer network G (Figure 1), which can be modeled by using the concept of tensor (Kivelä et al., 2014), and Scaling of bus stops versus population at different spatial scales showing sub-linear scaling. (a) eight county-level administrative regions in the central city. The line (blue dots) shows the best-fit to a scaling relation Y(N)=Y
o
N
β
, with β = 0.908 [95% confidence interval, R
2
= 0.864]. (b) 1 km * 1 km cells in Pudong. The line (blue dots) describes best-fit to data, with β = 0.793 [95% confidence interval, R
2
= 0.960]. The scaling of bus stops versus population has confirmed sub-linear scaling of urban infrastructure. An example of the multilayer network. The figure represents two transport modes considered: metro (green nodes and lines, upper layer) and bus (black nodes and lines, bottom layer). Wij is the weight factor. See edge weight definition. For the calculation of Wij.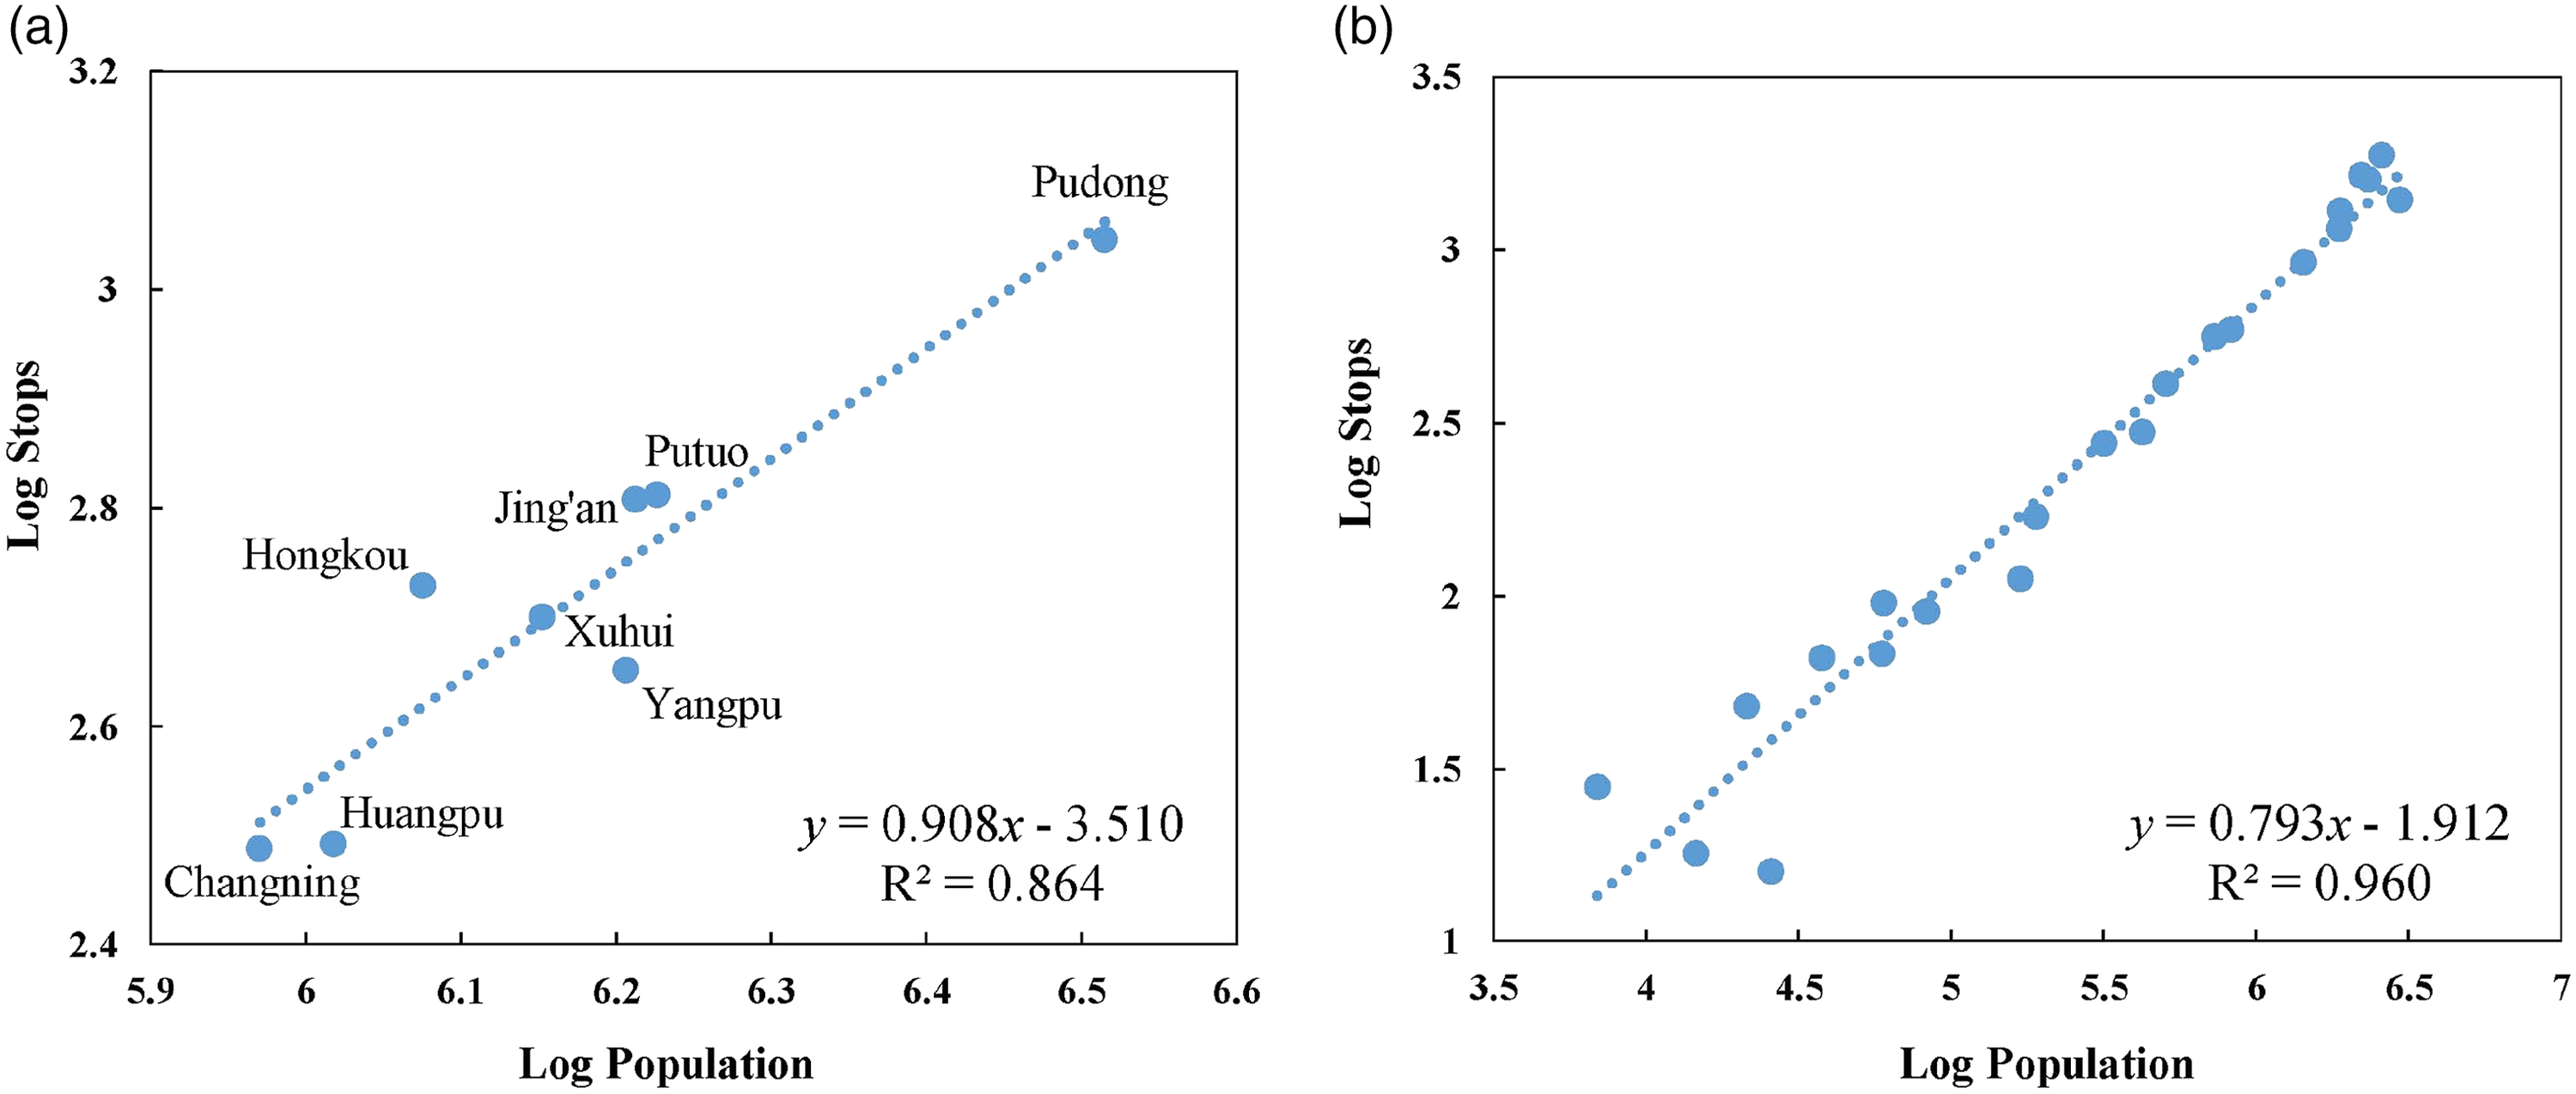

Edge weight definition
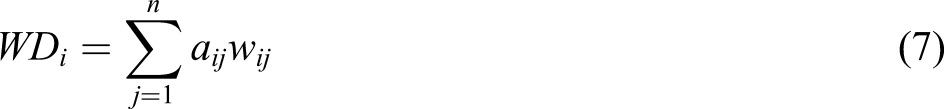
Setting link weights needs us to concentrate mainly on two levels here: topological structure and functional characteristics. We construct the multilayer network, instead of using simple definitions in single-layer complex networks traditionally. Since the multilayer network can better reflect its role in the public transport system, we mainly consider two factors, namely passenger ridership and travel time, which can best reflect the travel flow and efficiency of the bus/metro lines (Xu et al., 2020). Assign the passenger flow and travel time weight WD
i,
j
to the edge between node i and node j


The multilayer network aims to establish the connection between the bus network and the metro network, while retaining the passenger flow characteristics of different networks. In this study, the multilayer network is constructed by assigning travel flow and efficiency weights, and its topological properties will be analyzed in the next section.
Network metrics
To quantify the features of the multilayer network, this study uses five representative metrics: weighted degree, weighted Betweenness Centrality (BC), weighted clustering coefficient, network diameter, and average path length. Three of them are natural extensions of the methods originally for the unweighted network. (1) Weighted degree
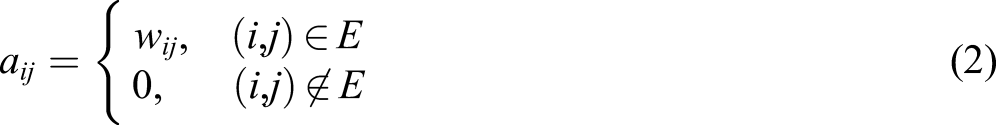
In the unweighted network, the degree of a node i is defined as the number of edges incident to node i
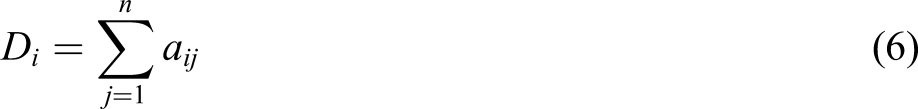
The degree of the node incorporates information about both its connectivity and the significance of its connections. Subsequently, in a weighted network, the weighted degree of node i (sometimes referred to as node strength) is defined as (2) Weighted Betweenness Centrality
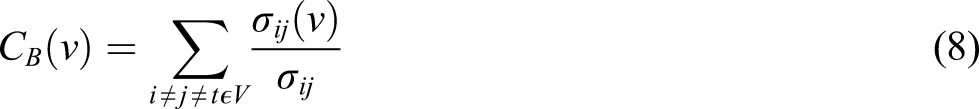
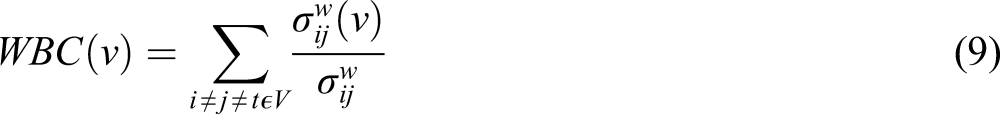
The Betweenness centrality (BC) is a prominent network metric expressing importance of a node and measures the degree to which a node is located on the shortest path of any other node pairs. In the transport network, stations with high BC are considered key locations in their ability to control the passenger flow. The equation of BC is shown as follows (3) Weighted clustering coefficient
The clustering coefficient refers to the intensity of connections between a node and its neighbors. The tighter the edge relationship, the higher the clustering coefficient. Its calculation can be represented as follows


The weighted clustering coefficient can reflect the density of bus/metro lines. The larger weighted clustering coefficient indicates that the bus/metro lines in the public transport system are closely linked. (4) Network diameter
Network diameter refers to the maximum distance between any two nodes in the network, it can be expressed as (5) Average path length

The average path length is another essential feature metric in the network, which is the average shortest distance between all pairs of nodes in the network. The distance between nodes refers to the minimum number of edges to be experienced from a node, and the maximum distance between all nodes is called the diameter of the network
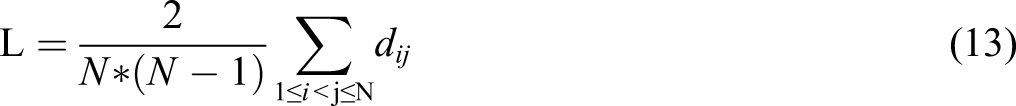
The average path length and diameter measure the transmission performance and efficiency of the network. From the view of the topological characteristics, a small average path length of the multilayer network means that passengers take the bus/metro to the destination, requiring less transfer.
Urban scaling law
The urban scaling law has been a hot research topic for researchers interested in modern urbanism of how city growth affects the environment and society (Altaweel & Palmisano, 2019; Bettencourt et al., 2007; Lemoy & Caruso, 2020). For cities worldwide, the simple scaling law is a typical characterization method, suggesting that a universal organization and dynamics are at play in both infrastructural and socio-economic (Rybski et al., 2019). Therefore, scaling analysis has been a powerful tool to understand urban living based on the theory that population size is a key determinant of socio-economic activities in urban areas (Lobo et al., 2013). Several studies have demonstrated that the urban scaling law can also inform how population affects urban systems with complex social implications (e.g., transport networks) (Altaweel & Palmisano, 2019). Akuraju et al. (2020) inspected the association between country-wide sustainable development indicators and urban scaling exponents and suggested that the sustainable public transport system can be achieved by providing good service to cities.
Specifically, the basic equation used to measure urban scaling is formalized as Scaling relations of degree versus population for the bus network and weighted degree versus population for the multilayer network.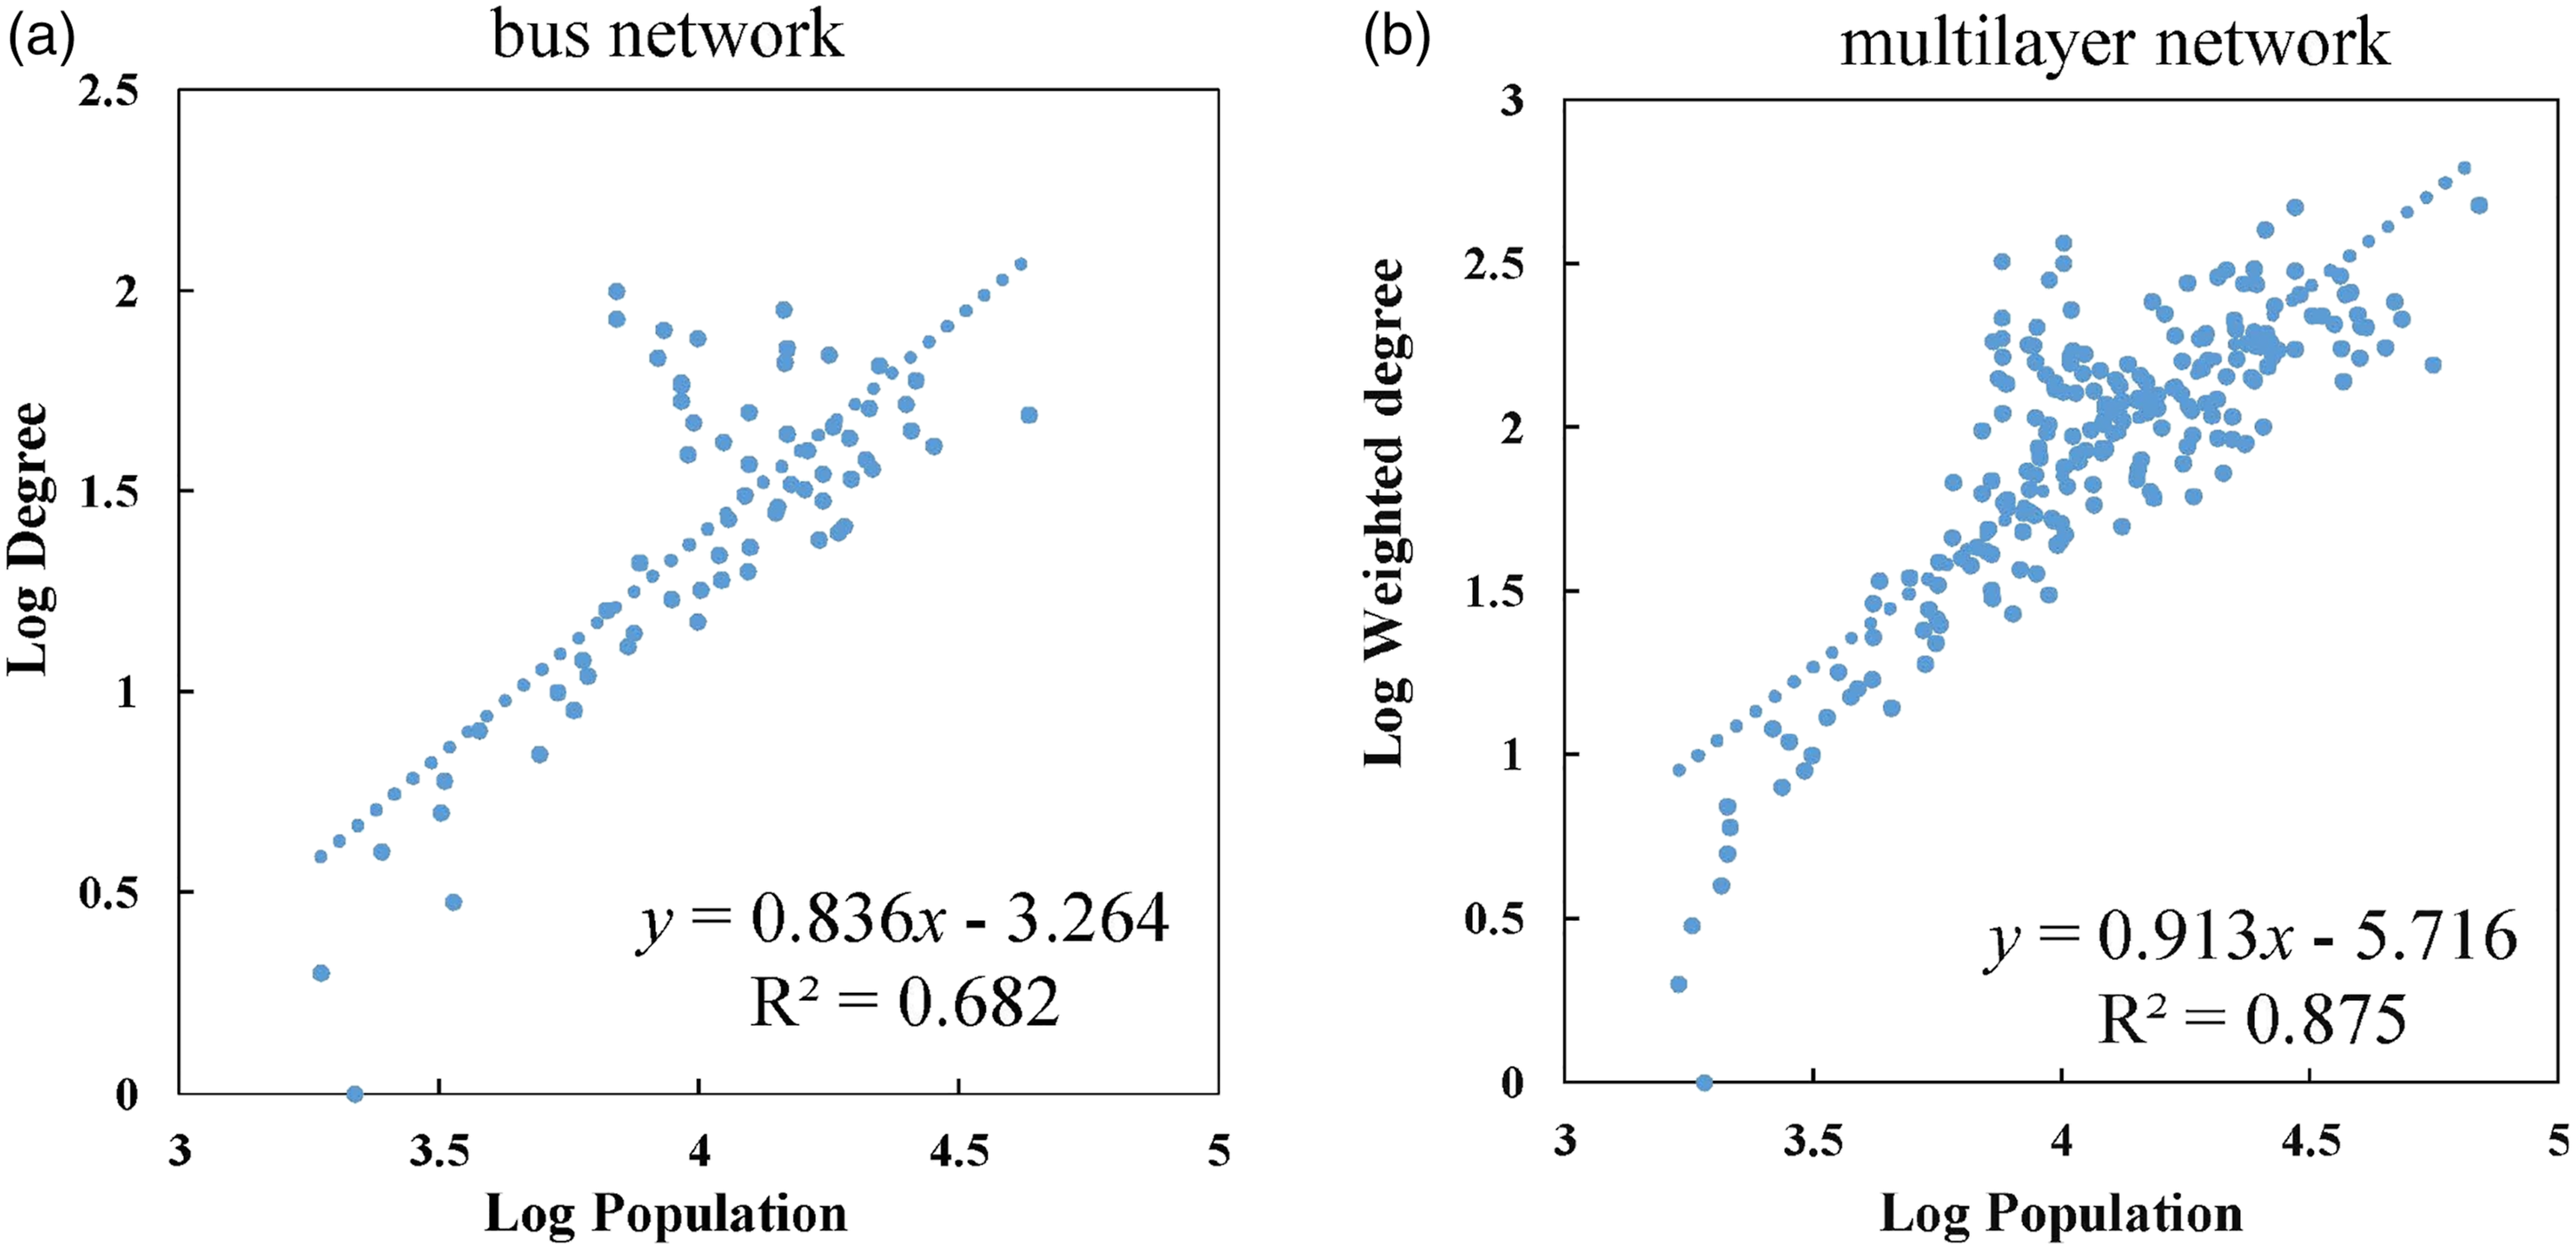

The regression line in scaling relations represents average expectations for urban properties and population size. To assess patterns of variation within the overall measurements statistically, residual is used as a measure of the deviations of the observed value from the expected value as calculated by the scaling equation. The residual can be determined using the equation (14)

Case study
Study area and data
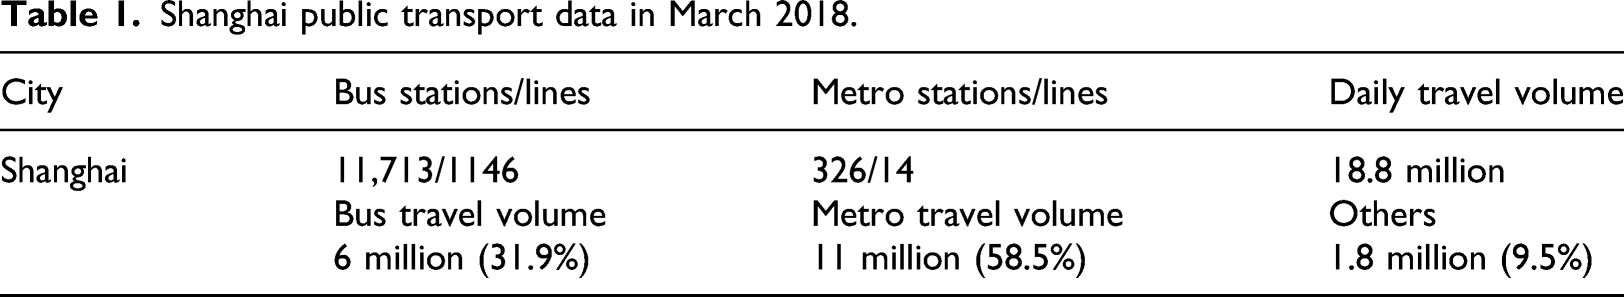
Shanghai, an international metropolis of 24 million residents, has sixteen county-level divisions. With the continuous development of urban infrastructure, the public mobility system is well-developed and primarily fulfills the travel demands of residents and visitors. The monthly public traffic report of the central cities reported that the average daily travel volume of Shanghai in March 2018 was 18.8 million, while the proportion of metro travel was 11 million (58.5%). The detailed public transportation datasets of Shanghai are shown in Table 1. (1) Smart card dataset Shanghai public transport data in March 2018.
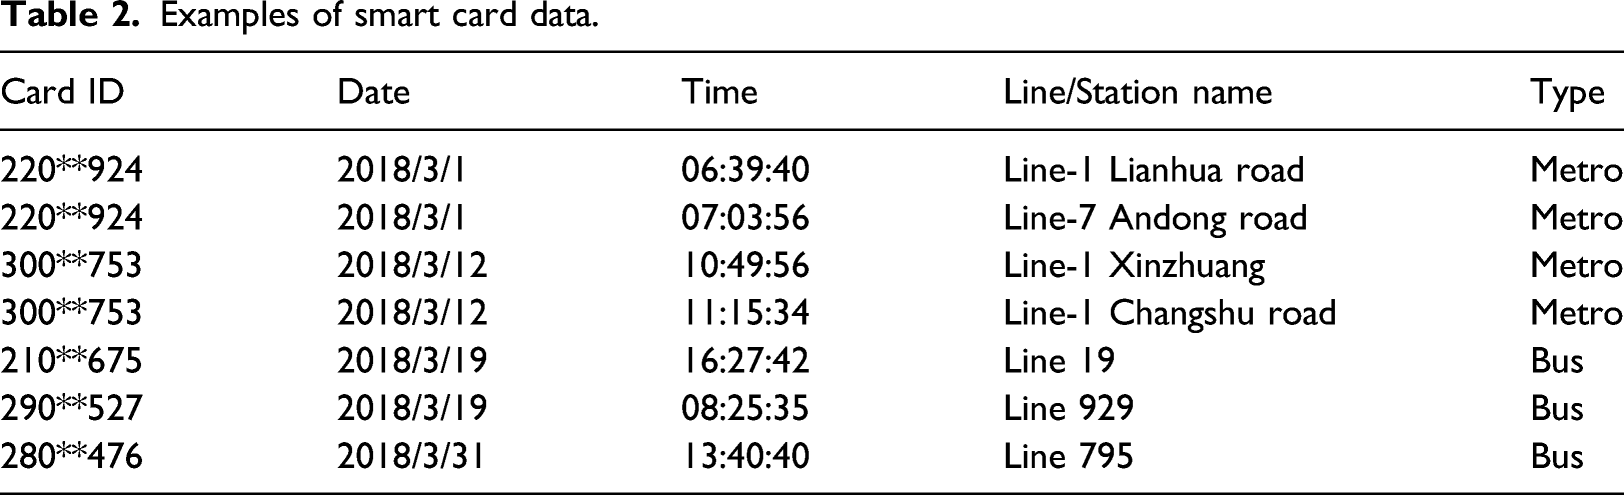
The smart card dataset (SCD) was collected from Shanghai public transportation card corporation. The dataset covers the smart card transaction records generated in Shanghai from March 1 to 31, 2018. Each data record includes card ID, date, time, station name, type of transport, as shown in Table 2. After a data cleaning procedure by eliminating the erroneous and redundant data, the average daily trip volume of each bus/metro line can be obtained using SCD (See Supplementary Figures S1 and S2 in the Supplementary Material). (2) Population data Examples of smart card data.
The high-resolution global population dataset from LandScanTM 2017 was used in this study, which is a community standard for global population distribution data at approximately 1 km spatial resolution (Rose et al., 2018). Compared to official census data which is usually aggregated at the city-level, LandScan characterizes the distribution of population at a finer spatial resolution. The clip feature in the ArcGIS tool was used to extract the population distribution of Shanghai from the LandScan global population dataset, which contained 8375 1 km * 1 km urban cells.
Structure of the multilayer network
Based on the network construction method in weighted multilayer network, we constructed the multilayer transport network of Shanghai with 11,713 nodes and 23,568 edges.
Weighted degree
Top 10 weighted degree (WD) of nodes in the bus network and the multilayer network.
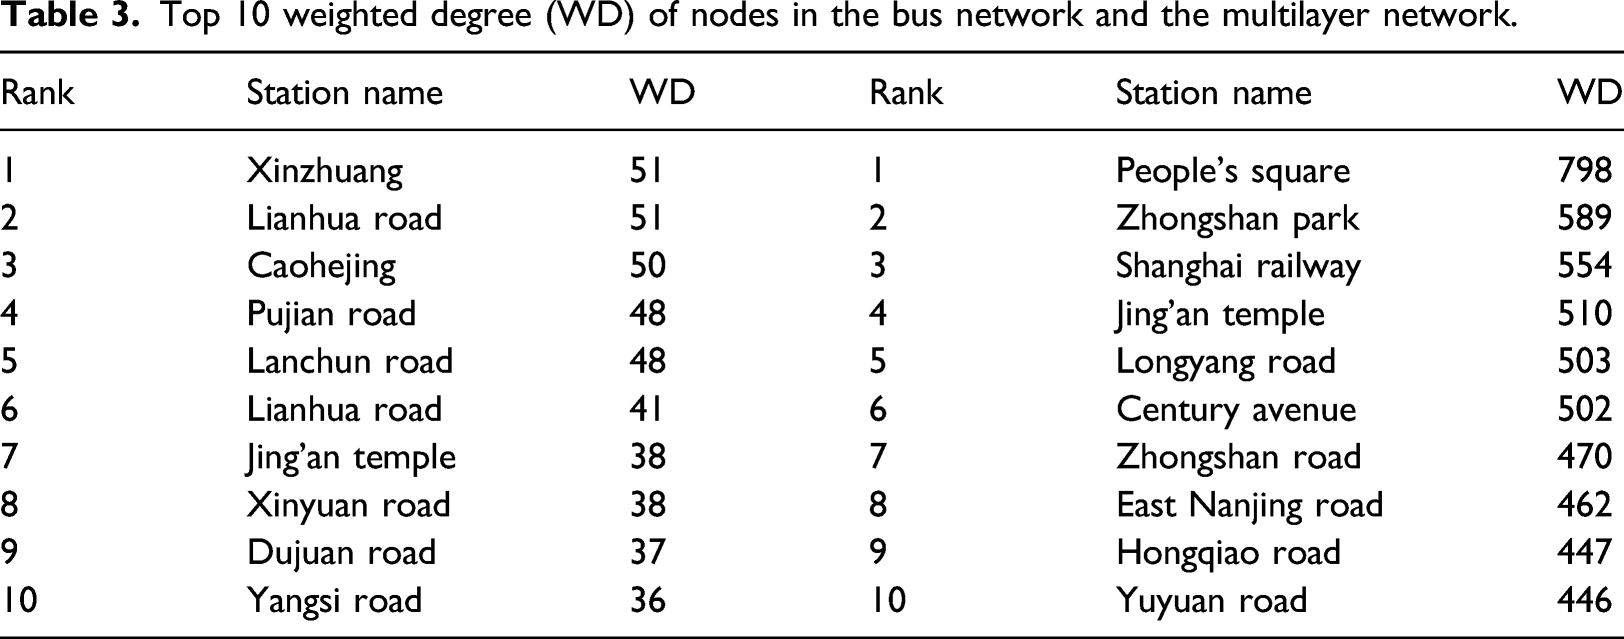
As shown in Table 3, Xinzhuang station has the highest weighted degree in the bus network, while People’s Square station recorded the highest weighted degree in the multilayer network. Stations with higher weighted degree are those with better connectivity in the multi-mode PTN and have superior geographical locations. For example, People’s Square station has the highest weighted degree in the multilayer network, which is located in the “center” of Shanghai and serves as a terminal station of both metro Line 1, Line 2, and Line 8. Therefore, the weighted node degree of the multilayer network can represent the transport efficiency and capacity of stations more realistic.
Weighted betweenness centrality
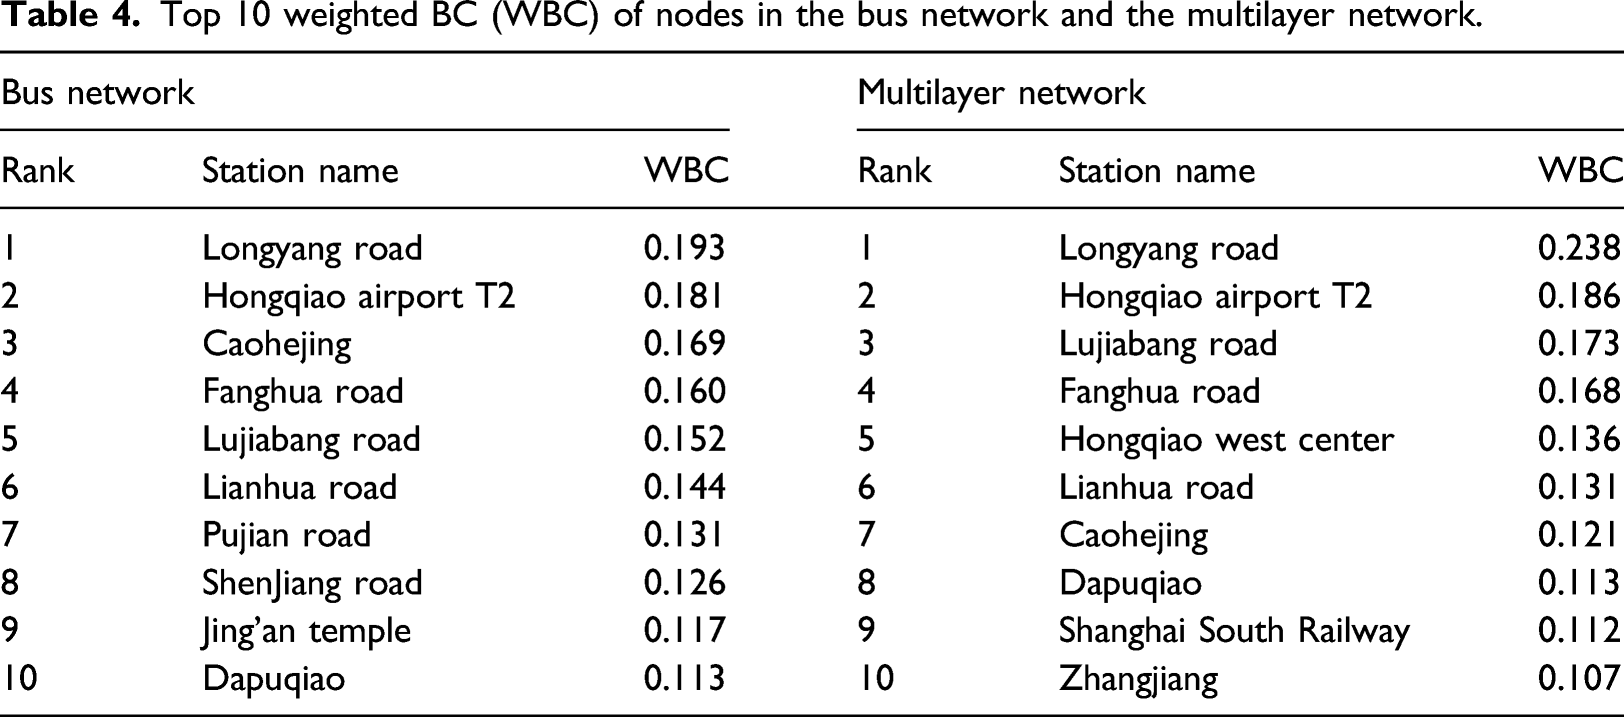
Nodes with high weighted BC values are considered vital locations in their ability to control the passengers’ flow in the public transport network, and can be identified as the potentially important transfer stations. Weighted BC can thus be used to evaluate the travel and operation efficiency of nodes.
Top 10 weighted BC (WBC) of nodes in the bus network and the multilayer network.
Network expanse
The characteristic indicators of the bus network and the multilayer network.
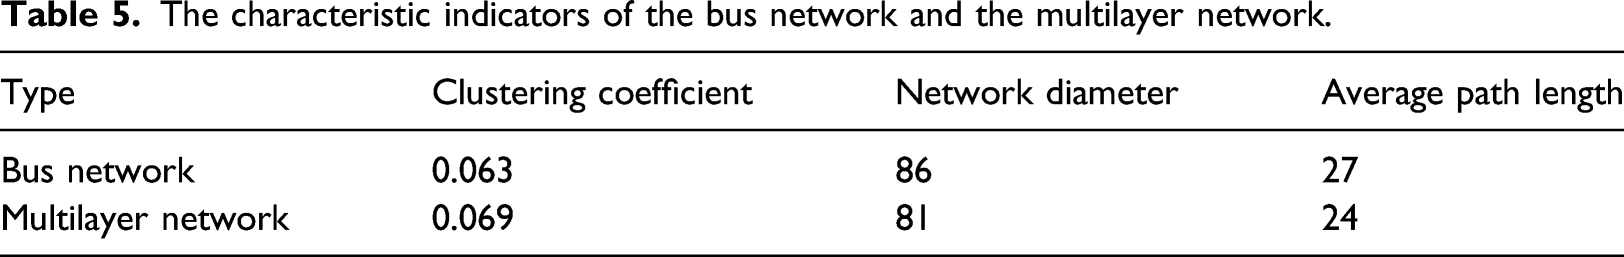
The clustering coefficient of the multilayer network is 0.069, which is higher than that of the bus network (0.063), indicating an improvement in the aggregation degree of metro lines to the whole PTN. The clustering coefficient of the multilayer network is relatively low. However, the research area covers the entire Shanghai region, which indicates that the PTN is still sparse.
Scaling analysis of public transportation system
To further verify the effectiveness of the theoretical and practical implications by using the multilayer network, this section applied urban scaling law to analyze the scaling of the public transport system and offered new visions for PTN improvements. (1) Scaling relations of node degree versus population
The scaling relations of node degree
As shown in Figure 3, the scaling relations of weighted degree of the multilayer network nodes (2) Residual analysis
For further analysis of the real performance in comparison to the expected value, the information in the residuals was used to analyze the coupling balance between weighted degree of nodes and population in 1 km *1 km urban cells. Positive residuals indicate that the transport facilities perform better than expected and satisfy the travel demand of population in the urban cell, and vice versa. We calculated the residuals of the scaling of the weighted degree of nodes versus population for each urban cell using the equation (14) in urban scaling law (Figure 4). Residuals of weighted degree of nodes versus population for all urban cells.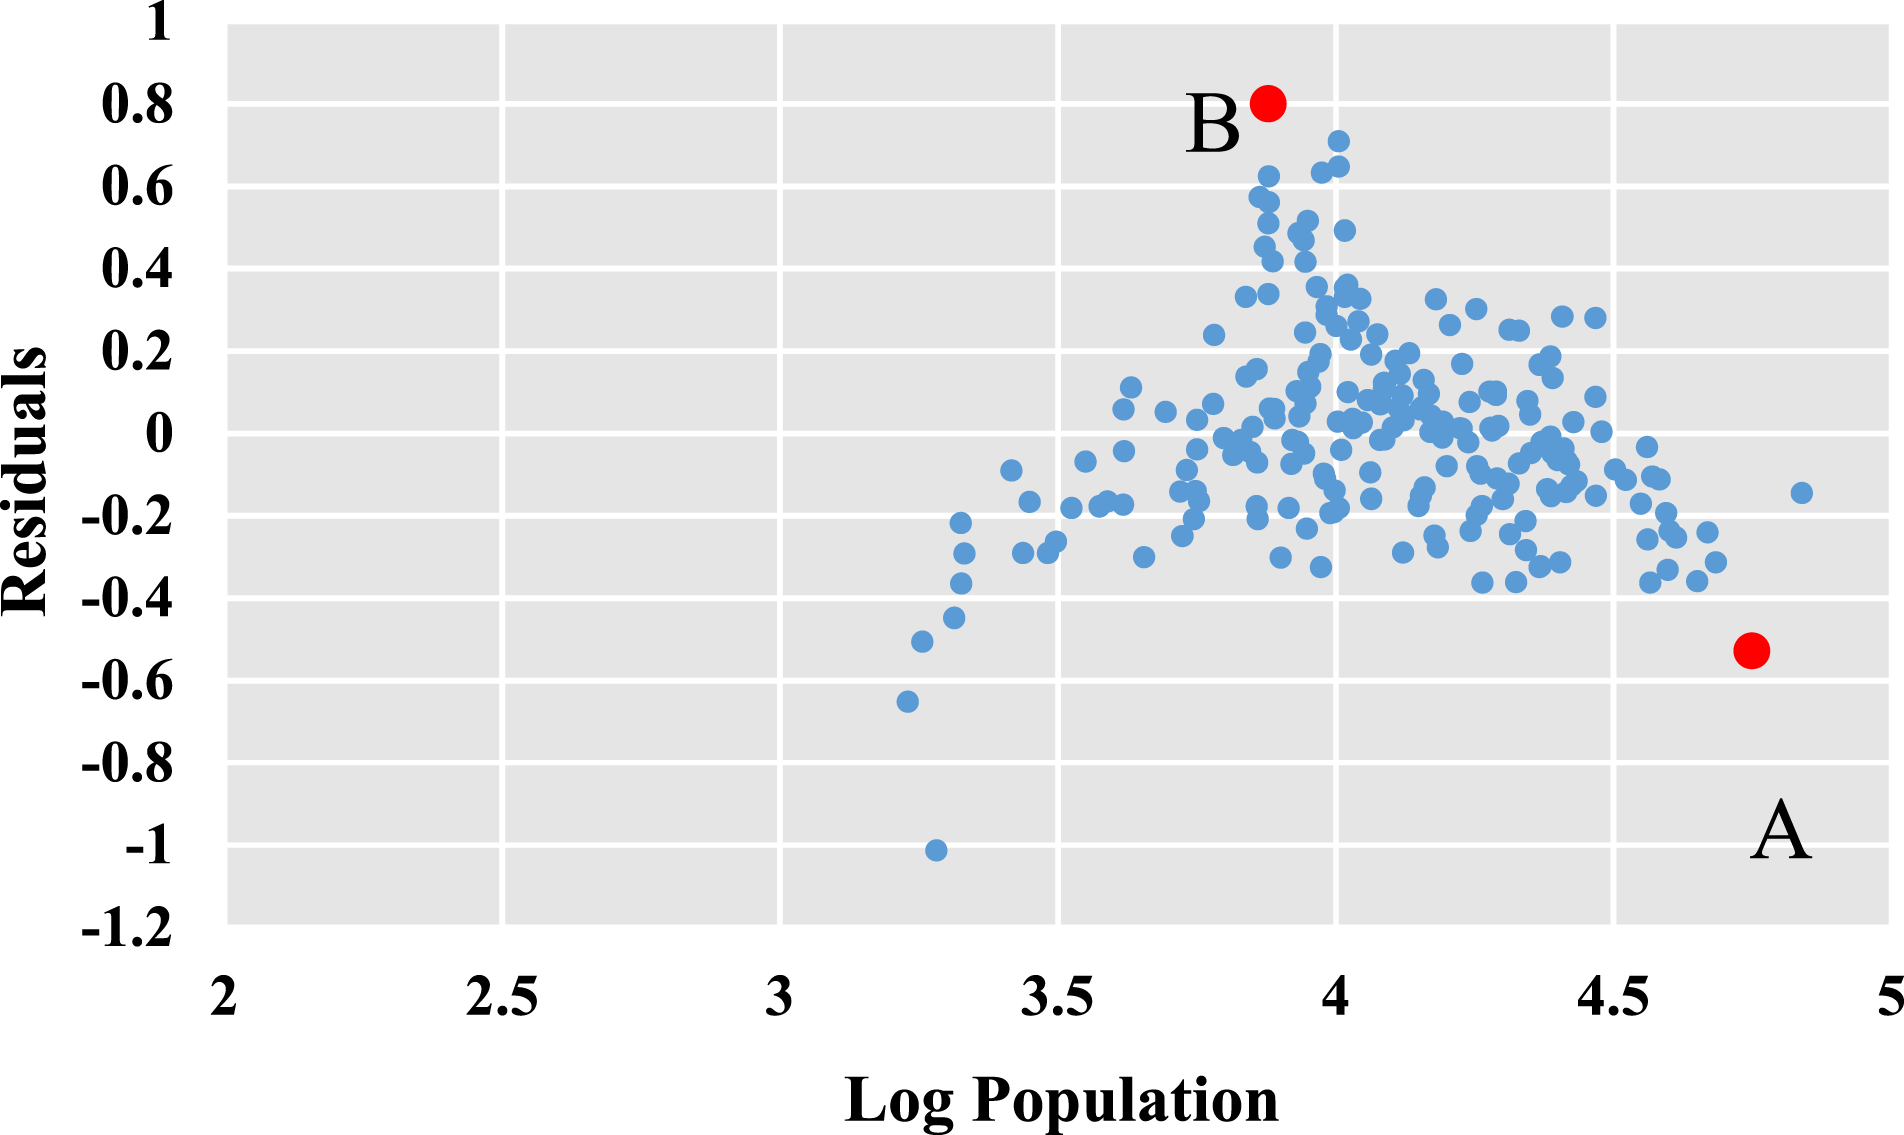
This study uses urban Cell A and Cell B to demonstrate the coupling balance of transport facilities and the population to support the sustainable public transport system improvements. The detailed information of urban properties in Cell A and Cell B are shown in Supplementary Figures in the Supplementary Material.
① Transport facilities and population
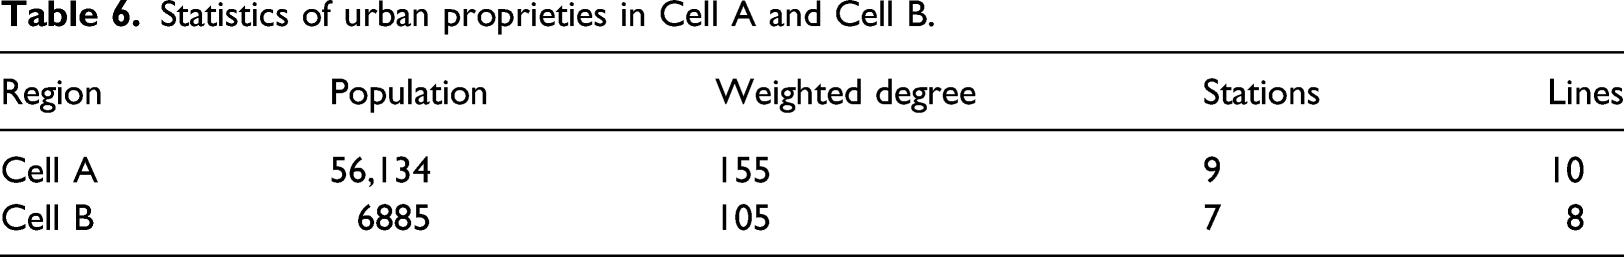
The population size in Cell A is 56,134, indicating a high population density and travel flow compared with Cell B (6,885). There are eight bus stations (8 bus lines passing through) and one metro transfer station (Hailun Road station) in Cell A, while there are six bus stations (6 bus lines passing through) and one metro transfer station (Jufeng Road station) in Cell B. The weighted degree of nodes in Cell A and Cell B is 155 and 105, respectively. Therefore, the transportation facilities per capita are 0.002 (155/56,134) and 0.015 (105/6885), indicating the level of transport service in Cell B is more convenient and satisfies the residents’ travel demand well.
② Land use density and diversity
Statistics of urban proprieties in Cell A and Cell B.
③ Recommended improvements
By comparing the population size and public transport facilities in Cell A and Cell B, strategies for sustainable PTN improvements are suggested. As for Cell A, dominated by residential urban land use, public transport facilities can be improved by constructing more metro lines (consistent with Shanghai Master Plan, 2017–2035, the planned Line 19 will pass through Hailun Road station). To further alleviate travel demand, the development of land use diversity should be addressed. Besides, for Cell B with a high level of public transport facilities, improvements of land use intensity can increase the population density. The optimization of the bus network to better transfer with the metro line may improve the passenger flow of the region. In summary, these improvements will promote travel efficiency and provide a suitable exploration and case reference for the realization of sustainable urban development.
Conclusions
With increasing passenger flows and construction scale, the knowledge about the structure and properties of the public transport system has extended due to massive individual-level mobility data. This study constructed a multilayer network to illustrate the public transport system by assigning weights considering passenger ridership and travel time. Moreover, by employing urban scaling laws, the scaling relations between weighted node degrees and population provide a richer view of the interplay between the public transport system, human mobility, and urban land use.
Regarding the research limitations, temporal dimensions would be addressed in the future research. From network perspective, the temporal analysis can provide insights on the dynamic characteristics of passenger flow. Similarly, from urban scaling law perspective, the temporal scaling could also be of interest (Akuraju et al., 2020). For example, Keuschnigg (2019) explored the dynamic scaling of individual cities along time points and found the super-linear growth trajectory through population growth.
Supplemental Material
sj-pdf-1-epb-10.1177_23998083211062905 – Supplemental Material for Using weighted multilayer networks to uncover scaling of public transport system
Supplemental Material, sj-pdf-1-epb-10.1177_23998083211062905 for Using weighted multilayer networks to uncover scaling of public transport system by Yanyan Gu, and Yandong Wang in Environment and Planning B: Urban Analytics and City Science
Footnotes
Declaration of conflicting interests
The author(s) declared no potential conflicts of interest with respect to the research, authorship, and/or publication of this article.
Funding
The author(s) disclosed receipt of the following financial support for the research, authorship, and/or publication of this article: This study is supported by the National Key Research and Development Program of China (2016YFB0501403); the National Natural Science Foundation of China (42101464); and the China Special Fund for Surveying, Mapping and Geoinformation Research in the Public Interest (201512015).
Supplemental material
Supplemental material for this article is available online.
References
Supplementary Material
Please find the following supplemental material available below.
For Open Access articles published under a Creative Commons License, all supplemental material carries the same license as the article it is associated with.
For non-Open Access articles published, all supplemental material carries a non-exclusive license, and permission requests for re-use of supplemental material or any part of supplemental material shall be sent directly to the copyright owner as specified in the copyright notice associated with the article.