
Abstract
A reliable, punctual, and spatially accurate dataset of sidewalks is vital for identifying where improvements can be made upon urban environment to enhance multi-modal accessibility, social cohesion, and residents' physical activity. This paper develops a synthetically new spatial procedure to extract the sidewalk by integrating the detected results from aerial and street view imagery. We first train neural networks to extract sidewalks from aerial images, and then use pre-trained models to restore occluded and missing sidewalks from street view images. By combining the results from both data sources, a complete network of sidewalks can be produced. Our case study includes four counties in the U.S., and both precision and recall reach about 0.9. The street view imagery helps restore the occluded sidewalks and largely enhances the sidewalk network's connectivity by linking 20% of dangles.
Introduction
The sidewalk is a vital infrastructure of the human-centered urban environment. People use sidewalks in their daily life, ranging from walking for health to economic development, leisure, and environmental improvement (Loukaitou-Sideris, 2005). However, the pedestrian access to sidewalks has decreased in most cities in the past decades, partly due to the increasing popularity of automobiles and vehicle-centered transportation systems (Forsyth and Southworth, 2008). In addition, pedestrians suffer from inconvenience, even danger because of the discontinuous sidewalks split by the motorways (Aceves‐González et al., 2020). An inappropriate design of sidewalk systems would expose pedestrians to the risk of high-speed vehicles on the roads. Urban planners have been advocating healthier urban designs with walkable communities (Forsyth and Southworth, 2008). More research reveals that walkability, as the foundation for a sustainable city, positively impacts urban environments, such as pedestrian safety and public health (Zuniga-Teran et al., 2017). At the same time, the delivery robots have recently become new users of sidewalks (Jennings and Figliozzi, 2019). During the pandemic of COVID-19, delivery robots have been deployed in some communities to distribute food and medical supplies, in order to minimize the physical contact (Descant, 2020). These robots need an up-to-date map of sidewalks for navigation purposes. Hence, a cost-effective approach is expected to map sidewalks to ensure that robots can access targeted areas via the appropriate path.
A well-designed sidewalk system with higher continuity, linearity, coverage, and smoother slope can lower possible crash occurrences (Osama and Sayed, 2017). However, the pedestrian-oriented urban planning and design need to be supported by the inventories of the existing sidewalk system, in order to facilitate the analytics of the use, connectivity, condition, adjacency, and accessibility of sidewalks. Yet, these inventories are not widely available in many cities.
Very few methods or tools can help obtain reliable sidewalk data cost-effectively and timely. Some agencies used existing parcel or land cover maps to derive sidewalk polygons or offset roads' centerlines as sidewalk polylines. However, these approaches cannot generate accurate sidewalk datasets. A more reliable way to obtain sidewalk data might be manually drawing polylines or polygons based on very high-resolution aerial images (better than 0.3 meters). Yet, such a manual method is extremely time-consuming and error-prone.
Using algorithms instead of manual digitalization to extract sidewalks from aerial images is a more desired method. In the past decades, people have developed various approaches to detect and map objects from earth observation data. For example, land cover maps can be generated from remote sensing imagery for a large area (Kussul et al., 2017; Ning et al., 2020b). New buildings can be monitored for regulation purposes (Ning et al., 2020a; Vakalopoulou et al., 2015). Road detection has been a long-term research question in the remote sensing community (Li et al., 2018; Shi et al., 2017). Given the high-resolution airborne or ground-level earth observation data, sidewalks are expected to be extracted using algorithms which were originally developed for detecting other objects (Hou and Ai, 2020; Luo et al., 2019).
Aerial imagery is a viable data source to detect and map sidewalks in a large area. However, canopies, which are common in the urban environment, often occlude beneath sidewalks. Some researchers have tried to address this issue by applying the post-processing method to the extracted results (Senlet and Elgammal, 2012a). Ground-level imagery also contains sidewalks, and some approaches have been developed to detect sidewalks, while canopy occlusion would not be an issue. However, public street view images may not cover the entire area of interest and are not up-to-date. Combining overhead and ground imagery is a feasible solution to extract an intact sidewalk network. It is noted that a growing list of studies fused feature vectors from overhead and ground imagery to detect objects (Cao et al., 2018; Hoffmann et al., 2019).
In this research, we contribute a novel procedure to extract sidewalk networks using aerial and street view images. Unlike those measures fusing feature vectors of different types of imagery, our approach combines the results of overhead and street-level images. First, an initial sidewalk network is extracted from aerial imagery by a semantic segmentation neural network. Then, the initial network, which misses occluded sidewalks, is refined by extending sidewalk segments according to the presence of sidewalk in street view imagery. Convolutional Neural Networks (CNNs) play a major role in the proposed method. We use the Delaware Valley Regional Planning Commission (DVRPC) region in the state of Pennsylvania as the study area, which includes counties of Bucks, Chester, Delaware, and Montgomery. The F1 score of the results is 0.8988 in the study area.
Related work
Sidewalk extraction is essentially an object detection topic, which has been intensively investigated in the remote sensing community. Pixel- and object-based methods are widely used in various tasks, such as change detection and scene classification. Machine learning algorithms, such as Support Vector Machine (SVM) and Bag of Visual Word are also applied to imagery analysis and understanding (Dey et al., 2010). In recent years, multiple-layer neural networks, or deep learning, have obtained significant progress and scholarly attentions across many urban applications (Han et al., 2018; Zhang et al., 2020). CNN is widely applied to object detection and has especially shown great performance in detecting objects in remote sensing images (Ball et al., 2017; Zhu et al., 2017). Object detection normally refers to obtaining the bounding box and the category of an object, while semantic segmentation means to classify pixels of an object into a category. CNNs for semantic segmentation tasks are more appropriate to detect linear objects such as sidewalks.
Semantic segmentation
Numerous image segmentation techniques have been applied to remote sensing imagery (Dey et al., 2010), such as Markov Random Field (Zheng and Wang, 2014), Watershed (Gaetano et al., 2014), Prior Knowledge (Bouziani et al., 2010), and Neural Networks (Awad, 2010). In recent years, semantic segmentation has witnessed the impressive accomplishment (Ghosh et al., 2019). Many off-the-shelf models, such as FCN (Long et al., 2015), SegNet (Badrinarayanan et al., 2017), U-Net (Ronneberger et al., 2015), and PSP-Net (Zhao et al., 2016), can detect objects and their occupied pixels in an image. FCN is a milestone in semantic segmentation, and most state-of-the-art studies are the extensions of FCN (Ulku and Akagunduz, 2019).
Remote sensing communities have been applying and also improving FCN and its variants to various applications, such as road and building detection. Road detection based on high-resolution imagery has also been investigated. Pourya et al. (2020) proposed a CNN architecture that incorporates a feature pyramid network into generative adversarial networks for road detection from remotely sensed imagery. Multilevel and multiscale features were captured as contextual information for generating a feature map. Gao et al. (2019) added residual connected unit and dilated perception unit to a U-Net-like network, while used a math morphological post-process and a tensor voting algorithm to alleviate the occlusion issue in complex scenes. FCN-like models have also been utilized on various types of images to detect buildings. Boonpook et al. (2018) used a SegNet-based model to extract building from Unmanned Aerial Vehicles (UAV) images. Prathap and Afanasyev (2018) proposed a comprehensive framework, which uses a modified U-Net as a key component, to obtain building footprints.
The fusion of overhead and street view imagery
Images from different views record objects' appearance comprehensively. Fusing the information from multi-view images benefits object detection. Several studies have explored the combination of aerial and street view imagery to extract land use maps. A common method to combine information from multi-view images is to fuse the feature vector extracted by pre-trained neural networks. Based on a pre-trained Place-CNN (Zhou et al., 2017a), Cao et al. (2018) extracted feature vectors from GSV images and then concatenated them into the workflow of semantic segmentation using SegNet on aerial images to obtain higher model performance. Hoffmann et al. (2019) assembled CNNs to boost accuracy on building type classification using aerial and street view images. The authors found that fusing the probabilities of building categories from the final outputs of CNNs trained on different datasets can obtain better performance than fusing feature vectors in the early stage. Similarly, Branson et al. (2018) trained a linear SVM to classify tree species using the feature vectors from satellite images and street view images in three zoom levels. Unlike these approaches based on feature fusion, we used the street view imagery as a supplemental data source when the aerial imagery fails to represent sidewalks.
Sidewalk extraction
Several approaches can be applied to extract sidewalks. A straightforward method is to duplicate road central lines to its two sides using a parallel way (Luo et al., 2019). A trained CNN removed the parallel line segments without sidewalk presence in aerial images. Stereo images can also be used for sidewalk extraction (Cheng et al., 2018). The critical step is to use the disparity map to detect curb and road surface and then extract sidewalk points near the curb and higher than the road surface in the disparity map. Ground mobile LiDAR is another data source for sidewalk extraction. Hou and Ai (2020) introduced a pipeline to obtain high-accuracy sidewalks networks using mobile LiDAR sensors. After going through a pre-trained PointNet++ model, the potential sidewalk points were labeled from raw points clouds and followed by a PCA algorithm to calculate flatness. Surfaces that satisfy pre-defined thresholds would be labeled as sidewalk.
Senlet and Elgammal (2012b) noticed the canopy occlusion in the overhead images when detecting sidewalks. They used shape information and a region-growing approach to predict and connect the occluded sidewalks. Their approach was applied on a small dataset covering Rutgers Busch Campus in New Jersey, so the scalability is unclear.
Several attempts have been made to extract sidewalks from street view images. Smith et al. (2013) used a random forest method, and Mattyus et al. (2016) provided a solution to extract sidewalks, parking lots, road lanes, and buildings from street view images and aerial images by combining the FCN and Markov random field. Some studies convert street view image into top-view representation (Wang et al., 2019), but the consistency between the conversion results and geolocation has not been assessed.
Methodology
This paper focuses on developing an automatic method to extract sidewalks from aerial and street view imagery. We extract sidewalks from aerial images, and then restore the occluded segments from street view images. Aerial imagery is the primary data source for sidewalk extraction because its data volume is relatively small, and it can cover the entire area of interest. Street view imagery has high discrimination but brings more data volume and computation, and the location of the result needs sophisticated workflow to be restored. In addition, the full coverage of the area of interest is difficult to obtain, especially private properties where the street image mapping car cannot access. Therefore, we treat the street view image as supplementary data and use it for the occluded or other missing sidewalks in aerial images.
The extracted result of sidewalks can be polygon or polyline, depending on the resolution of the aerial image. If the resolution is no better than 0.3 m, sidewalks are represented as linear objects in areal images. We use aerial images of 0.3 m in the study case, so the extracted sidewalks will be converted to polylines. Figure 1 shows the workflow of the proposed method.
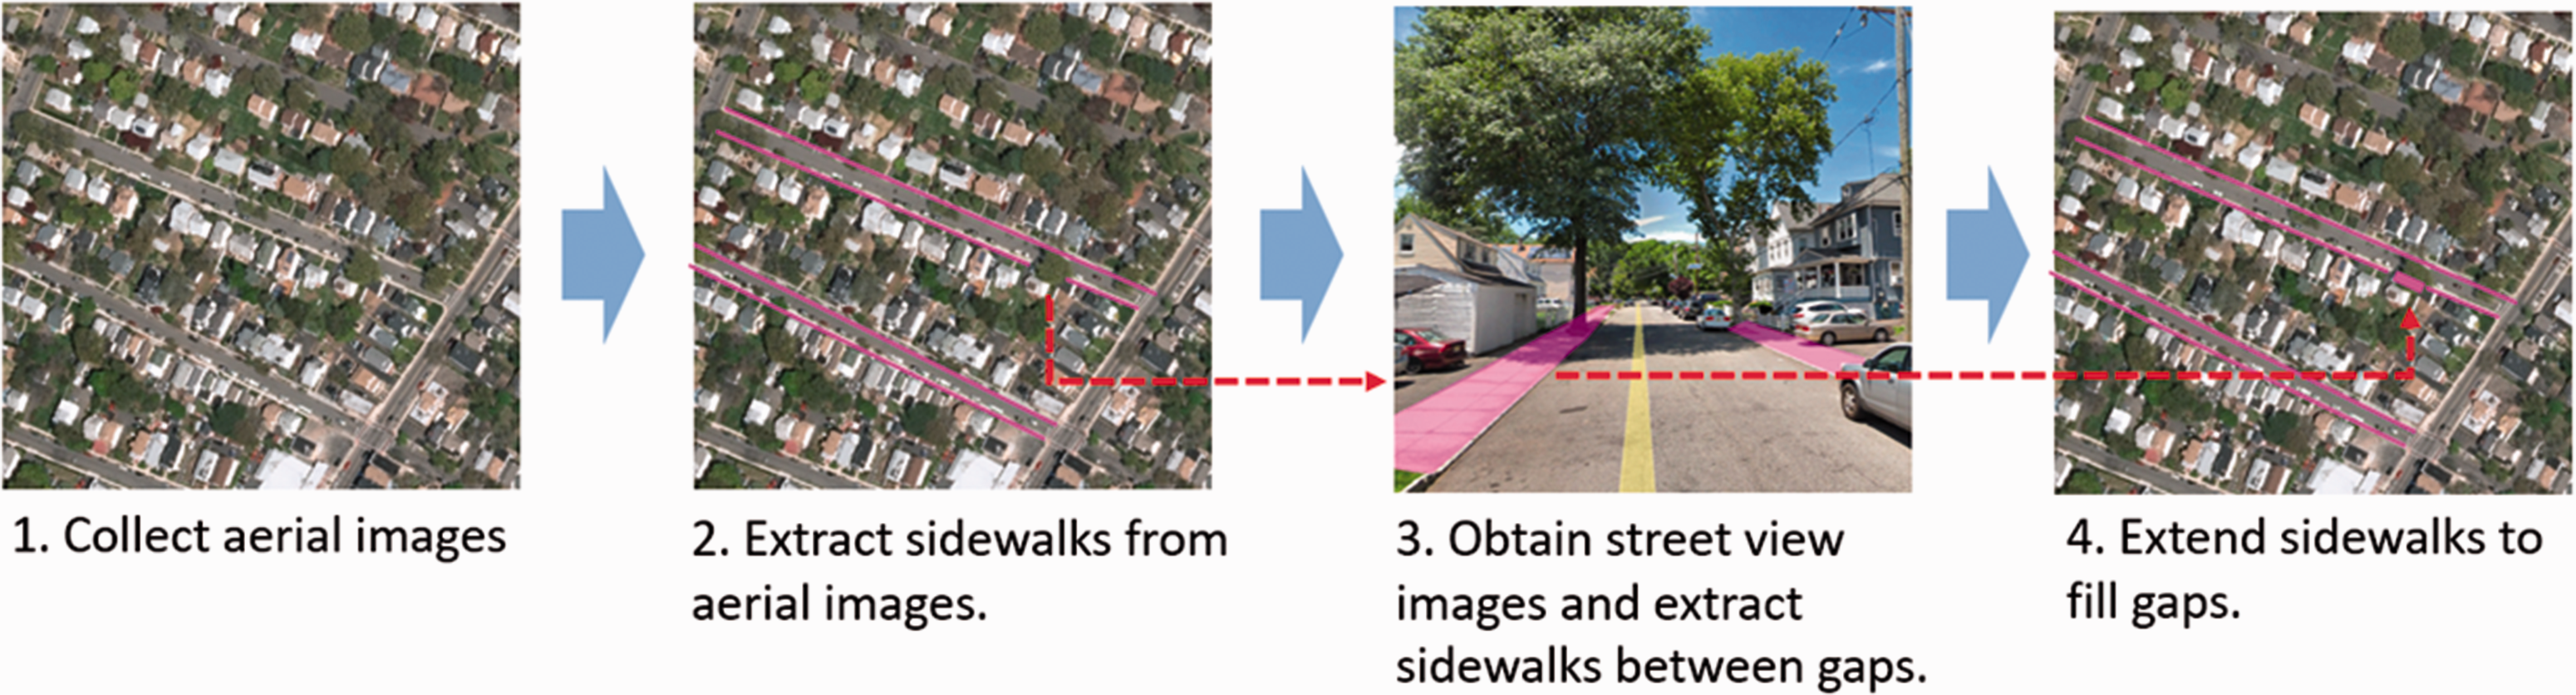
The workflow of the proposed method. Street View Imagery © Google.
Collect aerial images
The resolution of aerial imagery is crucial. The sidewalks' width is small, about 1.2–1.5 meters on average (Kim et al., 2011). Hence, sidewalks in images possess 4–5 pixels in overhead images of 0.3 meters. In the images of lower resolutions, sidewalks possessing less than 4 pixels are difficult to be detected. An infrared band is not required in this study because vegetation discriminability does not impact sidewalk extraction.
For the study area (Figure S1), which covers about 5330 km2, we download aerial images of 0.3 meters resolution from the DVRPC (DVRPC.org), as well as the associated sidewalk centerlines. Road centerlines were also obtained for result assessment (see Section Results).
Extract sidewalks from aerial images
We chose YOLACT (Bolya et al., 2019) to segment sidewalks in the aerial image, because YOLACT represents the boundaries of objects more accurately than Mask-RCNN (He et al., 2017) and FCIS (Li et al., 2017) which are viewed as baselines in various semantic segmentation tasks. YOLACT (You Only Look At CoefficienTs) is a real-time instance segmentation model, and it generates masks of high-quality boundaries from the original feature maps without repooling (e.g., upsampling).
Build the training dataset
Usually, CNNs need to be trained on large training datasets. We used 500 tiles of 5000 × 5000 pixels and the associated sidewalk central lines to form a training dataset, which covers 1125 km2 and contains 10,419 km of sidewalks. Fifty of these 500 tiles were used as the test set (Figure S2), containing 1092 km sidewalks. The test set covers 112.5 km2 of representative landscape in the experimental region, such as residential and rural areas.
YOLACT cannot read the large images as 5000 × 5000 pixels, so we split the training dataset tiles into patches of 256 × 256 pixels. We buffered sidewalk centerlines with a 3 feet distance, and then converted the result polygons of 6-foot width into raster. Then, we used the same schema of image tiles to split sidewalk raster into patches. The class label of sidewalk was set to 1. Thus, each image patch has a corresponding sidewalk raster (Figure S3).
Train the YOLACT model
We used the source code of YOLACT (https://github.com/dbolya/yolact) provided by its authors to train YOLACT 30 epochs. The learning rate, momentum, decay were set to 0.001, 0.9, and 0.0005, respectively, and the learning rate will multiply 0.1 at the 10th, 15th, 20th, 25th epoch. YOLACT was implemented with PyTorch, and an Nvidia GTX 1080 Ti GPU was used for training.
Extract sidewalks in the test set
A trained YOLACT model can extract sidewalks from images in the test set. The output of YOLACT is a raster with pixel values indicating classes. In our case, the output raster is a binary image with 1 and 0, meaning sidewalks and background, respectively. We use a sliding window strategy to read the input images patch by patch, and then merge the inferencing results into a binary image with the same size as the input image. An ArcScan module in ArcGIS was used to extract centerlines of extracted sidewalk pixel clusters.
Obtain street view images and extract sidewalks
The connectivity is an important characteristic of a sidewalk network. However, in aerial images, CNNs may fail to extract sidewalk segments in shadows or occluded by canopies or buildings. As a result, some sidewalks were interrupted, and gaps appeared. We downloaded street view images from Google Street View as a supplementary data source to fill those gaps.
Obtain street view images from REST API of Google Map
Google Maps provide REST API (Representational State Transfer Application Programming Interface) to obtain a thumbnail of street view image through a location and a bearing angle: https://geo0.ggpht.com/cbk?cb_client=maps_sv.tactile&authuser=0&hl=en&gl=us&output=thumbnail&thumb=2&w=1024&h=768&pitch=0&ll=,LONGITUDE, LATITUDE &yaw=BEARING_ANGLE
The LONGITUDE and LATITUDE is the location of a panorama, which can be obtained by another REST API:http://maps.google.com/cbk?hl=en&gl=us&output=json&ll=DANGLE_LONGITUDE,DANGLE_LATITUDE
DANGLE_LONGITUDE and DANGLE_LATITUDE is the location of a dangle. This API returns a metadata file of the nearest panorama for the requesting longitude and latitude. The longitude and latitude of the panorama are included in the returned metadata. The BEARING_ANGLE is the angle starting from the north direction, which can be calculated by DANGLE_LONGITUDE, DANGLE_LATITUDE and LONGITUDE, LATITUDE.
Obtain street view images in the gaps
Occlusion of canopies and shadows result in missing sidewalks in aerial images, and then unnecessary gaps and dangles occur in the extracted sidewalk network. Figure 2 displays two gaps in the extracted sidewalks. The street view image, however, may capture these missing sidewalks. Thus, the street view image can be used to verify whether there are sidewalks in an occluded area, which is the gap between a pair of dangles.
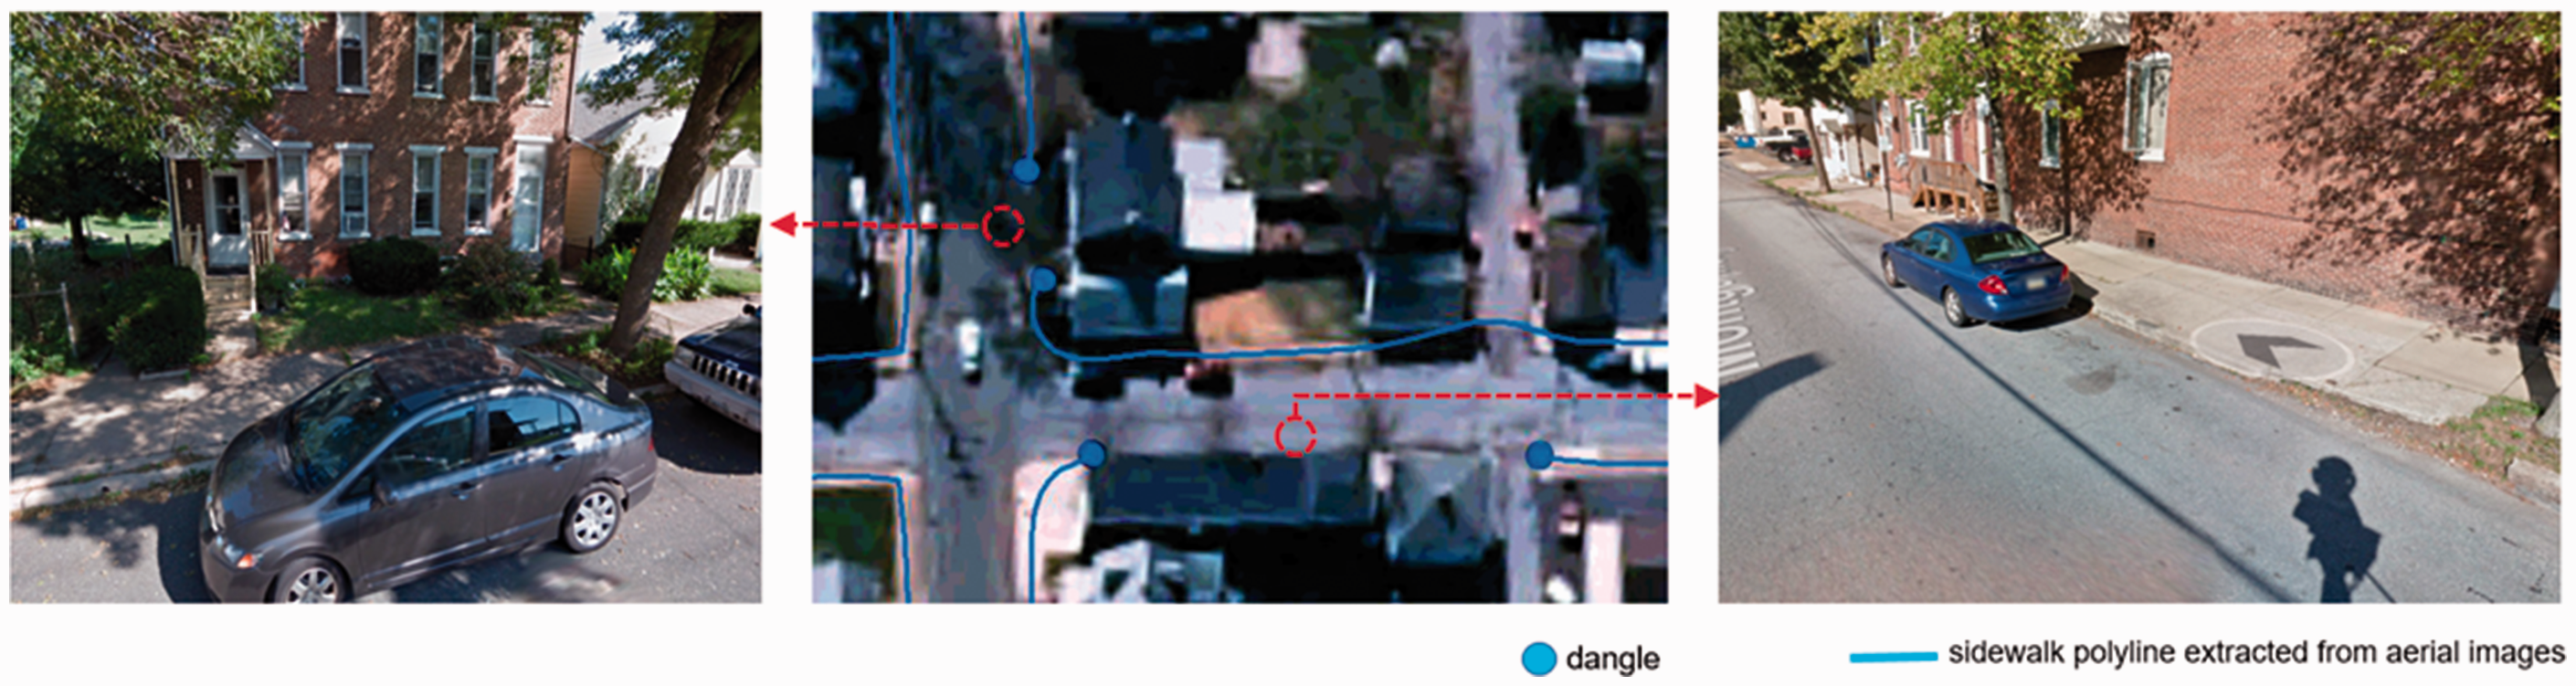
Occlusion caused gaps in extracted sidewalks. Street View Imagery © Google.
Using the REST API of Google Map (Section Obtain street view images from REST API of Google Map), street view images covering these gaps were downloaded. These images come from panoramas captured by Google Street View mapping cars, and those panoramas have an interval of about 10 m. Figure 3 shows the method to obtain the street view images between a pair of dangles. Starting at dangle Da, the nearest panorama P1 is downloaded, then the adjacent panorama P2 until panorama Pn having another dangle Db located in its field of view (FOV). Here, the FOV was defined as a rectangle of 20 × 10 m, whose long side is perpendicular to the mapping car's direction and short side centered at the panorama.
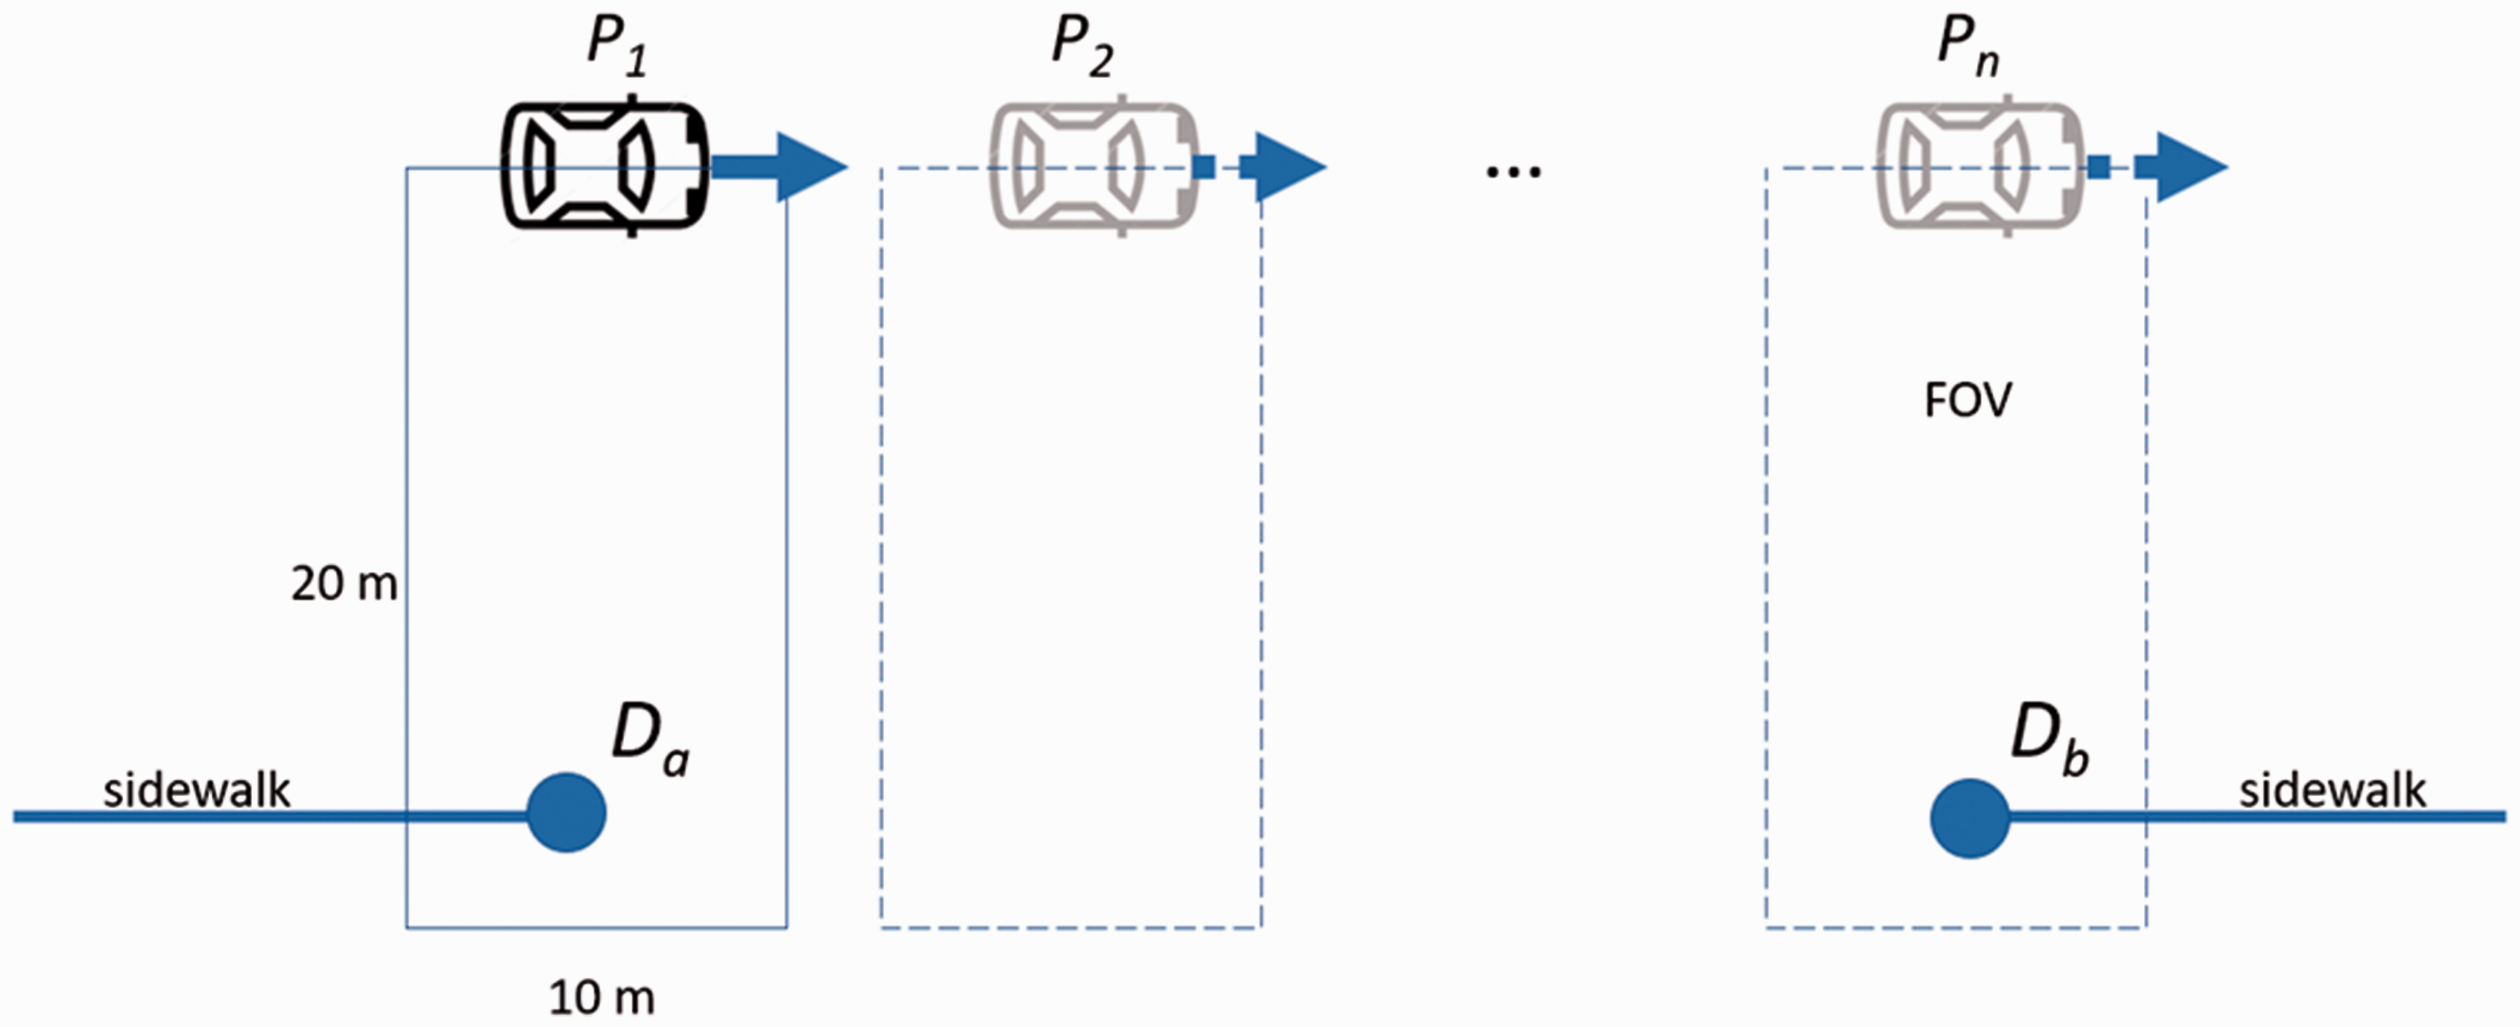
Obtain panoramas between a pair of dangles. Starting at dangle Da, the nearest panorama P1 is downloaded, then the adjacent panorama P2 until the last panorama Pn having another dangle Db located in its FOV (blue rectangle).
Extract sidewalks from street view images
After obtaining the street view image of a gap, we need to judge whether it contains sidewalks. If any, the dangle of the sidewalk should be extended. We applied pre-trained semantic segmentation models to extract sidewalks. Two popular public datasets, CityScapes (Cordts et al., 2016) and ADE20k (Zhou et al., 2017b), contain sidewalk class. After a visual comparison of the results from PSPNet, DeeplabV3+, and FCN trained on ADE20k and Cityscapes, we chose PSPNet trained on ADE20k due to its better performance in the study area. Figure 4 shows four samples of street view images and their segmentation results.
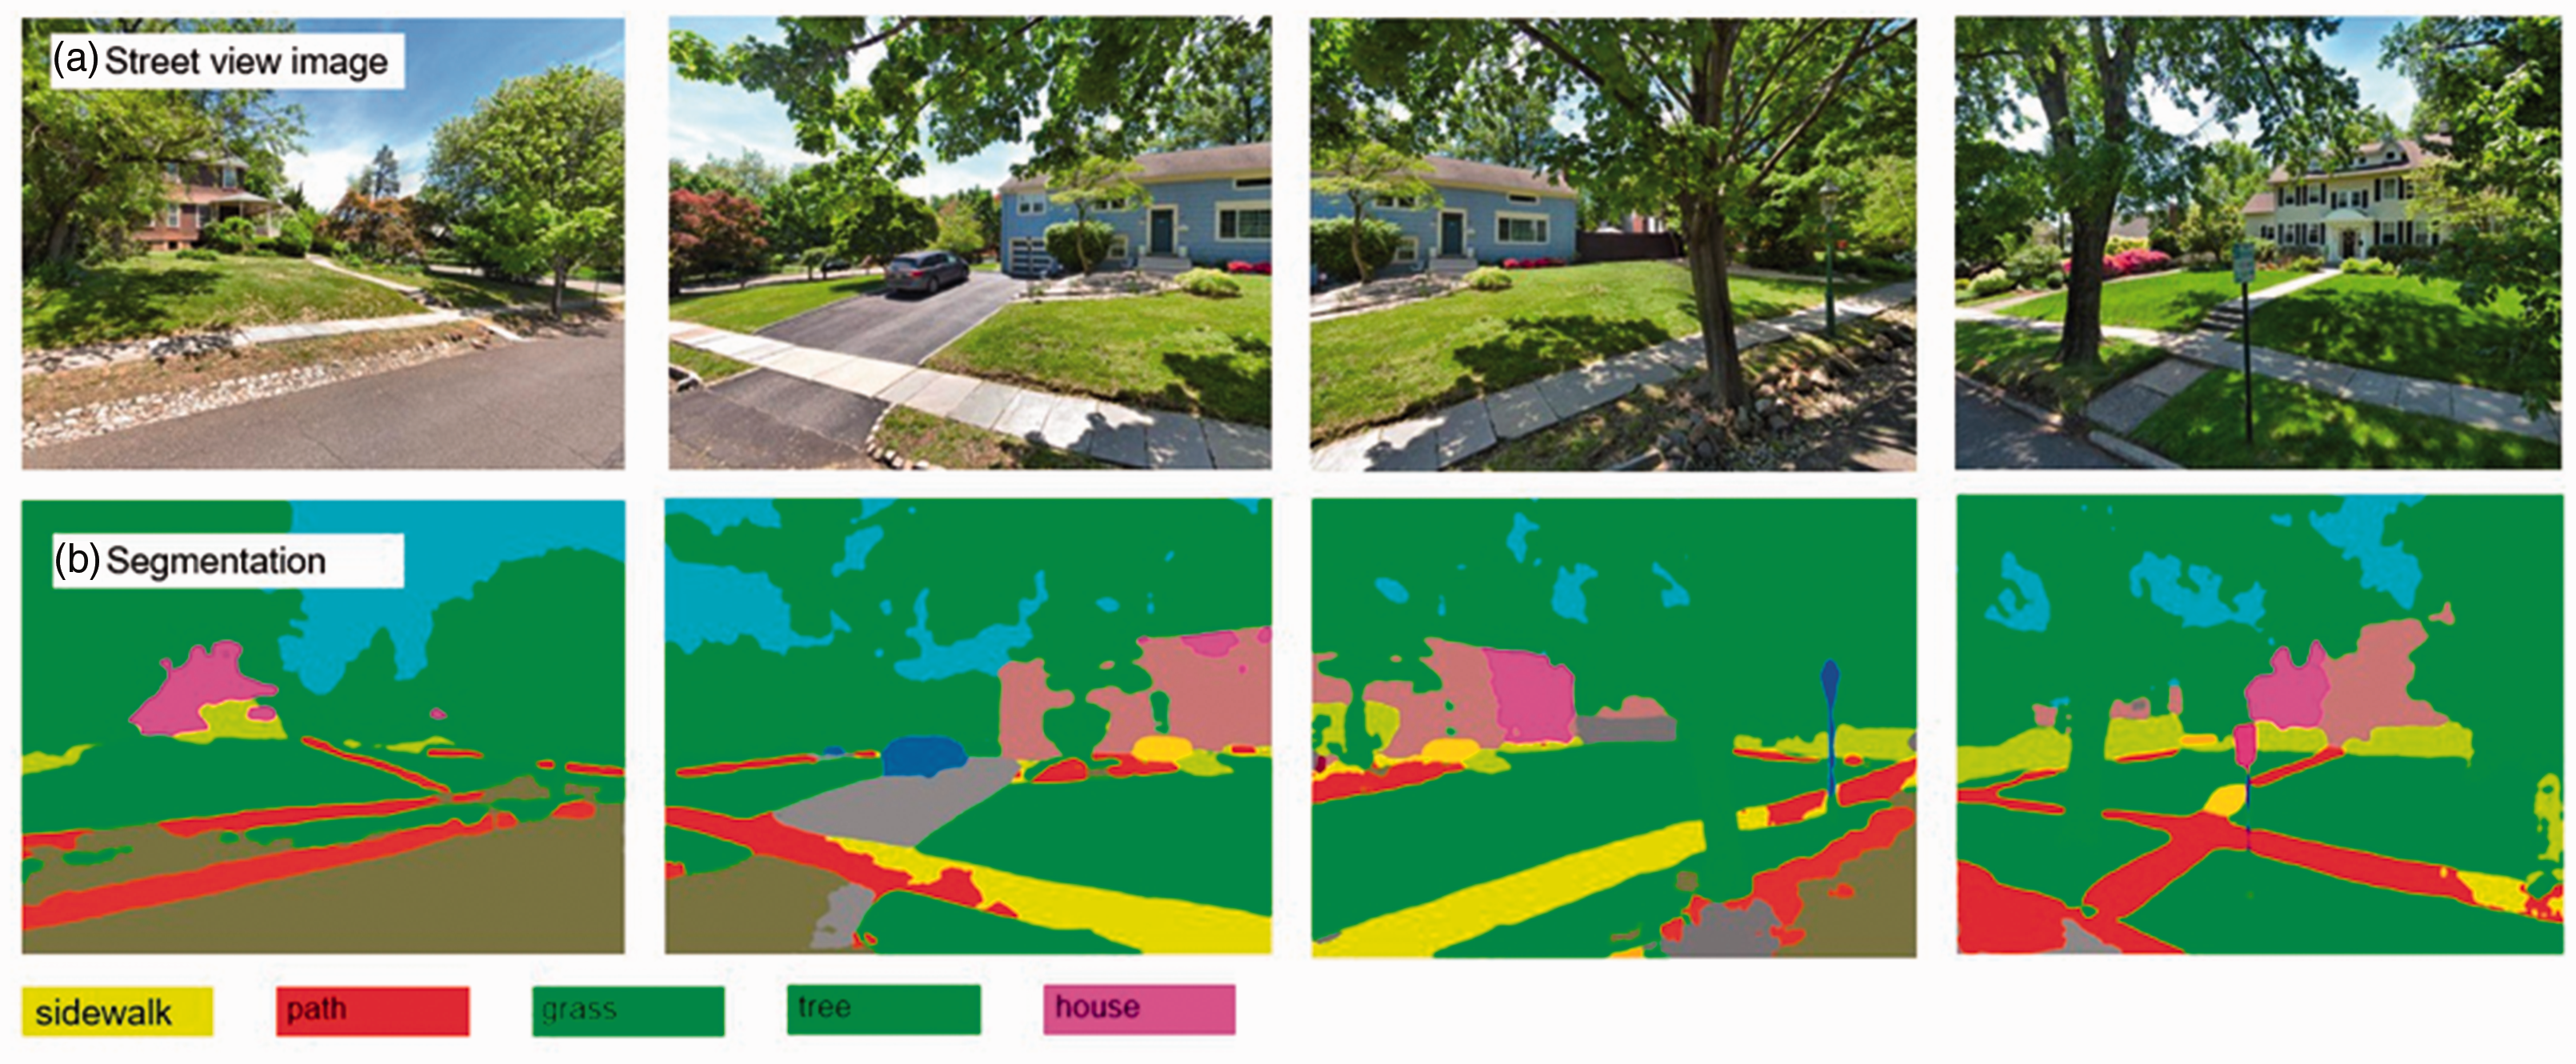
Segmentation of street view images by pre-train PSPNet. Street View Imagery © Google.
We set a 3 m2 threshold of the sidewalks area to determine whether a street view image has sidewalks. To calculate area, the sidewalk pixels extracted from street view images were reprojected to a projected coordinate system. According to the method proposed by Cavallo (2015), we used the depthmap coded in the metadata return from Google Maps REST API (Section Obtain street view images from REST API of Google Map) to generate point clouds. Figure S4 shows a panorama and its associated depthmap in Equirectangular projection.
Though the point clouds were heavily simplified, especially in the vertical direction, we think they can still reflect the ground roughly. Given the ground objects (e.g., sidewalks, roads) extracted from street view images and the associated point clouds, the location of the ground objects can be reprojected to a projected coordinate system. In other words, convert the street view image to an overhead land cover map, or an ortho-image.
The street view image from Google Street View is a plane image from Gnomonic projection (Weisstein, 2020), and each pixel can be linked to a pixel in the depthmap to obtain the distance to the camera. Then, following Cavallo's (2015) method, the 3D coordinates of a pixel in the street view image can be calculated and re-projected to a local projected coordinate system. After re-projection, the pixels of sidewalks can be overlaid onto the sidewalks extracted from aerial images (Figure 5). We did not use the distance in the depthmap more than 20 meters due to the large error beyond 20 meters.
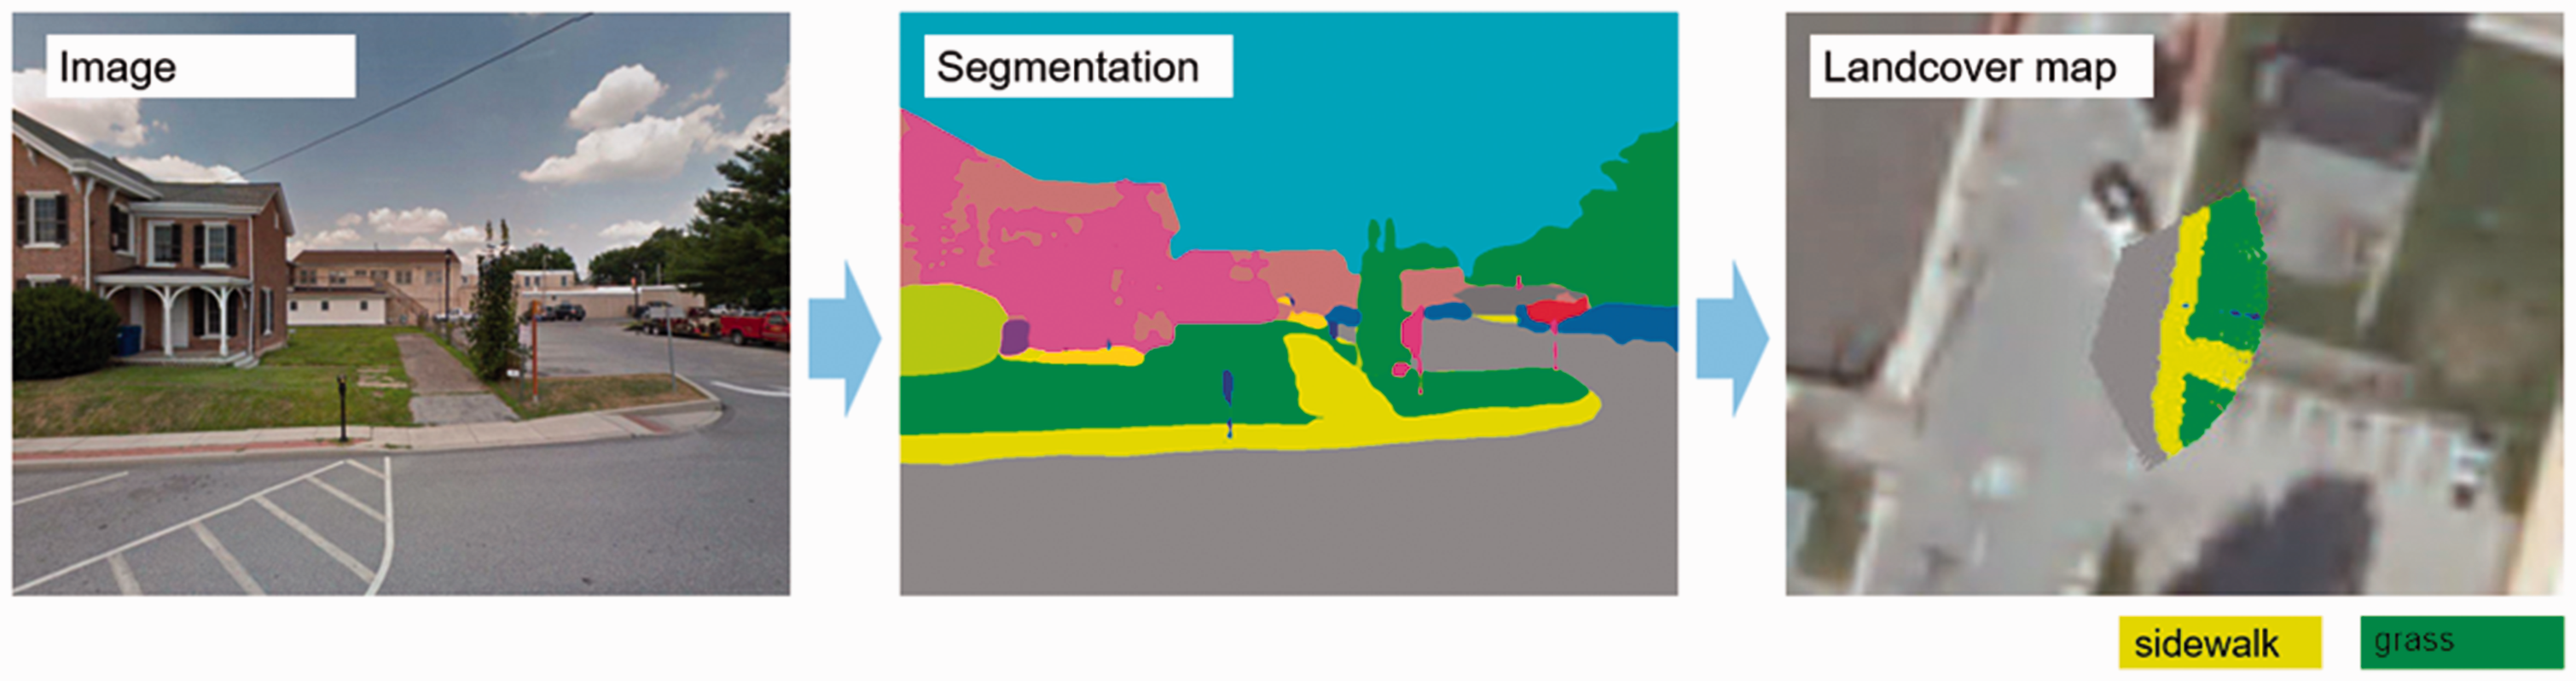
Reproject the segmentation to land cover map. Street View Imagery © Google.
Extend the sidewalks to fill gaps
Figure 6 illustrates how to extend sidewalks extracted from aerial images to fill gaps. D0 and Dn are two dangles of a gap. There are n panoramas in this gap, and P0 is the location of the nearest panorama D0, Pn is the location of the panorama whose FOV covers Dn. Pm-1 and Pm are locations of two adjacent panoramas between P0 and Pn. Starting at D0, we extend sidewalks from Dm-1 to Dm (0 ≤ m < n), then finally connect to Dn. Dm-1D
m
is a parallel line segment of Pm-1Pm. The 2D coordinates


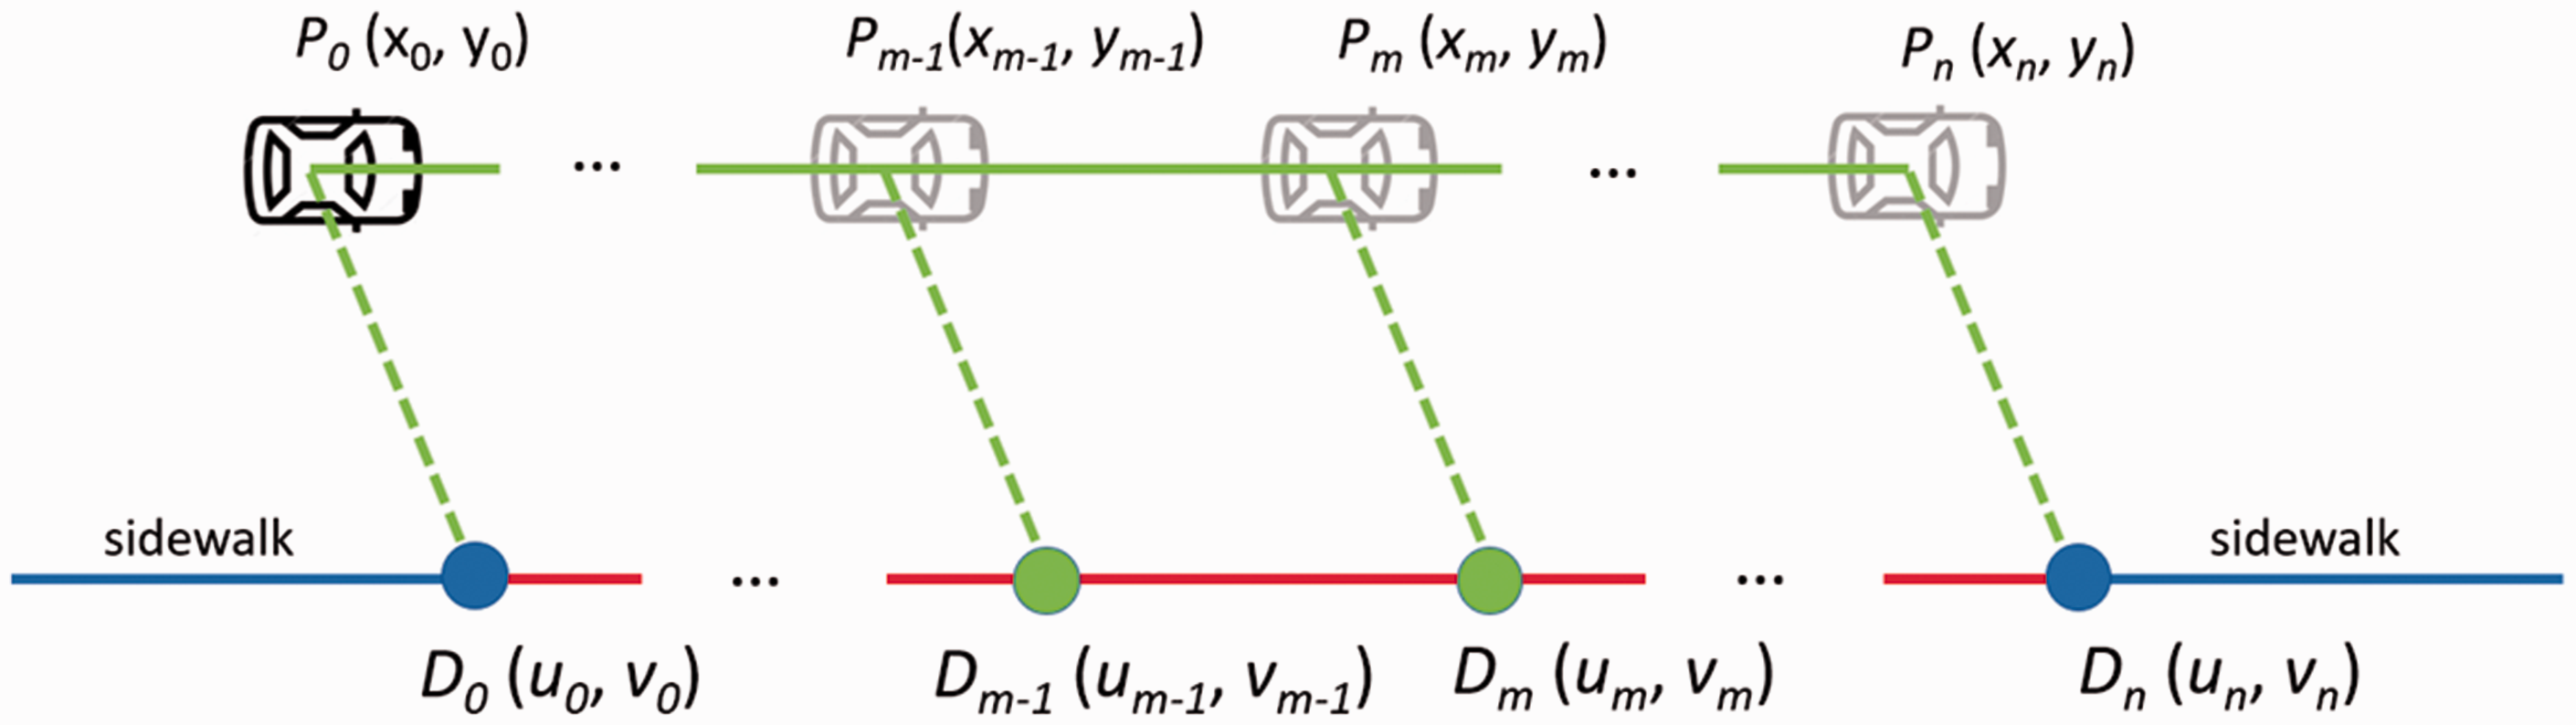
Extend sidewalks to connect a pair of opposite dangles.
Results
We used the trained YOLACT to extract sidewalks pixels in the test set of 50 tiles. In our experimental environment of an Nvidia 1080 Ti GPU, an aerial image tile (5000 × 5000 pixel) took about 70 seconds to be segmented, and a street view thumbnail (1024 × 768 pixel) needs 1 second. The inferencing time is about 100 km2/hour. The trained model inferences each tile patch by patch, using the same patch size as the training sample (256 × 256 pixels). The inferencing results were merged into tiles of the original dimension for the following evaluation.
Figure 7 shows a tile in the test set. Most sidewalks in this tile were detected, including some short and scattered sidewalks which were not represented in the ground truth. Also, YOLACT mistakenly labeled some pixels as sidewalks. Nineteen gaps were filled based on street view images.
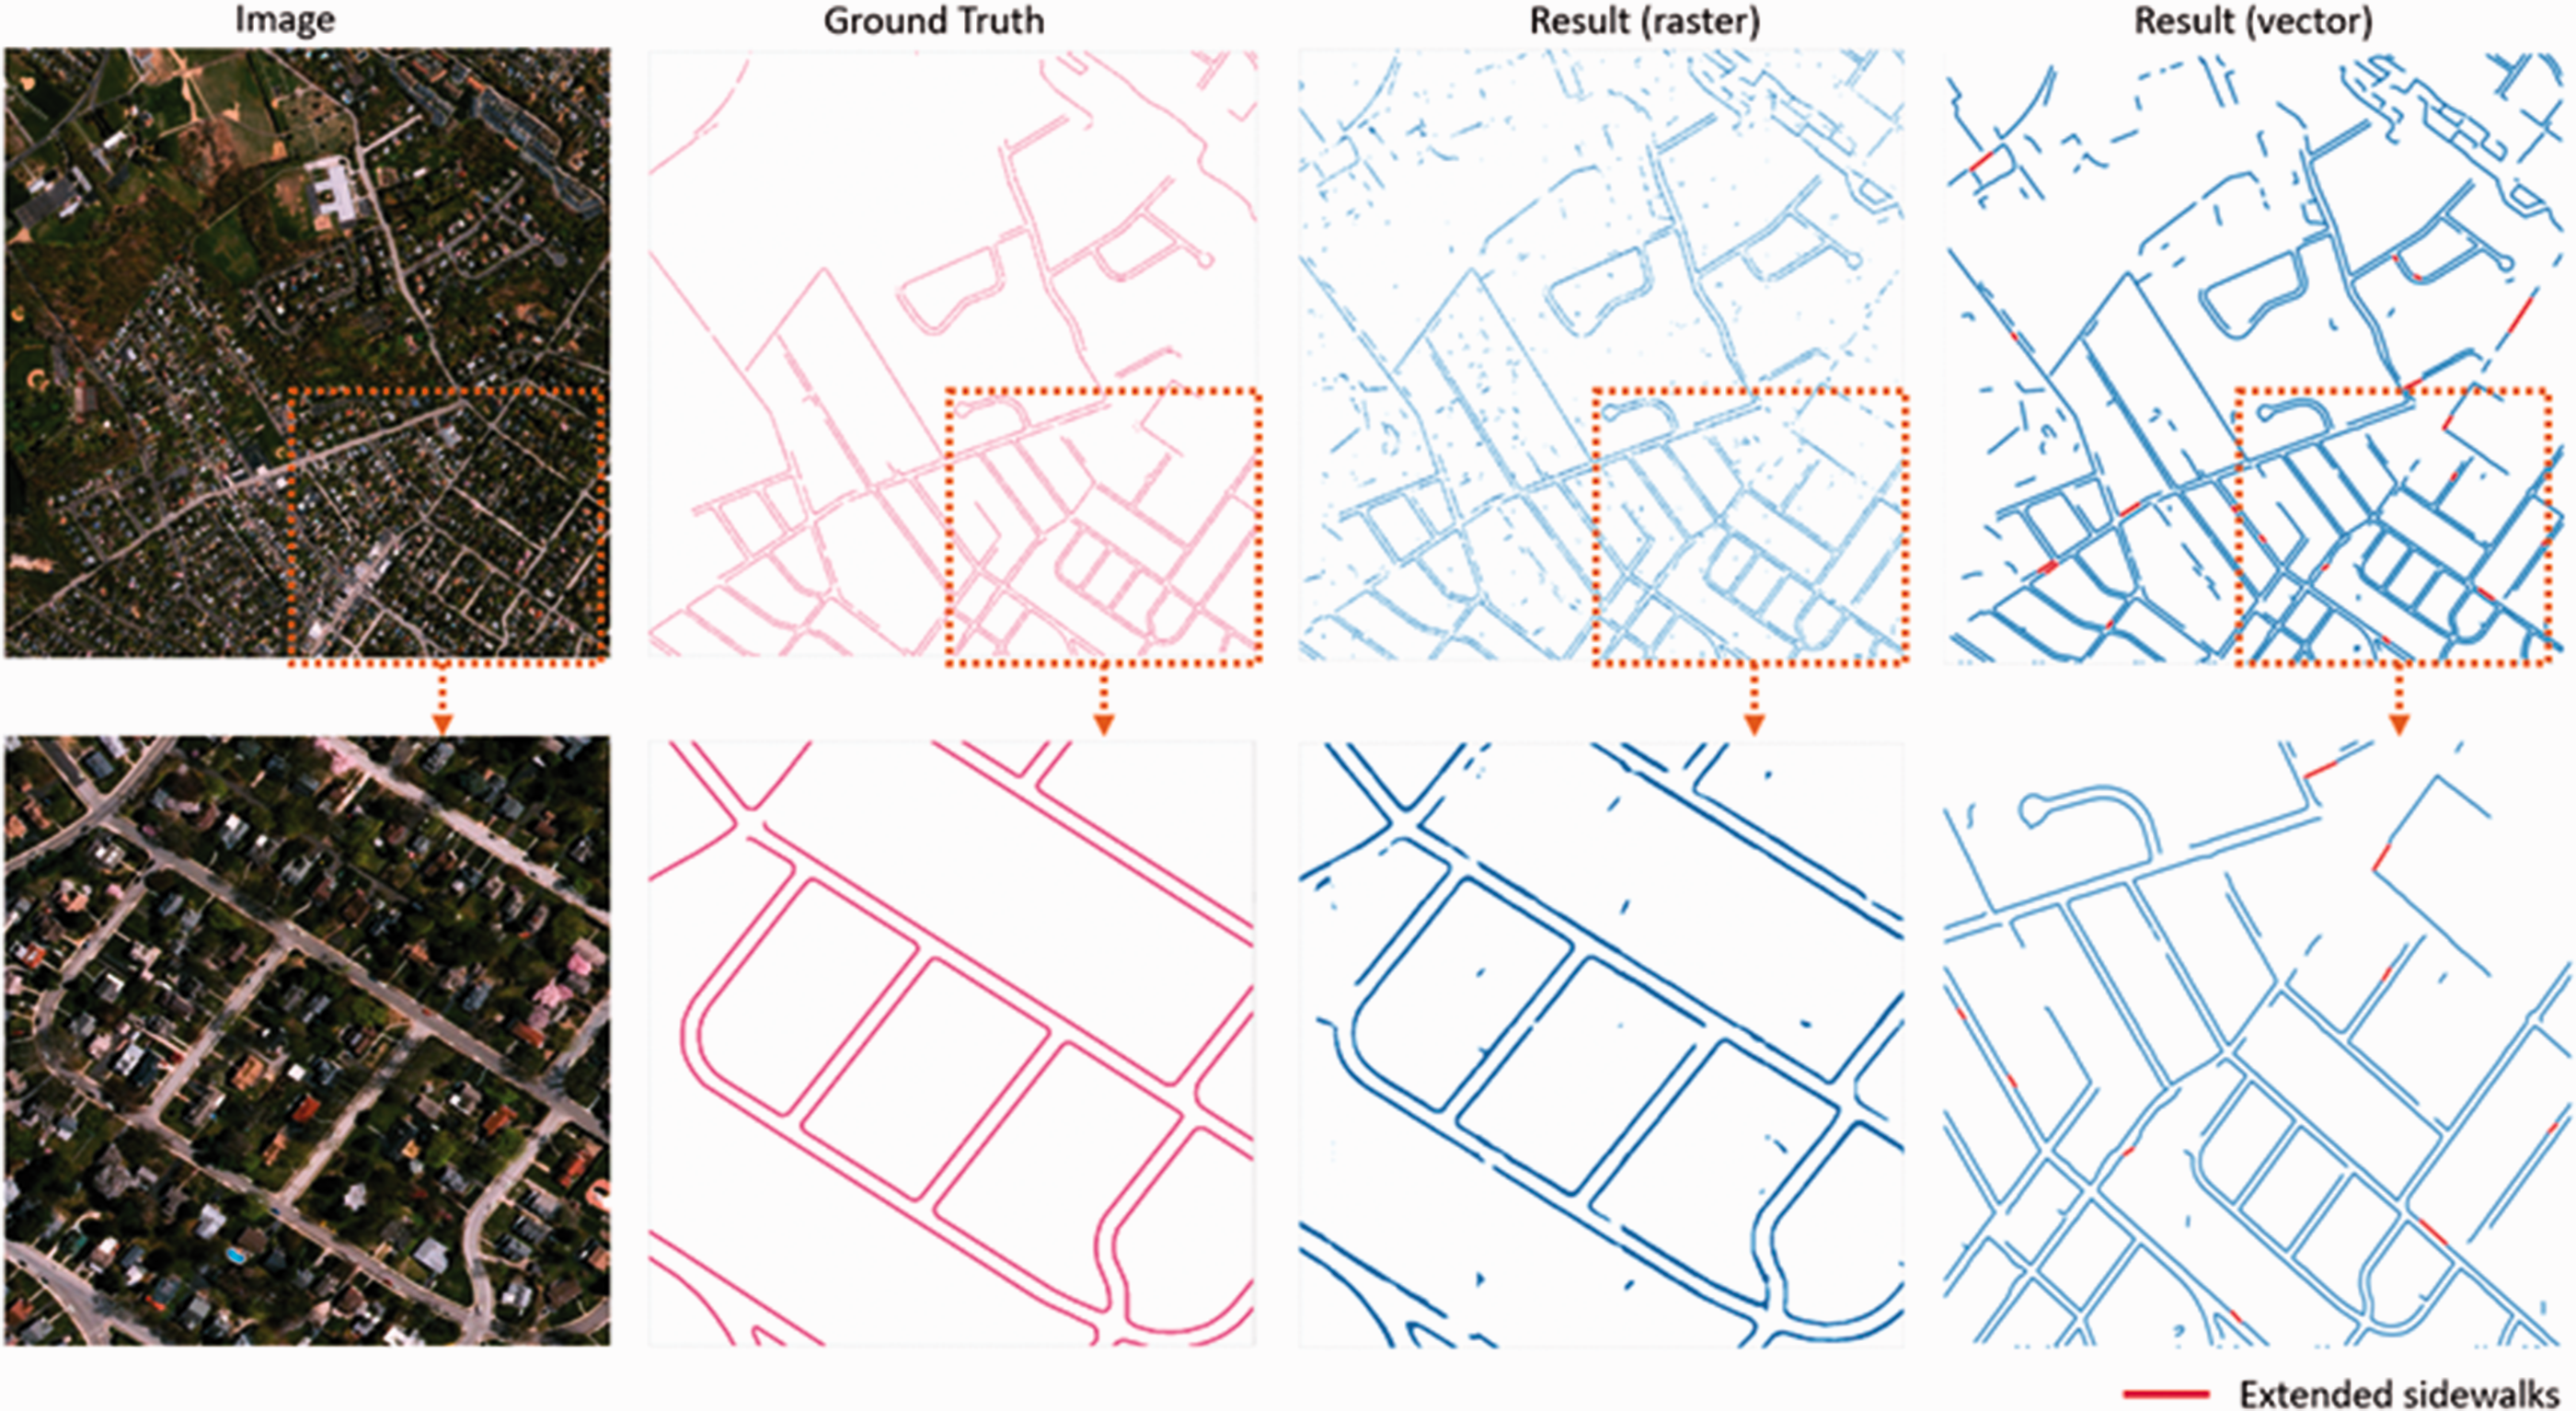
Sidewalk detection results of YOLACT.
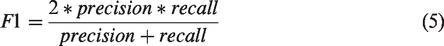
We used precision, recall, and F1 score calculated by equations (3) to (5) to evaluate results. Comparing the sidewalk pixels in the resulting raster with label raster (ground truth) leads to a precision of 0.5508 and a recall of 0.7488. However, this straightforward, pixel-wise metric cannot appropriately reflect the performance in our case. First, the sidewalk width is small (about 5 pixels), so a minor location error of the segmentation result, even a pixel, will significantly lower the precision and recall. Second, the sidewalks' centerlines (used as labels) are not exactly centered on the sidewalks in the image because that they were not derived from the image used in this study, and minor location errors are permitted in digitalizing products. Therefore, we view the sidewalk pixels as correct if they are near the ground truth within a tolerance. The tolerance was set to 2 meters in our research because the image and ground truth may have a registration error of about 2 m in some places.


When a segment of results near the ground truth within a buffer width of 2 meters, it is correct; when a segment of ground truth near polylines of results within 2 meters, it is recalled. We split extracted sidewalk polylines and ground truth into line segments of 3 m, then used the length of these line segments to calculate precision and recall. When using this line-wise evaluation, the precision, recall, and F1 reached 0.7987, 0.9244, and 0.8569, respectively (Table 1). This significant improvement shows the actual performance of the trained model.
Precision and recall of segmentation results.
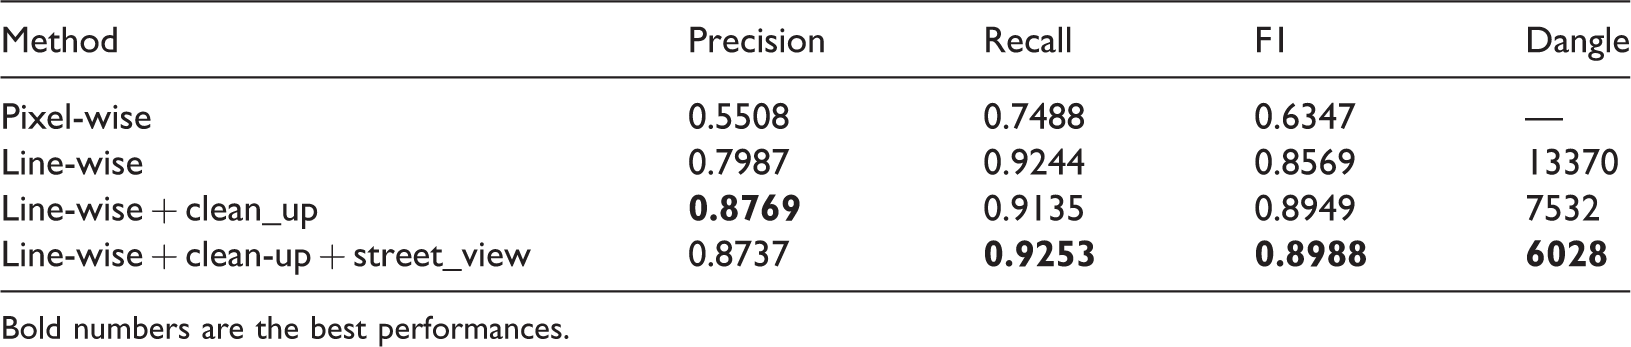
Bold numbers are the best performances.
If bringing external data source to clean the noise, mostly bright linear features and internal sidewalks of neighborhoods, the precision will be higher. We obtained road centerlines of the study area, then cleaned up the sidewalk results away from road centerlines more than 15 meters. Then, the precision increases to 0.8769, recall decreases to 0. 9135, while F1 score rises to 0.8949.
In the test set of 50 tiles, sidewalk polylines derived from segmentation results has 13,370 dangles. Note that the dangles near the tile boundaries were excluded for fair assessment because they were caused by tile boundaries rather than occlusion. A total of 7532 dangles are near road central lines with 15 meters, and 4240 of them have Google Street View images within 15 meters. About 19.8 km of missing sidewalks have been restored, and recall was increased by 1.2%. F1 score rose to 0.8988, better than using aerial images only (0.8949).
Meanwhile, 1504 dangles (20.0%) were connected, which means the sidewalk network's connectivity has been largely improved. Figure 8 shows examples of extended sidewalks. These samples indicate that some sidewalks occluded by shadow and canopies can be restored if the corresponding street images clearly show the sidewalks.

Extended sidewalks based on street view images. Street View Imagery © Google.
Discussion
When introducing road central lines to remove noise, the precision and recall of the sidewalk extraction results are 0.8737 and 0.9253, respectively. Table 2 shows the comparison between our result and the ones from previous studies. Though these results come from different datasets and are not comparable, the figures indicate that our method outperforms the cited research with a large margin. Agencies that want to extract sidewalks cost-efficiently can use the proposed method, which utilizes the presence of sidewalks in street view images to improve the connectivity of sidewalk networks extracted from aerial images.
Assessment of sidewalk extraction results.
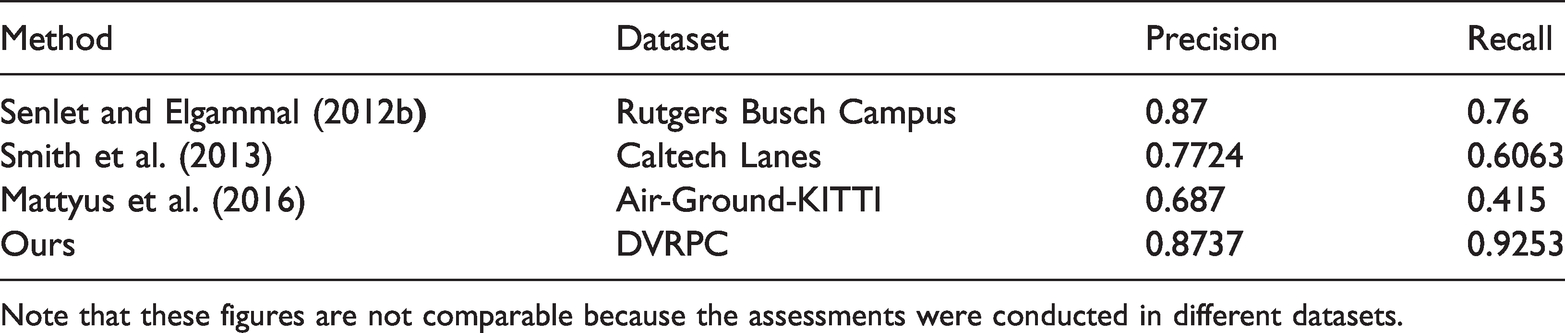
Note that these figures are not comparable because the assessments were conducted in different datasets.
As a supplementary data source, street view imagery provides free, reliable, ground-level observation for occluded or missing sidewalks. Appropriately using street view images can refine the network of sidewalks derived from aerial images. In our case, the use of street view images increases the recall by 1.2% and largely improves the connectivity of the sidewalk network by connecting 20.0% dangles.
Given the high precision and recall of the proposed method, the results can serve as a valuable data source for urban operation. For example, school districts can assess walking to school safety, and department of city planning can promote active design through shaping the sidewalk experience. The Google Street View images used in the case study have been blurred on the sensitive information to protect privacy, such as human faces and license plates. When researchers use their equipment such as GPS-enabled cameras or cell apps to collect street view images, they may need to use similar approaches to address the privacy concern.
Conclusion
This paper demonstrates that the sidewalk, a small linear object, can be extracted by integrating the detection results from aerial and street view imagery. Aerial imagery is the primary data source of sidewalks' extraction, while street view imagery is supplementary data and is used to detect occluded sidewalks in the aerial images. Based on the depthmap from the Google Street View map, the segmentation results of the street view imagery was reprojected to the projected coordinate system as a land cover map. The sidewalk extracted from aerial images can be extended if there are sidewalk segments in the land cover map. In the study case, street view images help increase the recall by 1.2% and significantly improve the sidewalk network's connectivity by connecting 20% dangles. Our research provides a comprehensive method to combine overhead and street-level observation for an integrated understanding of urban environments.
In the follow-up studies, this research can be extended in several aspects. For instance, the municipal agencies might expect to extract more information about sidewalks, such as condition, slope, obstacles, and junctions with crosswalks. Many high-resolution street view images have captured enough details to provide such information. Also, for further utilization of street view images, accurately restoring objects' location is needed. The proposed method relies on very high-resolution overhead and street view imagery. Using UAV is a cost-effective way to produce images (Chen et al., 2020). For those roads without street view images or the image is outdated, our method cannot restore the missing sidewalks. More methods, such as multispectral imaging and LiDAR, are needed to see through canopies, shadow, or building projection displacement and then sense the sidewalk's narrow concrete surface. Prior knowledge can also be introduced, such as the co-occurrence of sidewalk and street trees, sidewalks and large buildings.
Supplemental Material
sj-pdf-1-epb-10.1177_2399808321995817 - Supplemental material for Sidewalk extraction using aerial and street view images
Supplemental material, sj-pdf-1-epb-10.1177_2399808321995817 for Sidewalk extraction using aerial and street view images by Huan Ning, Xinyue Ye, Zhihui Chen, Tao Liu and Tianzhi Cao in EPB: Urban Analytics and City Science
Footnotes
Declaration of conflicting interests
The author(s) declared no potential conflicts of interest with respect to the research, authorship, and/or publication of this article.
Funding
The author(s) received no financial support for the research, authorship, and/or publication of this article.
Supplemental material
Supplemental material for this article is available online.
References
Supplementary Material
Please find the following supplemental material available below.
For Open Access articles published under a Creative Commons License, all supplemental material carries the same license as the article it is associated with.
For non-Open Access articles published, all supplemental material carries a non-exclusive license, and permission requests for re-use of supplemental material or any part of supplemental material shall be sent directly to the copyright owner as specified in the copyright notice associated with the article.