
Abstract
Extreme heat exposure and sensitivity have been a growing concern in urban regions as the effects of extreme heat pose a threat to public health, the water supply, and the infrastructure. Heat-related illnesses demand an immediate Emergency Medical Service (EMS) response since they might result in death or serious disability if not treated quickly. Despite increased concerns about urban heat waves and relevant health issues, a limited amount of research has investigated the effects of heat vulnerability on heat-related illnesses. This study explores the geographical distribution of heat vulnerability in the city of Austin and Travis County areas of Texas and identifies neighborhoods with a high degree of heat vulnerability and restricted EMS accessibility. We conducted negative binomial regressions to investigate the effects of heat vulnerability on heat-related EMS incidents. Heat-related EMS calls have increased in neighborhoods with more impervious surfaces, Hispanics, those receiving social benefits, people living alone, and the elderly. Higher urban capacity, including efficient road networks, water areas, and green spaces, is likely to reduce heat-related EMS incidents. This study provides data-driven evidence to help planners prioritize vulnerable locations and concentrate local efforts on addressing heat-related health concerns.
Keywords
Introduction
Urban heat exposure and sensitivity is a developing concern in urban societies, as the metropolitan heat island effect causes substantially higher temperatures in urban regions compared to adjacent rural surroundings, posing a significant climate-related hazard (Bixler et al., 2021). Extreme heat events, increased due to climate change, threaten public health, the water supply, and the state’s infrastructure in urban areas (Luber and McGeehin, 2008; Mitchell et al., 2016). Heat-related illnesses, which often arise due to extreme heat events, require extremely time-sensitive Emergency Medical Services (EMS), given that heat-related illnesses can cause permanent disability or death if emergency treatment is not provided in a timely manner (CDC, 2011; Luber and McGeehin, 2008). Thus, it is important to understand the relationship between extreme heat vulnerability and local EMS service accessibility.
More recent studies have made advances in understanding if urban heat vulnerability is associated with heat-related illnesses. Studies have demonstrated that environmental factors and urban landscape features are critically significant in heat-related health (Kim and Kim, 2017; Peng et al., 2016), while research on heat sensitivity that causes particular populations to be more vulnerable to heat exposure has proven that heat-related illnesses increase with low socioeconomic status (Li et al., 2021a). However, there has been limited research on whether heat adaptive capacity in urban areas is associated with heat-related illnesses and can alleviate detrimental health outcomes, given the context that heat vulnerability is anchored by three pillars: sensitivity, exposure, and adaptive capacity (Inostroza et al., 2016; Mallen et al., 2019). Thus, a comprehensive approach to assessing heat vulnerability must be developed, and the extent to which heat vulnerability components exacerbate heat-related illnesses by region must be predicted. Such an examination will provide evidence for heat-related health interventions from urban planning perspectives and guide policies targeted at addressing spatial disparities in heat vulnerability attributes.
The three primary research objectives of this study are as follows: (1) to identify the geographic distribution of heat vulnerability by integrating urban heat exposure, sensitivity, and adaptive capacity; (2) to determine areas with higher heat vulnerability and reduced accessibility to EMS services; and finally (3) to conduct a regression analysis to investigate the impacts of heat vulnerability (defined by extreme heat exposure, sensitivity, and adaptive capacity) on the incidence of EMS calls.
Urban heat intensity
Extreme heat events have adverse effects on human physiology and health. Exposure to high temperatures for extended periods is a causal factor for various heat-related illnesses, including heat cramps, heat syncope, heat exhaustion, heatstroke and death (Luber and McGeehin, 2008). Extreme heat was the leading cause of death due to weather in the United States from 2000 to 2009 (CDC, 2011). In addition to mortality, extreme heat events can exacerbate existing medical conditions and place more stress on emergency rooms and the hospital system (CDC, 2011). Despite the relatively high mortality of extreme heat events, the epidemiology of extreme heat events is limited due to the non-notifiable conditions and the misclassification of heat-related deaths in the United States. Heat-related illnesses often present a variety of symptoms and exacerbate existing conditions, making it challenging to identify the role of heat (Keatinge et al., 1986; Luber and McGeehin, 2008). This factor, along with the historical lack of common criteria for defining heat-related illnesses, may downplay the true extent to which extreme heat events have on morbidity and mortality (Luber and McGeehin, 2008).
Previous studies on human physiology have attempted to characterize the link between extreme heat exposure and medical outcomes, such as thrombosis (blood clots), serum cholesterol level, atherosclerosis and mortality caused by heart attack or stroke (Guo et al., 2018; Halonen et al., 2011; Keatinge et al., 1986; Petkova et al., 2013). Urban heat islands are used to characterize the tendency for urban areas to be warmer than less developed suburban or rural areas, and its urban heat island effect may contribute to both more intense and longer lasting heat events for urban populations (Heisler and Brazel, 2010; Weber et al., 2015). However, this phenomenon demonstrates a degree of spatial heterogeneity within urban areas due to variations in environmental factors, including land use, vegetation, and built environment (Cheng et al., 2021; Declet-Barreto et al., 2016). In addition, urban heat intensity is perpetuated by socioeconomic characteristics (Anderson and Bell, 2009; Gronlund, 2014; Rosenthal et al., 2014). Hence, such socioeconomic and demographic characteristics that influence individuals’ sensitivity to environmental risks may assist in explaining geographic disparities.
Heat vulnerability
Previous studies have divided heat vulnerability into three major categories as follows: sensitivity, exposure, and adaptive capacity (Cheng et al., 2021; Inostroza et al., 2016; Mallen et al., 2019). Among the key variables that have been utilized to characterize heat exposure, land surface temperature (LST) is one of the most extensively used meteorological indicators in recent research examining heat-related vulnerability and population health hazards (Aminipouri et al., 2016; Buscail et al., 2012; Li et al., 2021a; Weber et al., 2015). The amount of impervious cover area is also commonly used as an indicator as it absorbs energy from the sun resulting in hotter urban environments (Declet-Barreto et al., 2016). Vegetation or tree canopy density has been established as having a regulatory effect on LST (Declet-Barreto et al., 2016).
Heat sensitivity points to variables that may make individuals particularly susceptible to adverse health outcomes due to exposure to extreme heat. Race and ethnicity are crucial variables due to their association with lower income, poorer health conditions, living areas with sparse vegetation and more heat-absorbing surfaces, fewer air-conditioning systems, and/or outdoor labor (Gronlund, 2014; Nayak et al., 2018). Similarly, households with a lower socioeconomic status—often measured by populations below the poverty line or receiving social benefits—may not have the financial resources to access adequate medical care before and after an extreme heat event (Gronlund et al., 2014). Age is another critical factor that increases heat sensitivity. The elderly face chronic illnesses or an inability to regulate body temperature (Basu and Ostro, 2008; CDC, 2017). Infants and young children may have a metabolic activity that produces more heat and lower cardiac output than adults (Bytomski and Squire, 2003; Krous et al., 2001).
Recent studies have explored heat adaptive capacity that considers factors that allow individuals and communities to adjust to extreme heat events. Poor housing and domestic conditions (i.e. housing deterioration with heat-susceptible exterior walls, the unavailability of an air-conditioning system to cool the house during heatwaves, limited access to internet or telephone services) may expose susceptible residents to extreme heat, restricting access to local resources designed to mitigate extreme heat events such as cooling stations and weather forecasts. In addition, social isolation makes it harder for individuals to travel to cooler locations or contact EMS if they start experiencing early symptoms of heat-related illnesses (Gronlund et al., 2014). Recent research has also shed light on the vital role of urban infrastructures, such as road networks, urban landscapes, or water bodies, in mitigating heat exposure and heat-related illnesses (Kim et al., 2017; Lee and Brown, 2022).
Extreme heat and emergency medical service
Emergency medical services are essential as there is a small window of time for intervention before health is harmed by heat waves (CDC, 2011; Luber and McGeehin, 2008). Previous studies on extreme heat impacts on EMS services have demonstrated an increase in EMS calls during heat waves (Kue and Dyer, 2013; Lee and Brown, 2022; Zottarelli et al., 2021). Studies have also demonstrated the significant moderating impact of social vulnerability, such as age, race, family composition, and education levels, on heat-related EMS calls (Calkins et al., 2016; Lee and Brown, 2022; Li et al., 2021a; Xu et al., 2013; Zottarelli et al., 2021).
Although research on the influence of extreme heat events on heat-related diseases has thus far concentrated on social vulnerability factors, built-environmental features, and more recently, geographic inequalities, few studies have investigated heat vulnerability as a composite of a model organized by heat exposure, sensitivity, and adaptive capacity, to find the links with heat-related illnesses. Hence, the extent to which communities with increased heat vulnerability, as measured by the three components, report a higher rate of heat-related health consequences should be investigated. Such research will give policymakers data-driven information and guide policies to prioritize communities with increased heat vulnerability and fewer EMS services. To address this gap, our study will focus on the following research questions: • What is the geographic distribution of heat vulnerability in Austin and Travis County regarding heat exposure, sensitivity, and adaptive capacity? • Is the heat vulnerability associated with the response time of EMS services and the number of incidents? • What heat vulnerability factors impact EMS incidents?
Research design
Study area and period
Austin-Travis County, Texas, was selected given the unprecedented urbanization and rapidly increasing urban heat island zones in the area over the past decades. Since 2000, Austin’s economic potential has resulted in population increase and typically accompanying urban difficulties such as housing affordability, a lack of infrastructure, and excessive energy and water utilization. Such issues have been coupled with environmental threats from extreme weather, putting a disproportionate burden on underprivileged populations. The geographic disparity determines the different levels of exposure and sensitivity to climate risks of neighborhoods.
This study is limited to a constrained time period from May to September 2020 and 2021. Figure 1 illustrates the typical weather in Austin based on a historical monthly weather report from 1981 to 2019. The hot season lasts for about 5 months, from May to September, and it is consistent with other studies on heat and health in the U.S. (Calkins et al., 2016; Zottarelli et al., 2021). Average high and low temperatures (ºF) and precipitation (inch) by month in Austin and Travis County. Data Source: U.S. Climate Data.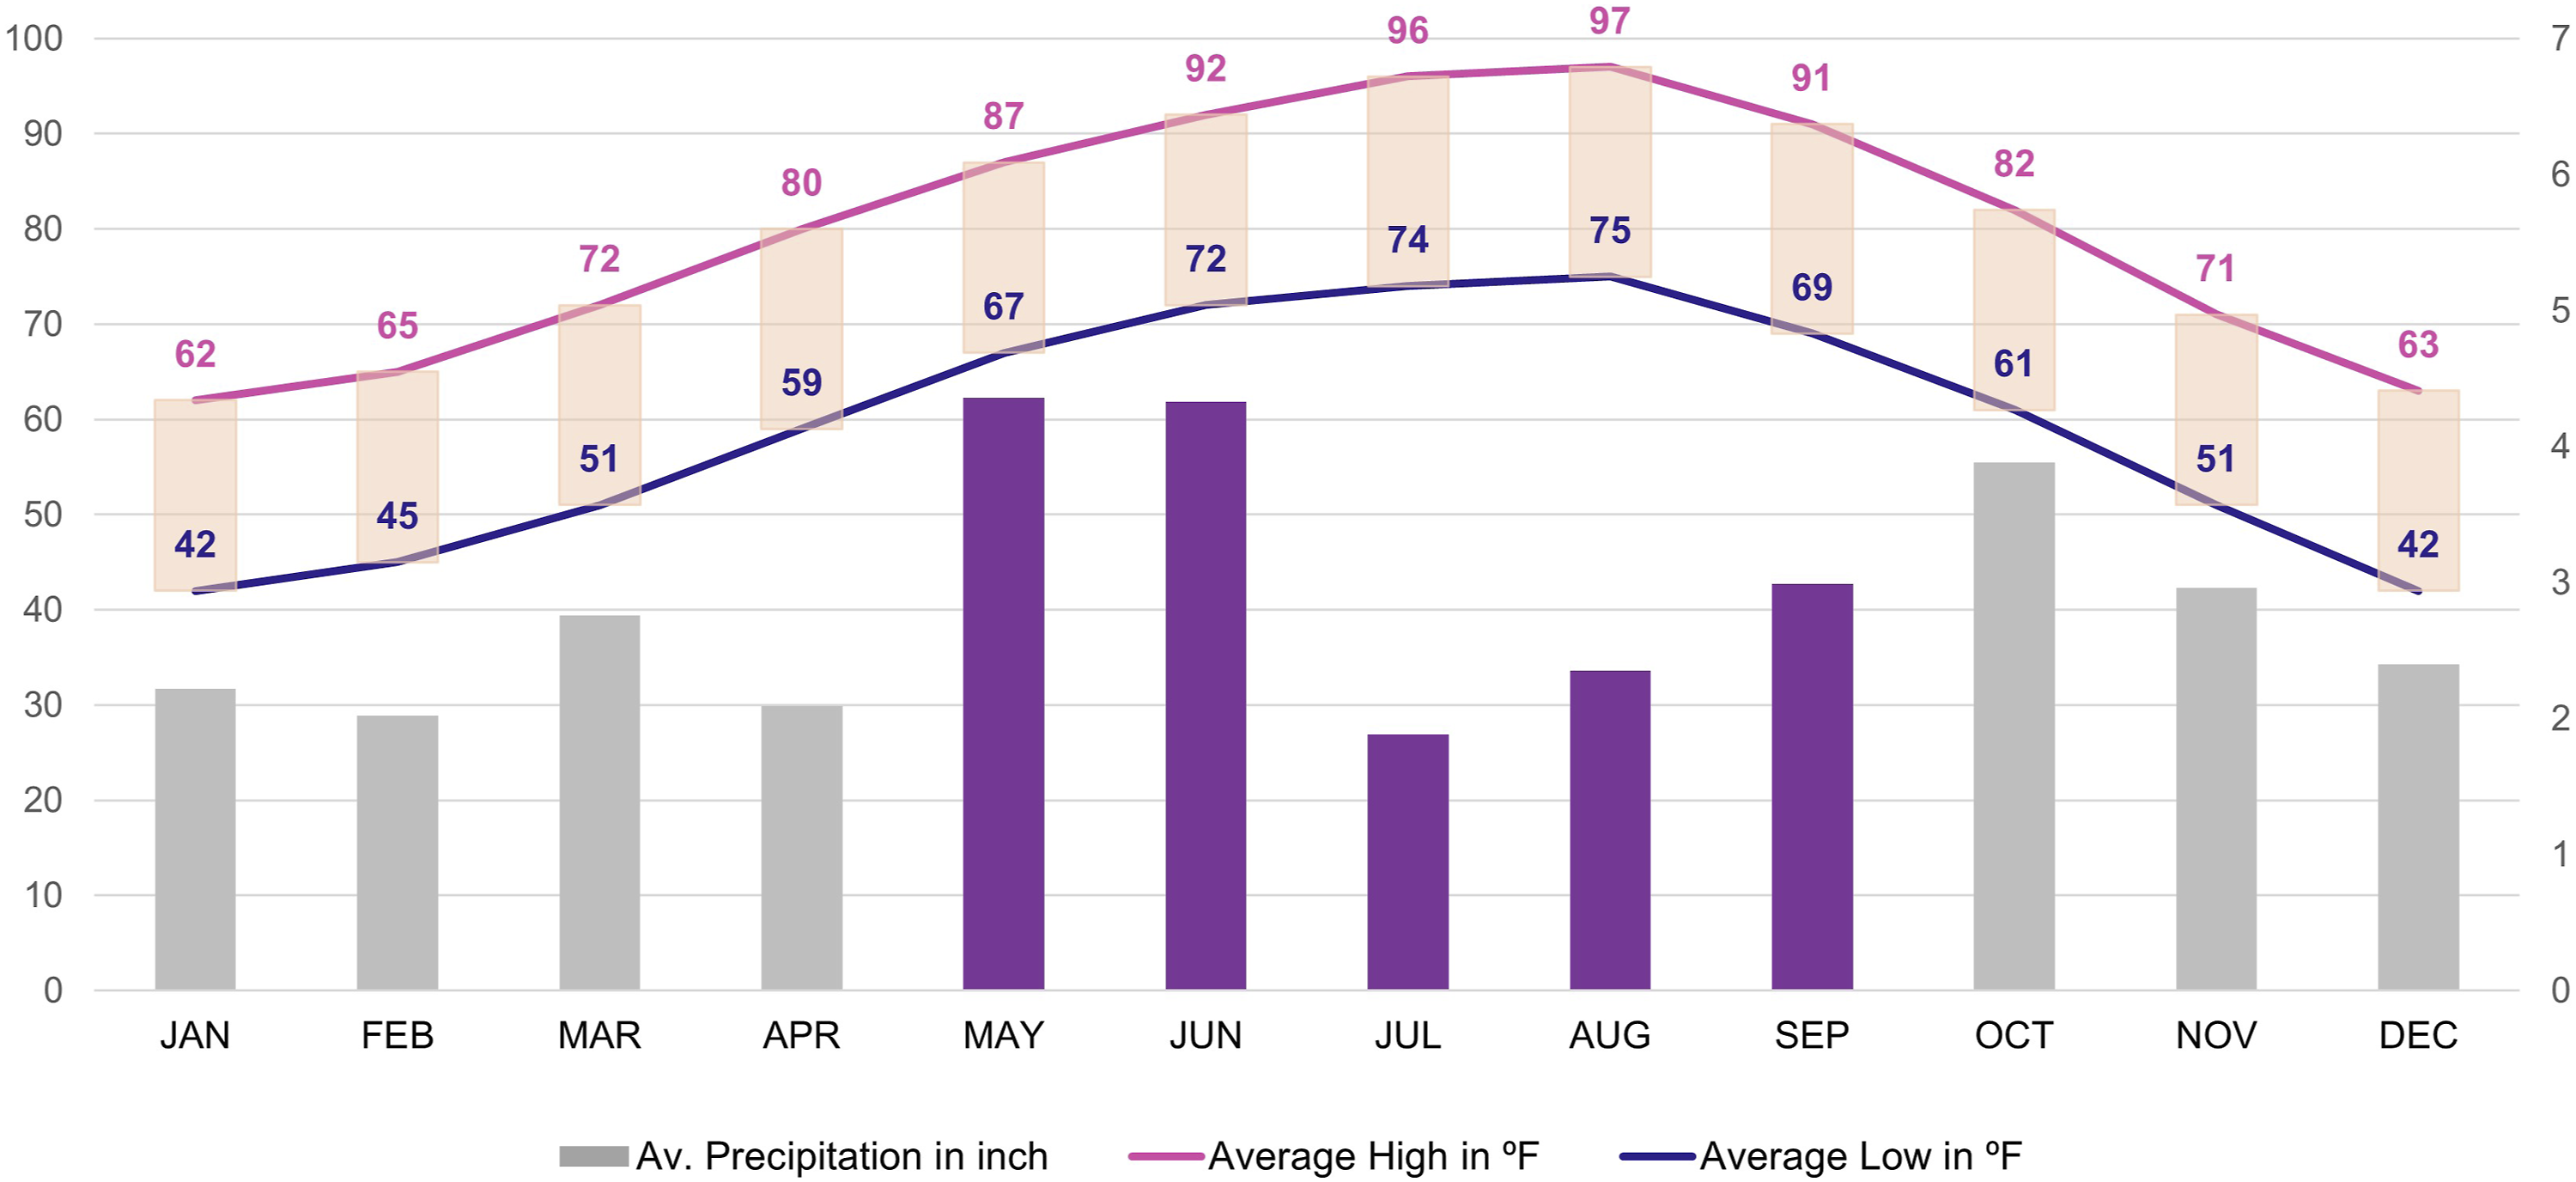
Data sources, construct, and measures
Emergency medical services incidents and response time
The emergency medical services incident data was obtained from the Austin-Travis County Emergency Medical Services (ATCEMS). The time span for this study, the summer season from May to September, was chosen because temperatures in Austin are at their highest, and extreme heat events are much more likely than in other seasons. The number of incidents by month is represented in Figure 2. The number of heat-related EMS incidents from May to September 2020 and 2021. Data Source: ATC EMS Service.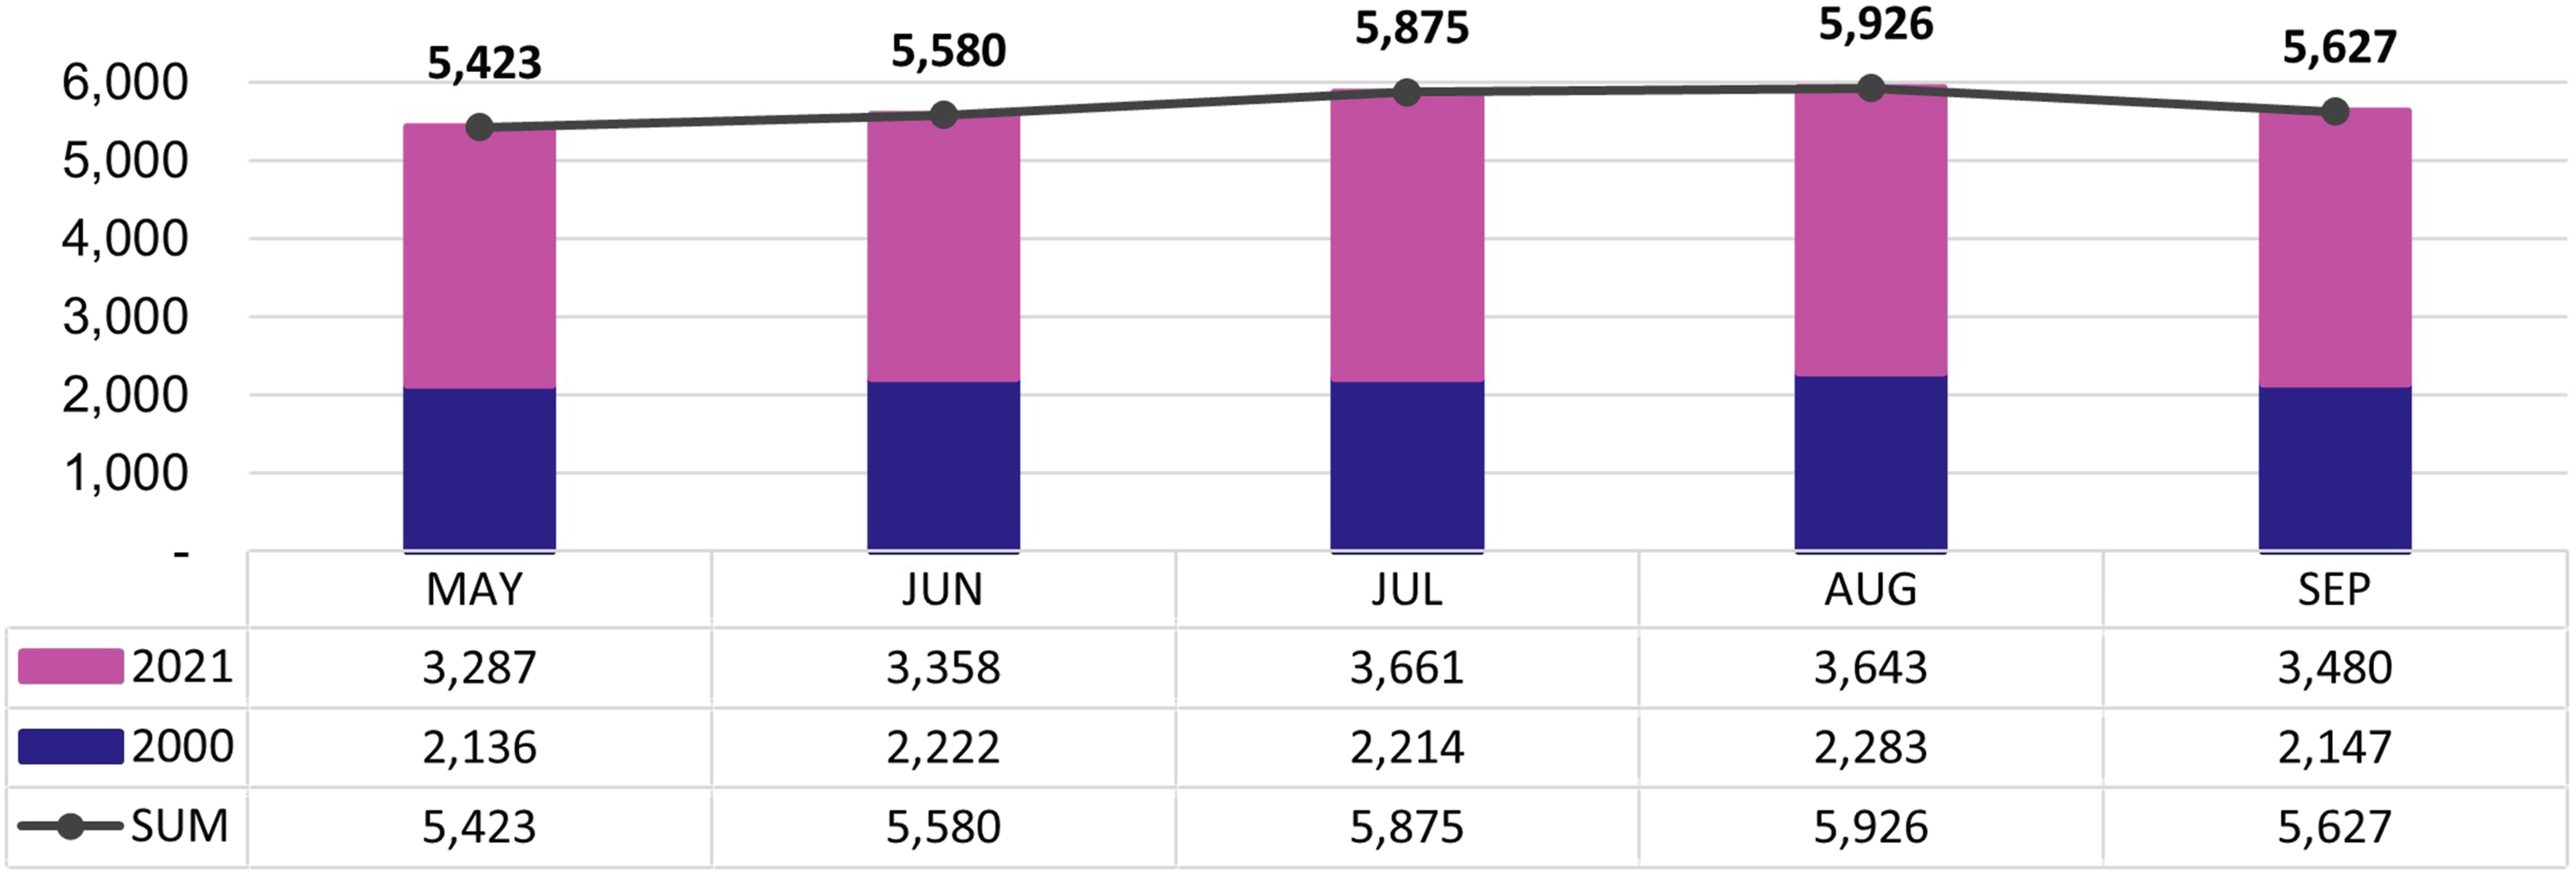
The EMS dataset was cleaned and processed using Python. The data were filtered to include specific calls for heat-related medical conditions, broadly selected as proxy events for extreme heat cases based on the literature (Halonen et al., 2011; Keatinge et al., 1986; Luber and McGeehin, 2008). 1 The total of 28,431 EMS call records were used in this study. Hospital coordinates were then added to the dataset using Google Maps to determine the longitude and latitude of the hospitals listed in the dataset. One component of the reaction time was calculated by subtracting the time when the call was first picked up and when the unit first arrived on the scene. This element indicates how long it took for an ambulance to arrive at the scene of the emergency. Using ArcGIS Pro, the second reaction time component was calculated by estimating the shortest routes using existing road networks and their respective driving times and distances from the call location to the hospital. Then, the total response time was calculated by adding these two reaction times.
Heat exposure
This study considered LST, impervious cover, and tree canopy as proxies for environmental factors measuring heat exposures by region. To determine LST, we used Landsat 8 satellite images available from May to September 2020 and 2021, with land cloud coverage below 20%, and the calculated LST pixel scores were averaged at a block group level. 2 In addition, urban imperviousness and tree canopy layers provide a relative assessment of heat risk phenomena (Bixler et al., 2021). In this study, the digitized Impervious Cover of 2019 data and Tree Canopy of 2018 data were collected through Austin’s Open Data Portal and averaged at the block group level using ArcGIS Pro.
Heat sensitivity
The American Community Survey (ACS) 2015–2019 data from the U.S. Census were collected and geocoded to the corresponding block group using STATA 16.1. We included sensitivity factors: (1) Hispanics, (2) households receiving any social benefit, (3) non-Hispanic Blacks, (4) persons living alone, and (5) children (Inostroza et al., 2016; Nayak et al., 2018; Wilson and Chakraborty, 2019). From the total number of block groups in Travis County (580), two block groups, one that corresponds to Austin–Bergstrom International airport and another that implemented floodplain buyouts, were omitted from the dataset because they have no population.
Heat adaptive capacity
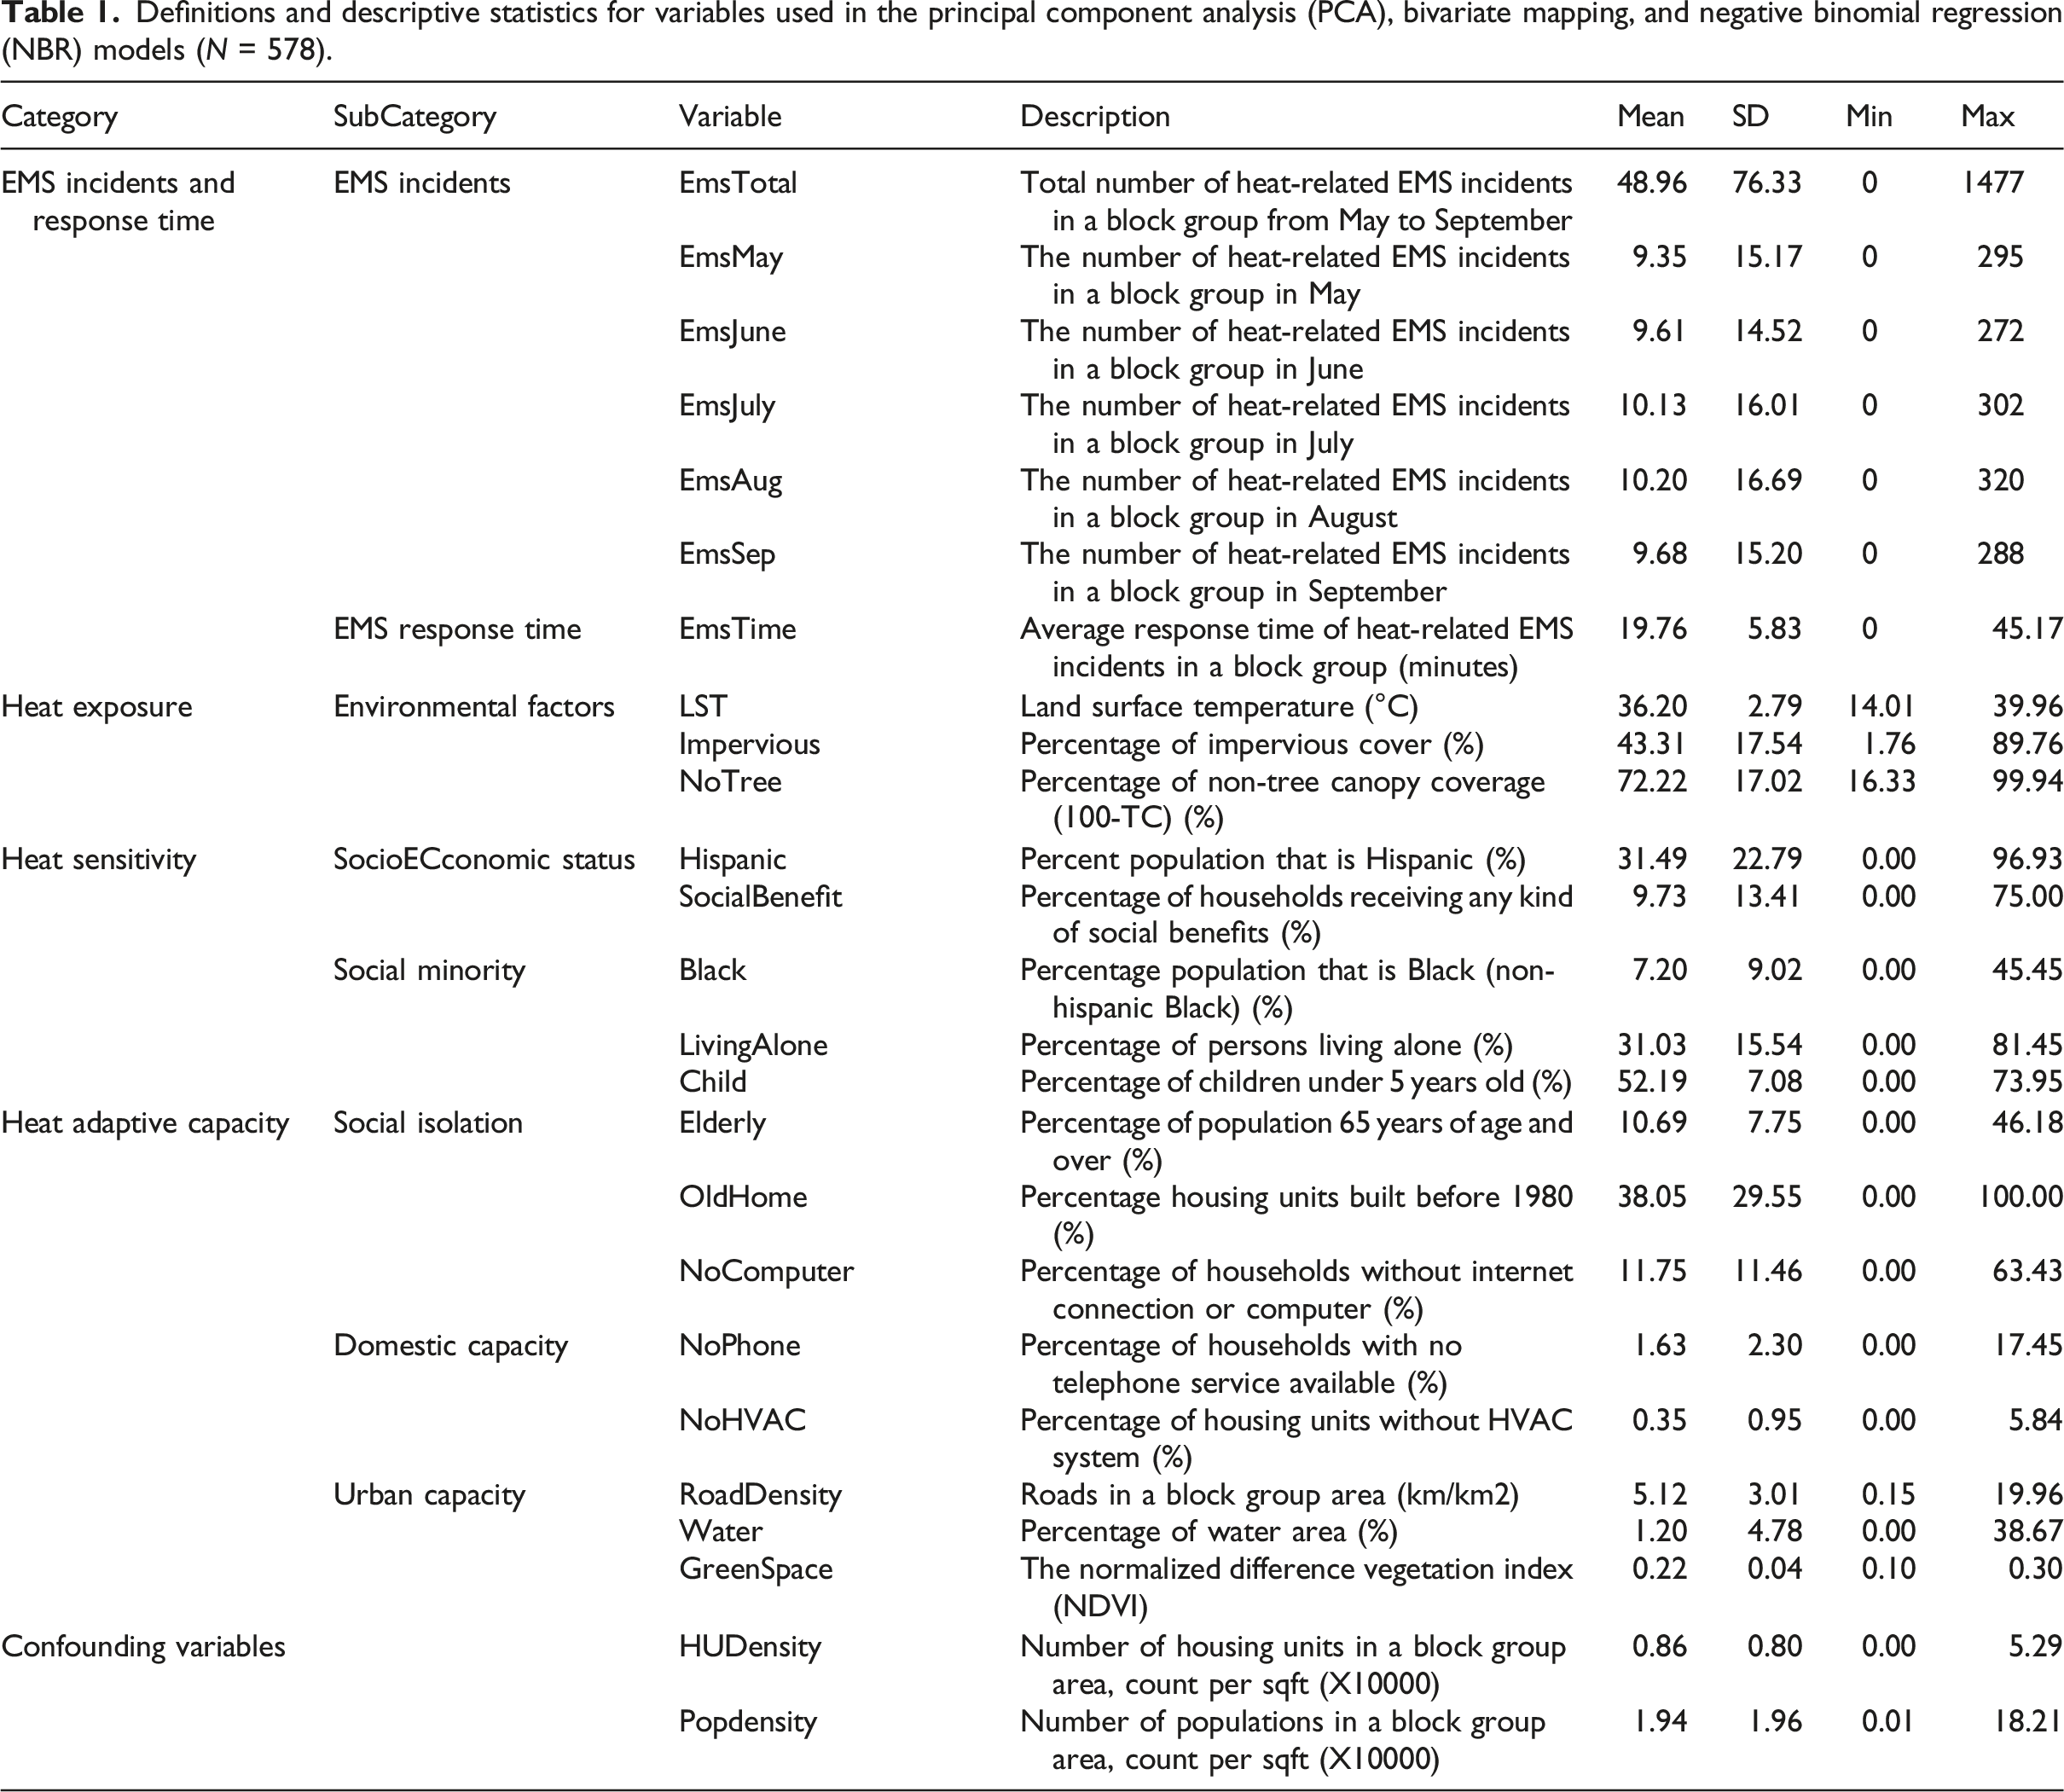
Definitions and descriptive statistics for variables used in the principal component analysis (PCA), bivariate mapping, and negative binomial regression (NBR) models (N = 578).
Methods
Principal component analysis analysis
To develop the heat vulnerability index (HVI) for the Austin–Travis County area, a principal component analysis (PCA) with varimax rotation was performed. This approach helps identify groups of covariant heat risk factors as represented by a number of principal components (PC), which indicate variables with synergistic effects (Wolf and McGregor, 2013). From the 25 initial variables, five variables (the percentage of foreign-born households, those who speak English “less than very well,” below the poverty level, with a disability, and unemployment) were excluded due to data availability at the block group level. The commonly used normalization technique in social indicator research, the min-max feature scaling methods, were then used to normalize the data (Bixler et al., 2021; Tarabusi and Guarini, 2013).
Principal component analysis summary (variance) at the block group level.
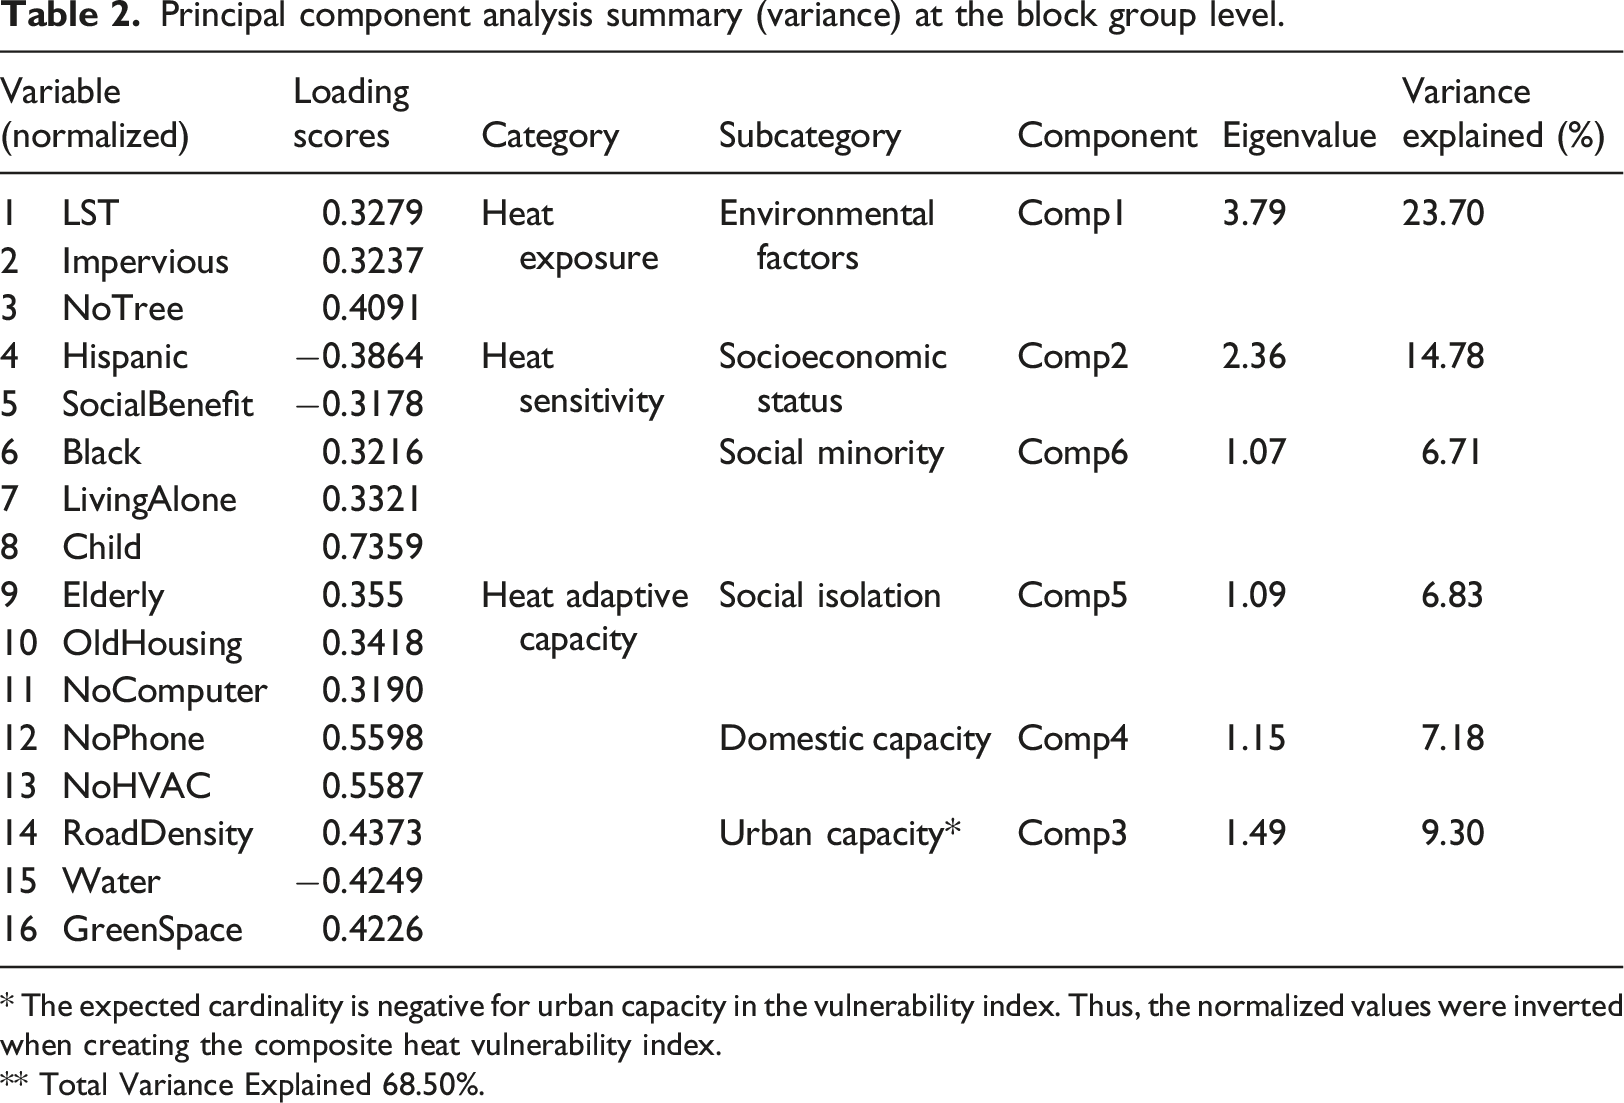
* The expected cardinality is negative for urban capacity in the vulnerability index. Thus, the normalized values were inverted when creating the composite heat vulnerability index.
** Total Variance Explained 68.50%.
Bivariate mapping
In this study, bivariate mapping was utilized to identify overlapping areas with increased heat vulnerability and lower heat-related EMS services. The HVI was generated using the result of PCA on a scale of 0–1, where a score of 0 represents optimal conditions with decreased heat vulnerability and a score of 1 reflects the greatest and worst heat vulnerability scores. Heat-related EMS services were measured by two aspects: their response time and the number of incidents. A longer response time was considered a lower EMS service. Each variable was classified into three discrete classes using quantile classification.
Negative binomial regression (NBR) model
To determine whether the heat vulnerability—including heat exposure, sensitivity, and adaptive capacity—impacts the heat-related EMS incidents, we tested negative binomial regression models, commonly used for a nonnegative count dependent variable with skewed distribution and overdispersion (Ver Hoef and Boveng, 2007). Data preparation and statistical analysis were performed using STATA 16.1. The following distribution provides the probability of y equaling m conditional on the linear combination of x1, x2, … and parameter λ (Long and Freese, 2006).
Compared to Poisson models or zero-inflated models, we chose the negative binomial models because (1) overdispersion exists in the data in that the variance is larger than the mean value (preferring a Poisson model) and (2) there is no excessive number of zeros (favoring than zero-inflated models). In this study, the negative binomial regression models predict an incidence rate ratio (IRR), which refers to the strength of the association between the exposure and the outcome. An IRR greater than 1.0 indicates a positive association or increased rate for the heat-related EMS calls with increased heat vulnerability factors, while an IRR less than 1.0 shows a negative association between the predictors and heat-related EMS incidents. Total counts of incidents were divided into five categories by month from May to September to test NBR models for a monthly comparison. The authors initially conducted univariate analyses to test the impact of heat vulnerability on the EMS incidents. By checking multicollinearity and the statistical significance of each variable with a significant level of 0.10, five variables—LST, NoTree, OldHousing, NoComputer, and—were excluded from the final models.
Results
Heat vulnerability index
Figure 3 exhibits the heat exposure, sensitivity, adaptive capacity, and the composite heat vulnerability index (HVI) in the Austin–Travis County area. The normalized heat exposure index score ranges between 0, denoting a minor amount of exposure to extreme heat, and 1, indicating the most exposure (dark red in Figure 3).
4
Block groups in the urban core and in the north and south of Austin have some heat risk compared to the suburban areas. However, when it comes to the heat sensitivity index, central-east and northeast Austin show higher heat sensitivity scores. Figure 3(c) displays the geographic distribution of the heat adaptive capacity score. For consistency in the cardinality of the values, the direction of the values in urban capacity factors was inverted to represent 0.00 as the lower risk, meaning a higher adaptive capacity, whereas a value of 1.00 represents neighborhoods with a higher risk in adaptive capacity. The distribution pattern is dispersed in Travis County, showing the urban core and central Austin areas at higher risk in adaptive capacity. Finally, Figure 3(d) exhibits the composite HVI score, ranging between 0.00 (most minor heat vulnerability, shaded ivory) and 1.00 (greater heat vulnerability, shaded dark red). There is a definite geographical pattern of block groups with increased heat vulnerability along with the areas of the south, north, and southeast Austin. Heat vulnerability index (HVI) score in the Austin-Travis County area.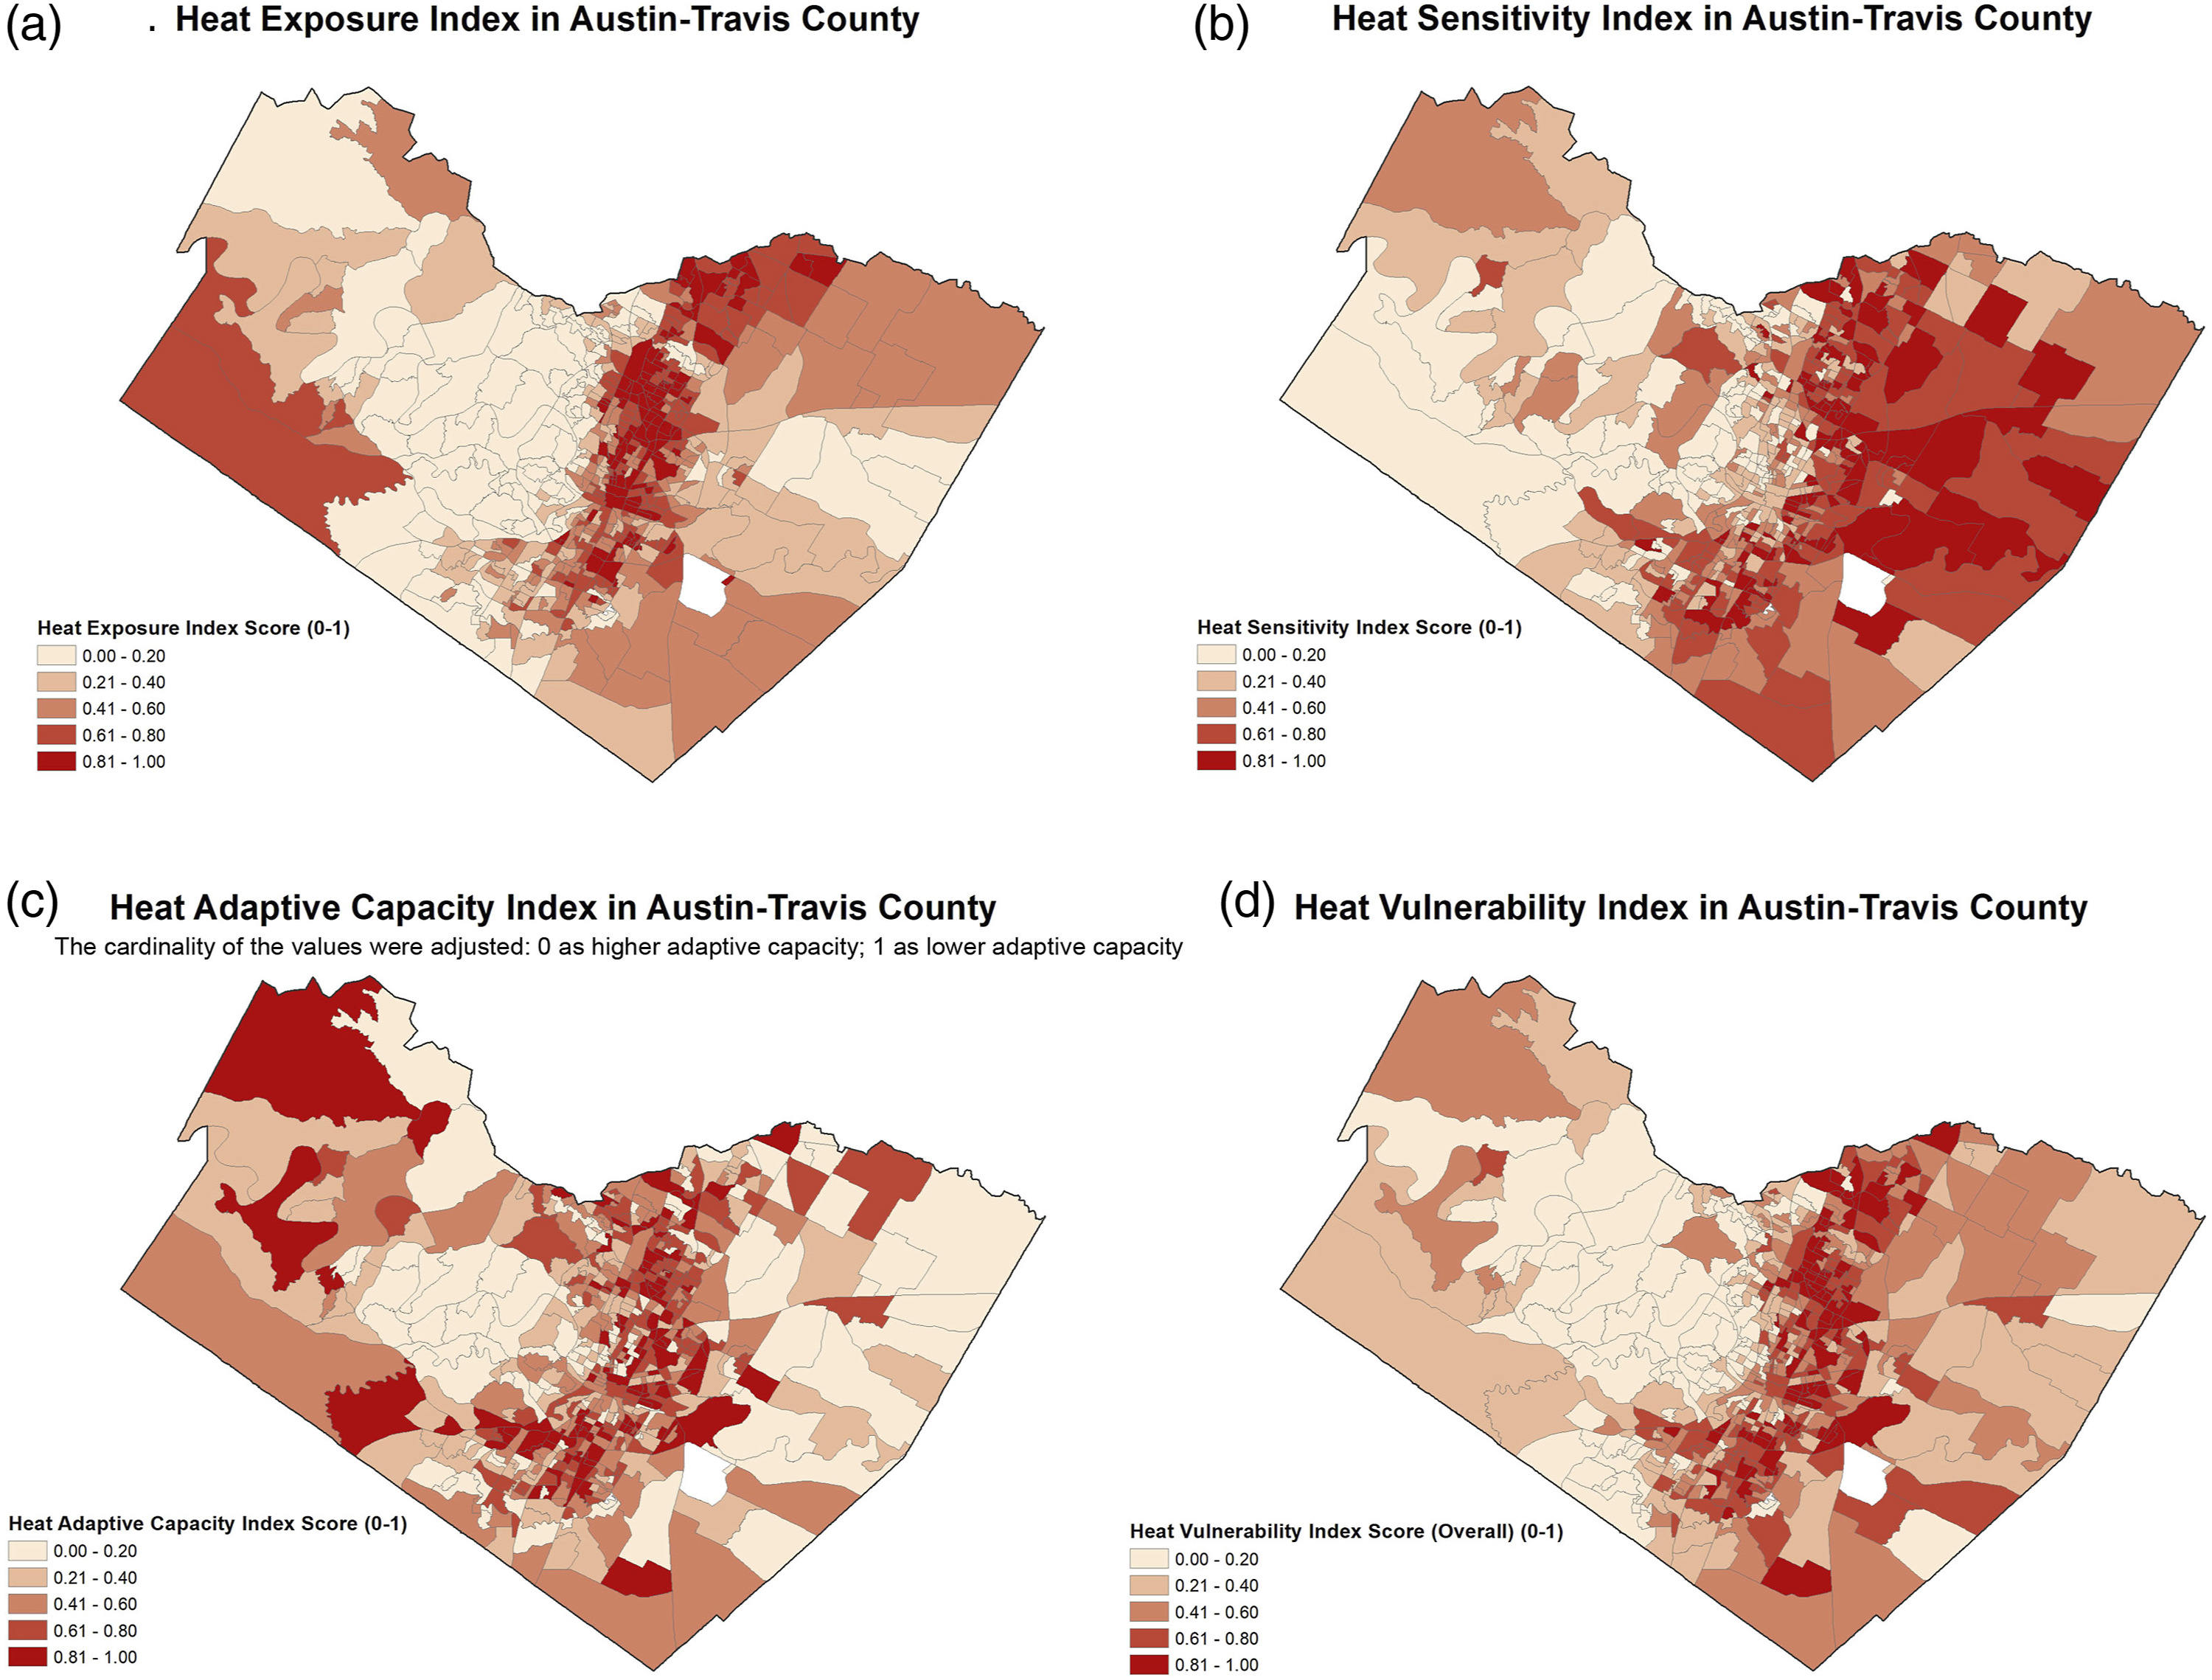
Heat vulnerability and heat-related EMS services
The timely response of EMS, including arriving at the scene and transporting the patient to the hospital, is an essential adaptive factor for extreme heat events, as a delay may result in severe impairment or heat-related death (Cui et al., 2021; Hu et al., 2020; Xiong et al., 2022). As presented in Figure 4(a), the highest levels of concurrence in heat vulnerability and the total response time of heat-related EMS incidents appear in block groups in the peri-urban fringes in the east and north Austin (i.e., Pflugerville), showing an overlapped vulnerability in heat and EMS services. Block groups in urban cores and downtown areas show higher heat vulnerability but a relatively shorter EMS response time due to the proximity to EMS stations and hospitals. In contrast, neighborhoods far away from either EMS stations or hospitals inherently generate longer EMS response times, exacerbating heat-related health outcomes. Bivariate map between (a) the heat vulnerability index (HVI) and total response time of EMS services and (b) the heat vulnerability index (HVI) and the total number of heat-related EMS incidents. Data Source: City of Austin, ATC EMS, TxDOT.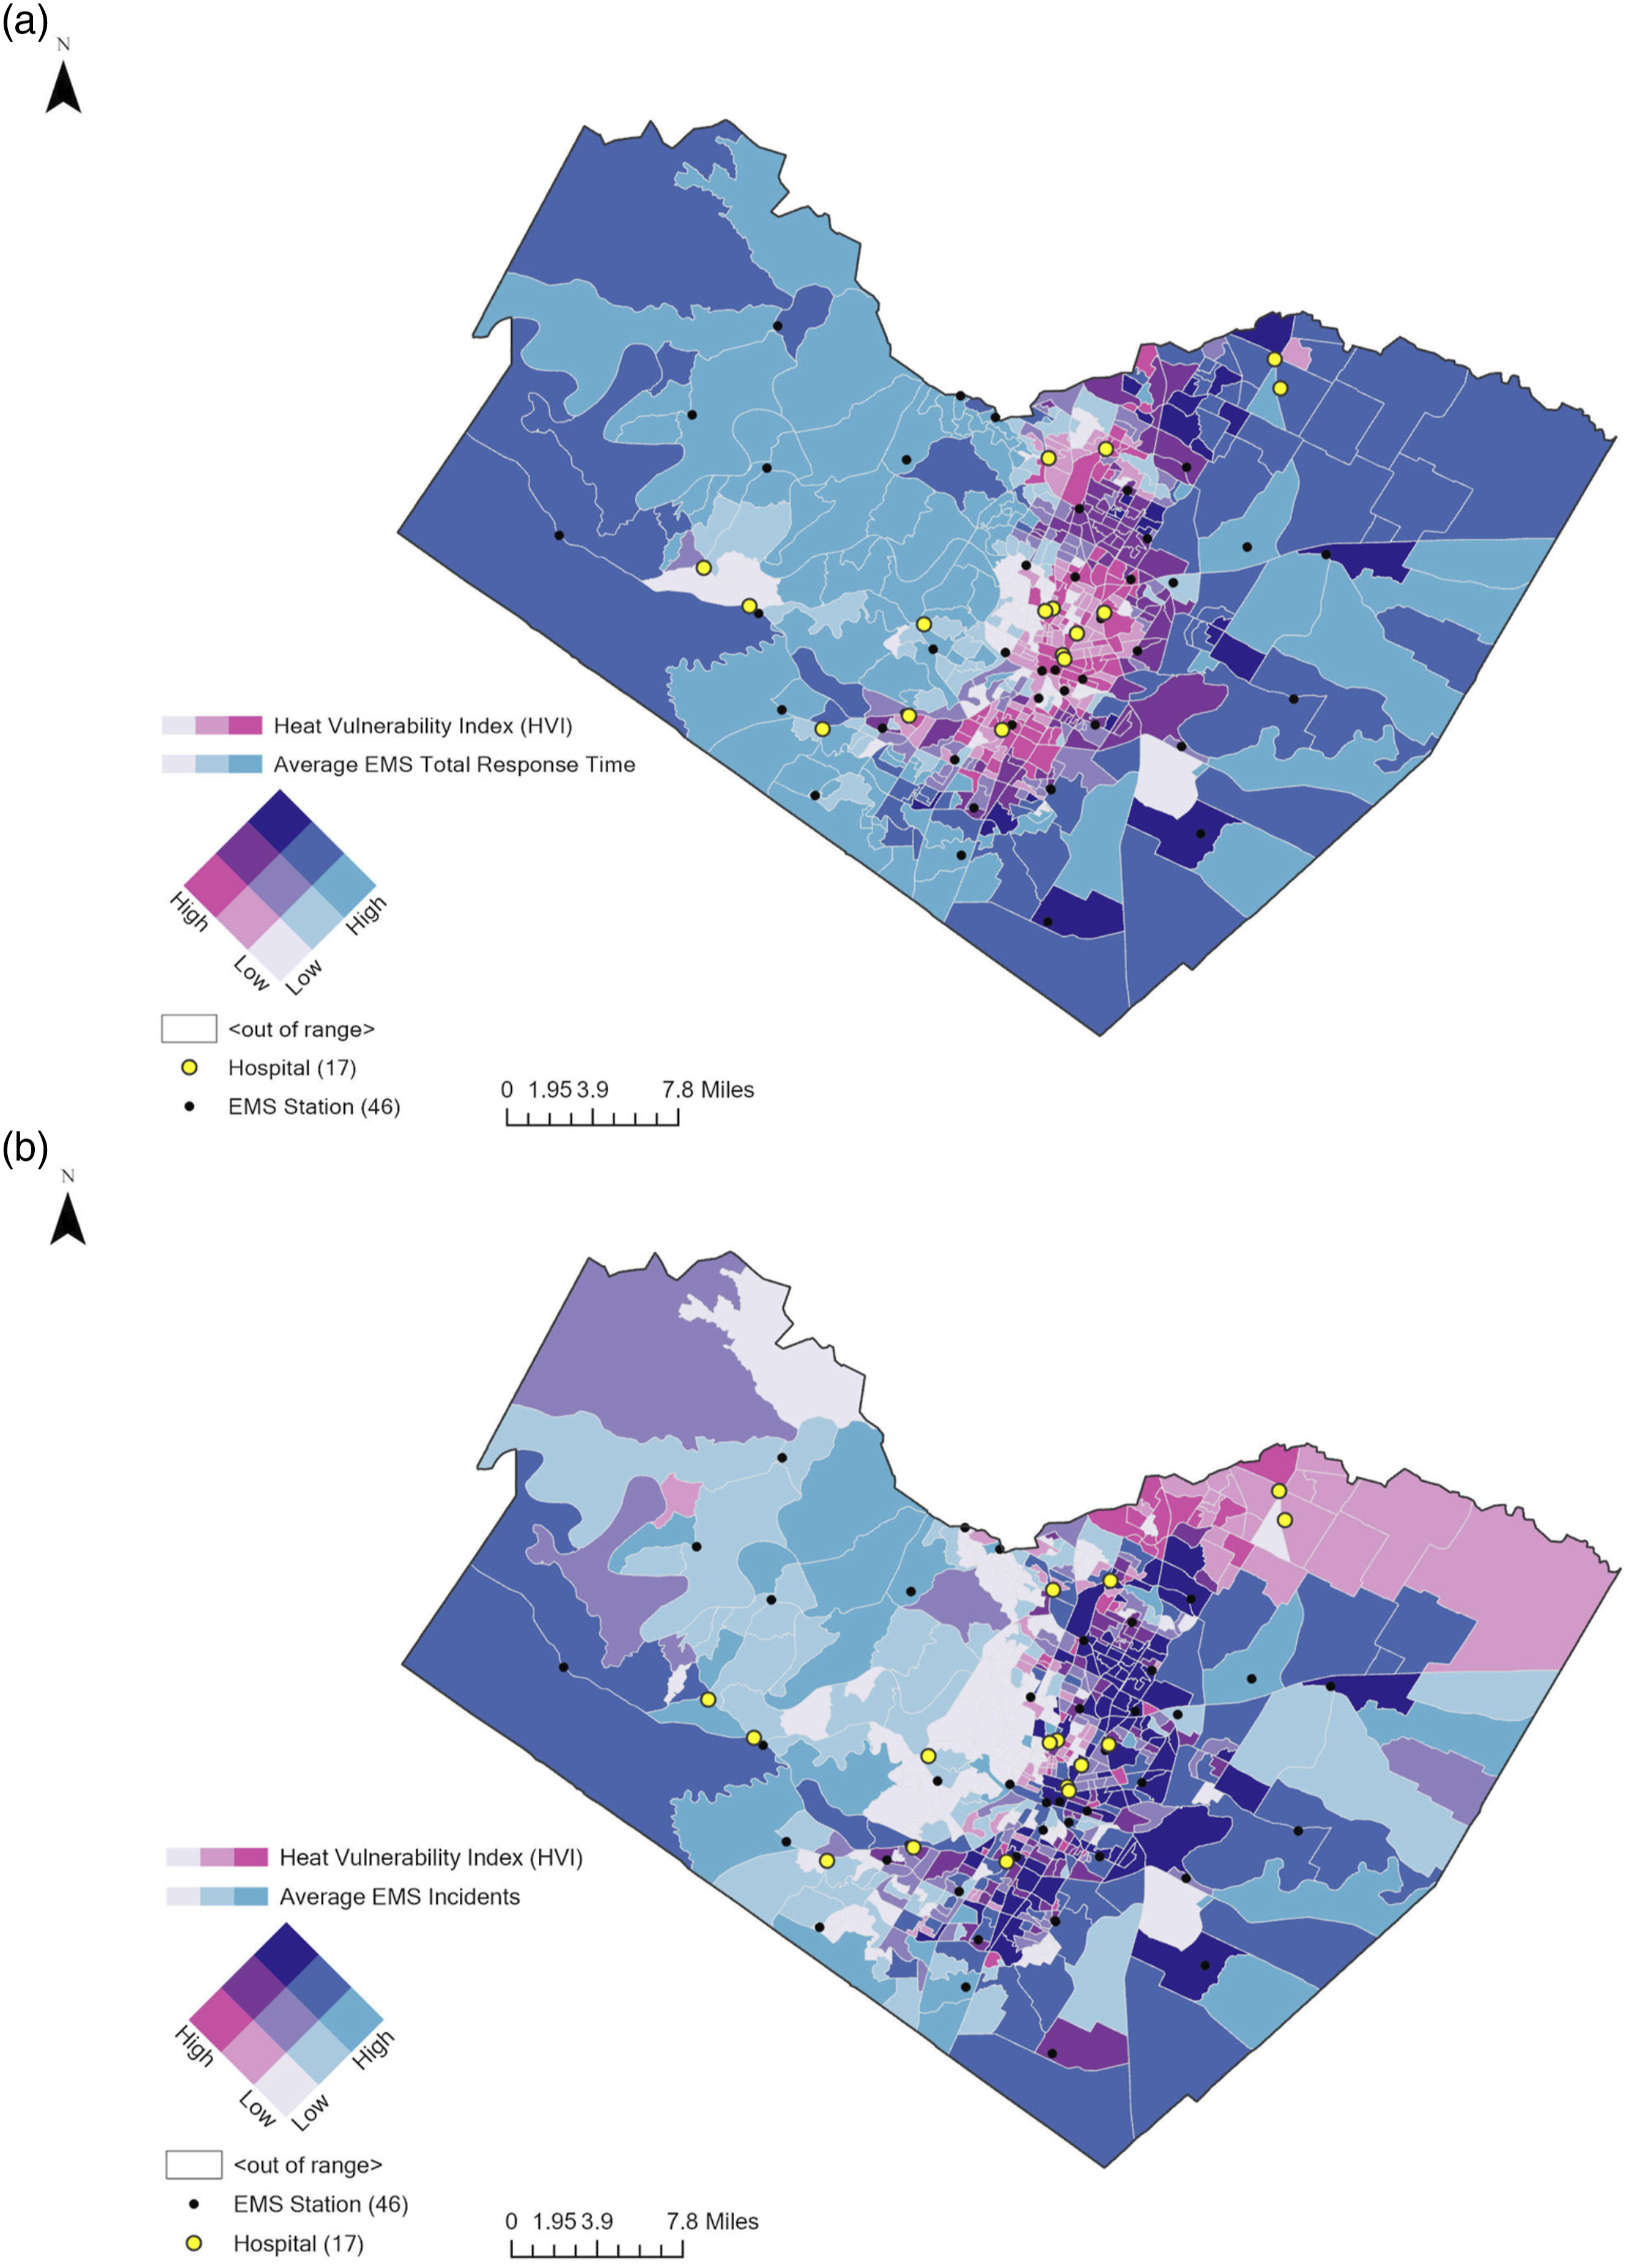
Figure 4(b) shows the overall HVI and the number of heat-related EMS events in Austin-Travis County. Heat-related EMS events are more common in vulnerable downtown regions. Urban centers and east Austin have the largest HVI and heat-related EMS overlap. Hispanic communities had the most overlap between HVI and heat-related EMS cases in north Austin. The next section discusses negative binomial regressions conducted to quantify the relationships between heat vulnerability factors and heat-related EMS incidents.
Impact of heat vulnerability on heat-related EMS incidents
Incidence rate ratios (IRRs) for heat-related EMS incidents with multivariate analysis (N = 578).
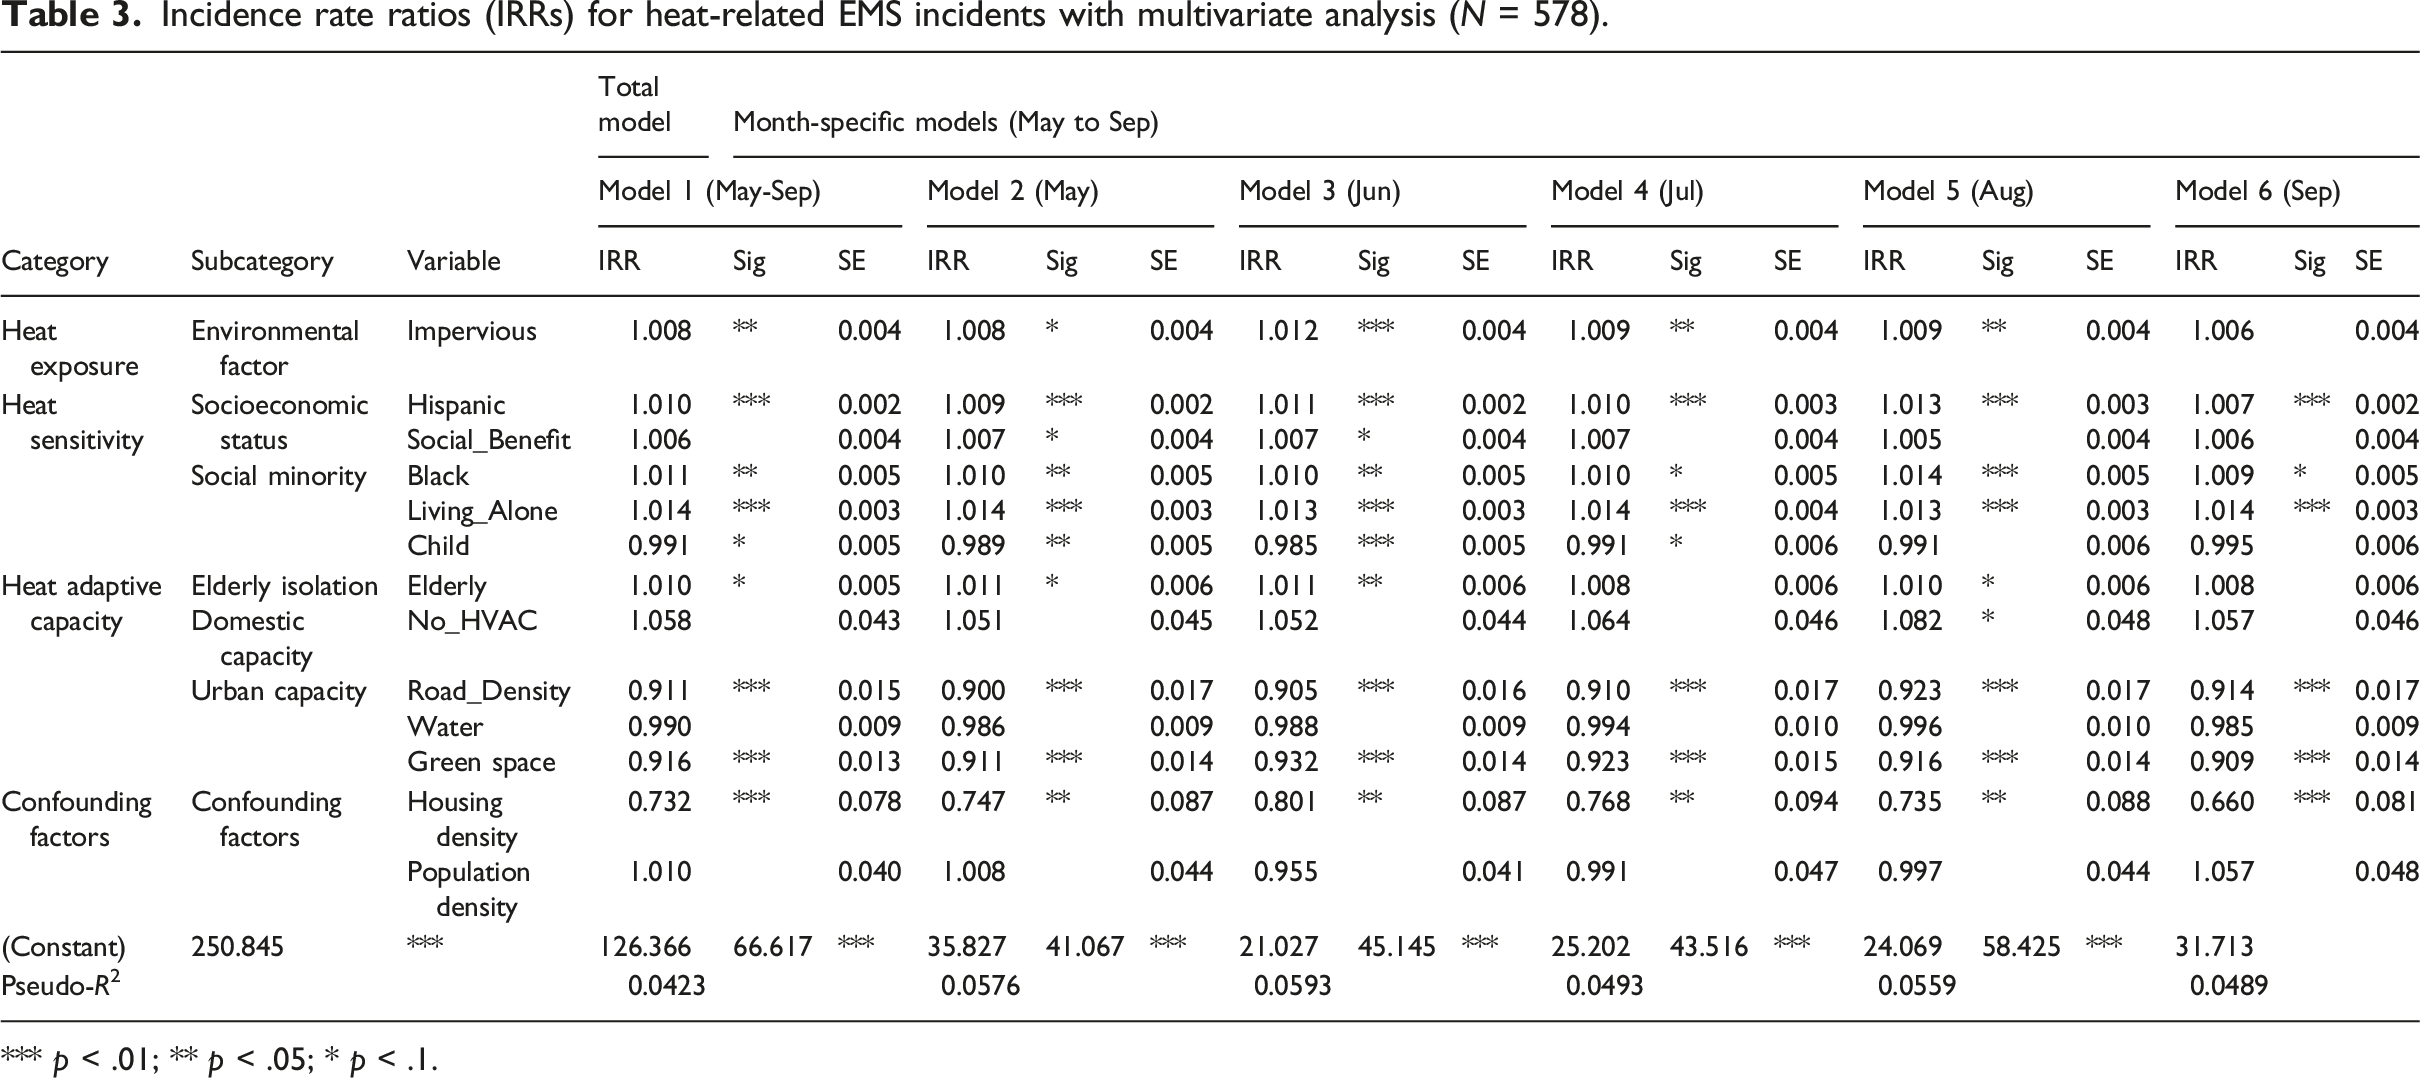
*** p < .01; ** p < .05; * p < .1.
As for heat exposure, in Model 1, a one percent increase in the impervious area in a block group would increase the rate of heat-related EMS incidents by 0.8%, holding all other variables in the model constant. Similarly, in Models 2–5, a higher percentage of impervious areas in a block group shows an increase in heat-related EMS incidents from May to August, resulting in an adverse impact on heat-related health.
Regarding heat sensitivity, in Model 1, the percentage of the Hispanic population is more likely to increase in heat-related EMS incidents in block groups (IRR = 1.010, 95% CI: 1.001–1.015, p < .01). Similarly, in Models 2–6, Hispanic populations are more likely to increase heat-related EMS incidents throughout all periods, and its effect shows a slightly corresponding pattern with monthly temperature (Figure 1), showing an increase by 1.3% in August (p < .01). The percentage of households receiving social benefits is positively significant in May and June only, with an increase in heat-related EMS calls. Social minority factors have statistically significant impacts on heat-related EMS calls. In Model 1, while the percentage of the Black population (IRR = 1.011, 95% CI: 1.002–1.020, p < .05) and persons living alone (IRR = 1.014, 95% CI: 1.008–1.020, p < .01) have a greater effect on increasing heat-related EMS incidents, an increase in the number of children in a block group is more likely to decrease the EMS incidents (IRR = 0.991, 95% CI: 0.981–1.001, p < .10). This pattern also appears in Models 2–6. A higher percentage of the Black population and persons living alone are more likely to increase heat-related EMS incidents by 0.9%–1.4%. Unlike other factors, an increase in the number of children in a block group is expected to decrease heat-related EMS incidents in early summer (Models 2–4).
Regarding heat adaptive capacity, in terms of social isolation, a higher percentage of the elderly population negatively impacted heat-related health, increasing greater heat-related EMS incidents in neighborhoods. Its impact is significant in the periods of May, June, and August. In addition, urban-scale adaptive capacity has a statistically significant effect on decreasing heat-related EMS incidents, while domestic-level adaptive capacity is insignificant in Model 1. Specifically, Model 1 shows that road density (IRR = 0.911, 95% CI: 0.882–0.942, p < .01) and green space (IRR = 0.916, 95% CI: 0.891–0.941, p < .01) have strong positive impacts on decreasing heat-related EMS incidents. In terms of domestic adaptive capacity, the percentage of housing units without an air-conditioning system was only significant in August and was expected to increase the heat-related EMS incidents in a block group by about 8.2%. Meanwhile, urban adaptive capacity was likely to significantly alleviate heat-related EMS incidents throughout the whole of both summer periods. Figure 5 shows how the relationships between heat vulnerability factors and heat-related EMS incidents vary depending on variables for the overall period and each month. Incidence rate ratios (IRRs) and 95% confidence intervals for May to September (2020–2021).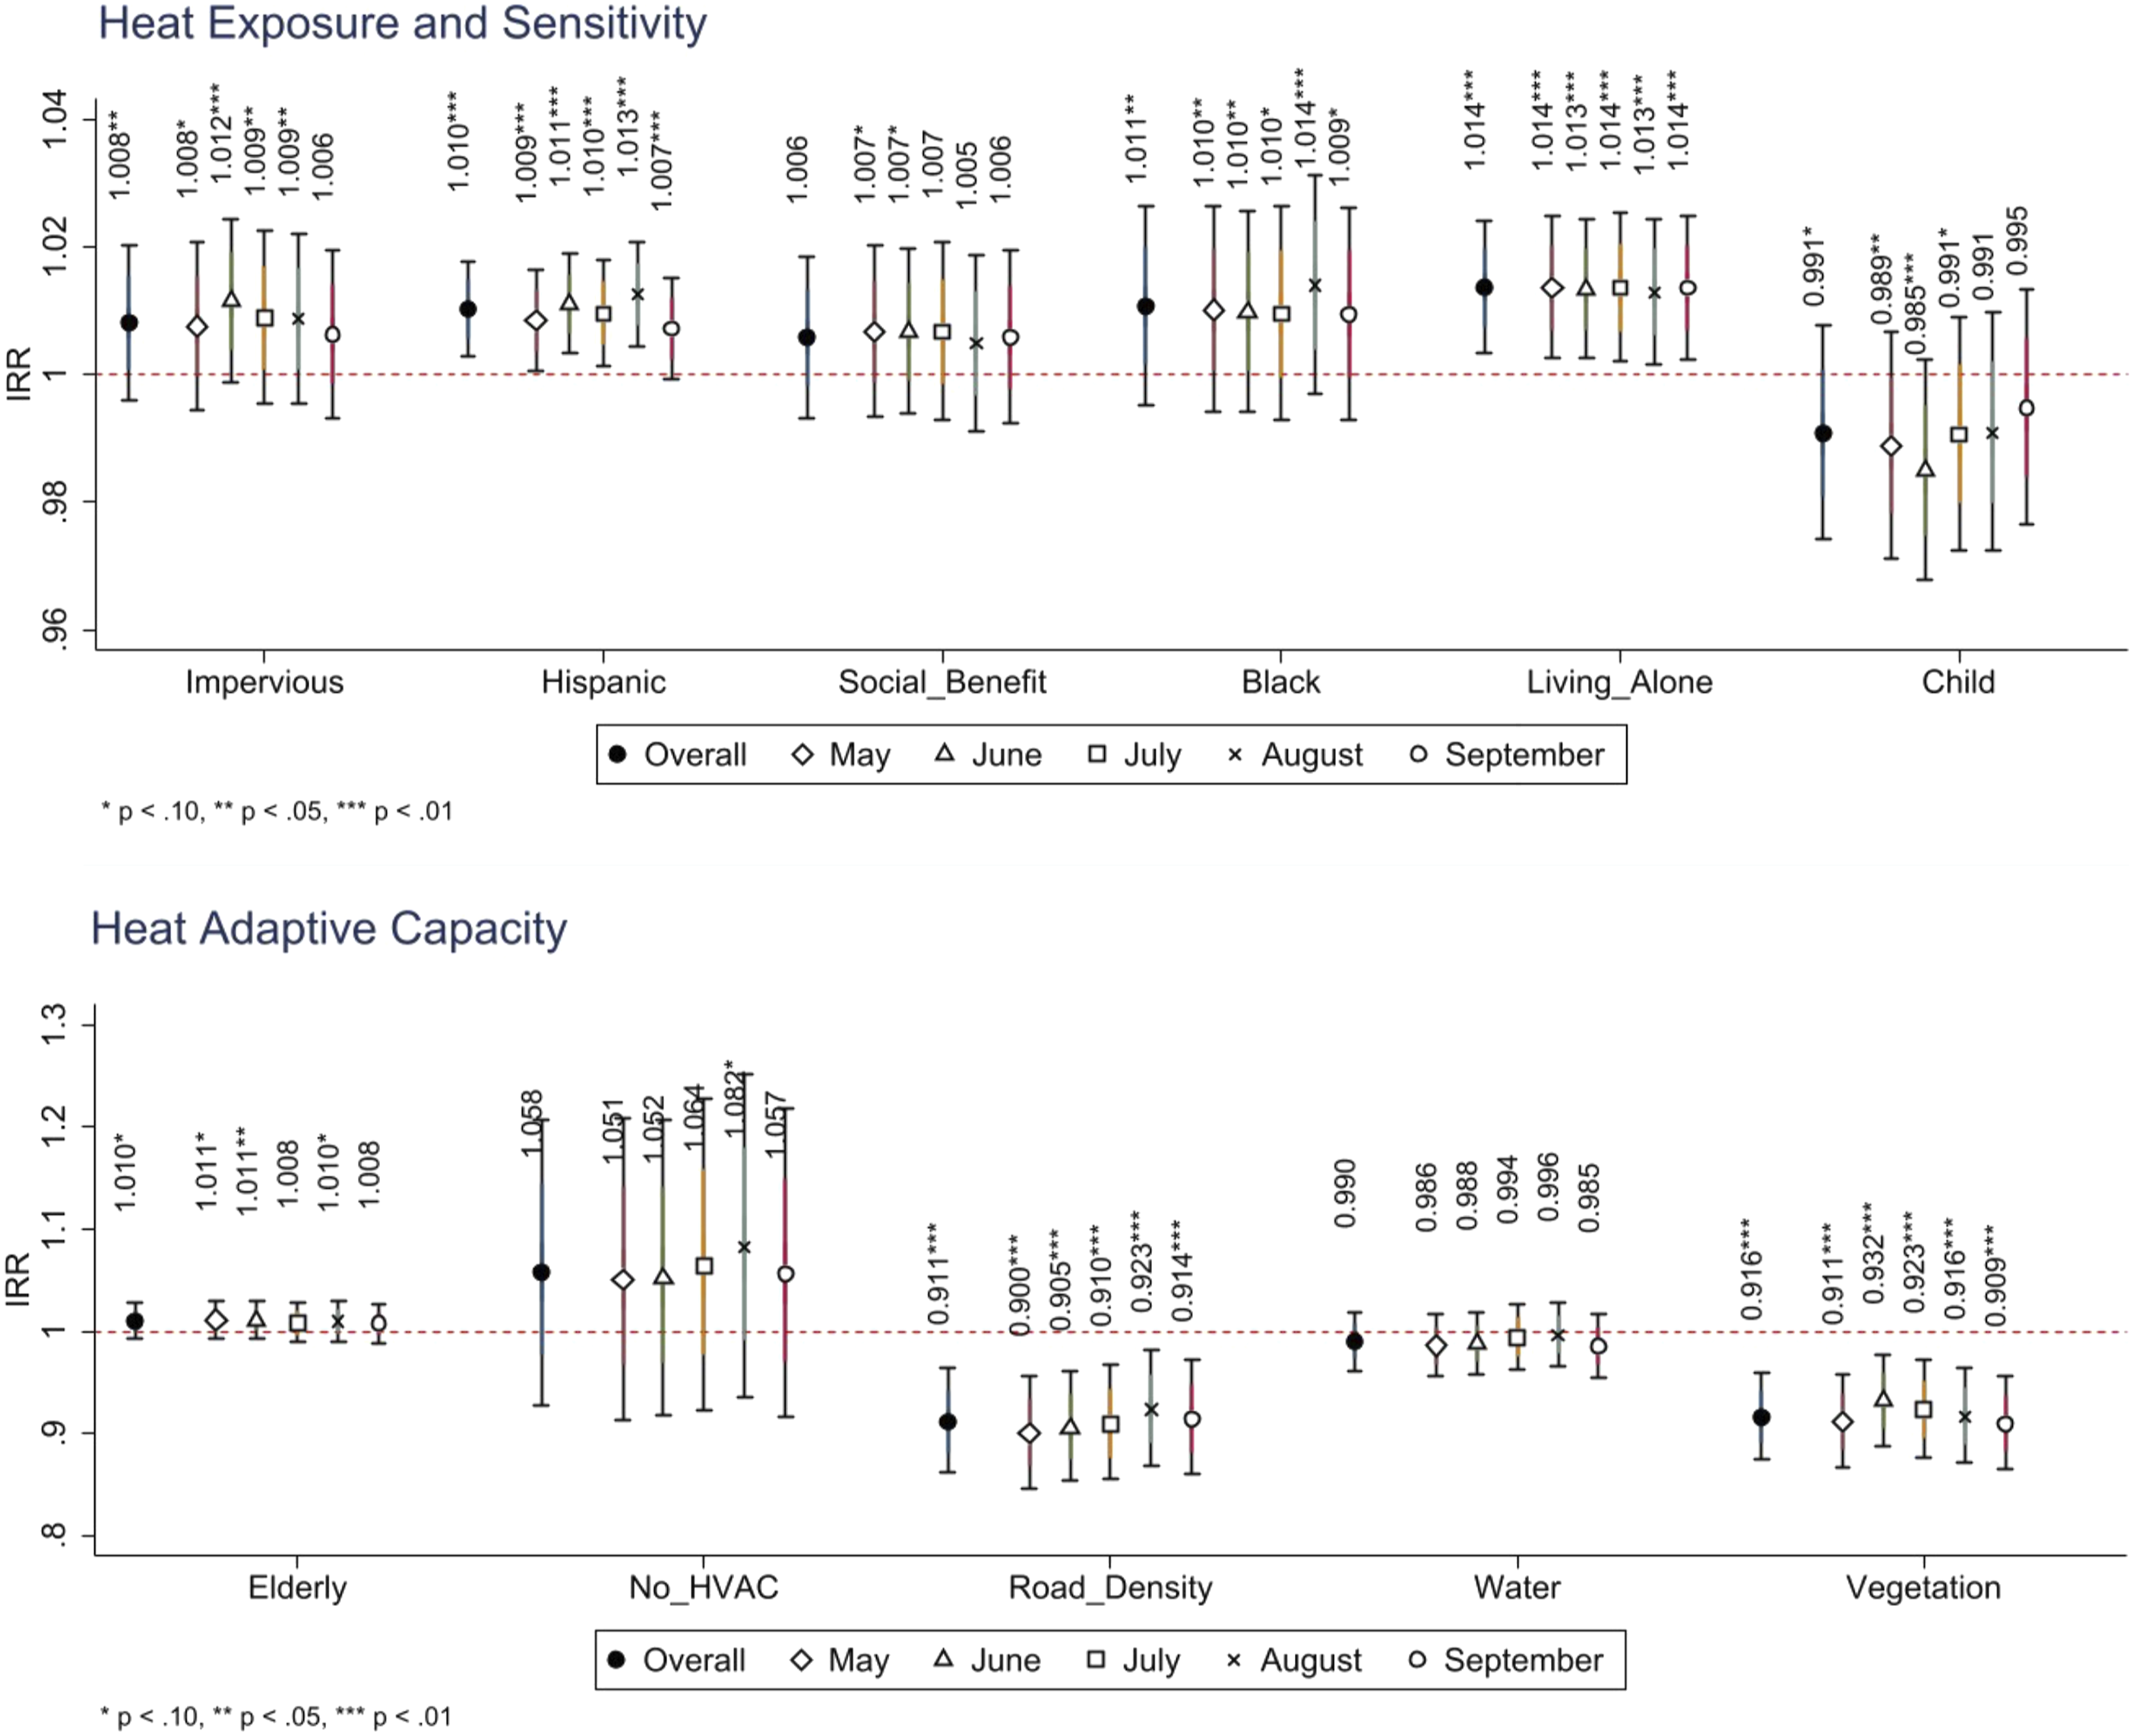
Discussion
This study explores how heat vulnerability indices are associated with the heat-related local EMS services based on their response times and incidents. Our results also showed that higher heat exposure and sensitivity and lower heat adaptive capacity are likely to increase heat-related EMS incidents in neighborhoods, consistent with previous studies tested in different areas or units of analysis (Lee and Brown, 2022; Zottarelli et al., 2021).
According to our findings, locations with higher heat vulnerability also have higher climate disadvantages, such as increased hazard exposure, social vulnerability, and a lack of residential and urban capacity, worsening community resilience. In this respect, heat vulnerability assessment and bivariate mapping provide a powerful toolset for communities in identifying climate-induced challenges and data-driven evidence for the allocation of financial and technical mitigation services. Our spatial mapping for vulnerability reaffirms to city and community practitioners that areas called the “Eastern Crescent” in east Austin are not only segregated by socioeconomic resources, urban infrastructure, and public/private investment, but are also disproportionately influenced by climate risks, with higher heat vulnerability and limited EMS services. In accordance with previous studies that have established strong links between current and historical segregation and climate-induced health outcomes (Johnson et al., 2012; Li et al., 2021a), this study highlights major climate risks and climate-induced health disparities that are rooted in historical disinvestment and segregation, which also call for policy implications for populations affected by such place-based inequalities.
Our findings from negative binomial regressions corroborate that heat disadvantages are likely to be strongly linked to heat-related health concerns. While our results are consistent with previous studies that have confirmed the relationship between heat exposure and heat-related health risks (Buscail et al., 2012; Ho et al., 2015), the results also extend the discussions that heat-related health outcomes vary by region depending on its heat sensitivity and adaptive capacity.
First, our results show that social vulnerability factors, such as race (i.e. Hispanic and Black), social benefit status, and people living alone, are highly associated with heat-related illnesses. Even though neighborhoods have the same degree of heat exposure, those with higher heat sensitivity are likely to have increased heat-related illnesses. For instance, as demonstrated by HVI mapping and bivariate mapping, higher heat vulnerability in neighborhoods of east Austin seem to be partially derived from lower heat sensitivity, along with lower heat exposure, which is firmly rooted in historical redlining. As noted by Li et al. (2021a), long-term geographical patterns of inequalities in heat-related health should be included in heat hazard mitigation programs, which are currently based on entire city-level circumstances. Our research also advises that policymakers and practitioners devote resources and capacity building toward addressing inequality in these areas. Given that the allocation of financial resources for hazard reduction often favors particular communities (Seong et al., 2021, 2022), our findings will support equitable heat mitigation initiatives.
Second, our findings reveal the role of heat adaptive capacity in mitigating heat-related illnesses. Elderly isolation and poor housing conditions without an air-conditioning system are statistically significant predictors of increased heat-related health risks, consistent with the results of previous research (Benmarhnia et al., 2015; Hendel et al., 2017; Johnson et al., 2012). Thus, specific heat mitigation strategies for socially isolated populations (i.e. by arranging home visits to the elderly living alone, setting up cooling centers or community health centers) or residents with poor conditions (i.e. by providing better transit systems to commute to cooling centers or developing funded assistance programs for HVAC system installation and/or replacement) should be established to improve adaptive capacity in neighborhoods. Our findings also point to the need for urban resilience initiatives in line with earlier research. Improved road systems (i.e. lighter colored pavement, cool pavement technologies) and neighborhood green spaces would help reduce heat-related illnesses. In turn, this improved public health will be accomplished by reducing heat hazards and increasing the heat adaptation ability.
Limitations and conclusion
This paper adds to a growing body of literature on heat vulnerability and heat-related health effects. This study corroborates previous studies on heat vulnerability assessment based on exposure, sensitivity, and adaptive capacity and broadens the conversation to include heat-related EMS services and disparities in public health outcomes. A heat vulnerability assessment can help identify climate hazards and public health implications and offer goal-oriented resilience initiatives to reduce geographic inequities. Given that the vulnerability assessment relies on publicly available data (ACS, City of Austin GIS data, and TxDOT road inventory), our approach is replicable and generalizable to assess heat vulnerability in different urban areas.
Several limitations must be noted. First, owing to the data availability, this study cannot fully confirm that symptoms and illnesses are caused by excessive heat. Defining heat-related EMS occurrences remained a challenge in this study, despite the authors’ decision-making and cleaning iterations to separate heat-related illnesses from COVID-19 or other irrelevant illnesses. Second, EMS incident data may not adequately capture heat-related diseases since EMS use varies by socioeconomic status. For instance, language or financial constraints may prevent Hispanic or low-income communities from accessing emergency medical care, which may understate health disparities (Li et al., 2021a). Third, EMS response time was estimated using the optimal route and travel time. Depending on the area, actual response time may be delayed due to traffic, road conditions, or other relevant considerations. Recent research used a more complex technique, an enhanced two-step floating catchment area (E2SFCA), to measure EMS accessibility by considering the EMS station and hospital service capacity (Hashtarkhani et al., 2020; Li et al., 2021b). Thus, future studies should seek to use a sophisticated method of assessing EMS accessibility. We are also aware of the increasing multi-hazard climate risks and their cascading effects in urban areas. As climate change increases, multifaceted health challenges related to multiple hazards, such as floods, wildfires, heat, drought, and tornados, ranging from acute disasters to chronic risks, should be investigated to uncover the contextual and multi-dimensional disparities around climate hazards.
This study adds insight into the relationships between extreme heat events as chronic disasters and heat-related health issues. The study presents data-driven evidence for planning practitioners to prioritize vulnerable areas and communities to focus local efforts on resolving heat-related health concerns in the neighborhood context. As a result, the study recommends better-designed heat mitigation and community resilience plans to promote public health.
Footnotes
Acknowledgements
The authors would like to thank the editor and the reviewers for their helpful comments. The authors extend their sincere gratitude to David Kulpanowski in Austin Travis-County EMS for sharing the Emergency Medical Services (EMS) data.
Declaration of conflicting interests
The author(s) declared no potential conflicts of interest with respect to the research, authorship, and/or publication of this article.
Funding
The author(s) disclosed receipt of the following financial support for the research, authorship, and/or publication of this article: This project is supported by the Good Systems Grand Challenge at The University of Texas at Austin, U.S. Department of Transportation (USDOT) Cooperative Mobility for Competitive Megaregions (CM2), and National Science Foundation (2133302, 1952193, 2125858)