
Abstract
As the mobile Internet emerges, numerous Instagram-worthy locations gradually constitute new spaces of urban tourism. For instance, the Xiaohongshu application, a community with shared content, has increasingly become a platform for people to share well-known tourist attractions, providing a new perspective for the study of the popularity of tourism spaces. On the basis of data of ticking off Instagram-worthy locations from the Xiaohongshu application, the present study aims to identify tourism hotspots in Beijing, analyze their spatial characteristics, and explore their evolution features from two dimensions of time and space. In addition, the emotional images of tourism hotspots in Beijing are interpreted by semantic analysis with an internal mechanism that influences those locations explored. The results of the study show that (1) the overall spatial structure of tourism hotspots in Beijing is C-shaped, which expands from the core area to the periphery with the feature of a circle layer. (2) under the influence of the COVID-19 pandemic, the spatial distribution center of tourism hotspots in Beijing is gradually shifting to the Southeast with the tendency of expanding to the surrounding suburbs. (3) the reception and serviceability of the tourist attractions have a significant influence on the popularity of tourism hotspots. To date, less research has been focused on the data of ticking off emerging Instagram-worthy locations like the Xiaohongshu application, and there is a dearth of the study related to in-depth excavation of the internal influencing mechanism of their popularity. This paper, therefore, under the interaction of virtual and reality, provides new ideas and methods for studying the popularity of urban tourist attractions.
Introduction
With the rapid expansion of the Internet, the effect of information technology on urban space is increasing, especially the new modalities of communication enabled by social media platforms, prompting the need for researchers to take a broader perspective on urban space (Li et al., 2018; Salas-Olmedo et al., 2018; Hale, 2018). Xiaohongshu app’s monthly active users in China have surpassed 200 million as of November 2021, 72% of users are post-90s, 50% of users are in China’s first- and second-tier cities, and more youthful people are eager to share their life experiences on Xiaohongshu APP (Electricity Business News, 2021). These users are all in their 30s and are influential decision-makers for individual or family travel. According to Apple Store app downloads, Xiaohongshu has more than 10 million downloads, which is far more than Weibo’s 800,000 users, making it more appropriate for large-scale data analysis (Sohu News, 2021). When searching for the term “City Instagram-worthy locations” on Xiaohongshu, you may discover user-generated remarks. The data in these notes represent the individual’s appraisal of a city destination via a mix of visuals and text and transmit the individual’s perspective of the city through emotional evaluation, location tags, and more data information. Which location has the most “Instagram-worthy location” notes suggest that it is more popular and receives more public attention. The data of notes represented by Xiaohongshu’s “Instagram-worthy locations” not only breeds a large number of spatial and temporal behavioral relationships but also becomes a scale to measure the popularity of a city tourist destination, thereby providing new data support for the spatial and temporal study of urban tourist destinations in the Internet era (Zhou et al., 2021; Xiang et al., 2021). This research focuses on the space corresponding to these tourist attractions, termed “urban tourism space.”
According to existing research, the entry points of heat research in urban tourism space can be roughly divided into three aspects: (1) In the collection of research data, heat research in urban tourism space collects the majority of its data from geo-tagged web photos (Deng et al., 2018; Liu et al., 2021), reviews (García-Palomares et al., 2015; Wu et al., 2018; Giglio et al., 2019), tourism website data (Huo and Liang, 2017), and social media platform data. Using geo-tagged photographs mined from the Panoramio website, Li et al., 2013 studied the temporal fluctuation of tourist traffic, the duration of stay of visitors, the average daily number of tourists, the major movement trajectories, and tourist hotspots in Gulangyu, Xiamen (Li et al., 2013). Kaufmann et al. studied Qyer travel blog data about the behavior of tourist hotspot space (Kaufmann et al., 2019). Wang et al., 2020 studied the geographical structural features of rural tourist flow and summed up the spatial behavioral preferences by analyzing a large sample of digital footprints (Wang et al., 2020). (2) Research strategies for the identification of hotspot locations are investigated (Rong and Tao, 2020; Lu et al., 2021). Using geographical clustering and text mining techniques, Peng et al. extracted prominent tourist locations in Beijing from Flickr geographic photographs. Alvin et al. mined the tour itineraries of visitors in Cilento, a picturesque region in southern Italy, as well as the direction, pattern, and centrality of tourist flow dissemination and the valuable tourist flow patterns in the scenic region, using Twitter (Alvin et al., 2016). Raun et al. measured the geographical, temporal, compositional, social, and dynamic characteristics of tourist sites using mobile phone data (Raun et al., 2016). (3) There is research on the evolutionary aspects of tourist hotspots (Ji et al., 2016; Putri et al., 2021), as well as studies that investigate changes in tourism hotspots through time (Ding, 2004; Yan et al., 2017). Liu, for instance, studied the spatiotemporal evolutionary aspects of Beijing’s tourist hotspots using geo-tagged data (Liu et al., 2017). Li et al. examined the image perception of Beijing’s typical urban tourist communities by analyzing internet reviews (Li et al., 2017). In recent years, tourism studies have focused on tourists geographical and temporal distribution characteristics using data from social media platforms (Chua et al., 2016; Peng and Huang, 2017; Wu et al., 2018; Feng et al., 2022).
There is a scarcity of studies based on increasing “Instagram-worthy locations” data. The research material also lacks an analysis of the growth of the tourist hotspots’ space-time dimension and a thorough investigation of the factors influencing the popularity of tourist destinations. As a result, this study analyzes the pattern and characteristics of urban tourism hotspot space using data on the frequency of Instagram-worthy locations, as well as the emotional and image perceptions of hotspots using comment semantics, and also the influencing factors affecting the popularity of tourism spatial. To examine the geographical pattern of urban tourist destinations based on new data, to investigate the inherent factors influencing the attractiveness of tourist destinations, and to give a reference for urban tourism development planning.
Research methodology and data sources
Study area
Beijing is a world-famous tourism capital with rich historical and cultural resources, and its Xiaohongshu users are second only to Guangdong Province and Shanghai, occupying 9.09% (Electricity Business News, 2021). As shown in Figure 1, the study’s research region is Beijing’s municipal area, which covers an area of about 16,410 km2, is divided into 16 districts, and has a resident population of around 2,189,300 people as of November 11, 2020. Study area.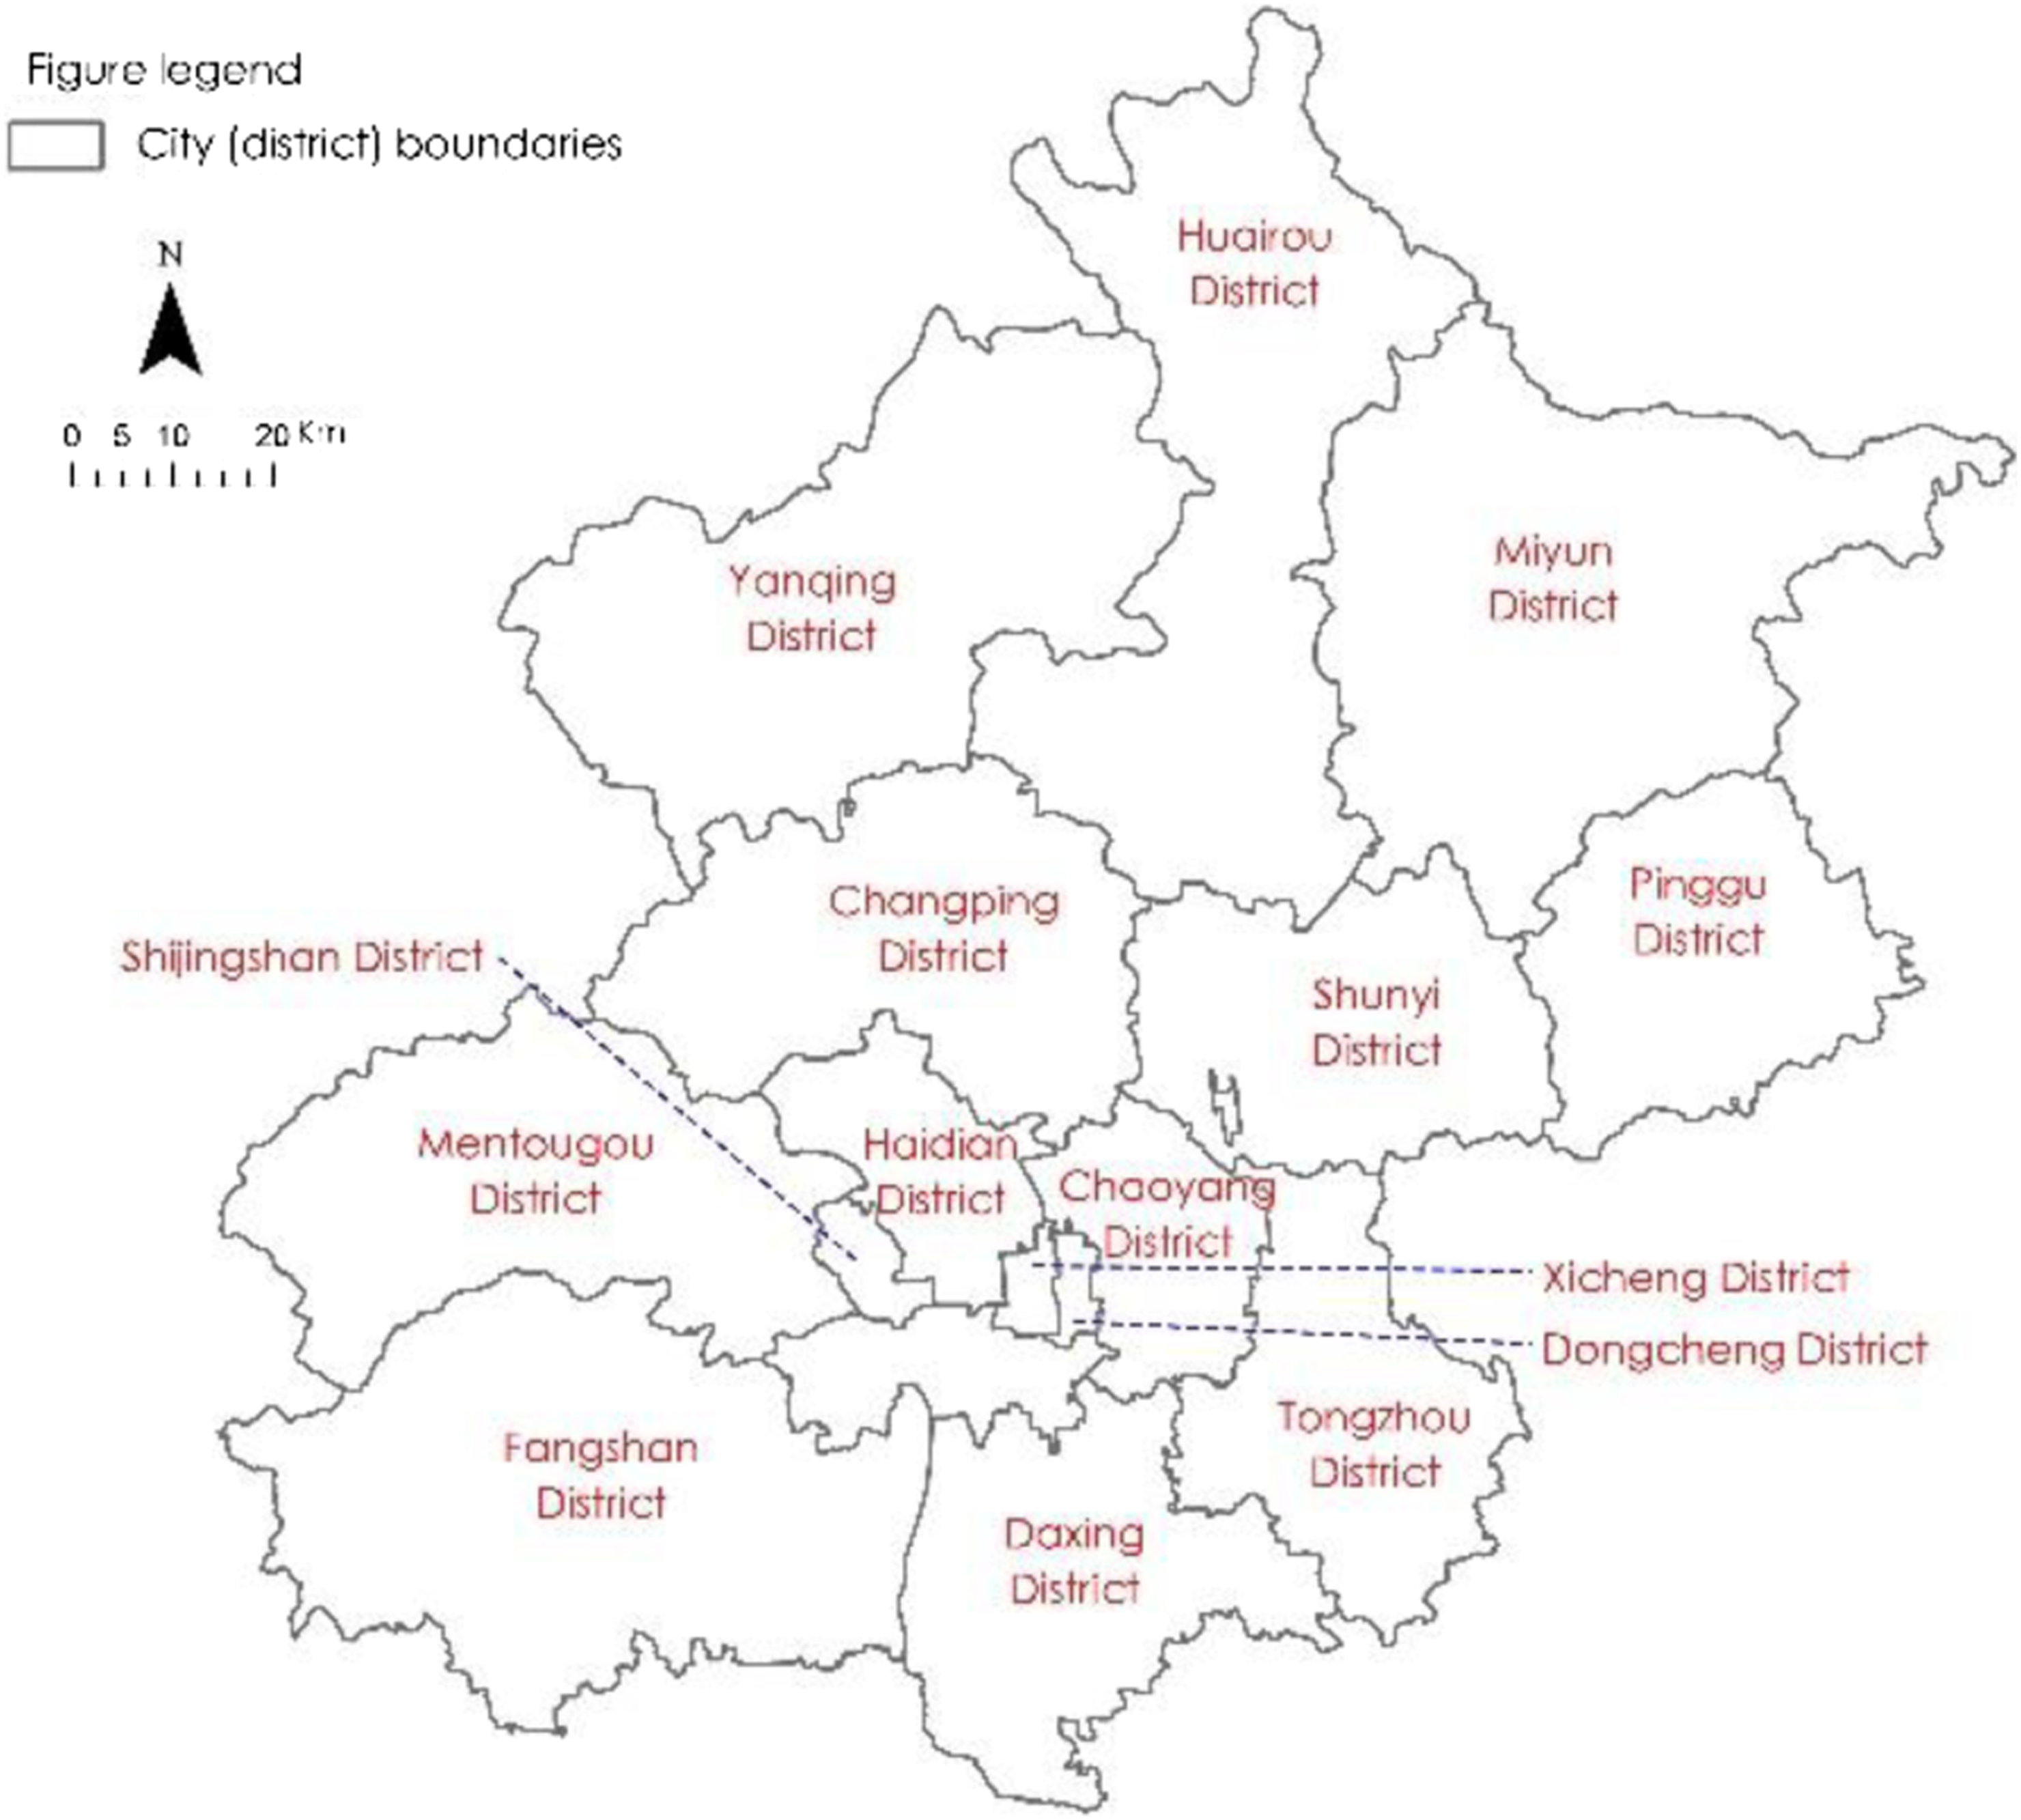
Data sources
Spatial data crawling of tourism hotspots
In terms of data collection, a Python program was used to search the Xiaohongshu APP for the keyword “Beijing Instagram-worthy Locations” to get batch data on Beijing city’s hit notes. Similar to Weibo’s “check-in” data, it also incorporates geographic coordinates. However, it is richer and more people are ready to utilize it to find places to visit, “City Instagram-worthy Locations” is a kind of tag used by users on Xiaohongshu to record city tourism places. Between 2019 and 2021, the data comprises around 500,000 notes with geographic coordinates. The data includes the following: text content, user name, title, place name, POI location, number of likes, number of comments, and posting time. Since Xiaohongshu has a restriction on the number of words per note, descriptions of trip destinations that exceed the limit are often divided into many notes and published sequentially. Therefore, it is necessary to remove instances in which the same person repeatedly publishes the same “Instagram-worthy locations” data on the same day or several days. After purifying the data, 145,689 notes were acquired over three years. Using the position information of the POI’s longitude and latitude coordinates, the geographical distribution of all data is projected on a map, and the number of repeated notes at the same spot is tallied. The greater the number, the greater the tourist destination’s popularity. The emotional data are the aggregation of the evaluation content data of the same hitting place name to get the review data of different tourist hotspots, and the text content word count is about 3,658,000 words. The “Rost Content Mining” software is a tool for systematic mining of text content, which can organize and sort high-frequency feature words and their frequencies. The “Rost Content Mining” software is used as a text mining tool to extract high-frequency feature words from the review data for semantic network analysis to analyze the emotional image of tourist places (Meng and Xu, 2019).
Influence factor data acquisition method
The data for the influencing factors were obtained using big network data, including the traffic accessibility index, which was obtained from the Open street map to obtain data on Beijing’s road shapes and a traffic network dataset is created in ArcGIS to comprehensively measure the road network density, traffic service facility density, and travel difficulty for each tourist location; the popularity index was obtained from the Baidu index website, and the frequency of internet users searching for relevant content on Baidu was calculated as the Baidu index, which reflected the degree of attention paid to the content. The Baidu index for each district in Beijing is obtained using a Python program; indicators of tourism resource endowment, economic development level, and hospitality service capacity are accepted via the “Statistical Yearbook” on the website of each district’s people’s government in Beijing, and economic and social statistics are captured (Beijing Municipal Bureau of Statistics, 2021).
Research ideas and methodology
Research ideas
To begin, we matched the geo-tagged data collected from the popular lifestyle-sharing APP Xiaohongshu with the POI geographic location, retrieved its latitude and longitude coordinates via Xiaohongshu’s Gaode Map API interface, drew its spatial distribution map using ArcGIS, and count the number of repeated occurrences of the same tourist place notes as an indicator of the tourist place’s degree of interest. According to Figure 2, the kernel density analysis approach is used to determine the density value of tourist destinations’ level of interest, study its geographic distribution features, and then assess its spatial type and temporal change characteristics. Python script examines the frequency of two geographical places occurring concurrently in each note text to create the network connected with each tourist destination: the co-occurrence frequency connection between each site. In the meanwhile, semantic segmentation is used to extract all evaluation words from the crawling “Instagram-worth Locations” data of Xiaohongshu, and adjectives are tallied to study the emotional impression of each tourist location and the distribution of visitors’ emotions. Lastly, the five indicators of traffic accessibility, popularity, tourism resource endowment, economic development level, and hospitality service capacity were chosen to analyze the influencing factors of tourism spatial hotness using the geographic probe and Pearson correlation analysis method, and their influence was evaluated. Framework diagram of research methodology.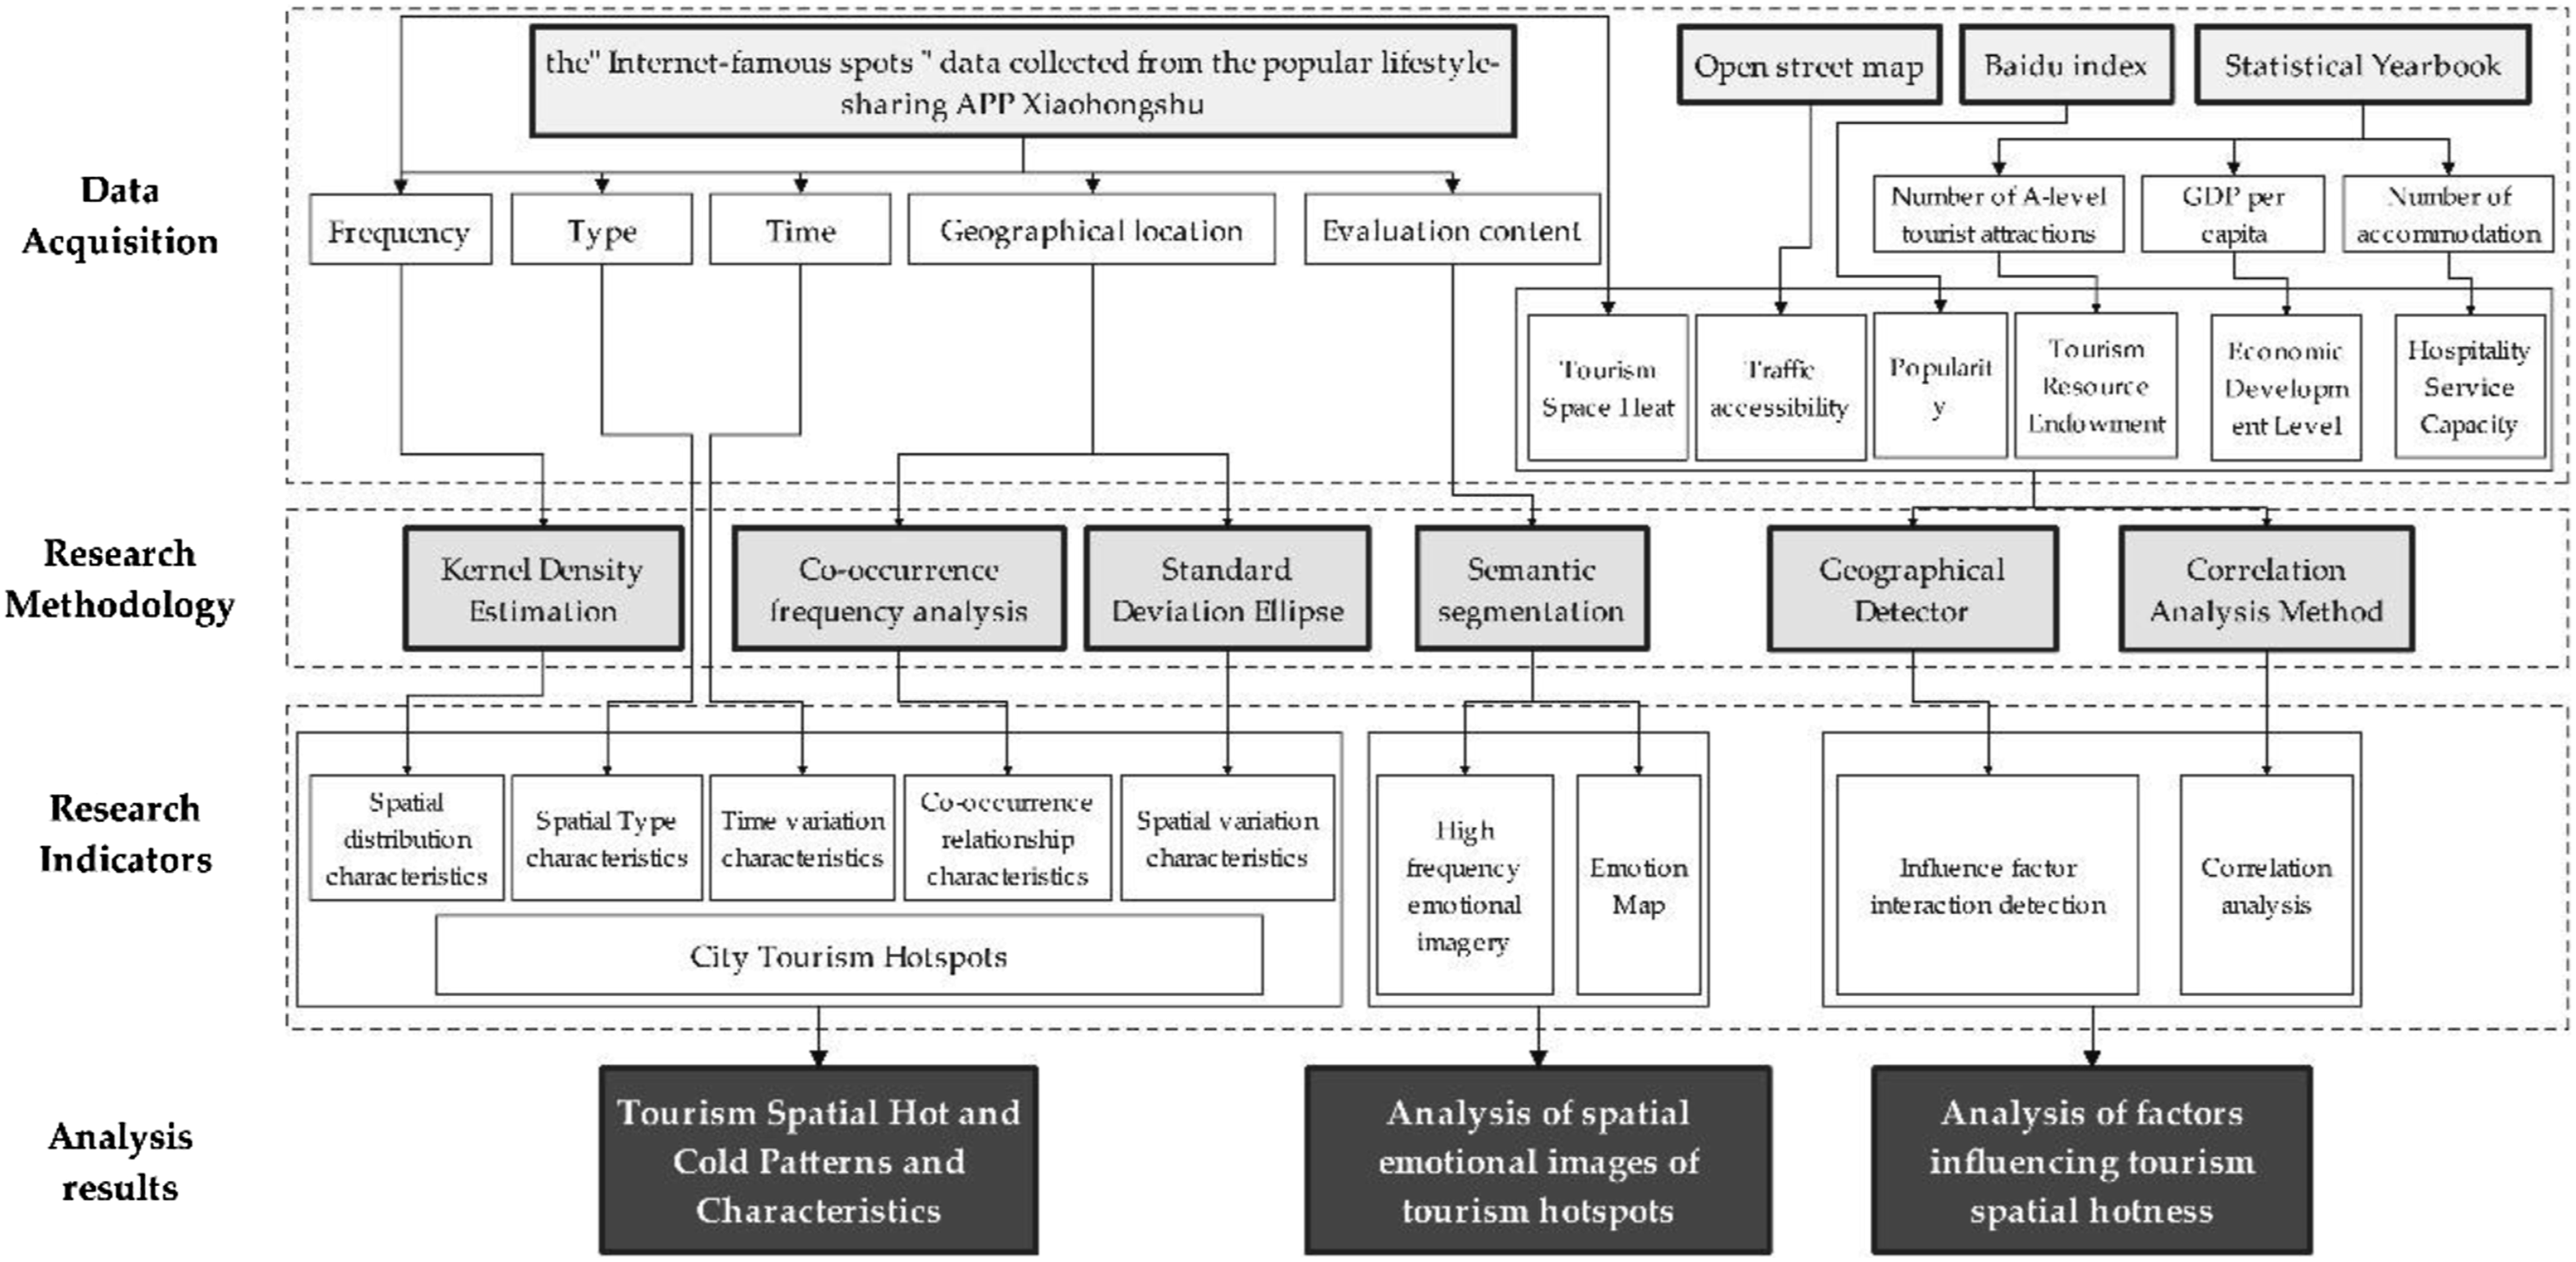
Research methodology
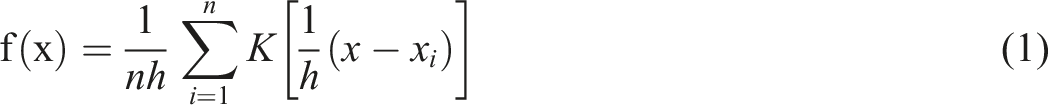
Kernel Density Estimation
Kernel density estimation can be used to determine the densities of points, lines, and other spatial elements, and the density of the elements in the search area is estimated by assigning them different weights via the kernel function, which has been widely used to study an object’s distribution characteristics, and the kernel density analysis expression is
Standard Deviation Ellipse
The standard deviation ellipse method effectively reveals the overall characteristics of geographic elements' spatial distribution and their spatial and temporal evolution process, quantitatively reflecting the characteristics of geographic elements' centrality, spatial pattern, primary trend, and driving force direction in their spatial distribution from a global perspective via indicators such as the center of gravity, azimuth, and long and short axes of standard dev. The average of the X and Y coordinates of all tourist destinations yields the average center and axis near the ellipse; the ellipse’s long half-axis indicates the distribution direction trend of tourist destinations, while the short half-axis shows the range covered by it (Fischer et al., 2010).
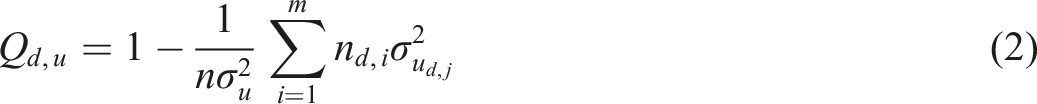
Detector of Geographical Location
Geographic detectors are a statistical technique for analyzing geographical variability and determining the elements that influence it. Two models, factor detection and interaction detection, are utilized in this research to determine the size of the effect of each influencing factor and their interaction (Wang et al., 2017). (1) The formula for factor detection, used to determine the degree to which a single component may explain the dependent variable, is shown below where (2) Interaction detection, which is used to determine the strength of each influence factor two interaction kernel single factor in comparison to the role of tourist destination popularity, the relationship between two influence factors can be classified as non-linear weakening, single factor non-linear weakening, two-factor enhancement, and independent kernel non-linear enhancement (Zhan et al., 2015; Wang et al., 2013).
Method of correlation analysis
This research necessitates a comparative investigation of several contributing elements. The Pearson correlation coefficient uses a linear equation to represent the link between two variables in a straightforward and accessible manner. The Pearson correlation coefficient is used to define the five elements that impact the popularity of a tourist location and influence factor indices and measure and evaluate the connection between the various influence factors. The following is the precise calculating formula
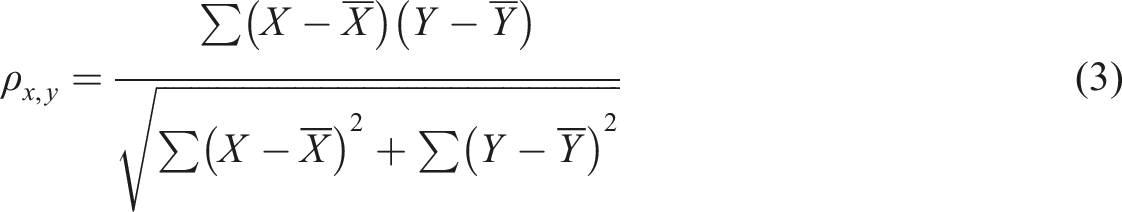
X and Y denote the variable values of the two variables, respectively;
Tourism spatial hot and cold patterns and characteristics
Spatial distribution characteristics of tourism hotspots
Overall pattern
Using the latitude and longitude coordinates of POIs in the Xiaohongshu APP data, the spatial distribution of all the data is plotted on a map. Statistics are added on top of the number of notes in repeated locations, and the higher the number of notes in repeated locations, the more attention that travel space gets. The findings indicate that the spatial structure of Beijing’s tourism hotspots is exceptional, and the aggregated distribution is obvious, forming a “C-shaped” spatial structure that extends from the city’s six core districts to Changping District, Huairou District, and Miyun District, including the city’s overall pattern of tourism space. As seen in Figure 3(a), the top five districts are Chaoyang, Dongcheng, Tongzhou, Haidian, and Xicheng. Their characteristics are primarily reflected in the following: (1) the structural distribution of the core area to the periphery in a circle expansion pattern, (2) the hotspots in the six core districts exhibit a continuous spreading distribution pattern, and (3) the peripheral areas of the central district exhibit a multi-core pattern with hotspot tourist sites serving as the core and a scattered distribution pattern. Spatial heat distribution of Beijing tourism.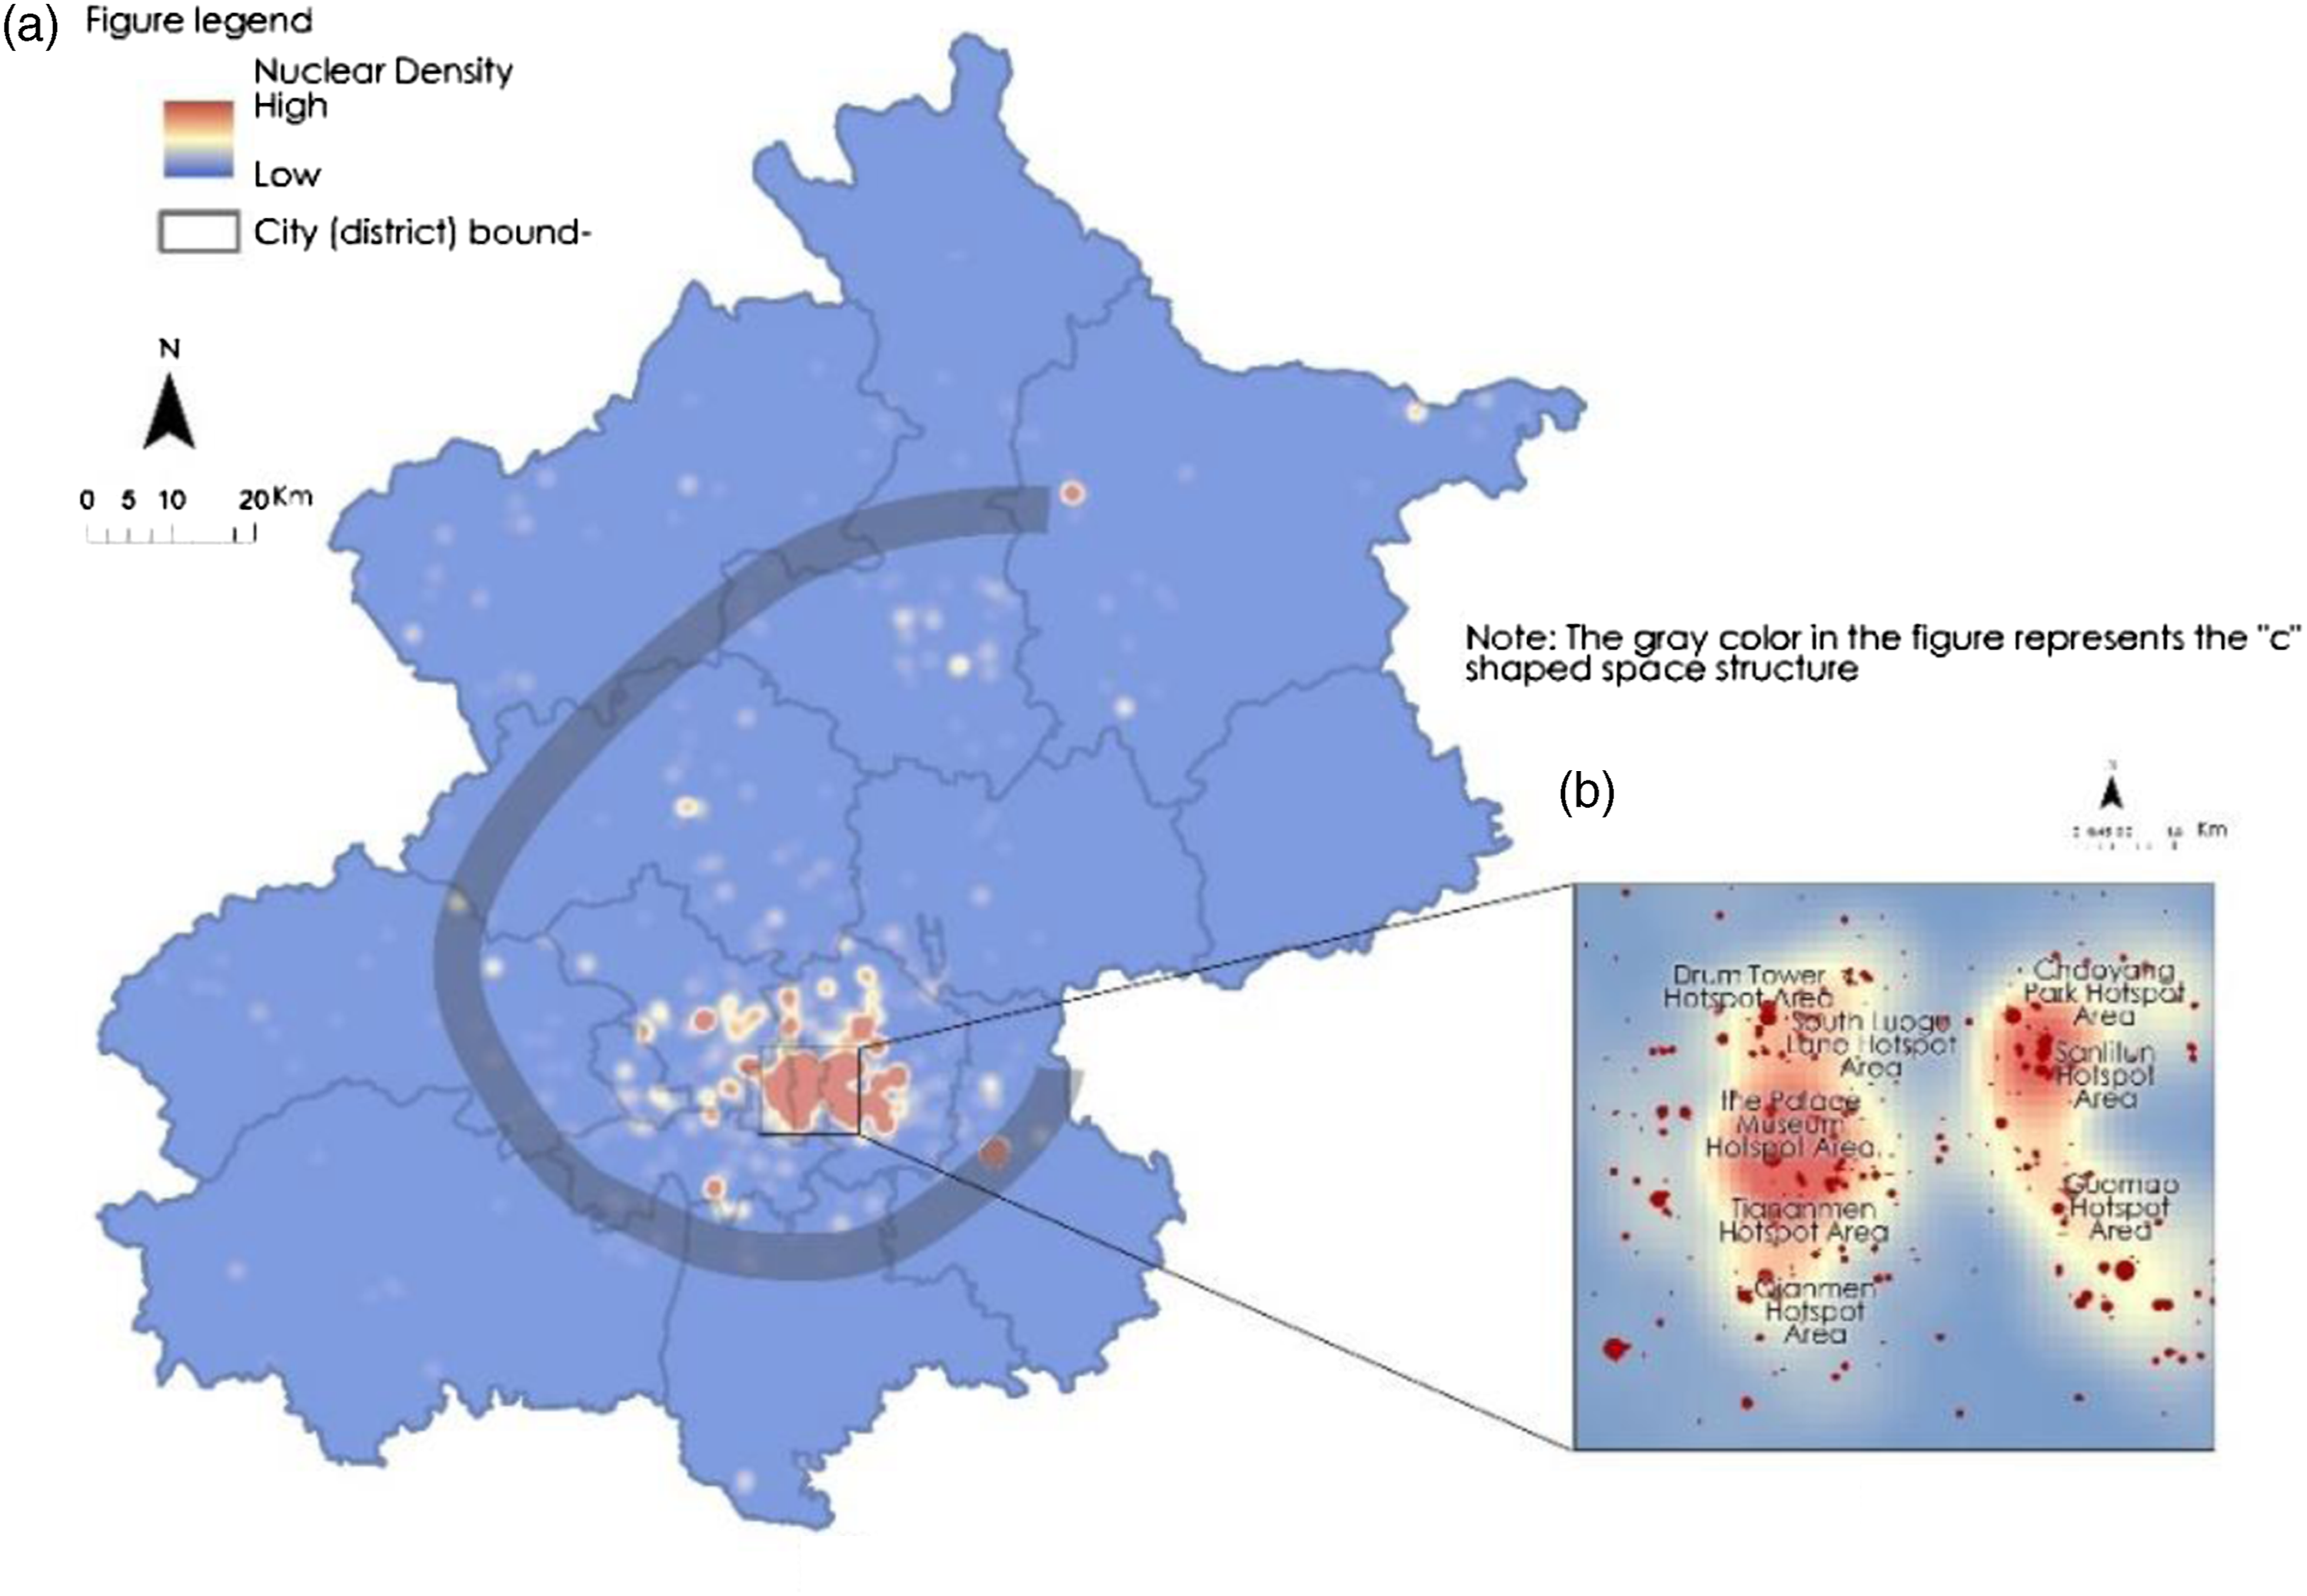
The tourism hotspot space is primarily manifested as a high-density concentration phenomenon centered in Beijing’s central business district. Its primary concentration area is centered on popular tourist attractions and commercial complexes such as the palace museum and Sanlitun, totaling approximately 117.13 square kilometers. Although this location accounts for just 7.13% of the research area, it accounts for 42.3% of the study area’s tourist hotspot space, indicating that it is a hotspot concentration area in Beijing. As illustrated in Figure 3(b), the Palace Museum, Tiananmen Square, and Qianmen are the most concentrated tourist hotspots in Beijing’s core area, owing to their long history and culture; Sanlitun, on the other hand, has developed into a hotspot tourist destination due to its trendy, young, and international image; it is worth noting that the Olympic Forest Park, Summer Palace, and 798 Art Zone also exhibit a contiguous spreading distribution pattern. In terms of geographical distribution, their scope roughly correlates to the center city’s physical structure and corresponds to the core and central regions.
Along with the city’s six core districts, there are also dispersed and localized multi-core distribution phenomena in the city’s outlying suburbs, such as Universal Beijing Resort in Tongzhou District, Gubei Water Town in Miyun District, and Badaling Great Wall in Yanqing District. Since its opening in 2020, Universal Beijing Resort has attracted tourists from all over the world, with an annual attendance of over 10 million, propelling the growth of tourism-related industries in the surrounding area; meanwhile, Gubei Water Town, with its Jiangnan water town Wuzhen style and reliance on the cultural resources of the Simatai Great Wall, has become a popular humanistic landscape destination in Beijing in 2020, with a high degree of online amplification. As a 5A tourist attraction, Badaling Great Wall has become a popular domestic and international tourist destination, establishing a tourist hotspot region.
Space type division
Each tourist place is classified into seven categories based on its functional characteristics: distinctive streets and lanes, parks and squares, cultural exhibition facilities, cultural heritage and monuments, public recreation facilities, aquatic landscapes, and natural landscapes. According to Figure S1a in the Supplementary Material, it is primarily public leisure facilities that account for 54% of the total, with Chaoyang District having the most obvious distribution; followed by the park and square system at 14% and cultural heritage and monuments at 10%, with the former being more evenly distributed throughout Beijing’s six districts and the latter concentrated in the old city. Dongcheng District has the highest concentration of characteristic streets and alleys, cultural exhibition facilities, and natural landscapes. In contrast, Chaoyang District has the highest concentration of cultural exhibition facilities, and Huairou District, Mentougou District, and Miyun District have the highest concentration of natural landscapes. Because the plain region of Beijing’s geographic structure is deficient in water resources, the corresponding hotspot space of the water landscape category is the smallest, with Miyun District being the most concentrated.
Spatio-Temporal evolution characteristics of tourism hotspot space
Time change characteristics
Because the resource types inside each tourist space vary, various kinds of tourism spaces exhibit different features of change over a year due to the effect of season and time. Three years of data, 2019, 2020, and 2021, are combined and sorted chronologically, and the hotspots of seven different tourist places are tallied independently to examine their temporal change features. As illustrated in Figure S1b in the supplementary material, tourism spaces classified as natural landscape, water landscape, cultural heritage, and public leisure facilities are more influenced by seasons, with noticeable peak performances; tourism spaces classified as cultural exhibition facilities and characteristic streets and alleys are also affected by seasons, but the fluctuations are relatively small; given that the average winter temperature in Beijing ranges between 2 and –5 degrees Celsius, Sensitivity According to the yearly popularity distribution, all seven categories of tourist destinations experience peaks in May, July, August, September, and October, indicating that this is the peak season for tourism, which is influenced by variables such as climate and holidays.
Co-occurrence frequency relationship
The social network analysis method is used to describe the network structure of tourism flow, and the number of occurrences of different tourism spaces within the same “Xiaohongshu Notes” reflects the crowd’s perception of varying tourism spaces, and the co-occurrence frequency relationship between popular tourist destinations can be used to infer tourist behavior preferences. By filtering the names of different tourist spaces that appear in the same text using Python, a network diagram of each tourist space’s co-occurrence relationships is derived, and the tourist space with the highest number of co-occurrences is highlighted in bold, highlighting the inner correlation characteristics of tourist spaces more clearly and intuitively. As seen in Figure 4, Beijing tourist areas exhibit a “center-to-periphery” radiation structure, with the core area serving as the center and radiating outward to create the circular radiation’s major network structure. The most linked places include the Universal Beijing Resort, Sanlitun, the embassy complex in Dongjiao Minxiang Alley, and the Palace Museum, whereas the least connected areas are public leisure spaces, distinctive streets and alleys, and cultural assets. Spatial co-occurrence frequency of tourism hotspots in Beijing.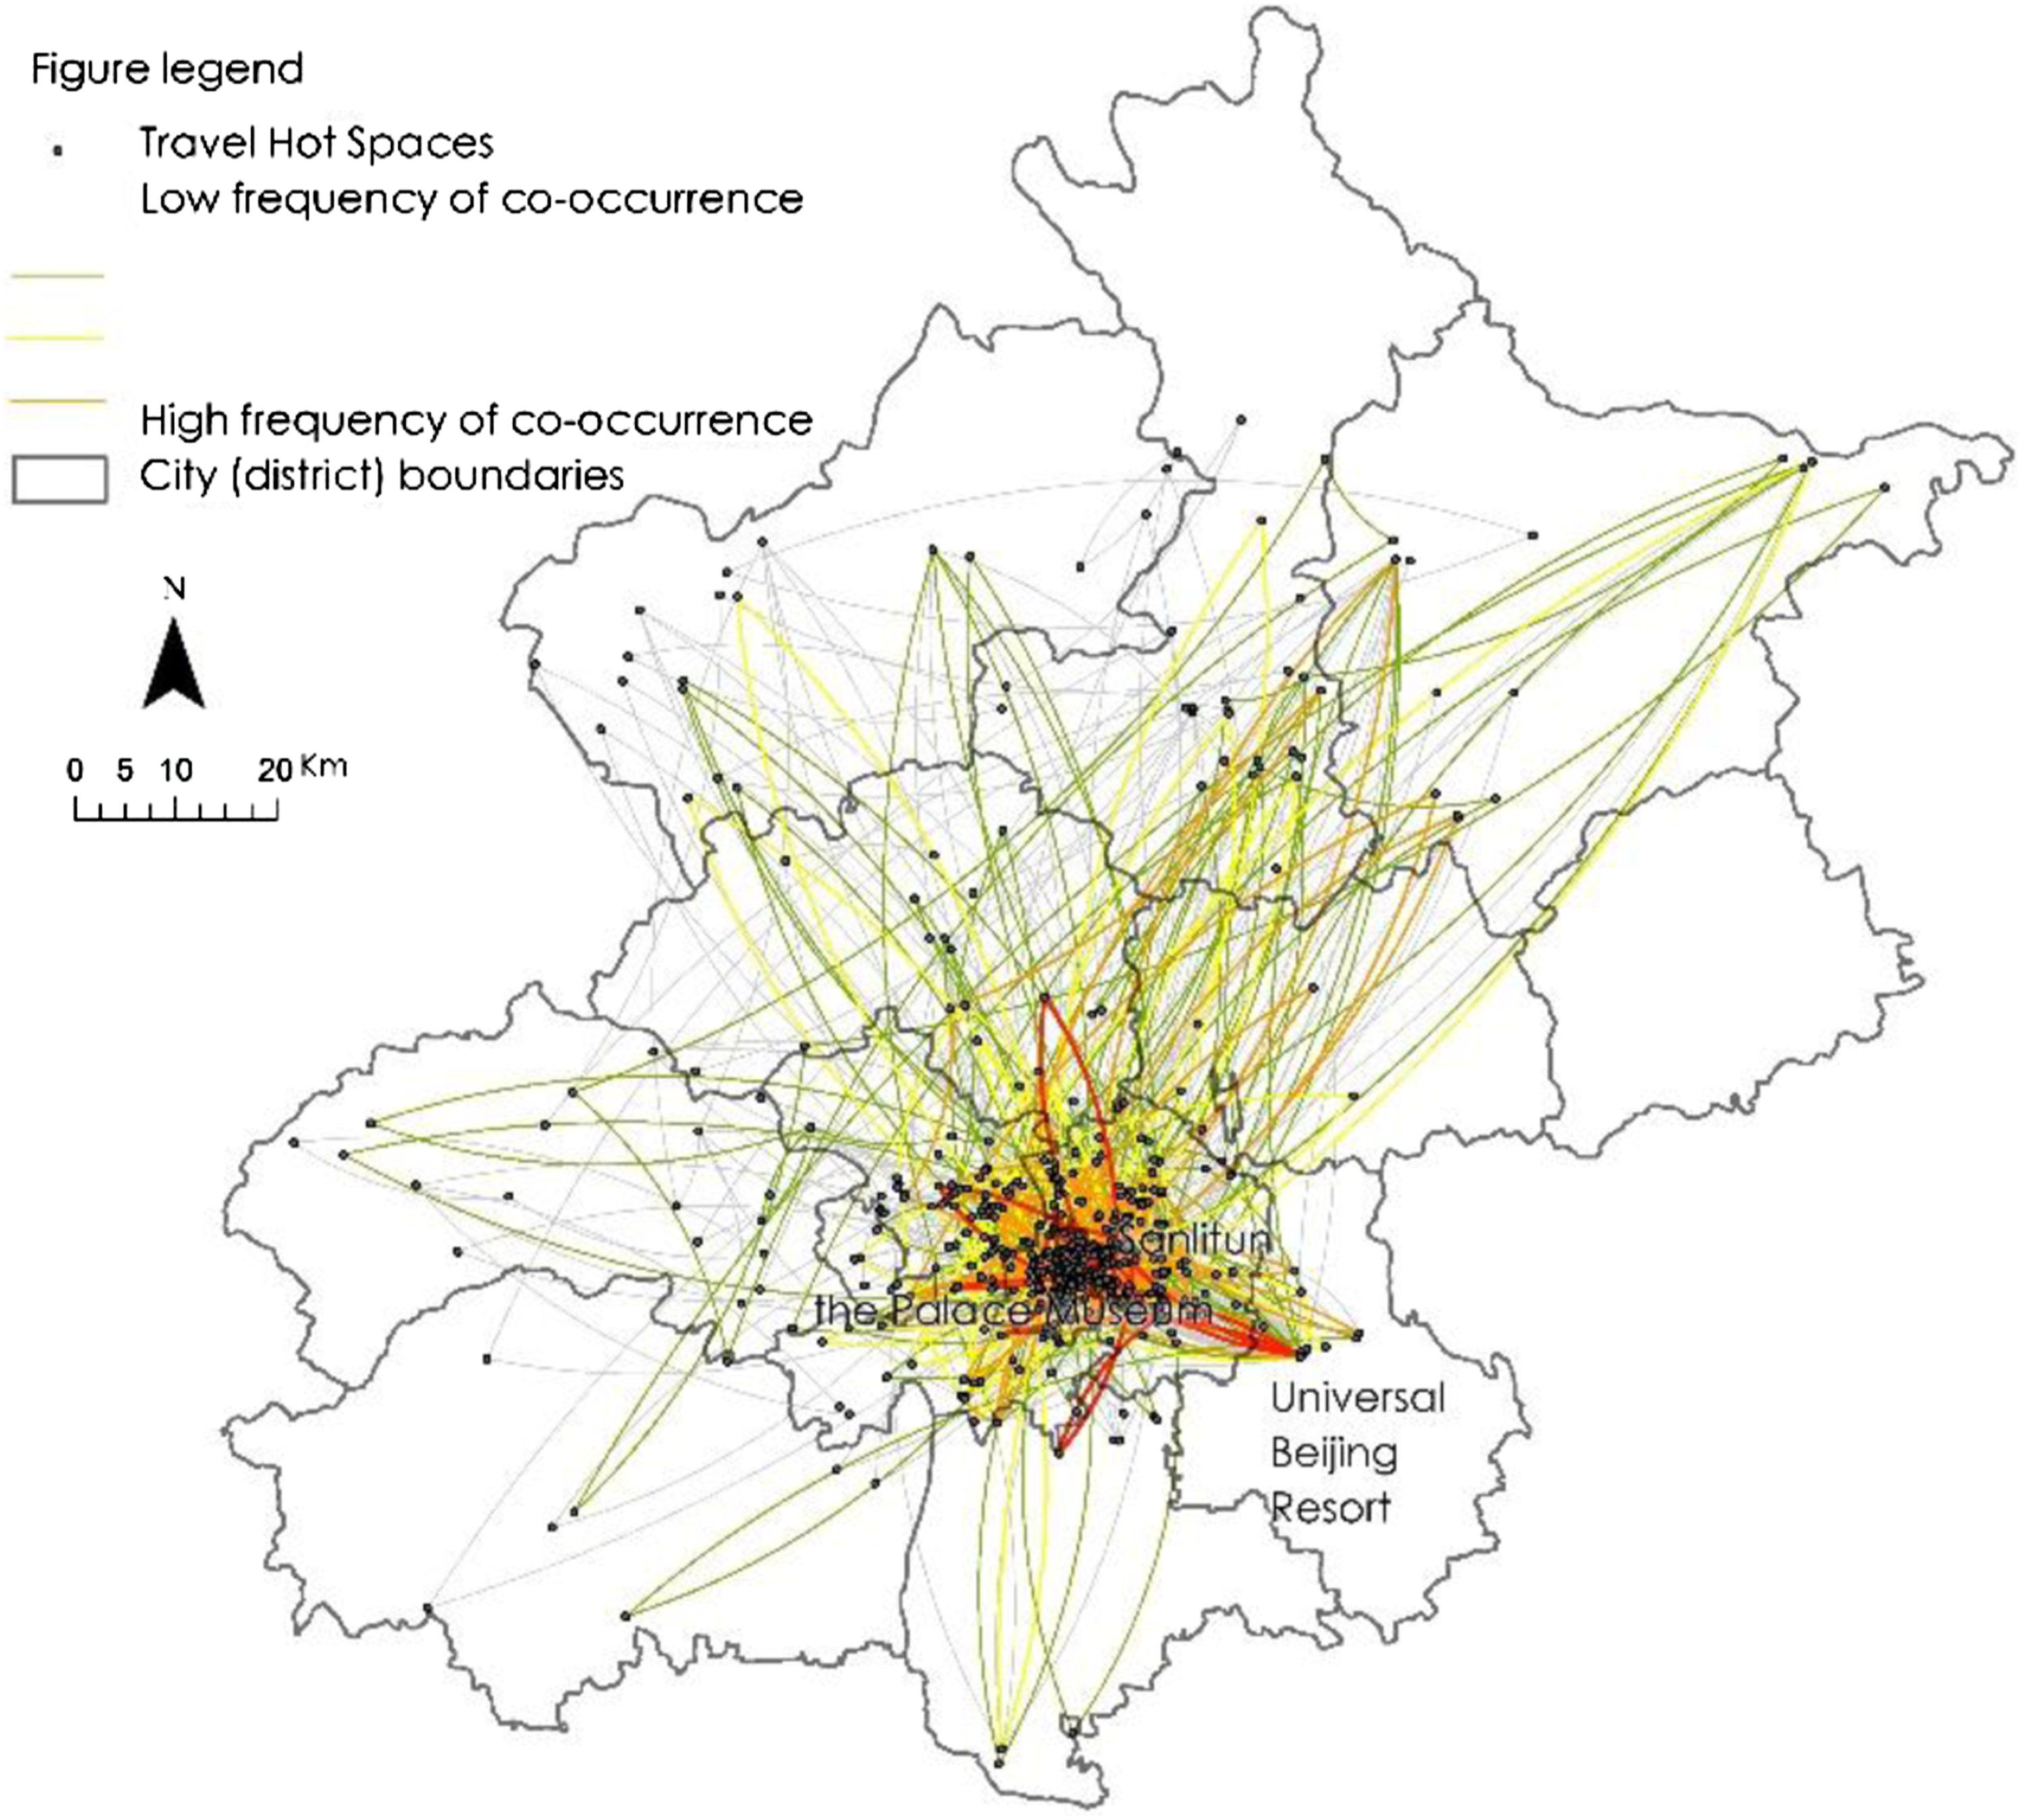
Spatial structure evolution
Concentration–Dispersion–Local concentration
The geographical hotspot of tourism in 2019, 2020, and 2021 is depicted using kernel density analysis, as is the evolution process of “concentration-dispersion-local concentration.” As shown in Figure 5 in the supplementary material, Beijing’s tourist hotspots are mostly concentrated in the ancient city’s core region in 2019, with Tiananmen Square and the Palace Museum at the epicenter of the clustering phenomenon, resulting in a spatial pattern that is essentially “concentrated.” By 2020, as a result of the novel coronavirus outbreak, Beijing’s tourism hotspot space begins to “disperse” to the suburbs, and the distant suburbs outside the six urban districts also exhibit a noticeable increase in tourism hotspot space, and tourists' behavioral preferences begin to shift toward the distant suburbs. In 2021, the scattered structure of the far suburbs has stabilized, but in Tongzhou District a centralized sprawl region dominated by Universal Beijing Resort has arisen. From the three-year temporal change, the spatial heat of Beijing tourism has been impacted in recent years by the unique coronavirus epidemic, with a shift away from urban to rural tourist, and the general structure expanding outward in response to developing tourism hotspots with a local focus. Spatial and temporal evolution of tourism hotspots in Beijing.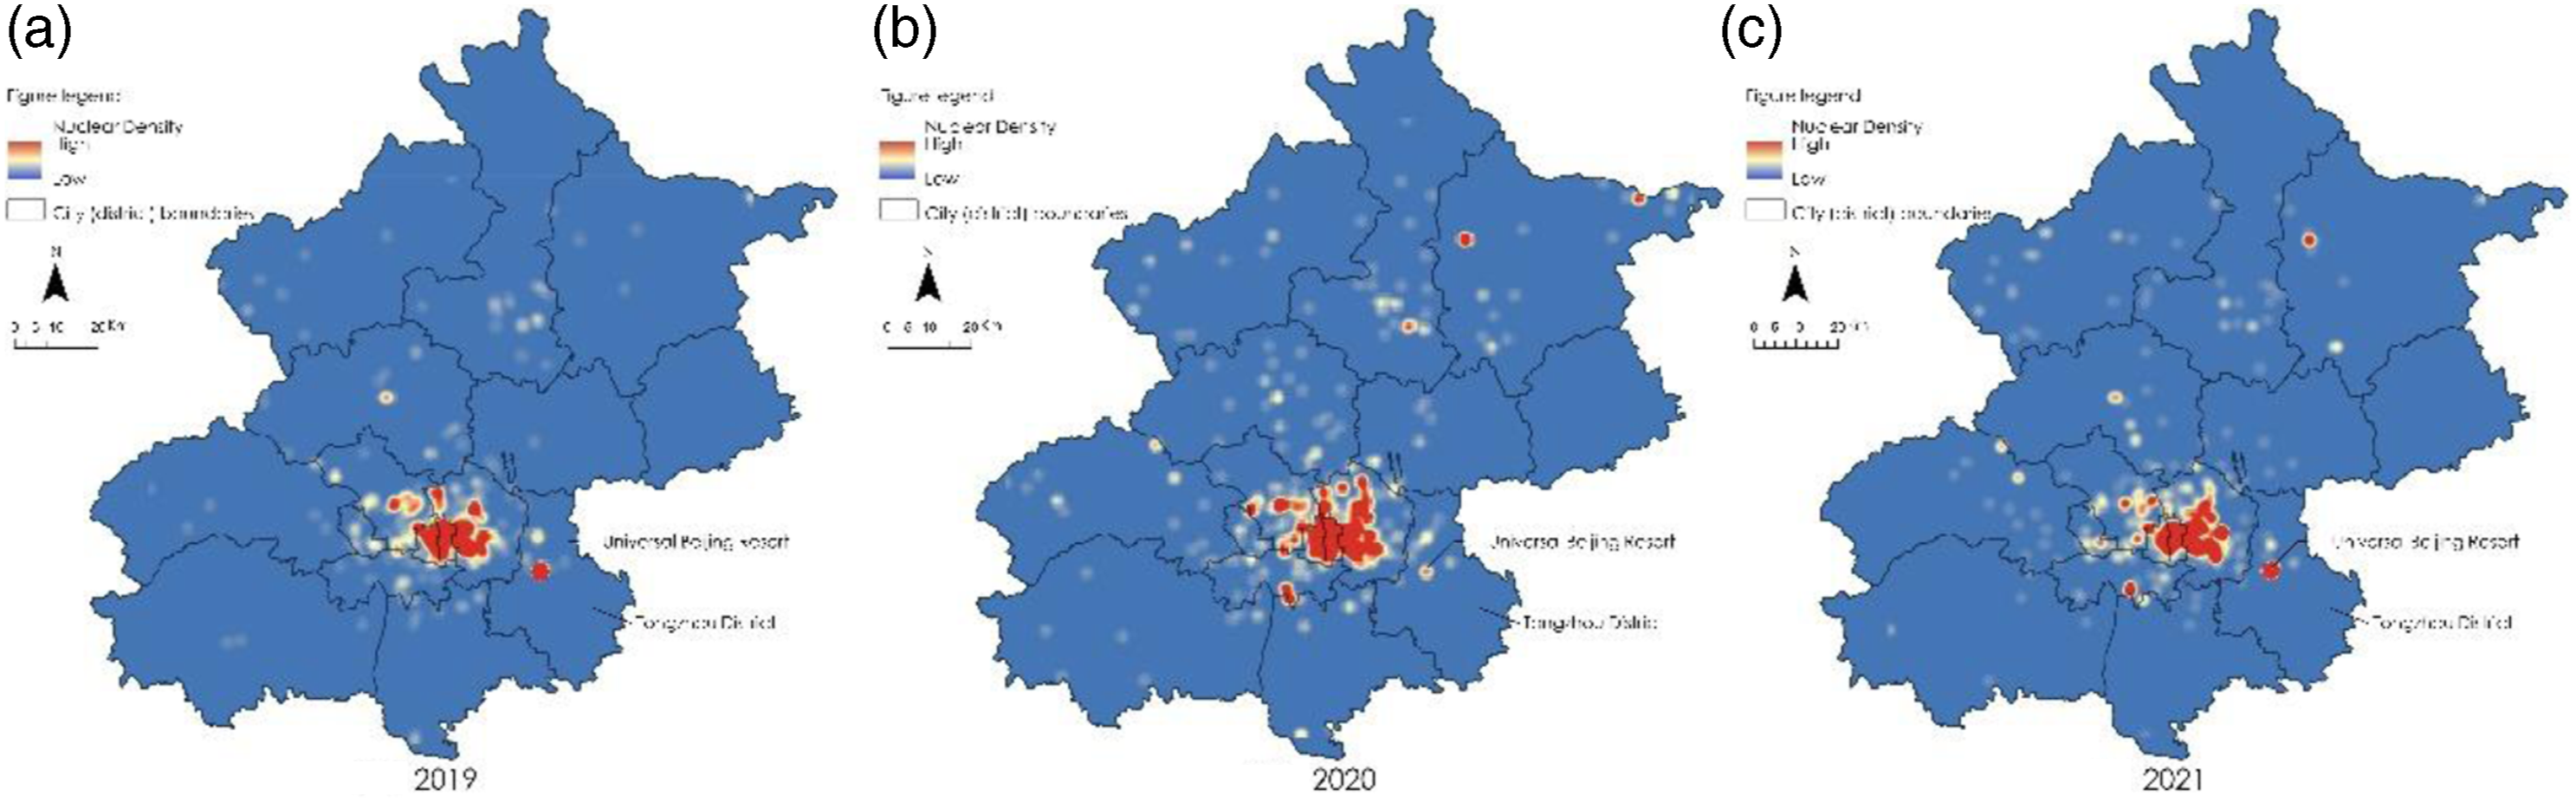
The center of gravity of spatial distribution shifts to the southeast
The evolution process of the center of gravity of Beijing tourism hotspot space in 2019, 2020, and 2021 is plotted for three years using the standard deviation ellipse method, and the results reflect the trend of tourism space’s spatial and temporal distribution, revealing the region’s uneven spatial development. As can be seen in Figure S2, the hot tourist space’s center of gravity is undergoing a tortuous metamorphosis, which manifests itself in the following ways: The directionality of Beijing’s tourism spatial distribution is not obvious in 2019, with a uniform distribution; however, from 2020 to 2019, the center of gravity gradually shifts to the northwest, and the distribution direction of the hotspot changes from the central balanced layout to the northeast-southwest direction, owing to an increase in suburban rural tourism. In 2021, due to the launch of Universal Beijing Resort, the center of gravity begins to move to the southeast, attracting a significant number of visitors, exhibiting a counterclockwise rotating tendency, and the distribution of hotspots is somewhat northwest-southeast.
Analysis of spatial emotional images of tourism hotspots
High-frequency emotional imagery
Using assessment data uploaded by users on the lifestyle-sharing APP Xiaohongshu to clean and separate words, and data representing subjective feelings to analyze word frequency and semantics, “Rost Content Mining” software was used to analyze word frequency and semantics. We gathered and analyzed the top ten review opinion data for hotspaces for semantic and word frequency. Based on the similarity of the evaluation data and the correlation of hotspace elements, the evaluation of various kinds of hotspaces was grouped and analyzed. As seen in Figure S3, six-word cloud maps with representative types were created to depict the various types of hotspaces.
Sentiment map
The sentiment-attitude terms in the comment data accurately represent travelers’ emotional responses to the tourism area. The visitors' favorable sentiment about the tourist space is evaluated from high to low based on the semantic analysis, and the sentiment distribution for each hotspot space is depicted. As illustrated in Figure S4 in the supplementary material, the positive emotions associated with tourism spaces do not exhibit an obvious agglomerative distribution, with the highest overall positive emotions associated with tourism spaces in Daxing and Tongzhou districts, followed by Xicheng and Dongcheng districts, and the lowest overall positive emotions associated with tourism spaces in Yanqing and Shunyi districts, respectively. In terms of the functional distribution of various tourist spaces, the category of public leisure places generates the most favorable feeling, followed by cultural exhibition venues.
Classifying the comment data according to the temporal dimension of the remark, just illustrated in Figure S5 in the supplementary material, there are three overall peaks in tourist sentiment throughout the year (April, July, and September), with the highest levels in July, possibly due to summer vacations, and the lowest levels in January and December, possibly due to the increased likelihood of cold weather conditions in Beijing during these two months. Travelers’ feeling was much higher during the warm months of April to September than during the winter months.
Analysis of factors influencing the popularity of the tourist destination
Influencing factors selection
Table of correlation coefficient results.
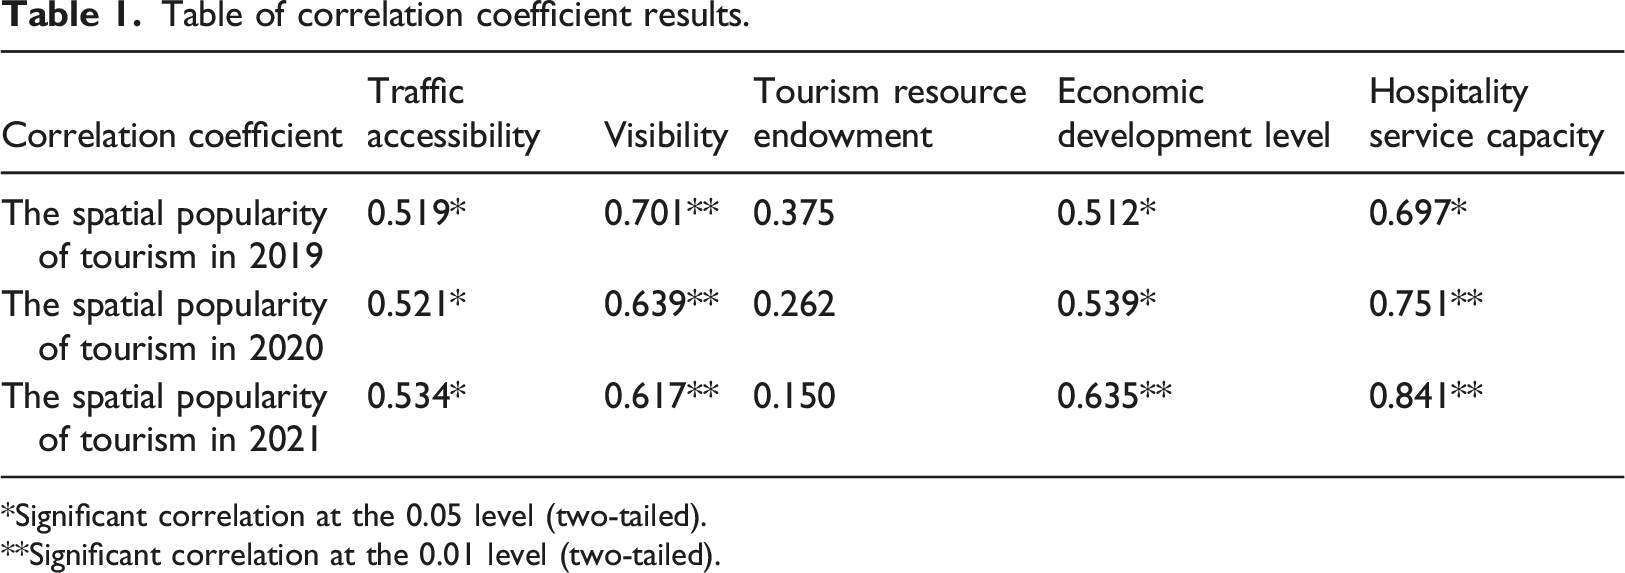
*Significant correlation at the 0.05 level (two-tailed).
**Significant correlation at the 0.01 level (two-tailed).
Influencing factors interaction detection results
Because the popularity of tourist destinations is influenced by a complex intrinsic mechanism that is not limited to the influence of a single influence factor but may include the interaction of each factor, the GeoDetector program is used to detect the interaction of each influence factor (Wang et al., 2017), and the geographic detector detects the influence of the two-two interaction between the aforementioned influence factors on the popularity of tourist destinations. Each influence factor has an enhanced effect on the tourist spot’s popularity. With the exception of traffic accessibility and tourism resource endowment, which exhibit non-linear enhancement, the interaction between other influence factors exhibits a two-factor enhancement, that is, the interaction and cooperation of each influence factor have a significantly greater effect on the tourist spot’s popularity. The relationship between the two-by-two cooperation of traffic accessibility and tourist resource endowment is very powerful, followed by the interaction between economic development level and hospitality service capability.
Correlation analysis results
The spatial popularity of tourism was taken as an independent variable for three time periods, 2019, 2020, and 2021, and Pearson correlation analysis was used to conduct correlation analysis with five influencing factors. The correlation coefficient results can be classified into five categories: extremely strong correlation (1.00.8), strong correlation (0.80.6), moderate correlation (0.60.4), weak correlation (0.40.2), and very weak correlation or no correlation. The findings indicated that all contributing variables had a strong positive association with spatial popularity. In Table 1, the highest correlation is between the reception service capacity of tourist destinations and their popularity; a moderate correlation exists between the level of economic development and accessibility of tourist destinations, and a weak correlation exists between the resource endowment of tourist destinations and their spatial popularity. The impacts are as follows: capacity for welcoming services > visibility > economic development level > accessibility > endowment of tourist resources. (1) The effect of traffic accessibility varies only a little. The effect of traffic accessibility on the popularity of the tourist destination throughout the three-time periods shows a gradually increasing trend year after year, indicating that the effect of improved traffic conditions on the popularity of the tourist destination in Beijing is rather stable. Although traffic accessibility to tourist attractions is a characteristic that is marginally connected to the appeal of the tourist destination, its effect is not sensitive since Beijing’s transportation network is already in place. The development of an ideal road network and the supply of easy, efficient, and rapid transportation for visitors have a positive influence on the growth in popularity of tourist destinations. (2) The total visible impact shows a substantial link, but declines yearly. Although travelers theoretically choose more famous sites during their travels, evidence indicates that this impact is progressively waning. The influence of tourist attractions on their popularity comes in second place among the five influencing factors, and the correlation coefficients are all between 0.6 and 0.8, indicating a strong correlation influence, but on a time scale, the epidemic has reduced tourist selectivity, and thus the influence of tourist attractions on their hotness in Beijing after 2020 shows a decreasing trend. (3) The endowment of tourist resources has a negligible effect. The overall influence of tourism resource endowment on the popularity of tourist destinations is weak and declining year after year, the influence of the number of National a-level tourist areas it contains in the Beijing market is unclear, the traditional sense of tourism resource grade is no longer the primary demand pursued by Beijing tourists, and the influence has a tendency to decay under the influence of the novel coronavirus outbreak. Rather than that, vacationers choose personalization and contemporary places. (4) The degree of economic development has a rising effect year after year. The correlation coefficient between economic development and tourism popularity steadily rises from 0.512 in 2019 to 0.635 in 2021, indicating a shift from moderate to the high association. As a result of the novel coronavirus outbreak, tourism mobility has slowed and travelers are limited to a small number of tourism activities, preferring to travel within the area, whereas the high level of economic development of each district is positively correlated with resident disposable income, with higher resident disposable income having a greater influence on resident travel within the area. Additionally, areas with a high degree of economic growth have a high level of tourist investment, which adds to the development of tourism services and amenities, enhancing their appeal. (5) The capacity of hospitality services continues to grow on a yearly basis. The capacity of tourist destinations' hospitality services has the greatest effect on tourism excitement, with the correlation coefficient increasing from 0.697 in 2019 to 0.841 in 2021 in the temporal dimension, from a strong connection to an extremely strong correlation. Unsurprisingly, the quality and service level of hotels and other tourism hospitality facilities directly affect tourists' travel experiences, and with the development of the Internet, tourists' travel experiences may influence tourists' destination selection, particularly the “bed and breakfast fever” that has gradually developed around Beijing in recent years, making the need for hospitality in the Beijing area has risen year after year, which has contributed to the growth of tourist fever.
Conclusions
This study investigates the hotspots of Beijing’s tourism space using geo-tagged data collected from the popular lifestyle-sharing application Xiaohongshu, analyzing the space’s hot and cold patterns and spatial changes, as well as analyzing the space’s emotional image through review data in order to better understand the inner mechanism of its influencing factors. The study concludes that the data on “Instagram-worthy Locations” demonstrate that people’s behavioral choices are gradually shifting toward urban symbolic consumption, thereby promoting the city’s emerging spatial production, while urban tourism space, with its inherent characteristics of “eating, drinking, playing, and staying,” also reflects the phenomenon of continuous iteration in time and space, and the popularity of tourism space in Beijing also demonstrates obvious spatial and temporal patterns. Additionally, there is a definite geographical and chronological development of Beijing’s tourist zone. The study’s findings indicate that: 1) As shown in Figure 3, the overall spatial structure of Beijing’s tourism hotspots is “C-shaped,” with the core area being primarily concentrated, forming a circular structural distribution of expansion from the core area to the periphery; 2) The spatial evolution of hotspots over time is clearly influenced by seasonal changes, with their spatial center of gravity gradually shifting to the southeast under the influence of the epidemic; 3) According to the results of the average level of influence from 2019 to 2021, in comparison to traffic accessibility, popularity, tourism resource endowment, and economic development level, the hospitality service capacity of tourist places has the greatest impact on the heat of the tourist space, and personalized and new trendy tourist places are more appealing to tourists, as shown in Table 1.
Under the aegis of Internet big data, studying urban tourist hotspots via the lens of “Internet-famous locations” data may assist in thoroughly comprehending the changes in urban tourism spatial structure as a result of cyberspace’s dual function, and so serve as a reference for tourism development. Due to the fact that Xiaohongshu’s user activity has only recently begun to grow, and the difficulty of obtaining its network data, this study was unable to obtain sample data covering a large time span in a time cross-section. However, this study is only a preliminary attempt, and further efforts and exploration are required. The subsequent study will increase the richness of tagging data, further improve the diversity of time series data, and conduct additional analyses.
Supplemental Material
Supplemental Material - Study on the hotspots of urban tourism spaces based on Instagram-Worthy locations data: Taking Beijing as an example
Supplemental Material for Study on the hotspots of urban tourism spaces based on Instagram-Worthy locations data: Taking Beijing as an example by Lai Fan and Dayu Zhang in Environment and Planning B: Urban Analytics and City Science
Footnotes
Author contributions
Writing-original draft preparation, L.F.;
software, L.F.;
data curation, L.F.;
funding acquisition, D.Z.
All authors have read and agreed to the published version of the manuscript.
Declaration of conflicting interests
The author(s) declared no potential conflicts of interest with respect to the research, authorship, and/or publication of this article.
Funding
The author(s) disclosed receipt of the following financial support for the research, authorship, and/or publication of this article: This work was supported by the the State Key Project of National Natural Science Foundation of China (Grant number. 51938002), and the General Program of National Natural Science Foundation of China (Grant number. 51878021).
Supplemental Material
Supplemental material for this article is available online.
Author Biographies
References
Supplementary Material
Please find the following supplemental material available below.
For Open Access articles published under a Creative Commons License, all supplemental material carries the same license as the article it is associated with.
For non-Open Access articles published, all supplemental material carries a non-exclusive license, and permission requests for re-use of supplemental material or any part of supplemental material shall be sent directly to the copyright owner as specified in the copyright notice associated with the article.