
Abstract
The ambition towards net-zero emission fuels the significance of electric vehicle charging infrastructure (EVCI) as a strategic asset. Yet, a conspicuous gap remains in the comprehensive quantitative analysis of its impact on carbon emissions stemming from fossil fuel combustion, referred to as ODIAC-CE. This study embarks on a longitudinal comparison of EVCI and ODIAC-CE data in 2018 and 2020, further classifying cities by scale to analyze the association between expansion of EVCI and ODIAC-CE change. Utilizing a battery of analytical tools, including correlation analysis, spatial autocorrelation, and coupling coordination analysis, the study dissects the evolving relationship between EVCI and ODIAC-CE within Yangtze River Delta in China. The results underscore a growing interdependence between EVCI expansion and ODIAC-CE change, yet pronounced heterogeneities in coupling coordination are evident across urban scales. Megacity and supercity exhibit quality coordination between rapid expansion of EVCI and ODIAC-CE dynamics. However, in most large, medium-sized, and small cities, the impact of EVCI growth on ODIAC-CE change has proven to be inconsistent or mismatched, affected by various factors such as location and infrastructure, industrial and technological patterns, and social practice and awareness. The study provides systematic insights into potential solutions for decarbonization through EVCI deployment at regional and city levels.
Keywords
Introduction
The global imperative for decarbonization has driven the transition towards cleaner energy options worldwide. The transportation sector, responsible for 37% of carbon emissions in 2021 (IEA, 2023), is a key target for the decarbonization initiatives, emphasizing the need for widespread access to public charging infrastructure (Mastoi et al., 2022) and a scientific understanding of the relationship between human activities and the resource environment. Electric vehicles (EVs) offer a promising solution for lowering greenhouse gas emissions in transportation (Veza et al., 2023). As early as January 2019, a report by the Center for American Progress (Costa et al., 2019) argued that including emissions mitigation targets in infrastructure bills would help achieve measurable and ambitious reductions. In this sense, studying the regional carbon reduction potential brought by EVs and charging infrastructure is crucial for effectively mitigating climate change and advancing towards carbon neutrality.
Addressing urban carbon mitigation has become a key goal in China with the ambitious 2030 peak emissions and 2060 carbon neutrality commitments. Urban areas, characterized by intensive human activities, contribute to 71%–76% of CO2 emissions from energy combustion (Yu et al., 2020). With China’s urban population reaching 831 million in 2018 (Wang et al., 2019) and a projected influx of 200 million new urban residents, 80% into urban agglomerations, by 2030, the Yangtze River Delta (YRD) is expected to become the world’s largest urban agglomeration. This expansion will lead to increased urban infrastructure and ensuing high emissions (Sun et al., 2022). Consequently, the significance of carbon footprint (CF) research is amplified, enabling quantification and comprehension of the environmental impact of human activities. It can further guide policy decisions, foster sustainable practices, and promote mitigation strategies to combat climate change.
Numerous studies highlighted the vital role of electric vehicle charging infrastructure (EVCI) in facilitating the low-carbon transportation transition (ARUP, 2021; CHINA, 2021). However, accurately measuring the urban CF attributable to EVCI has proven challenging when evaluating its environmental impact. Several researchers believed that EVs have lower CF throughout their lifecycle, and EVCI supports the EV industry scale up and facilitates a cleaner power mix (Hamurcu and Eren, 2023; Qadir SA et al., 2024), leading to reduced carbon emissions. Additionally, researchers have employed life cycle assessments and emissions modeling (Li et al., 2022; Veza et al., 2023) to assess the overall environmental impact of EVs and EVCI. Nevertheless, there is an absence of statistical and geographical analyzes to specifically quantify the carbon mitigation potential of EVCI systems. In response to these debates, the paper supplements the research on the emission reduction potential of EVCI, to effectively promote targeted green policies, industrial chains, and daily behaviors at government, enterprise, and individual levels.
Current research on quantifying the CF of EVCI exhibits deficiencies in data acquisition, evaluation methods, and impact analysis. Recently, a growing number of scholars have turned their attention towards investigating the spatio-temporal characteristics of carbon emissions at urban scales by using raster images (Liu et al., 2018). Yang et al. (2020) have shown that the integration of multi-source data, such as night-light satellite data and statistical yearbooks, enhances the accuracy of measuring city-scale carbon emission. Therefore, this study integrates raster images with geo-referenced, vector point-of-interest (POI) data to mitigate challenges associated with lagged or incomplete panel data.
This study aims to gain insights into the potential effect of EVCI expansion on the carbon emissions from fossil fuel combustion (ODIAC-CE) in YRD. Three key steps are employed to investigate the longitudinal correlation between EVCI and ODIAC-CE within YRD, utilizing correlation analysis, spatial autocorrelation, and coupling coordination degree (CCD) model. Initially, a Spearman’s rank correlation analysis (Spearman’s ρ) is performed to examine the correlation between average EVCI density and average ODIAC-CE. Subsequently, Getis-Ord G-statistics is applied to assess spatial autocorrelation, ensuring non-random, robust, and highly significant spatial pattern. Finally, the CCD model is adopted to explore interdependence and coordination efficiency between EVCI and ODIAC-CE, offering valuable insights into potential solutions for decarbonization through EVCI deployment at regional and city levels.
The structure is as follows: Part 2 reviews the previous literature; Part 3 introduces the data and methods; Part 4 outlines the strong interdependence between EVCI and ODIAC-CE but heterogeneity in coordination efficiency across various urban scales; in Part 5, the factors shaping diverse coupling and coordination efficiencies, potential strategies for emissions reduction, and research limitations are discussed; and finally, the conclusions are summarized in Part 6.
Literature review
Quantitative research on carbon emissions
Existing literature extensively investigates the definition and models of carbon emissions, energy mapping, and evaluation criteria. These studies have the primary goal of quantifying CF, assessing the impacts, establishing effective methods for carbon reduction, and providing guidance for achieving low-carbon and sustainable urban development. Huang et al. (2017) integrated and developed a specific calculation methodology for CF accounting in urban buildings. Focused on the transportation system, Chen et al. (2017) conducted a comparative analysis of residents’ modes, distances, and corresponding energy consumption before and after the opening of rail transit, resulting in the establishment of a carbon reduction method for rail systems.
The current methods used for quantifying carbon emissions are integrative and offer valuable scientific insights and practical guidance for achieving sustainable development with lower CF. Qin et al. (2019) analyzed driving factors and policy implications of CO2 emissions in 171 Chinese cities, utilizing geographically weighted regression and spatial autocorrelation analysis. Lately, Feng and Zhou (2023) emphasized the importance of quantitatively studying the impact weight and influence of regional heterogeneity in urban spatial structure elements on carbon emissions efficiency. Typically, studies utilize data from diverse sources and use mathematical models for estimation. However, they encounter challenges in data accuracy, complexity, and regional variations, which may result in limitations in their applicability across different contexts.
Evolution of carbon emission estimation
Carbon emissions estimation can be categorized into three approaches. The first approach uses the unified method provided by the guidelines of Intergovernmental Panel on Climate Change to estimate approximate carbon emissions, based on energy-related statistics data (IPCC, 2019; Qiao et al., 2024). However, the primary limitation of this approach lies in data availability. The second method employs direct measurements for precise emissions data. This method is time-consuming and applicable to certain industries where emissions sources are relatively concentrated and can be directly monitored and measured, such as the power generation (EPA, 2016), automative manufacturing (Pero et al., 2018), and cement production (Maierdan et al., 2024). The third approach utilizes NLS data, leveraging its ability to well reflect human social and economic activities, which are major contributors to carbon emissions. Recent attempts have been made to use night-light satellite images from DMSP-OLS and NPP-VIIRS in studying regional carbon emissions (Wu et al., 2019; Yang et al., 2020). However, the application of night-light images for estimating emissions remains relatively understudied, primarily focusing on global and national scales.
The role of EVCI
Infrastructure plays a significant role in shaping urban CF, promoting researchers to recognize the vast potential of EVCI in reducing carbon emissions within the infrastructure sector. Existing studies delve into various aspects of EVCI, such as electrification types, policy constraints, optimal deployment, and socio-economic impacts, shedding light on emerging constraints such as oil supply and urban infrastructure in fast-growing Chinese cities (CHINA, 2021; Qin et al., 2019). Addressing the challenges hindering the widespread adoption of EVs, scholars emphasize that sufficient charging infrastructure is critical to accelerate EV adoption, mitigate range anxiety, improve environmental benefits, optimize energy grid, and ensure a seamless transition to more sustainable mobility (CHINA, 2021). Optimization approaches, including genetic algorithms, were explored to determine optimal locations for EVCI, considering customers’ needs and deployment requirements (Akbari et al., 2018). Furthermore, heuristic algorithms were designed to optimize regional charging schedules and minimize GHG emissions resulting from power (Tu et al., 2020). Collectively, these studies provide valuable insights into the potential of EVCI in carbon mitigation, offering guidance for the development and optimization of EVCI.
Research gaps
Existing research on the carbon reduction potential of EVCI is insufficient in multiple aspects. First, the lack of standardized measurement methods and data collection techniques (ARUP, 2021) across previous studies hampers comparisons and generalizations across diverse regions and contexts. Second, previous studies often dwell either at the national or urban level, without incorporating the essential mesoscopic regional perspective or city-specific (Chen et al., 2017; Qin et al., 2019) analyses, whereas the two perspectives are essential for a holistic understanding of EVCI’s carbon reduction potential. Third, the existing literature lacks a comprehensive geographic analysis that integrates macro and micro perspectives, leaving the full impact of EVCI on carbon mitigation inadequately assessed.
Data and methodology
Study area
China’s regional development is uneven (Li et al., 2022). Compared with other regions, YRD is a key area for carbon emission reduction in China, contributing 16% of the national carbon emissions (Wei et al., 2022), and has a complete and high-density transportation infrastructure. Meanwhile, YRD is the largest urban agglomeration in China, with a complete range of cities, including 1 megacity, 1 supercity, 14 large cities, 7 medium-sized cities, and 18 small cities. Therefore, in the context of global decarbonization (https://www.ndrc.gov.cn/xwdt/ztzl/cjsjyth1/xwzx/202012/t20201231_1261108_ext.html), it is of great significance to gain insights into the carbon mitigation potential afforded by EVCI in YRD. YRD (see Supp Fig S1) covers an area of about 358,000 square kilometers, including Shanghai and the provinces of Jiangsu, Zhejiang, and Anhui. The region is one of the three metropolitan areas, home to 15% of China’s population and contributing around a quarter of China’s GDP.
Data selection and processing
ODIAC-CE dataset
The ODIAC-CE data in this paper is sourced from the Open-Data Inventory for Anthropogenic Carbon dioxide (ODIAC) dataset, a global high-spatial-resolution gridded emissions data product. As of July 28, 2023, we obtained the latest ODIAC2022 version and extracted the raster data from 2018 to 2020 (https://db.cger.nies.go.jp/dataset/ODIAC/DL_odiac2022.html). The raw monthly data in the GeoTIFF format provides estimates of emissions’ spatial distribution at a 1 × 1 km spatial resolution, using plant profiles (emissions intensity and geographical location) and satellite-observed nighttime lights. The study uses the annual GeoTIFF data aggregated from the monthly data.
EVCI POI data
The EVCI POI data, which illustrates the distribution of EVCI, was sourced from Baidu Maps. It was extracted using a web crawler on July 27, 2023, covering data from 2018 to 2020. The dataset comprises 7387 records in 2018 and 9900 records in 2020. The EVCI POI data provides attribute information such as location, type, and timestamp, making it a valuable source of social perception data. Besides, the EVCI POI data facilitates integration with geospatial and remote sensing data.
Methods
This study explores the potential for ODIAC-CE reduction facilitated by EVCI within YRD across the years 2018 and 2020. The study is divided into three steps (see Figure 1). In the initial step, ODIAC-CE data for the years 2018 and 2020 are skillfully crafted by calibrating and aggregating raw monthly data. Statistical table by city is then generated using the 8 × 8 km fishnet in ArcGIS. In the second step, EVCI POI data is calculated using kernel density. A statistical table is then generated, summarizing the average EVCI density by city based on the 8 × 8 km fishnet. In the third step, the average EVCI density and average ODIAC-CE undergo various analyses, including SPSS correlation analysis using Spearman’s ρ, spatial autocorrelation with Getis-Ord G-statistics, and CCD model, all performed based on 8 × 8 km fishnet for higher resolution assessment. Finally, the study derives spatiotemporal insights between EVCI and ODIAC-CE in 2018 and 2020. Technical route.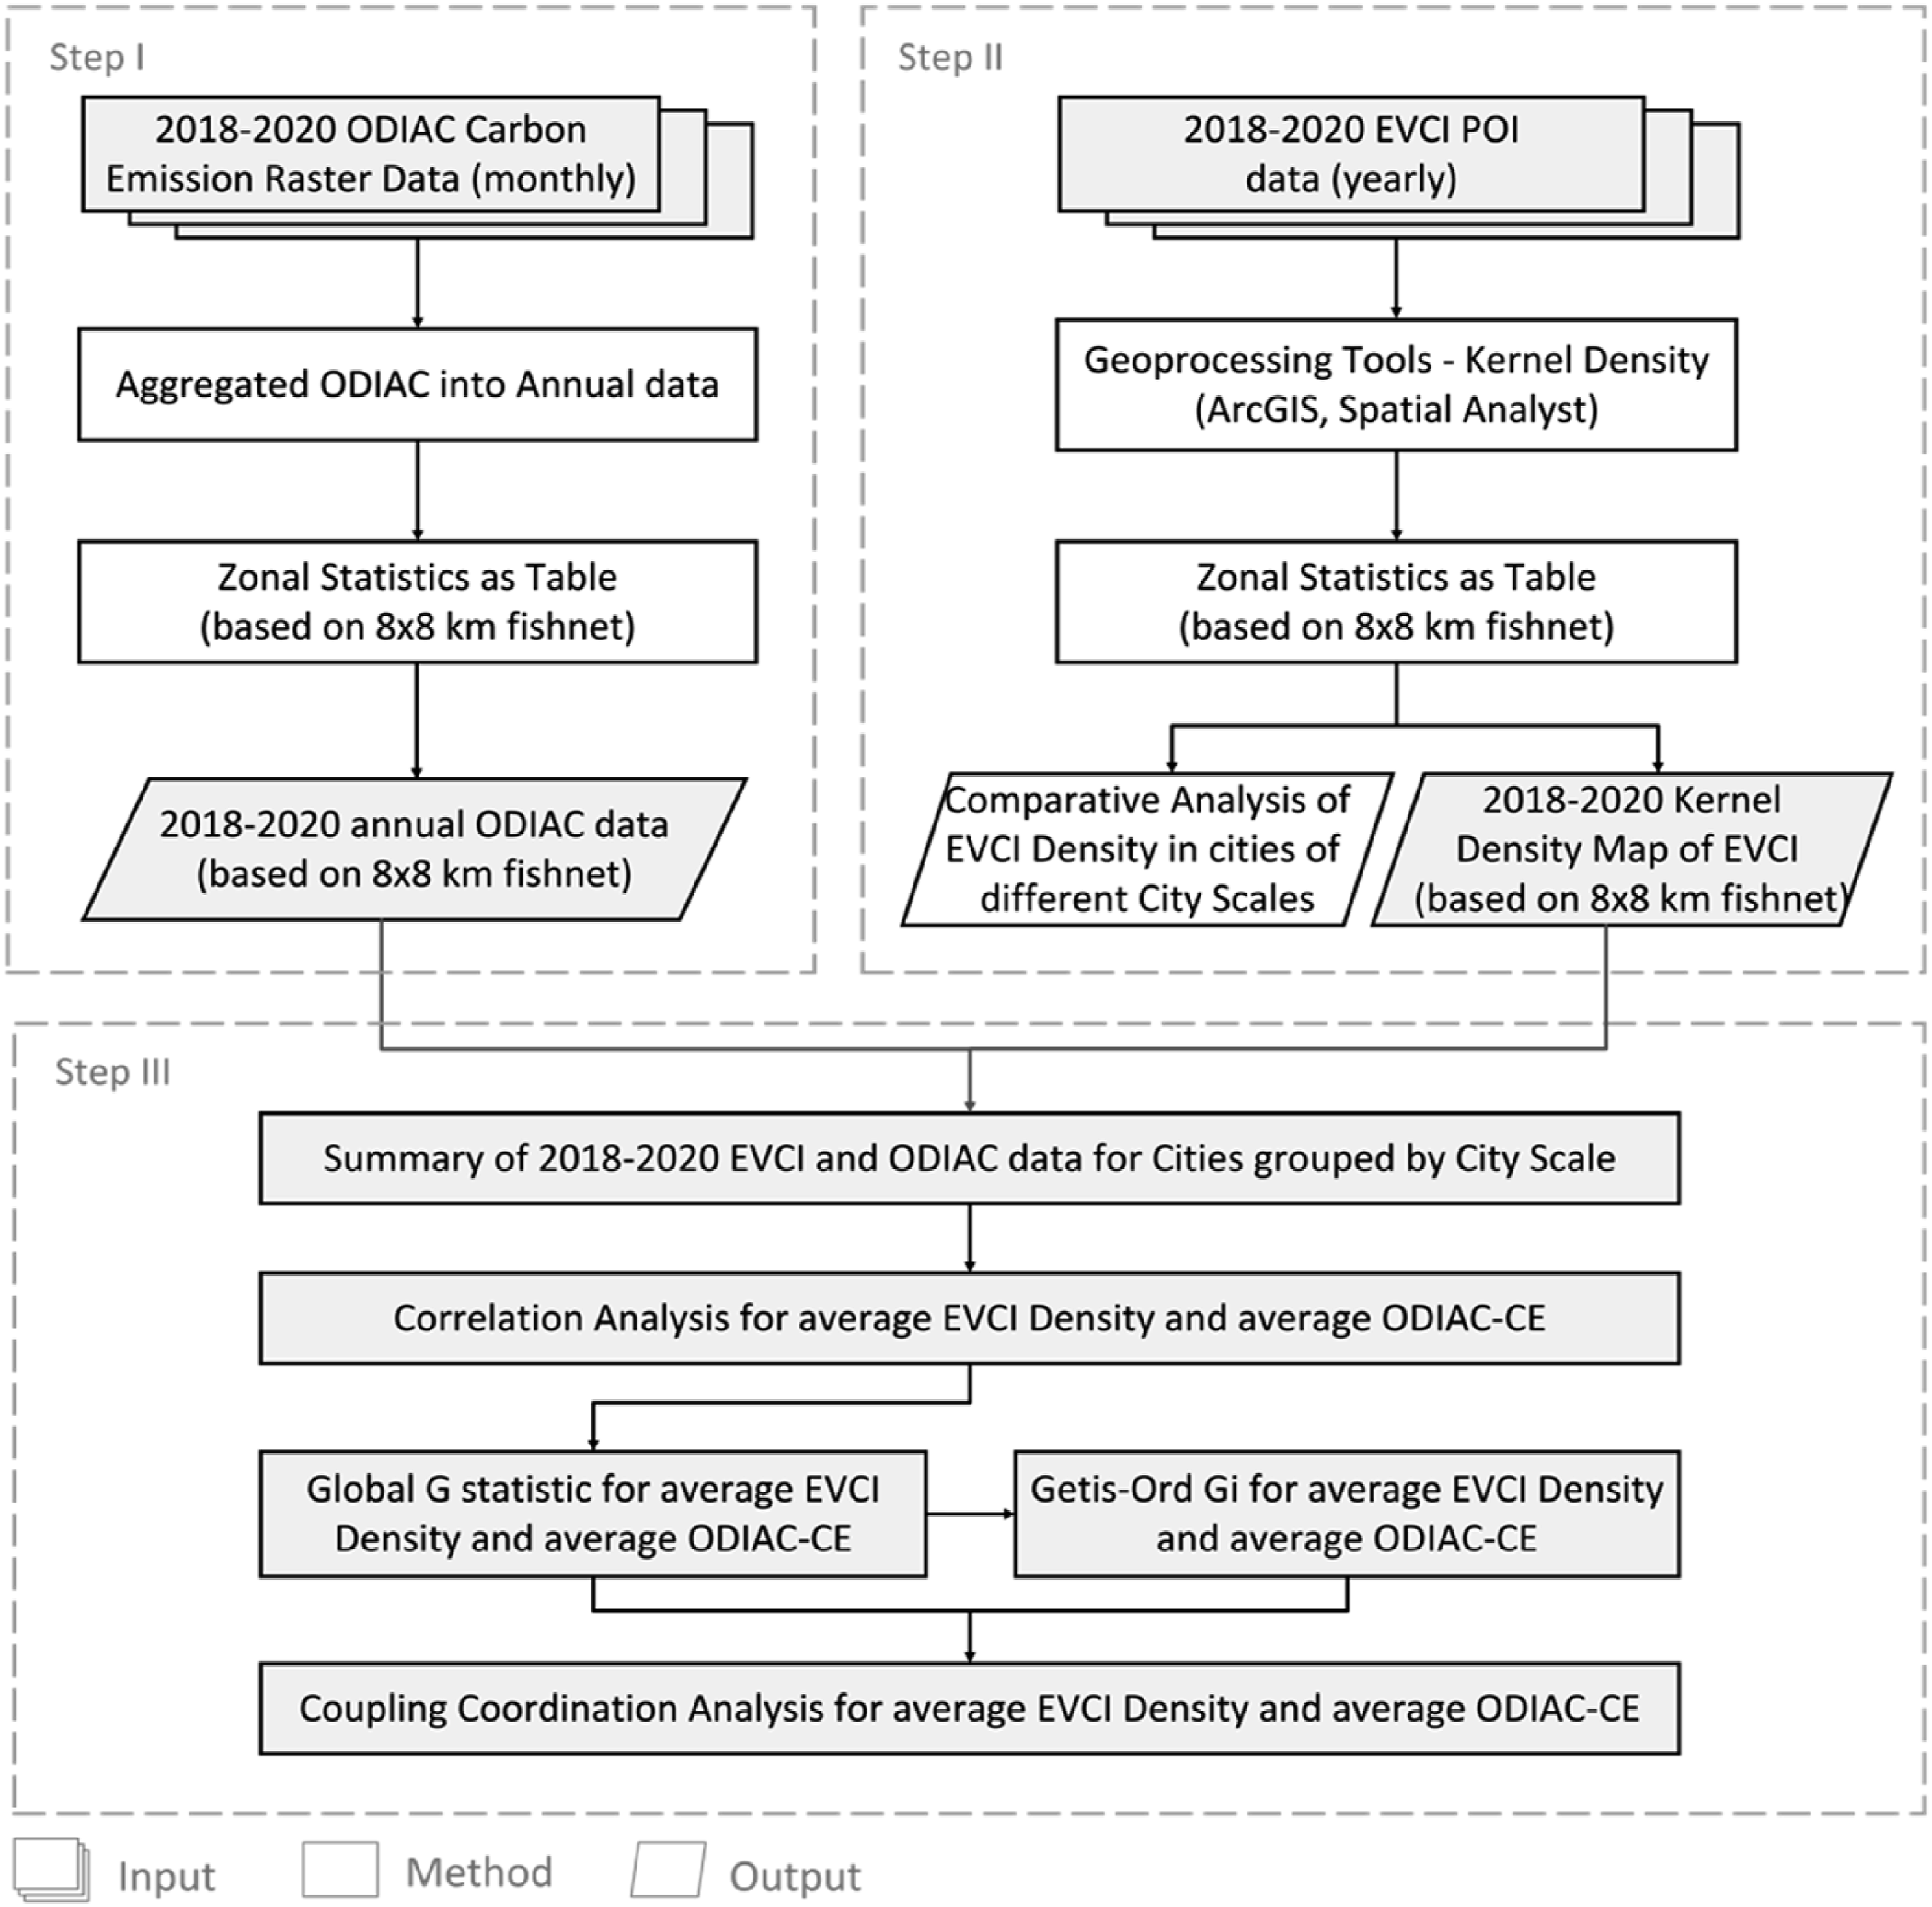
Spatial autocorrelation with Getis-Ord G-statistics
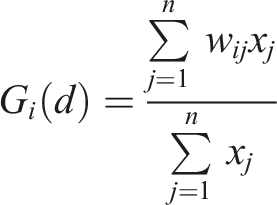
The Getis-Ord G-statistics analyze spatial clustering patterns within a dataset (Ord and Getis, 1995). The Global G statistic computes a single statistic for the entire study area, while the Gi statistic is an indicator for local spatial autocorrelation for each data point, discerning cluster structures of high or low concentration. The Global G statistic and local Gi statistics can be calculated as follows:
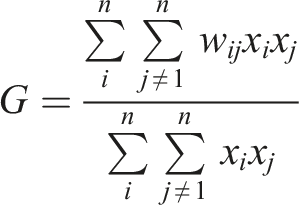
The Getis-Ord Gi statistic is specifically used to detect spatial clusters of high values (hotspots) or low values (coldspots) in a dataset. It calculates the z-score for each feature based on the values of the feature and the values of its neighbors. A high positive z-score indicates that a feature is surrounded by other features with high values, while a low negative z-score indicates that a feature is surrounded by other features with low values. The specific calculation formula is as follows:
CCD model
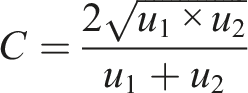
The degree of coupling reflects the degree of mutual dependence among multiple systems. The degree of coordination measures the degree of benign coupling within multiple system coupling relationships (Li et al., 2022) and reflects the quality of coordination. The calculation model of the coupling degree between EVCI density and ODIAC-CE is as follows:
Results
Summary for EVCI and ODIAC-CE
This study aggregates EVCI and ODIAC data across the years 2018 and 2020. Within the YRD, the average growth rate of EVCI density is 33.9%. This growth pattern is consistent across the five urban scales: megacity at 32.0%, supercity at 34.7%, large cities at 44.6%, medium-sized cities at 42.1%, and small cities at 32.3%. Conversely, the average growth rate of ODIAC-CE within the YRD is 15.1%. The trend persists across the five urban scales: megacity at 26.0%, supercity at 21.6%, large cities at 7.0%, medium-sized cities at 26.9%, and small cities at 16.0%.
As depicted in the scatterplot in Figure 2(C), the relationship between EVCI density and ODIAC-CE demonstrates distinct patterns across five urban scales. Small cities gravitate towards the domain of low EVCI density and ODIAC-CE. Medium-sized cities exhibit a modest uptick in EVCI density paired with a wider range of ODIAC-CE values. In contrast, large cities witness a substantial surge in EVCI density coupled with a broad dispersion of ODIAC-CE. The realm of megacity, Shanghai, is characterized by both immensely high EVCI density and ODIAC-CE values. Statistics of ODIAC-CE and EVCI density in 2018 and 2020. (A): Geostatistics of ODIAC-CE and EVCI Density by City, (B): Changes in average ODIAC-CE across Five Urban Scales, (C): Association between EVCI Density and ODIAC-CE by Urban Scale, (D): ODIAC-CE Statistics by City, (E): Changes in average ODIAC-CE across Five Urban Scales).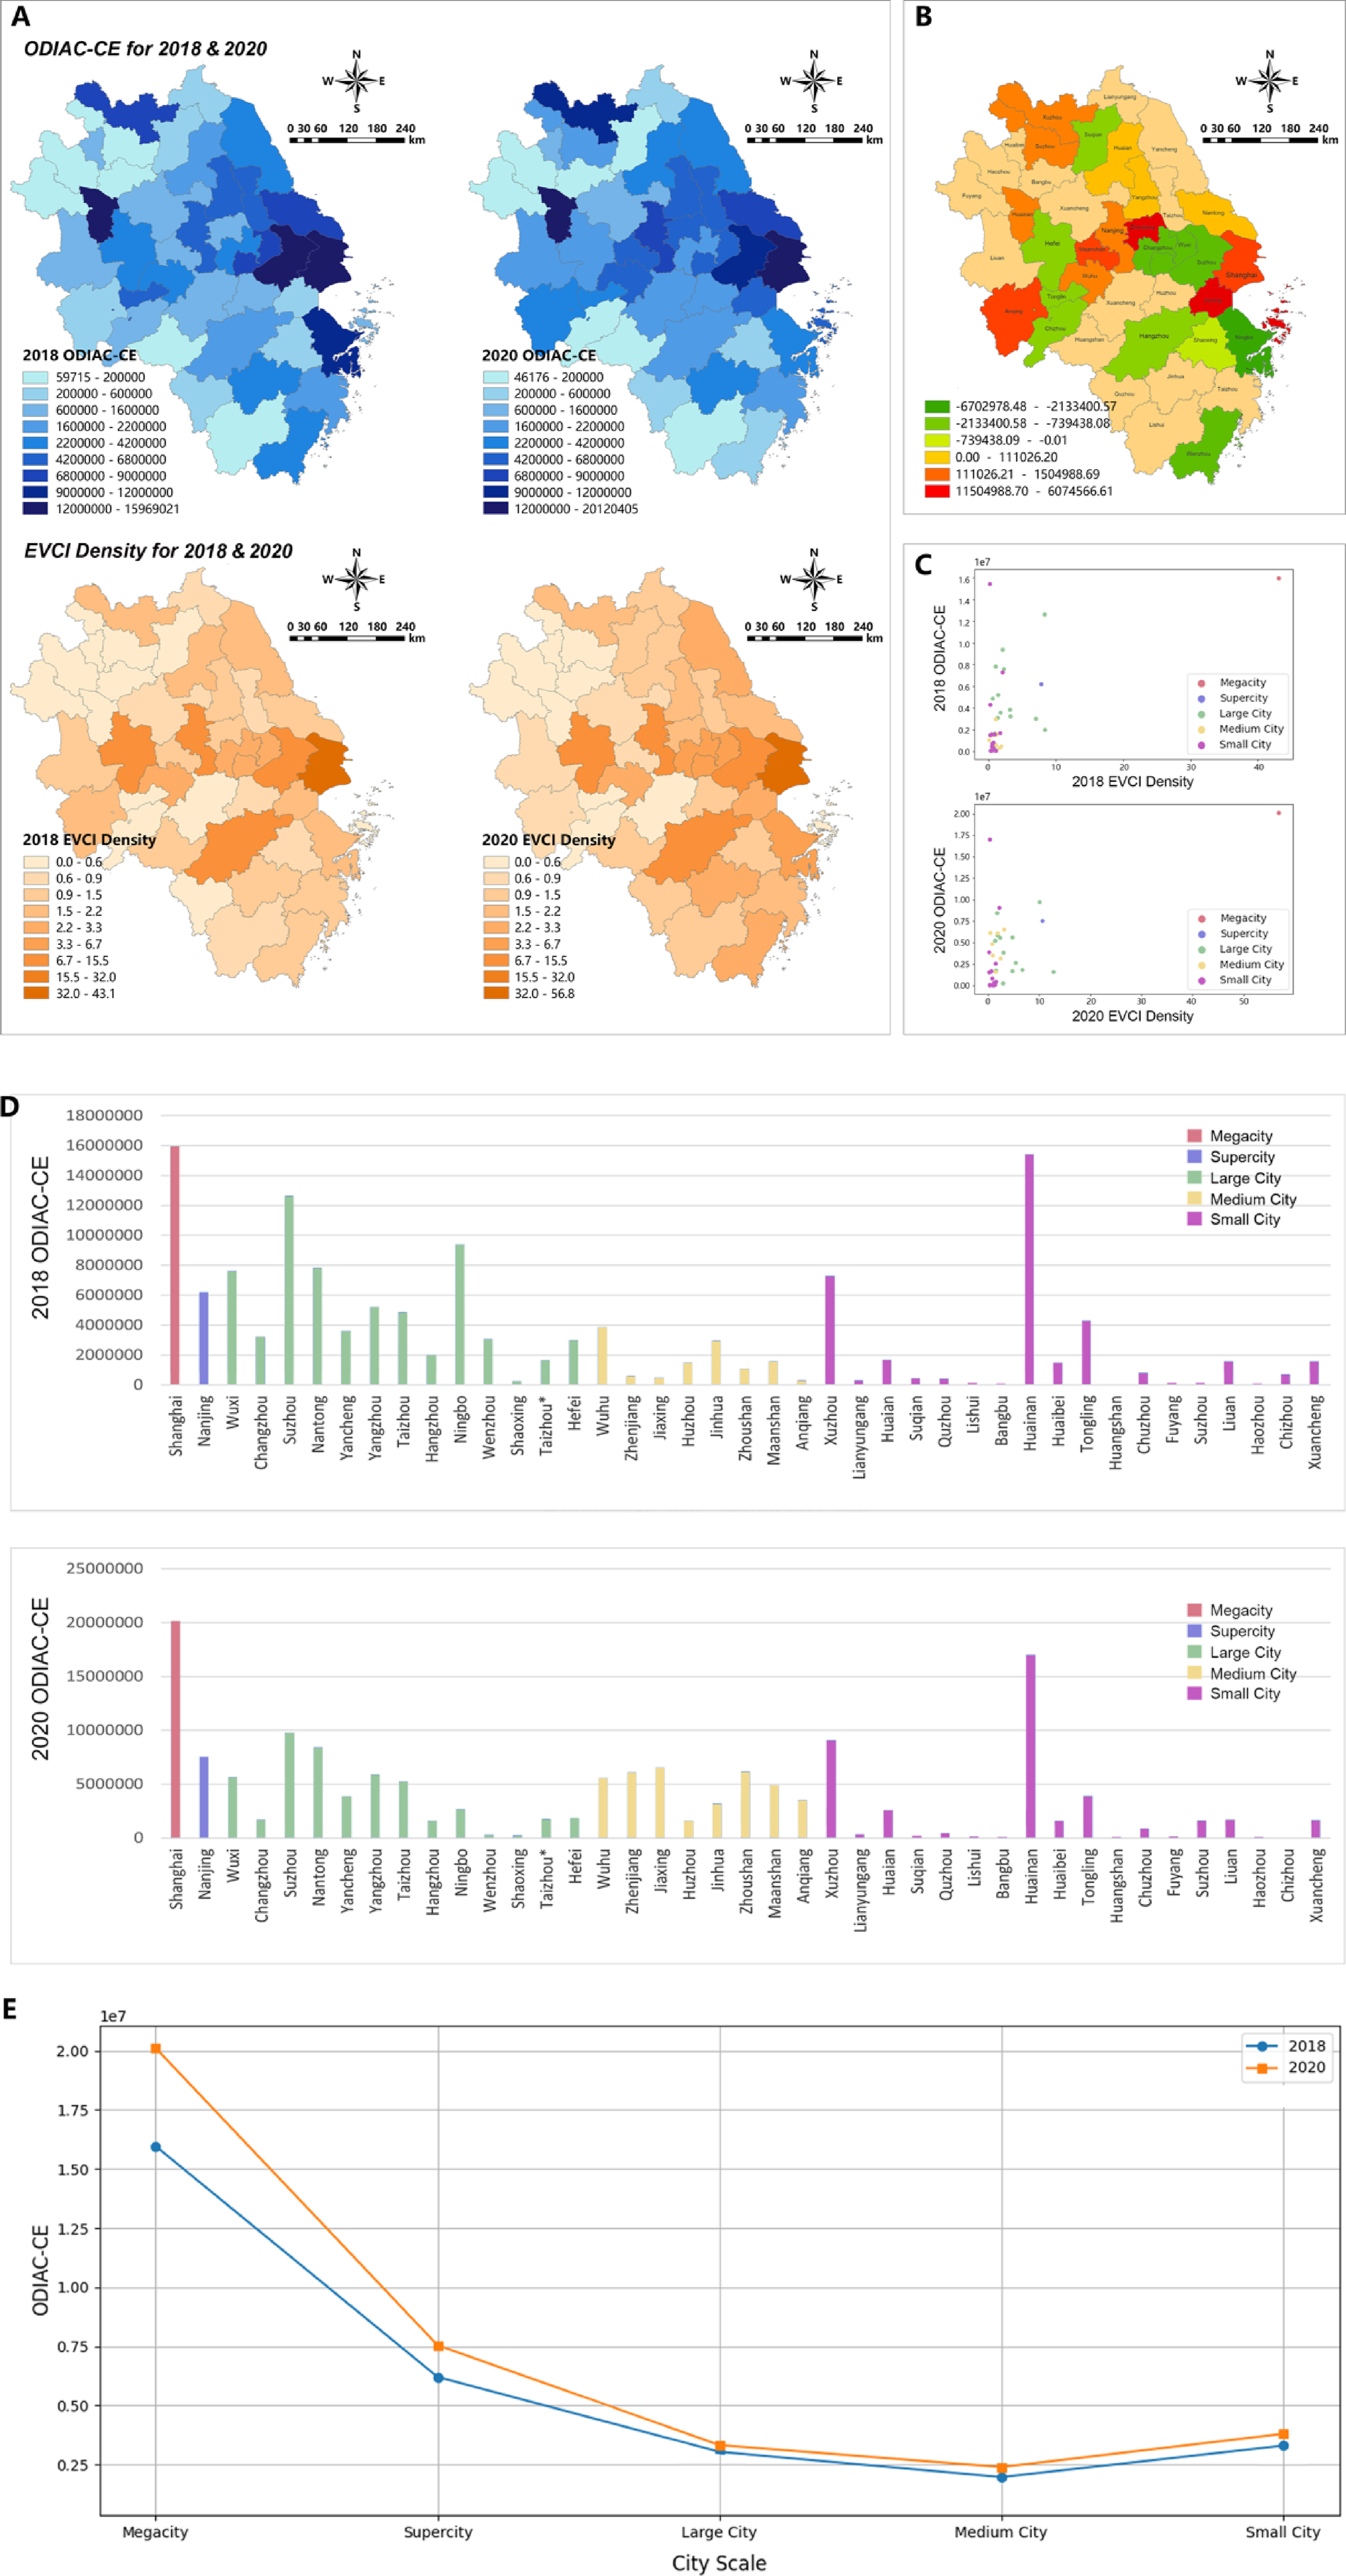
Urban scale significantly influences ODIAC-CE, evident from Figure 2(D). Broadly, megacity inhabits the highest echelon, followed by supercity, large cities, medium-sized cities, and small cities. Interestingly, the ODIAC-CE values of resource-based industrial cities like Huainan and Xuzhou (https://export.shobserver.com/toutiao/html/461777.html) among the small cities rival those of the first and second echelons. This phenomenon can be attributed to Huainan’s status as a coal-centered city and a pivotal power hub in East China, while Xuzhou’s industrial landscape thrives on coal and chemicals. As shown in Figure 2(E), there is an observable increase in the average ODIAC-CE across various urban scales in 2020. Notably, except for small cities, the average ODIAC-CE demonstrates a decrease as urban scale diminishes. Small cities exhibit a marginally higher average ODIAC-CE in contrast to the large and medium-sized counterparts.
Figure 2(B) illustrates the changes in ODIAC-CE across cities within YRD over the years 2018 and 2020. During this period, 30 cities witness an augmentation in ODIAC-CE, while the remaining 11 cities show a decline. Noteworthy among these are medium-sized cities, such as Jiaxing, Zhenjiang, Zhoushan, Ma’anshan, and the megacity Shanghai, which manifest the most substantial increases and comprise the top five. In contrast, the top five cities demonstrating the most pronounced decreases are exclusively large cities: Ningbo, Suzhou, Wenzhou, Wuxi, and Changzhou.
Correlation analysis
In this study, the Spearman’s ρ is selected to assess the correlation between ODIAC-CE and EVCI density within individual cities. The calculated Spearman’s ρ values for the years 2018 and 2020 stand at 0.483 and 0.564, respectively. According to established guidelines, a Spearman’s ρ falling within the range of 0.4 and 0.6 (or −0.04 and −0.06) indicates a moderate strength monotonic relationship between EVCI density and ODIAC-CE (Akoglu, 2018). This implies a discernible association between the two variables, albeit not of an extremely strong nature.
Spatial autocorrelation
The study employs the spatial statistics tool within ArcGIS to conduct high/low clustering (Getis-Ord General G) and hot spot analysis (Getis-Ord Gi*) on EVCI density and ODIAC-CE for the years 2018 and 2020. The obtained p-values for all analyses are uniformly less than 0.001, signifying a robust and highly significant spatial pattern (Ord and Getis, 1995). This implies a non-random distribution of variable values across the geographic space under scrutiny. Figure 3 visually represents the outcomes of the Local Indicators of Spatial Association (abbreviated as LISA). In the LISA diagram, agglomeration is categorized into seven cases: “Cold Spot-99% Confidence,” “Cold Spot-95% Confidence,” “Cold Spot-90% Confidence,” “No Significant,” “Hot Spot-90% Confidence,” “Hot Spot-95% Confidence,” and “Hot Spot-90% Confidence.” Getis-ord general G and Gi* of ODIAC-CE and EVCI density in 2018 and 2020.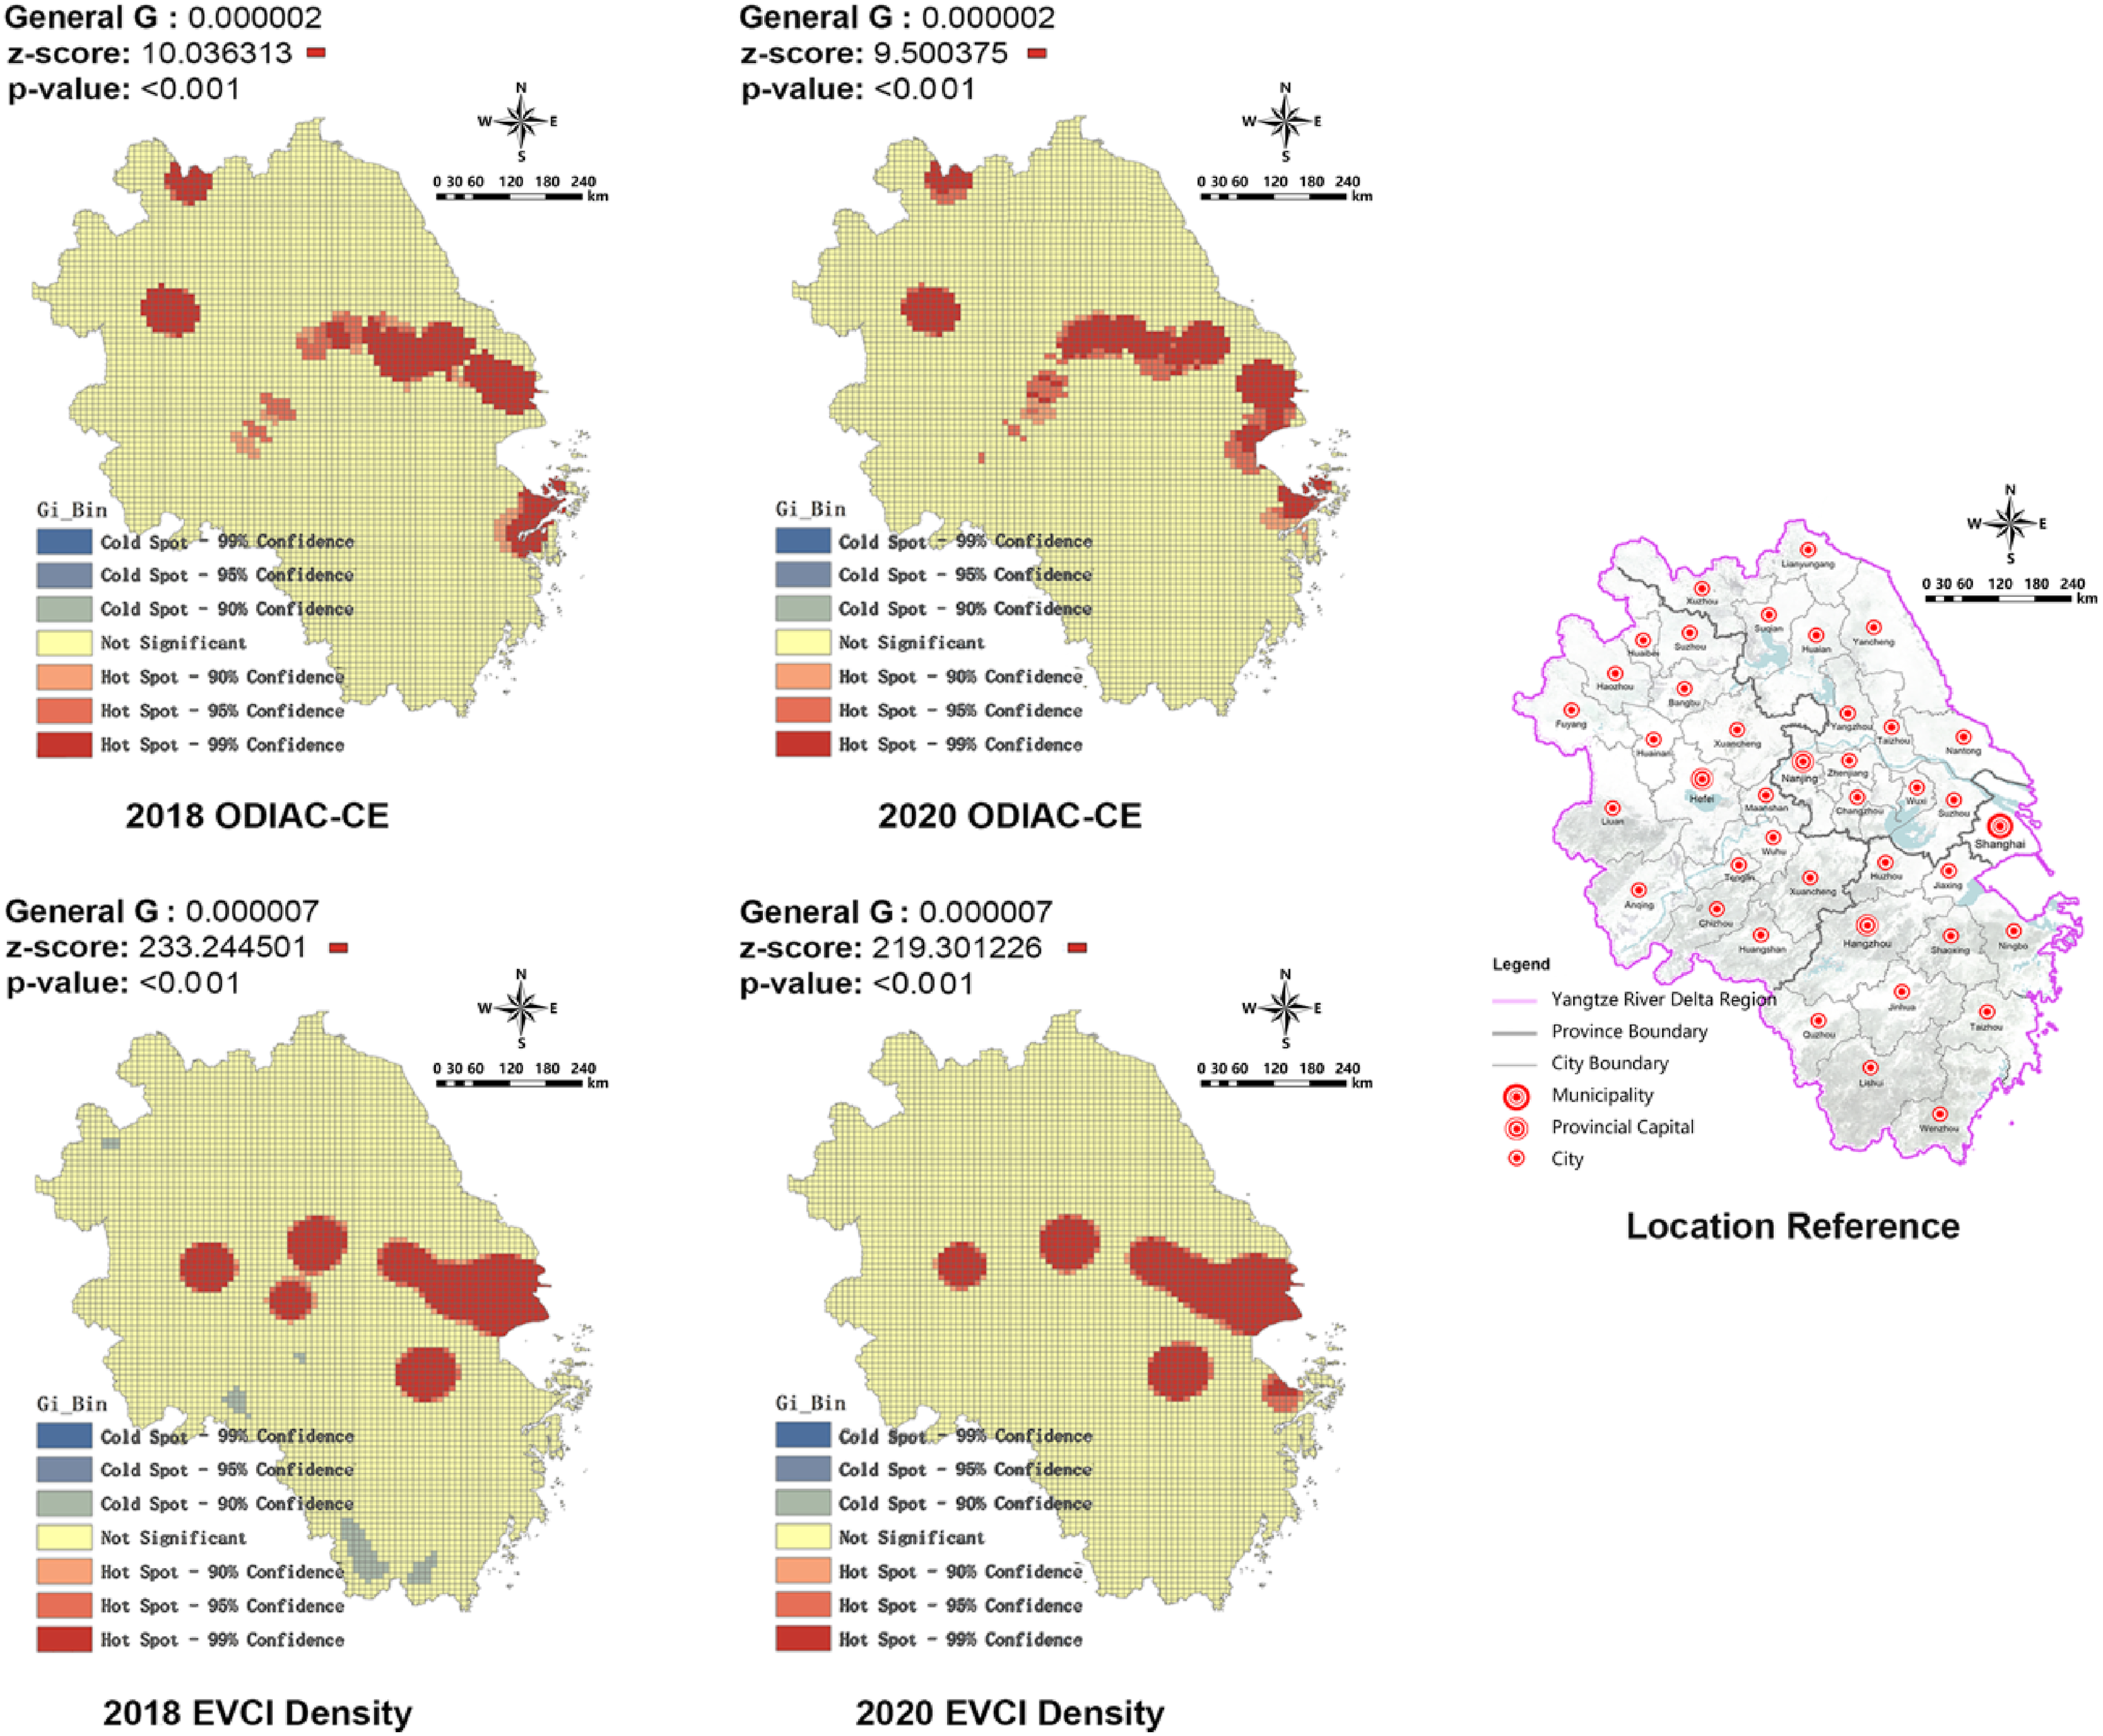
This study places reliance on a 90% confidence level to conduct hotspot analysis. Overall, the distribution of ODIAC-CE hotspots remains largely consistent across the years 2018 and 2020. In 2018, significant and coherent ODIAC-CE hotspots are identified in Shanghai, Suzhou, Wuxi, and Nanjing, while additional hotspots independently congregate in Huainan, Xuzhou, and Ningbo. By 2020, interconnections between specific ODIAC-CE hotspots shift, with the disconnection between Shanghai and Suzhou and the emergence of an interconnection trend between Nanjing and Hefei, as well as Shanghai, Jiaxing, and Ningbo. Meanwhile, marginal dispersion is observed in Huainan and Xuzhou.
Similarly, the distribution of hotspots in EVCI density exhibits a high degree of consistency across both years. In 2018, concentrations of EVCI density hotspots encircle Shanghai, Suzhou, Hangzhou, and Hefei. Except for the interlinkage observed between Shanghai and Suzhou, the remaining areas exhibit autonomous distribution, with conspicuous cold spots clustering notably in Lishui, Wenzhou, and Chizhou. In 2020, new hotspots emerge in Ningbo, while a previously identified cluster near Nanjing ceases to exist, and no instances of cold spots are observed.
Coupling coordination degree
The indicators of coupling degree (C) and coupling coordination degree (D) are used to analyze and understand the strength of relationships and efficiency between EVCI density and ODIAC-CE (see Figure 4). C and D of EVCI density and ODIAC-CE in 2018 and 2020.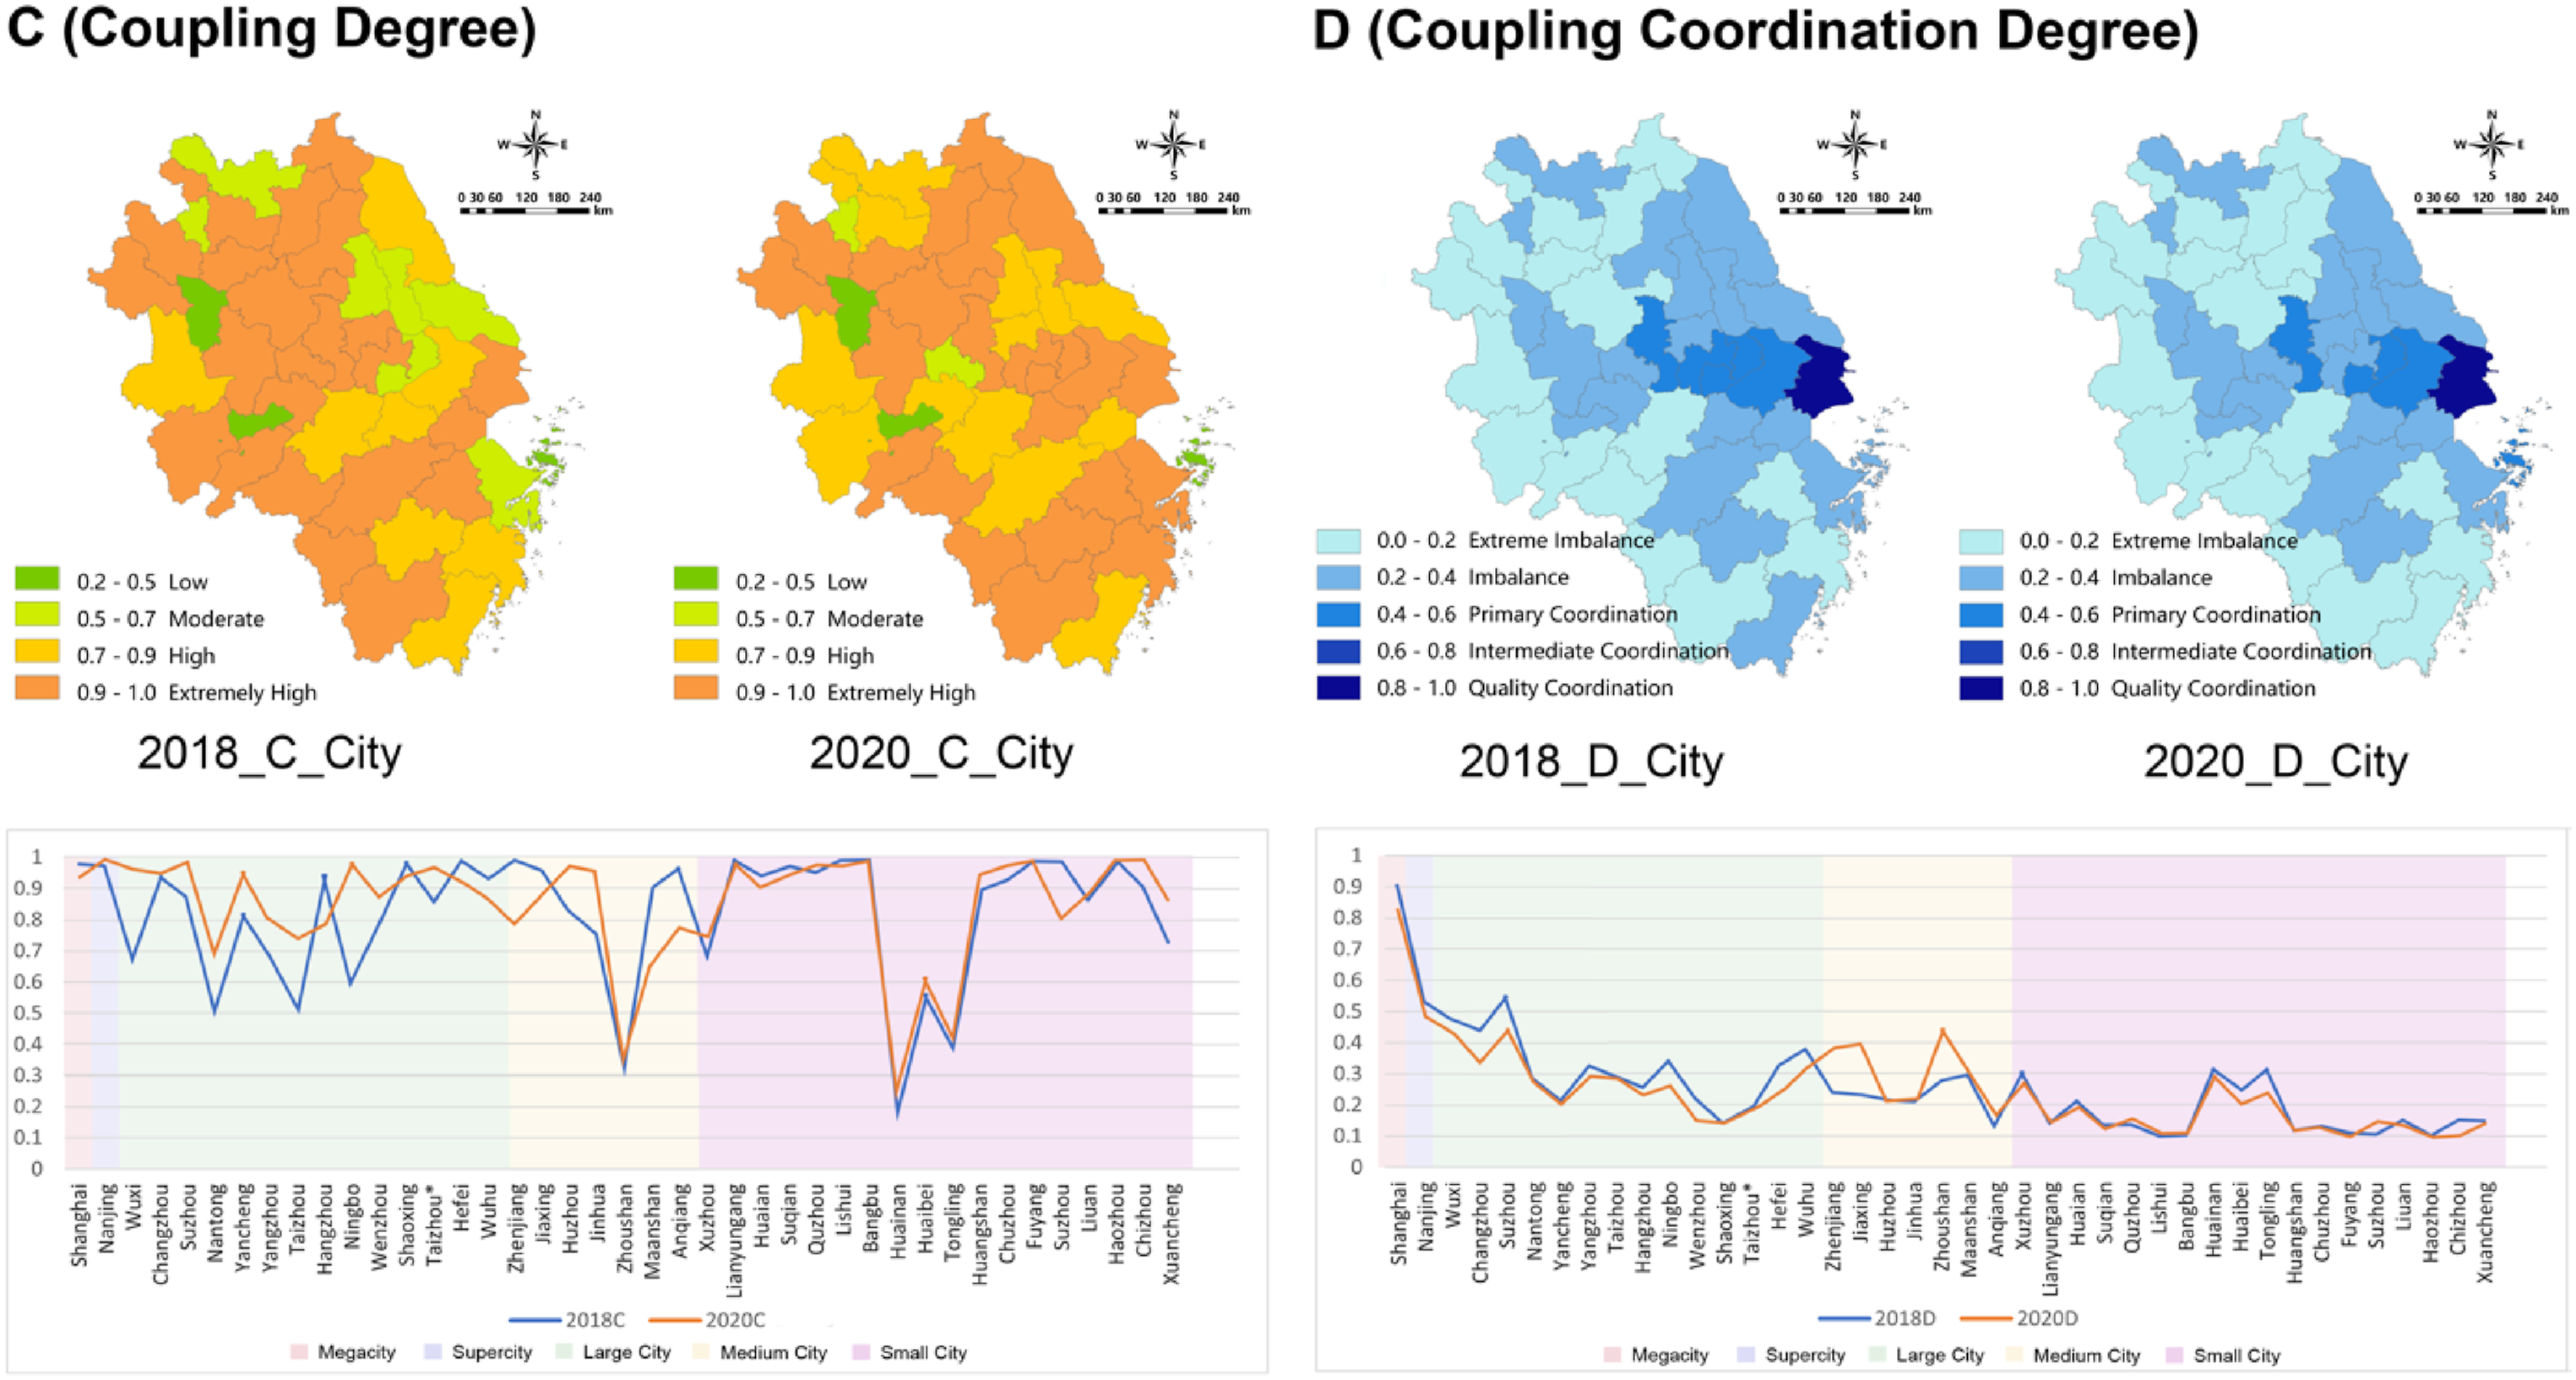
Interpretation of C and D classifications.
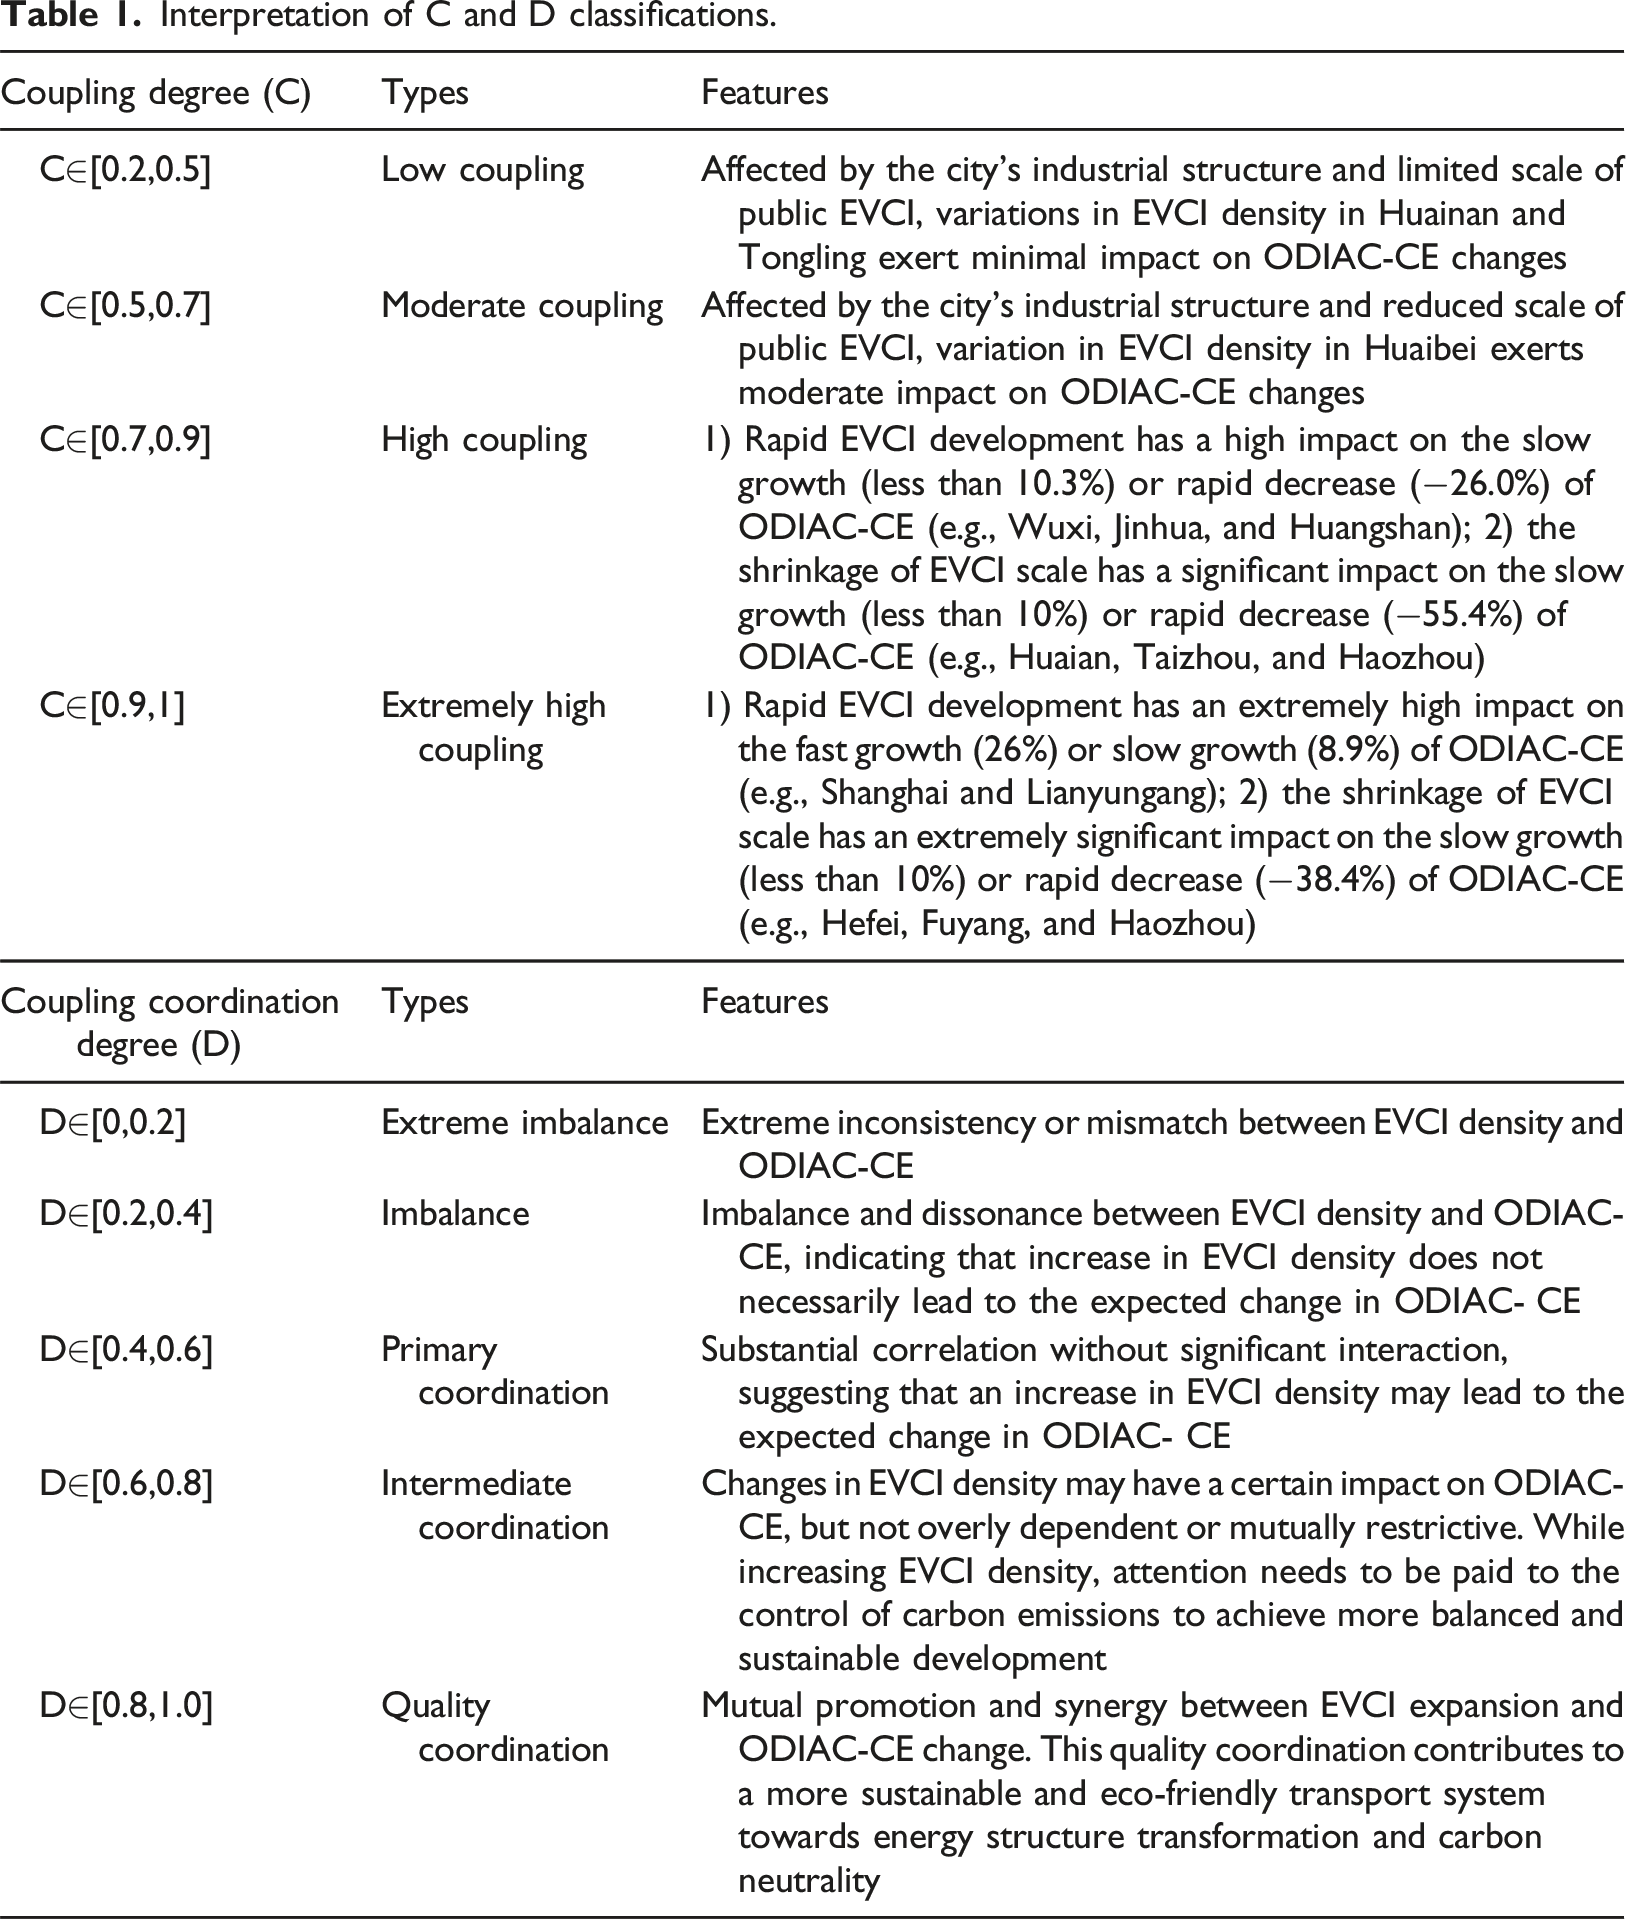
From 2018 to 2020, YRD witnesses a modest increase in overall coupling degree, with 68.3% of cities experiencing an upward trend, indicating a growing interdependence between ODIAC-CE and EVCI density. The interdependence increases significantly in both the eastern and southern regions of the YRD. In the years 2018 and 2020, a total of 30 cities, including Shanghai, Nanjing, Suzhou, Hefei, and Jinhua, consistently exhibits a pattern of high or extremely high coupling. Hereafter referred to as Case_C1, it comprises 73.2% of all cities studied. In addition, six cities, including Wuxi and Ningbo, transition from moderate coupling to high or extremely high coupling (Case_C2). Conversely, Ma’anshan exhibits the opposite trend (Case_C3). Huainan, Tongling, and Ningbo consistently remain in a low coupling category (Case_C4) while Huaibei remains in a moderate coupling category (Case_C5).
When categorized by urban scale, both megacity and supercity fall under Case_C1. Among large cities, 64.3% are assigned to Case_C1 while 35.7% are categorized under Case_C2. Within the category of medium-sized cities, a significant 71.4% are designated as Case_C1 while 14.3% fall into Case_C3 and Case_C4, respectively. As for small cities, a substantial 77.8% are classified under Case_C1, 11.1% align with Case_C4, while 5.6% are distributed into Case_C2 and Case_C5, respectively.
The coupling coordination degree (D) plays a pivotal role in assessing balance and alignment between EVCI density and ODIAC-CE, determining how effectively the components work together and whether their interactions are optimized for the system’s efficiency. A high coupling coordination degree suggests that the interdependencies are well-managed and contribute positively to the system’s overall functionality. As shown in Figure 4, there is a notable decreasing trend in D as the hierarchy of urban scales moves down. The D is divided into five levels (see Table 1): extreme imbalance (0.0 < D ≤ 0.2), imbalance (0.2 < D ≤ 0.4), primary coordination (0.4 < D ≤ 0.6), intermediate coordination (0.6 < D ≤ 0.8), and quality coordination (0.8 < D ≤ 1).
From 2018 to 2020, the YRD experiences a marginal decrease in overall D index, with 80.5% of cities showing a declining trend, suggesting a less effectively managed and synergistic interdependency between ODIAC-CE and EVCI density. However, in the megacity of Shanghai, quality coordination is observed, demonstrating mutually reinforcing and synergistic relationship between the expansion of EVCI and changes in ODIAC-CE. In the supercity of Nanjing, a gradual transition in coordination is evident, ranging from a primary level to an intermediate one. This phenomenon can be attributed to Nanjing’s strategic initiatives such as the New EV Industry Landmark Action Plan and financial incentives for promotion (https://jtj.nanjing.gov.cn/njsjtysj/201903/P020190320466323158227.pdf; https://www.nanjing.gov.cn/zzb/zfxxgk/fdzdgknr/szfjbgtwj/201901/t20190102_1361498.html).
However, when examining large, medium-sized, and small cities, a different picture emerges. Apart from Wuxi maintaining primary coordination and Suzhou transitioning from primary to intermediate coordination, most cities experience either extreme imbalance or imbalance. The pervasive imbalance underscores that the interactions between EVCI and ODIAC-CE in these cities have not been effectively synchronized or optimized. This lack of synchronization may lead to inefficiencies within carbon reduction initiatives, potentially yielding suboptimal outcomes concerning environmental aspirations.
Discussion
Most cities have high or extremely high coupling degree but vary greatly in coupling coordination degree. Referring to literature and reports, the study attributes coordination disparities to three primary factors: location and infrastructure, industrial and technological patterns, and social practice and awareness.
Location and infrastructure
Quality coordination is promoted by base conditions such as superior geographical location and comprehensive infrastructure. The eastern coastal area of YRD, which exhibits a significantly higher coupling coordination degree, stands as the most economically developed region in China. Among the top 15 cities in China’s GDP in 2022, six are in the eastern YRD: Shanghai (4465.3 billion), Suzhou (2395.8 billion), Hangzhou (1875.3 billion), Nanjing (1690.8 billion), Ningbo (1570.4 billion), and Wuxi (1485.1 billion). Additionally, the unique location has attracted global capital and national labor force, tightly linking the development of YRD with the international market and maritime trade. Consequently, infrastructure construction such as roads, railways, ports, and airports is highly advanced.
Industrial and technological patterns
The coupling coordination degree is significantly influenced by the industrial and technological patterns. In this context, the paper explores opportunities and challenges of high coupling and balanced coordination in megacity, supercity and some large cities, as well as the high coupling but imbalanced coordination observed in small cities.
High coupling & balanced coordination
Cities such as Shanghai, Nanjing, Suzhou, and Wuxi exhibit high coupling and balanced coordination. In these cities, the increase in EVCI density is mutually reinforced by the expected changes in ODIAC-CE, with synergistic effects driven by favorable industrial and technological patterns. These cities actively propel green industry upgrades, refine energy structures, invest in green technologies, and foster carbon trading markets (ARUP, 2021). Among them, Shanghai, Nanjing, and Suzhou stand out for their diversified industries, well-developed industrial structures, and concentrations of high-tech and innovative enterprises. They have attracted substantial investments and research and development in sustainability spanning renewable energy, energy storage, energy efficiency, and clean transportation. These advancements play a pivotal role in promoting systematic decarbonization.
For instance, Shanghai Tesla Center has realized environmental protection and emission reduction benefits through its initiatives to popularize EVs, drive technological innovation and research, stimulate EVCI construction, and attract investments and industrial chain development (CHINA, 2021). Firstly, Tesla’s megafactory for the EVs production has significantly increased the availability and adoption of EVs in Shanghai, catering to the rising demand for eco-friendly transportation. Secondly, the megafactory’s inclusion of research and development contributes to the advancement of EV technology, potentially yielding more advanced technologies in the future, such as energy conservation and emission reduction technology for lithium batteries. Thirdly, the Tesla has spurred EVCI expansion in Shanghai, enhancing the convenience and accessibility of EVs. Lastly, Tesla has attracted substantial investments, including contributions from renowned suppliers like Panasonic and LG, along with other related industrial chains. These investments are instrumental in forming a more comprehensive EV ecosystem.
Furthermore, these cities offer enticing financial incentives and favorable policies to guide businesses towards developing low-carbon and sustainable industries, encompassing clean energy generation (https://www.ndrc.gov.cn/xwdt/ztzl/cjsjyth1/xwzx/202012/t20201231_1261108_ext.html), green construction, and renewable energy infrastructure. This conducive socio-economic context contributes significantly to carbon neutrality progress (ARUP, 2021). For example, Suzhou is working towards standardizing and scaling the construction, management, and operation of hydrogenation infrastructure for hydrogen vehicles by 2025, meeting the rising demand for emission-reducing vehicles. Moreover, Suzhou has ambitious plans to apply a series of green strategies such as building integrated photovoltaic teachnologies (Xiang and Matusiak, 2019), green roofs (Wang et al., 2023), and to establish zero-carbon industrial parks. These initiatives collectively establish a foundation for green circular development, bolstering sustainability and eco-friendliness.
High coupling and imbalanced coordination
Small cities mainly present a high coupling but imbalanced coordination. Among 18 small cities, 10 are reliant on resource-based heavy industries, with coal and mining serving as primary pillars. For instance, Huainan and Huaibei are coal-centric cities, while Tongling specializes in copper production. Such cities encounter significant challenges in emissions reduction due to their economic reliance as well as the technical and financial constraints posed by clean energy adoption and industrial transformation. This makes EVCI and ODIAC-CE unable to coordinate with each other towards carbon neutrality despite their strong interdependence.
For these cities, a commitment to industrial transformation is imperative. Coupled with policies (https://export.shobserver.com/toutiao/html/461777.html), this study suggests that resource-dependent heavy industrial cities should transition to green and ecological approaches while preserving their existing industrial advantages, and increase the proportion of tertiary industry. For example, Tongling can focus on transitioning its traditional copper industry and venture into new domains like information technology and high-end equipment manufacturing. Huainan can diversify into non-coal sectors such as big data, smart displays, and automobiles. And Huaibei can center its efforts on carbon technology research and development, industrial application, and the development of new coal chemical industries and carbon-based materials. Although the effects of transformation may not be immediately evident due to a late start and various challenges, including limited backup resources, technological lag, and inadequate infrastructure, industrial and technological improvements will ultimately promote synergies toward carbon neutrality.
Social practice and awareness
Cities with larger scales generally offer greater social opportunities and incentives (Qadir et al., 2024) for the robust development of environmental protection and emission reduction initiatives. With higher population densities and direct exposure to environmental issues like air and noise pollution, larger cities sensitize their residents to the importance of eco-sustainability (Huang, 2020). Moreover, these cities benefit from increased media coverage, supportive policy frameworks, transparent access to information, and broader infrastructure equity (Huang and Chen, 2020; Lee and Brown, 2021). These factors collectively contribute to heightened awareness and participation among residents in carbon reduction initiatives. Additionally, higher income levels (Ghasri et al., 2019) and responsible urban planning strategies (Huang, 2024) foster a strong sense of responsibility among city dwellers towards greener lifestyles. For instance, Shanghai has substantially reduced its residents’ CF and enhanced its carbon sink capacity by investing in infrastructure improvements across sectors such as public transportation, energy efficiency, and green spaces (ARUP, 2021). On the policy front, Shanghai has demonstrated its commitment to sustainability by promoting the use of new energy vehicles in all new or updated buses and taxis.
Limitations
The study is subject to certain limitations, primarily related to sample size, resource availability, research scope, and the impact of the COVID-19 pandemic. Concerning sample size, the analysis relies on data from 2018 to 2020 to investigate the interdependence and coupling coordination between EVCI and ODIAC-CE. While these selected years provide a robust basis for analysis due to policy and resource shifts, the relatively short interval between them hinders the observation of long-term trends. Resource constraints also impact the study, as the absence of city-level specific statistics on ODIAC-CE hampers the cross-validation of ODIAC raster data with panel data. Moreover, the research scope is bounded in two aspects. Firstly, the study focuses exclusively on public EVCI, to sidestep privacy and ethical concerns associated with private EVCI while simultaneously providing insights for governmental strategic planning for public EVCI from a macro-control perspective. Secondly, the research solely examines interdependence and coupling coordination, necessitating further investigation into the causal relationship between EVCI expansion and ODIAC-CE impacts to comprehensively understand their potential interactions. Finally, despite the inevitable influence of the COVID-19 pandemic on the 2020 ODIAC-CE data, the study retains the data for research purposes, as 2020 represents a pivotal year for EVs and EVCI policy and practice.
Conclusions
This study stands out for its innovative approach in theory and practice, providing systematic insights into the complexities of urban carbon mitigation. It emphasizes the critical influence of EVCI density on emissions, in addition to the inherent carbon reduction capabilities of EVs. From 2018 to 2020, an increasing trend in coupling degree is observed in 68.3% of cities in the YRD region, while 80.5% of cities show a marginal decline in coupling coordination degree. This observed trend implies a growing interdependence between EVCI and ODIAC-CE, albeit against a backdrop of suboptimal environmental synergistic development. The study’s methodological strength lies in its optimization of joint statistical analysis using fine-resolution remote sensing data (ODIAC dataset) alongside geo-referenced POI data, surpassing traditional panel data approaches. By providing refined city-level and regional-level analyses through longitudinal and horizontal comparisons of gap year data, this research fills gaps in EVCI research, offering a more holistic perspective on its potential in emission reduction.
Examining the interdependence association between EVCI expansion and ODIAC-CE changes, this study enhances the comprehensive understanding of challenges associated with reducing carbon emissions in urban transportation. It uncovers a significant interdependence between EVCI density and ODIAC-CE, revealing substantial coordination variations across different urban scales. In megacity, supercity, and their adjacent large counterparts, the interdependence between ODIAC-CE and EVCI density is well-managed towards carbon neutrality. Conversely, in other large, medium-sized, and small cities, the coupling coordination degree is much lower, indicating that an increase in EVCI density does not necessarily lead to the expected change in ODIAC- CE.
Furthermore, the study underscores that influence of various factors such as the city’s location and infrastructure, industrial and technological patterns, and social awareness on coupling coordination degree. Cities with larger scales typically boast more efficient infrastructures, supporting the mutually promoting, synergistic effect of increased EVCI density toward carbon neutrality. Additionally, diversified industrial landscapes, advanced technologies, policy support, and social advocacy play positive roles in fostering this synergy. In contrast, cities with lower coupling coordination degrees are constrained by multiple factors, resulting in imbalance between ODIAC-CE changes and EVCI growth. Targeted policy measures, promotion of industrial structure upgrading, and technological innovation are proposed to bolster the contribution of EVCI expansion to carbon neutrality.
Supplemental Material
Supplemental Material - Interdependence and coordination challenges: EV charging infrastructure and carbon emissions in the Yangtze River Delta
Supplemental Material for Interdependence and coordination challenges: EV charging infrastructure and carbon emissions in the Yangtze River Delta by Qiqi Huang and Changying Xiang in Environment and Planning B: Urban Analytics and City Science
Footnotes
Acknowledgments
The study uses the ODIAC database created by Oda and Maksyutov for 2018-2020. Any views expressed in this article are solely those of the author and do not necessarily reflect those of these individuals and organizations.
Declaration of conflicting interests
The authors declared no potential conflicts of interest with respect to the research, authorship, and/or publication of this article.
Funding
The authors received no financial support for the research, authorship, and/or publication of this article.
Credit authorship contribution statement
Data Availability Statement
The authors confirm that the data supporting the findings of this study are available within the article and its supplementary materials.
Supplemental Material
Supplemental material for this article is available online.
References
Supplementary Material
Please find the following supplemental material available below.
For Open Access articles published under a Creative Commons License, all supplemental material carries the same license as the article it is associated with.
For non-Open Access articles published, all supplemental material carries a non-exclusive license, and permission requests for re-use of supplemental material or any part of supplemental material shall be sent directly to the copyright owner as specified in the copyright notice associated with the article.