
Abstract
Resilience, denoting the capacity to swiftly recover to a state of normalcy subsequent to the occurrence of a disaster, constitutes a multifaceted phenomenon necessitating in-depth investigation. This study undertakes the quantification of resilience pertaining to specific locales through the utilization of heterogeneous data encompassing visitation patterns, demographic particulars, and points of interest (POI). A heterogeneous graph neural network is applied to model the resilience of these locales in Galveston, TX, USA. Our model outperforms regression models and other homogeneous baseline methodologies. Subsequent analysis unveils discernible resilience patterns intertwined with metrics such as visitation frequencies, visitors’ travel behaviors, and geographical attributes. In comparison to resilience investigations solely predicated upon visitation counts, our approach captures a more extensive array of information, thereby yielding a comprehensive understanding of the locale’s resilience.
Introduction
Resilience, defined as a community’s ability to endure and rebound from disruptions, holds immense importance in urban planning, public policy, and disaster management (Adger, 2000; Cutter et al., 2008; Holling, 1973; Ye et al., 2023). Traditional approaches to assessing resilience often rely on static indicators like population density, land use, etc (Amin et al., 2022; Cai et al., 2018). Yet, these indicators might not fully capture resilience’s intricate and dynamic nature.
Recently, integrating human mobility data into resilience studies has gained traction (Barbosa et al., 2018; Heydari et al., 2023; Hu et al., 2021; Huang et al., 2021; Yabe et al., 2020). This dimension of resilience recognizes people’s adaptive capacities and choices in adversity. An example of such data is Point of Interest (POI) visitation data, which records foot traffic at specific places like businesses, parks, and cultural sites, reflecting local activity and vibrancy (Song et al., 2022; Zhao et al., 2023). POI visitation data offers insights into recovery by revealing the speed and extent of people returning to normal activities. For instance, after a natural disaster, a drop in POI visits suggests reduced resilience. Conversely, a swift return to pre-disruption levels indicates strong resilience. This data also reflects community well-being; higher POI visits imply confidence and safety. Conversely, limited visits may signal insecurity, impacting community resilience (Podesta et al., 2021; Wang et al., 2023).
Studying recovery patterns is crucial for policymakers to make informed decisions to enhance resilience (Berke et al., 2015). Current deep learning methods have demonstrated their potential to enhance our grasp of resilience in intricate urban environments. They’ve been applied to predict resilience-related outcomes such as recovery patterns post-disaster, infrastructure vulnerability, and community adaptability (Shin et al., 2017; Yuan et al., 2022; Zou et al., 2018). Despite their strengths, these approaches might not be optimally tailored to address the distinct challenges of human mobility and resilience. Specifically, they could struggle with capturing the inherent spatial and temporal interdependencies crucial to understanding people’s movements and adaptations during disruptions.
This is where Graph Neural Networks (GNNs) offer a promising alternative. GNNs are a specialized category of machine learning models designed to dissect and extract insights from intricate interconnected data structures. These structures, often represented as graphs, intricately capture the spatial relationships and interdependencies among different urban locations (Zhu et al., 2020). By harnessing GNNs, we can effectively model the intricate interplay between human mobility and resilience, revealing insights that may elude traditional machine learning or deep learning methods.
In this paper, we aim to characterize POIs by leveraging comprehensive mobility data and place attributes in a natural disaster. We propose a graph model utilizing heterogeneous GNNs to analyze and compute resilience patterns. Our POI-human mobility graph is designed as a versatile and scalable model that can incorporate interconnected urban data, allowing for possible continuous enrichment with new information. This approach uncovers unique spatial resilience patterns and insights, complementing prior mobility-focused resilience studies with advanced methods. This new method may enhance discussions on resilience and guide strategies for community preparedness against increasing disaster and climate change challenges.
Our contributions are threefold: (1) Conceptually, we analyze resilience within a graph-based framework that harmonizes diverse datasets, encompassing economic, demographic, and human mobility data. This innovative approach provides a holistic method for evaluating place resilience. (2) Technically, we employ a heterogeneous graph neural network to model the POI graph. This deep learning model adeptly captures non-linear relationships in our heterogeneous urban datasets, furnishing a robust tool for resilience analysis. (3) Empirically, we apply our methodology to Galveston, TX, during Winter Storm Uri. This experiment decomposes the resilience curve and uncovers two distinct patterns of place resilience.
In subsequent sections, we delve into our literature review, detail our utilized data, introduce our graph-based deep learning model for resilience, present our experimental results and the Galveston, TX case study during Winter Storm Uri, and conclude our study.
Literature review
Business resilience, natural hazards, and human mobility
Business resilience refers to the ability of businesses to absorb, recover, and adapt to adverse conditions, such as natural hazards (Adger, 2000; Cutter et al., 2008; Holling, 1973). Saad et al. (2021) provided a comprehensive review on business resilience research, covering the varying definitions and measurements. Resilience has gained increased research attention recently, with a strong focus on its integration with sustainability and development (Mehta et al., 2024).
Business resilience encompasses multiple complex factors (Berke et al., 2015; Cai et al., 2018). Notably, traffic flows, demographic characteristics, and place-specific information emerge as three related indicators for resilience (John Van de Lindt et al., 2018; Wang et al., 2022). For example, Qiang and Xu (2020) used crowdsourced traffic data to assess resilience, defined based on accumulated accessibility reduction over time during a hazard, that is, the quicker normal traffic return, the more place resilience would be. The results reveal strong spatial variations of the resilience in Cleveland, Ohio, USA, during the winter storm Harper. Despite the effectiveness of this resilience assessment method in quantitatively measuring resilience, it omits the internal difference in POIs and fails to consider other environmental factors in the measurement method. Rosenheim et al. (2021) developed the household-level resilience measurement, but their model missed the human mobility data we discussed. Those studies, due to their concepts and methodology limits, put challenges to scale and adopt to study the resilience for new places.
Various approaches exist to link different datasets to resilience, such as direct comparisons of attributes across different places. Initially, resilience can be described using traffic data or other indicators, and subsequently, researchers can explore differences in resilience between locations by analyzing census data or conducting surveys (Du et al., 2020; Qiang et al., 2020). Haraguchi et al. (2022) reviewed the use of human mobility data in the urban resilience analysis. Linear regression is commonly employed to determine the contribution of each attribute to resilience, while spatial calculations are used to address spatial heterogeneity, enabling the integration of information across different scales (Cai et al., 2018; Malczewski and Jankowski, 2020). More recently, deep learning methods have been proposed to encode location information into embeddings, facilitating the integration of multiple datasets for other research topics (Mai et al., 2020).
Deep learning-based resilience measures
There have been multiple studies on applying deep learning in resilience measure. Pioneers came from using deep learning and remote sensing and other spatial temporal big data to predict the hazards occurrence, then link that to the resilience concepts (Dubey et al., 2022; Haggag et al., 2021; Tan et al., 2021; Ti et al., 2022). These machine learning techniques bring advantages like managing vast, complex datasets and grasping nonlinear correlations between variables (Falco, 2019; Shin et al., 2017). Hao and Wang (2023) uses a spatio-temporal deep learning model, specifically coupling graph convolutional neural network (GCN) and long short-term memory (LSTM), to understand the influence of communities’ social and physical properties on extreme event impacts, demonstrating the potential of data-driven approaches for understanding complex, dynamic, and place-specific community resilience.
Graph structures are used to study resilience because they can link data together for a complex object (Wang and Ye, 2018; Zou et al., 2018). A graph is defined by nodes and edges, in which the nodes represent the study objects and edges show the linkages. The graph neural networks are based on deep learning methods and would be able to learn complex patterns from the nodes and edges. In the real world, the graph may present features such as heterogenous and dynamics, consisting of multiple types of nodes. The heterogeneous graph neural networks are designed to take the heterogeneous nodes into account. Because they are specifically designed for modelling heterogeneous nodes, they usually perform better in various tasks than homogenous networks (Hu et al., 2020). For example, GNNs could be used to analyze mobility data, such as the number and types of trips people take, to understand how people move around and connect with different places. GNNs could also be used to analyze social media data, such as posts and hashtags, to understand how people communicate and share information about their experiences and needs.
However, it is important to acknowledge that current deep learning methods and graph neural networks are not inherently designed for studying place resilience. Our work specifically focuses on place encoding and extends these methods to resilience research. Through this endeavor, our paper aims to bridge the existing gap between place resilience research and graph neural network applications. By incorporating place encoding into graph neural networks, we seek to enhance their capabilities in analyzing and understanding the resilience of specific locations. This extension will enable us to effectively harness the power of graph neural networks to tackle the complexities inherent in resilience studies, particularly when considering the unique characteristics and dynamics of different places.
Our choice of GNNs in this study is driven by three reasons: (1) GNNs adeptly capture the complex spatial dependencies and interactions among various locations, crucial for understanding human mobility and resilience dynamics. (2) GNNs can manage diverse data sources, enabling integration of socio-economic indicators and infrastructure data into our resilience modelling. (3) GNNs excel at modelling intricate, nonlinear relationships between variables, unveiling hidden patterns and interactions critical for comprehending and enhancing place resilience.
Data
We utilized comprehensive data to observe multiple aspects of resilience, focusing on the winter storm Uri. To gain insights into resilience, we collected data from various sources, including traffic data, demographics, and place-specific information.
Winter storm Uri
Winter storm Uri had a significant impact on Texas, a state that rarely experienced such severe winter weather prior to 2021. The infrastructure was ill-prepared for the prolonged winter situation, and a unique aspect of Texas was its separate electric grid managed by the Electric Reliability Council of Texas, which prevented the transfer of power from other grids. Consequently, the electric grid was offline for an extended period, leading to widespread power outages and significant hardships for residents. During the storm, many households lost electricity, and people faced freezing temperatures, resulting in suffering and adverse consequences (Popovich et al., 2021).
Our study period spanned the week in which the winter storm hit and the preceding week (February 3rd to 17th). This judiciously selected timeframe facilitated the demarcation of a control week, representing ambient conditions antecedent to the disturbance. Opting for the immediately preceding week as a reference offers several methodological advantages. Firstly, it ensures a robust comparability between typical (baseline) and atypical (disaster) conditions. Secondly, by confining our analysis to this short duration, we mitigate potential inconsistencies arising from the addition of new mobile devices to the dataset over an extended period. Such additions could introduce variability, complicating the normalization process. Lastly, the confined timeframe aids in minimizing sampling errors associated with visit count normalization, thereby enhancing the precision and reliability of our findings.
Galveston Island was selected as our focus area due to its location in east coastal Texas, which allowed for relatively quicker recovery compared to other regions (Cai et al., 2023; Gao et al., 2023). This decision enables us to study short-term resilience and observe meaningful recovery within our study period. By concentrating on a relatively small number of POIs in Galveston, we can delve into specific place resilience features. Additionally, the coastal region’s dense population and substantial tourism traffic provide diversity in the places we can study, enriching our understanding of resilience in different contexts.
Mobility and supplemental data
To gather human mobility data, we relied on Safegraph (safegraph.com), a company that offers anonymous mobility data derived from sampled GPS trajectories of mobile phones. This data allowed us to understand how many people visited POIs each day and which CBG they came from, giving valuable insights into mobility patterns during the winter storm Uri. The data were also aggregated in this way to protect individuals’ privacy, so we cannot get exact location of their home address.
Methods
Our approach focuses on integrating diverse data sources to explore resilience. To address the challenge of handling various data types cohesively, we build a graph incorporating POI and census block group (CBG) data. This graph captures visit flows between POIs and CBGs, offering comprehensive insights into the attributes of each POI and its connection to resilience. Leveraging deep learning techniques, we use this graph to generate contextual embeddings representing the strengths of individual POIs and CBGs. Finally, we qualitatively analyze these embeddings to gain a deeper understanding of each POI’s characteristics. Figure 1 shows the workflow of our approach. This figure illustrates the overall workflow of our approach to urban resilience modelling. Initially, we constructed a heterogeneous graph that integrates Points of Interest (POIs) and Census Block Groups (CBGs), incorporating both mobility and supplemental data to capture the dynamics of urban interactions. Subsequently, this graph was processed using a heterogeneous graph neural network (HGNN), which was employed to compute embeddings for both CBGs and POIs based on their relational and attribute data. Finally, these embeddings were utilized to predict visitation patterns, identify clusters of POIs, and derive implications for policy-making based on the spatial and functional characteristics of the clusters.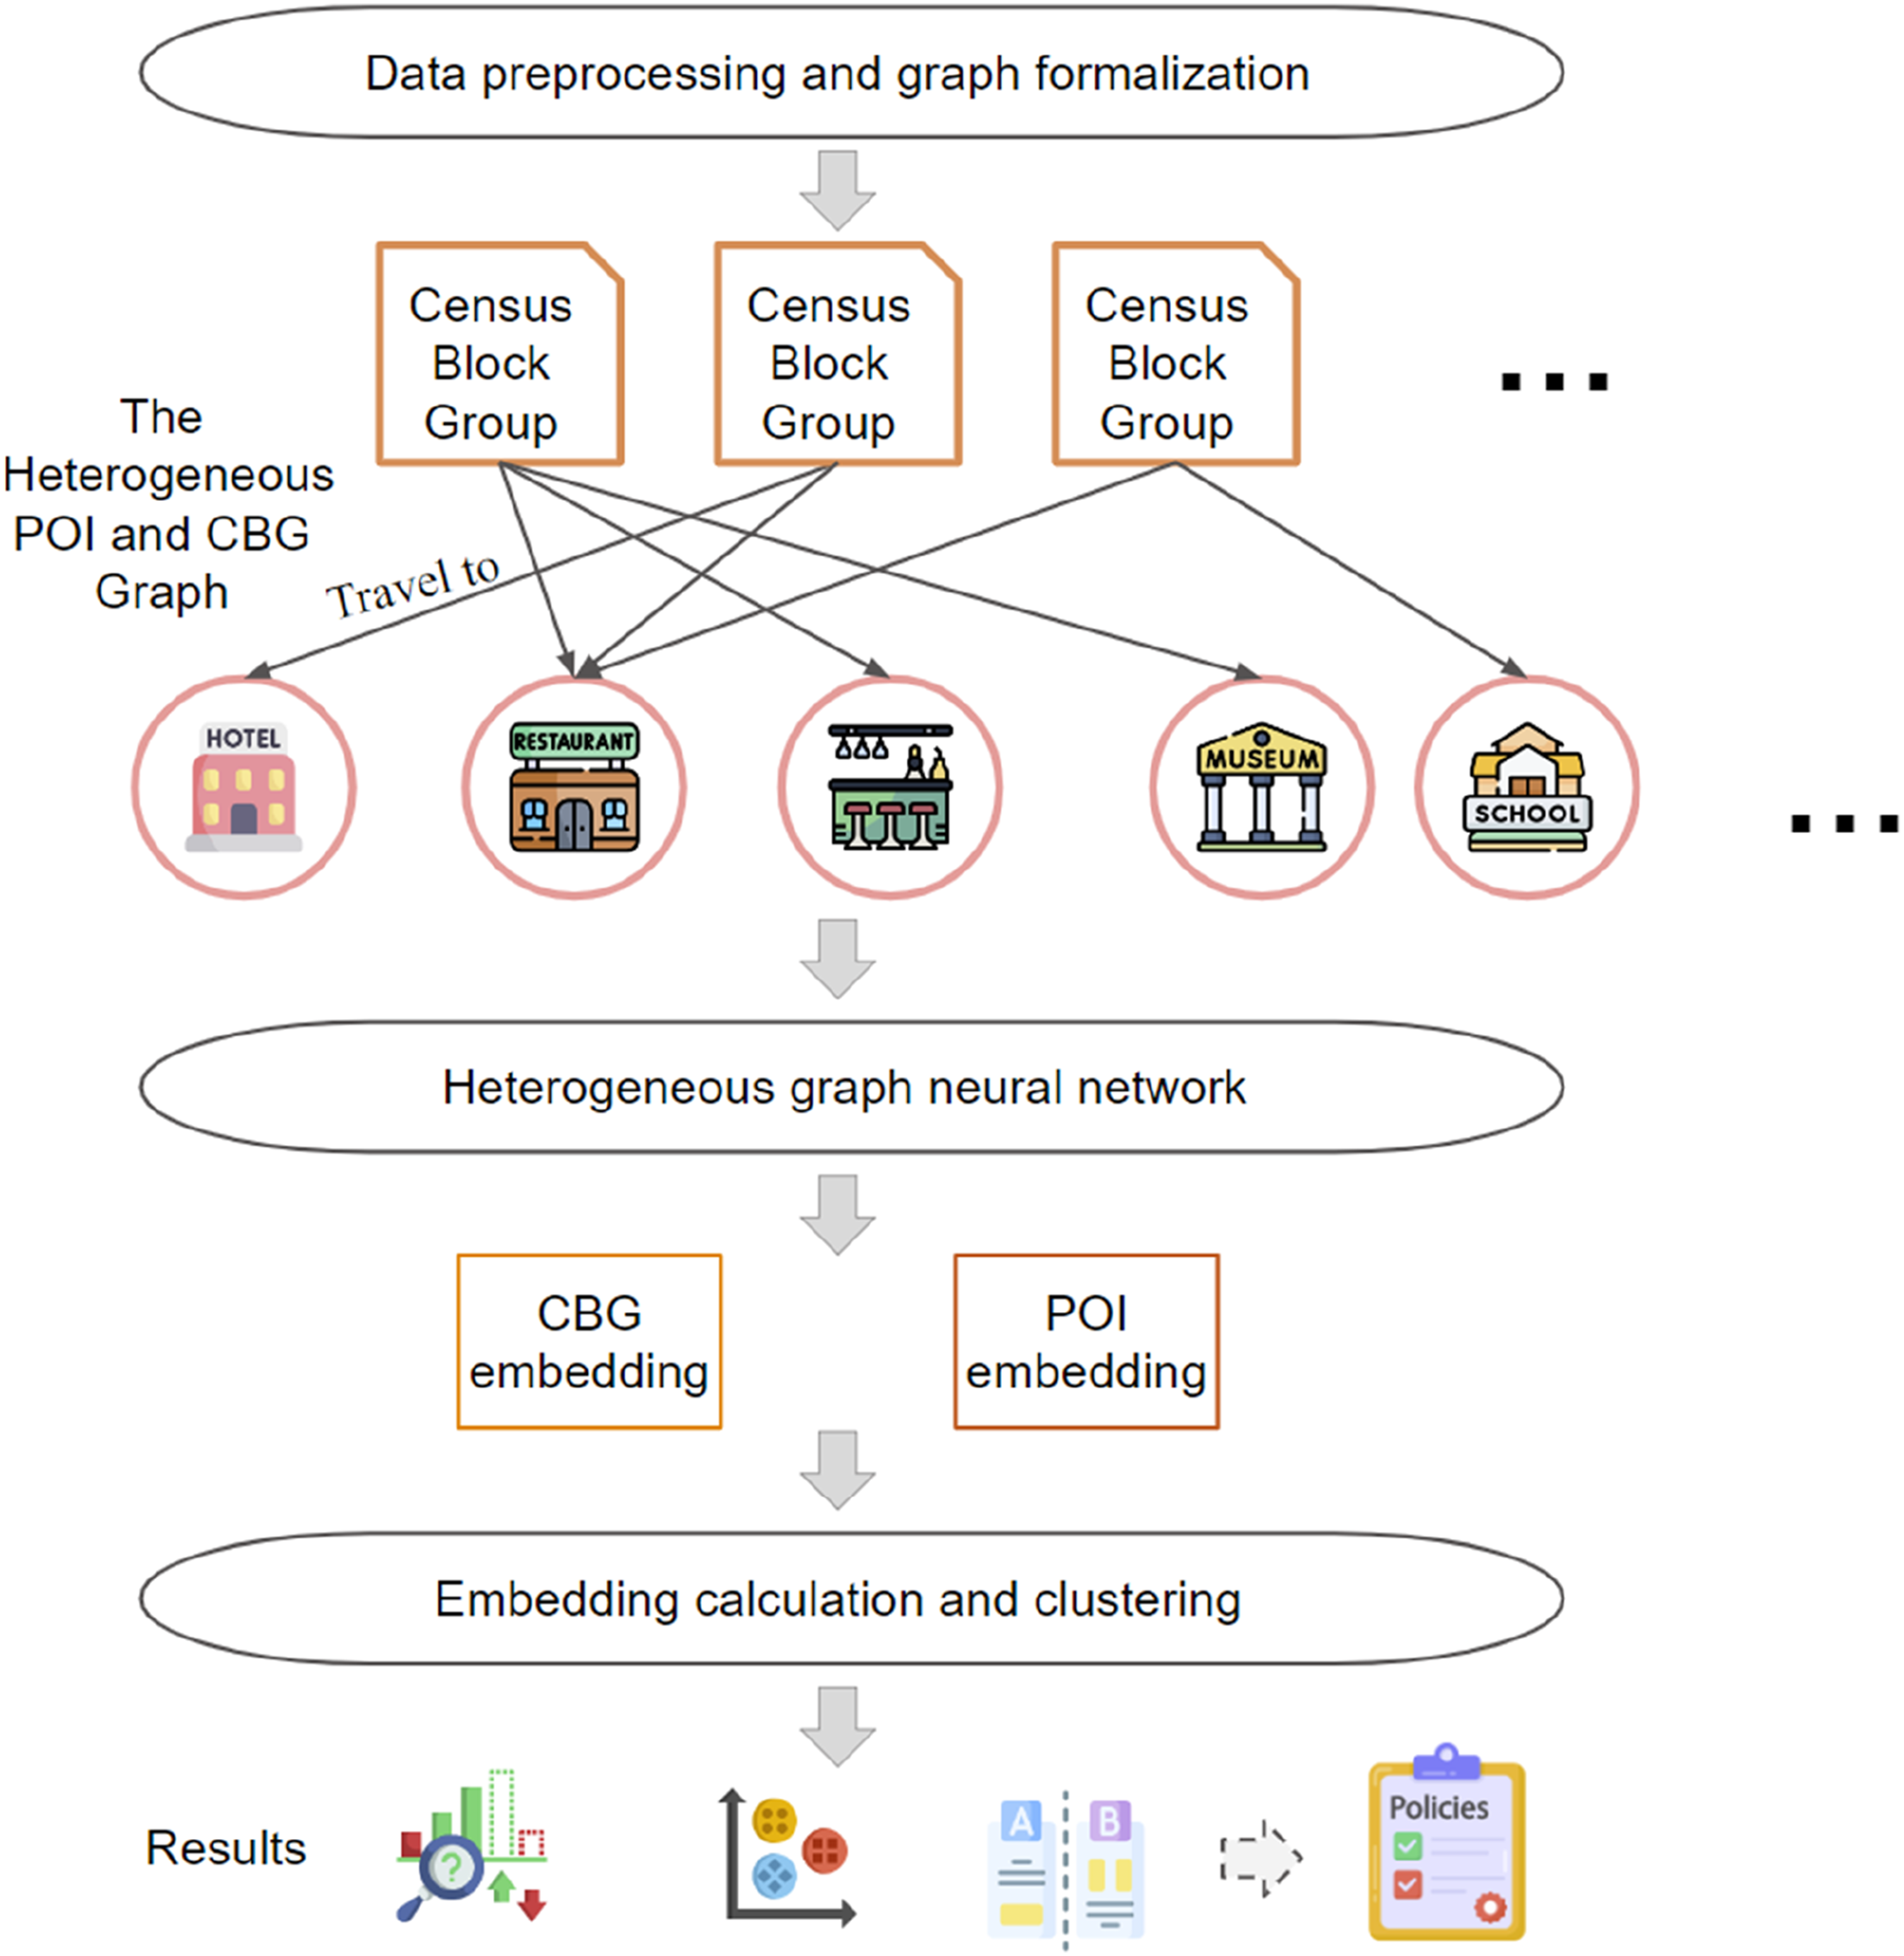
Data preprocessing
Some POI is popular while others are not. The Safegraph sampled user trajectory can reflect this popularity, showing a considerable difference in the visit count. Directly comparing those visit counts may mislead us because those large count values may bias the results. We make the visit count comparable for each POI by only comparing their visit count. For each POI, we use the visit count of Feb 11–17 minus that of Feb 3–10 to calculate the differences in visit count. We implemented a normalization procedure leveraging the min-max scaling technique. In this methodology, the visitation metrics for each POI are scaled based on the extremities of counts observed during the designated research timeframe. Consequently, the resilience trajectory for every individual POI is constrained within the interval [–1, 1]. Within this spectrum, a value of −1 signifies the most pronounced decline in visits ever recorded for that POI, whereas a value of 1 indicates a surge in visitations compared with the previous week. This standardization enables a more accurate and meaningful comparison of resilience measures across various POIs, ensuring that our analysis captures the relative differences in their adaptive capacities.
The heterogeneous POI and CBG graph formalization
The basic units of our data are the POI, the CBG, and the visitation flow between POI and CBG. We can naturally construct a graph with POI and CBG as nodes and the flow as the link for this graph. In this way, the POI-CBG graph describes how humans travel to the POI from their home CBG. We would be able to study the POI resilience not only from the features of the place but also from the visitor’s information.
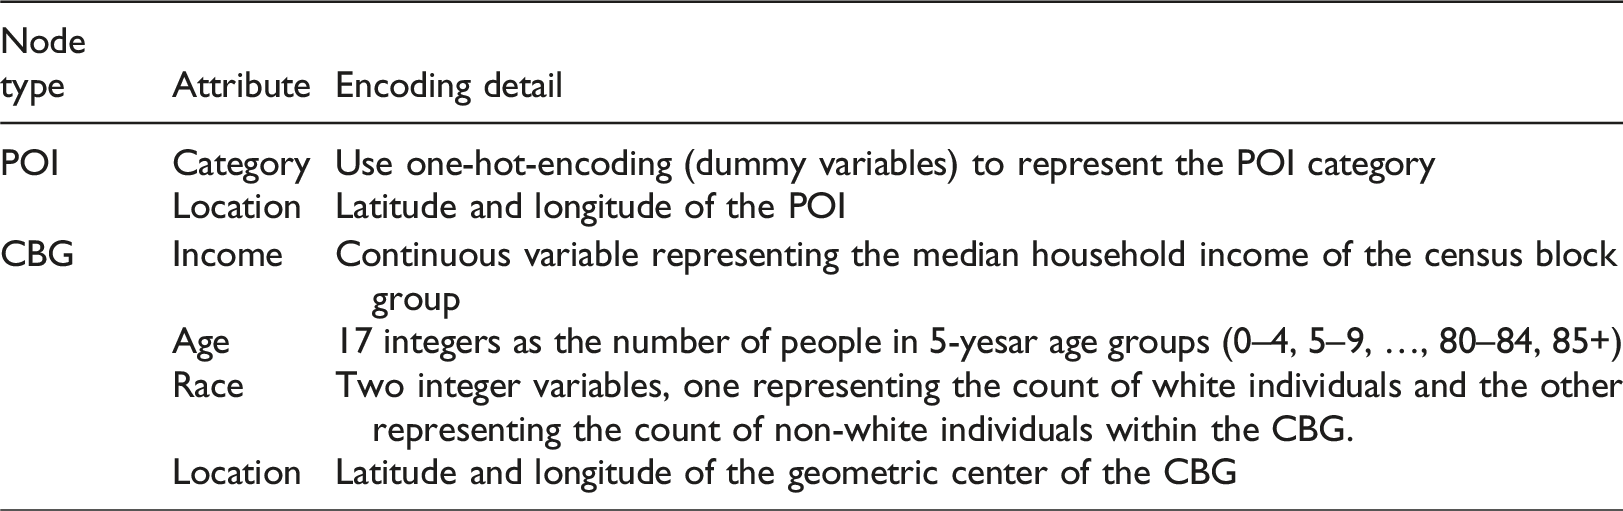
The CBG contains the demographic information within, so we decided to make the graph attributed so it can model the rich information on the nodes. Similar to the CBG nodes, we add categorical information to the POI nodes. Specifically, each node was represented as a vector
Heterogeneous graph neural network
Heterogeneous GNNs are especially fitting for modelling place resilience due to their ability to accommodate various data types and relationships, encompassing individuals, locations, and activities. Through the application of heterogeneous GNNs to resilience modelling, we can capture the intricate and evolving interactions among people, places, and activities that bolster resilience. By amalgamating and scrutinizing these diverse data streams, GNNs can construct intricate and dynamic depictions of place resilience. These depictions, in turn, can inform targeted and well-informed recommendations for enhancing resilience. Examples include identifying critical nodes or pathways in the network vital for resilience, or pinpointing susceptible areas necessitating additional support.
We build our neural network based on the Heterogenous Graph Attention Network (Wang et al., 2019) and implement in the PyG library (Fey and Lenssen, 2019). As Figure 1 shows, the idea is to get the contextual embedding 
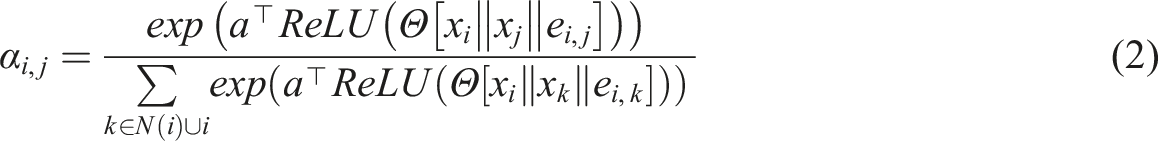
We also normalize the visit flow so that the 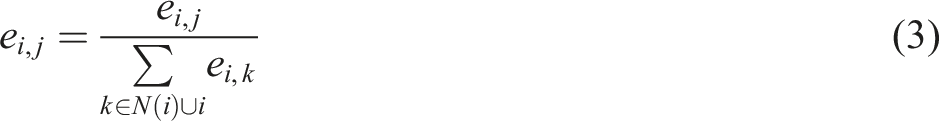
The above equations (1) and (2) only present one layer of the neural network. By staking another layer, we can aggregate more contextual information. For example, in the first layer, the
The embedding (contextual representation) 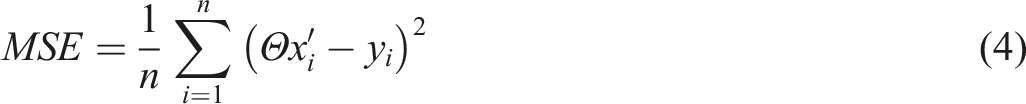
Other techniques we use include the dropout, which randomly drop some data in the training process. This dropout mimics the sampling process, as the sampling may miss some POI and visitors. We think the results would be better generalized using the dropout technique.
Embedding calculation and clustering
To compare the embedding of our model with resilience curves utilized in other studies, we introduced two types of distance measures: (1) the distance between differences in visit counts and (2) the distance between embeddings. Since both the visit counts and embeddings are vectors, we leverage the most intuitive Euclidian distance which is
The embedding of the POI
Results
We first conducted several experiments to show that our model can achieve better accuracy than baseline models. Then we interpreted the model results using the embeddings of POI. Those analyses would show our model can derive extra knowledge about place resilience compared to traditional methods.
Modelling accuracy
We compared our model with other approaches including linear regression and persistence model. Our model means the heterogeneous graph neural network described in section 4. The homogenous graph neural network converted our graph to a homogenous graph by adding all the information to POI. Besides the categorical information and location coordinates, the POI nodes also contain demographic information from the visitors. Then the homogenous graph neural network learns how that information can contribute to the final prediction. This homogenous graph neural network model did not contain edges but modeled the non-linear relationship between the POI features and the resilience.
Comparison of Model Prediction Accuracy (Lower Values Indicate Better Performance; Bolded Values Represent the Best).
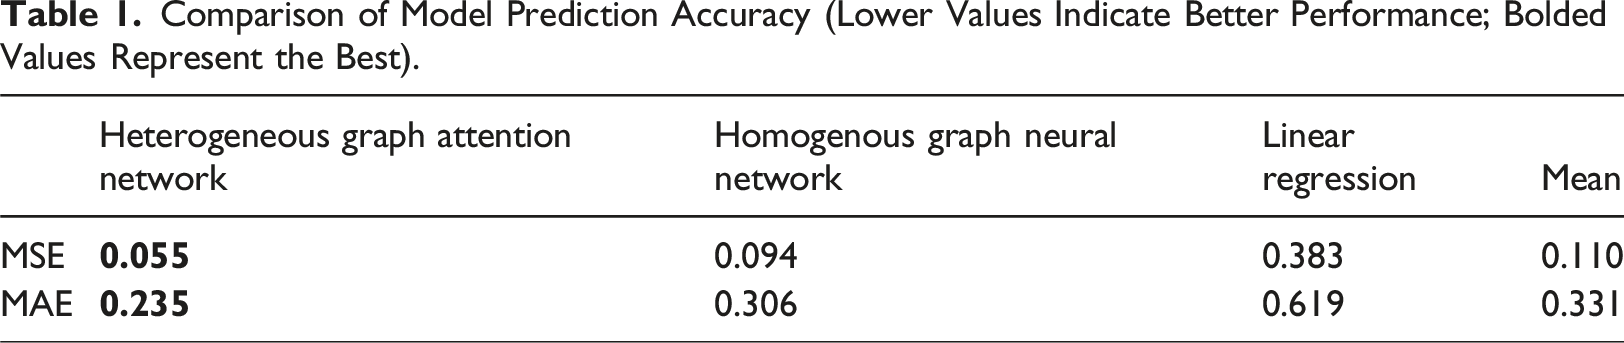
The accuracy of our model is best, where the Mean Squared Error (MSE) for the Heterogeneous Graph Attention Network is 0.055, significantly outperforming the Homogenous Graph Neural Network (MSE of 0.094 and MAE of 0.306) and Linear Regression (MSE of 0.383 and MAE of 0.619). This improvement in accuracy underscores the advantages of modelling Points of Interest (POI) and Census Block Groups (CBG) separately in a heterogeneous model. Furthermore, the poor performance of the linear regression model, even when compared to the mean baseline (MSE of 0.110 and MAE of 0.331), indicates the existence of numerous non-linear relationships between the POI features and resilience, which traditional linear models fail to accurately capture.
Clustering
Our model produces the embeddings
Geographical distribution of the cluster
The clusters showed spatial distribution. As Figure 2 shows, Galveston Island stretches west-east. The north side connects to Houston inland, while the south side is the Gulf of Mexico. The POI clusters 0 and 2 are primarily located in the coastal regions of Galveston. The majority (43 out of 67) of cluster 0 is traveler accommodation. The majority (90 out of 132) of cluster 2 are bars and restaurants. The POI clusters 1 and 3 are located on the island. Although no specific type of POI dominates clusters 1 and 3, there are 20 (out of 121) gas stations in cluster 1 and 29 (out of 125) schools and museums in cluster 3. Heterogeneous graph attention network encodes the POI-CBG graph to their corresponding embeddings.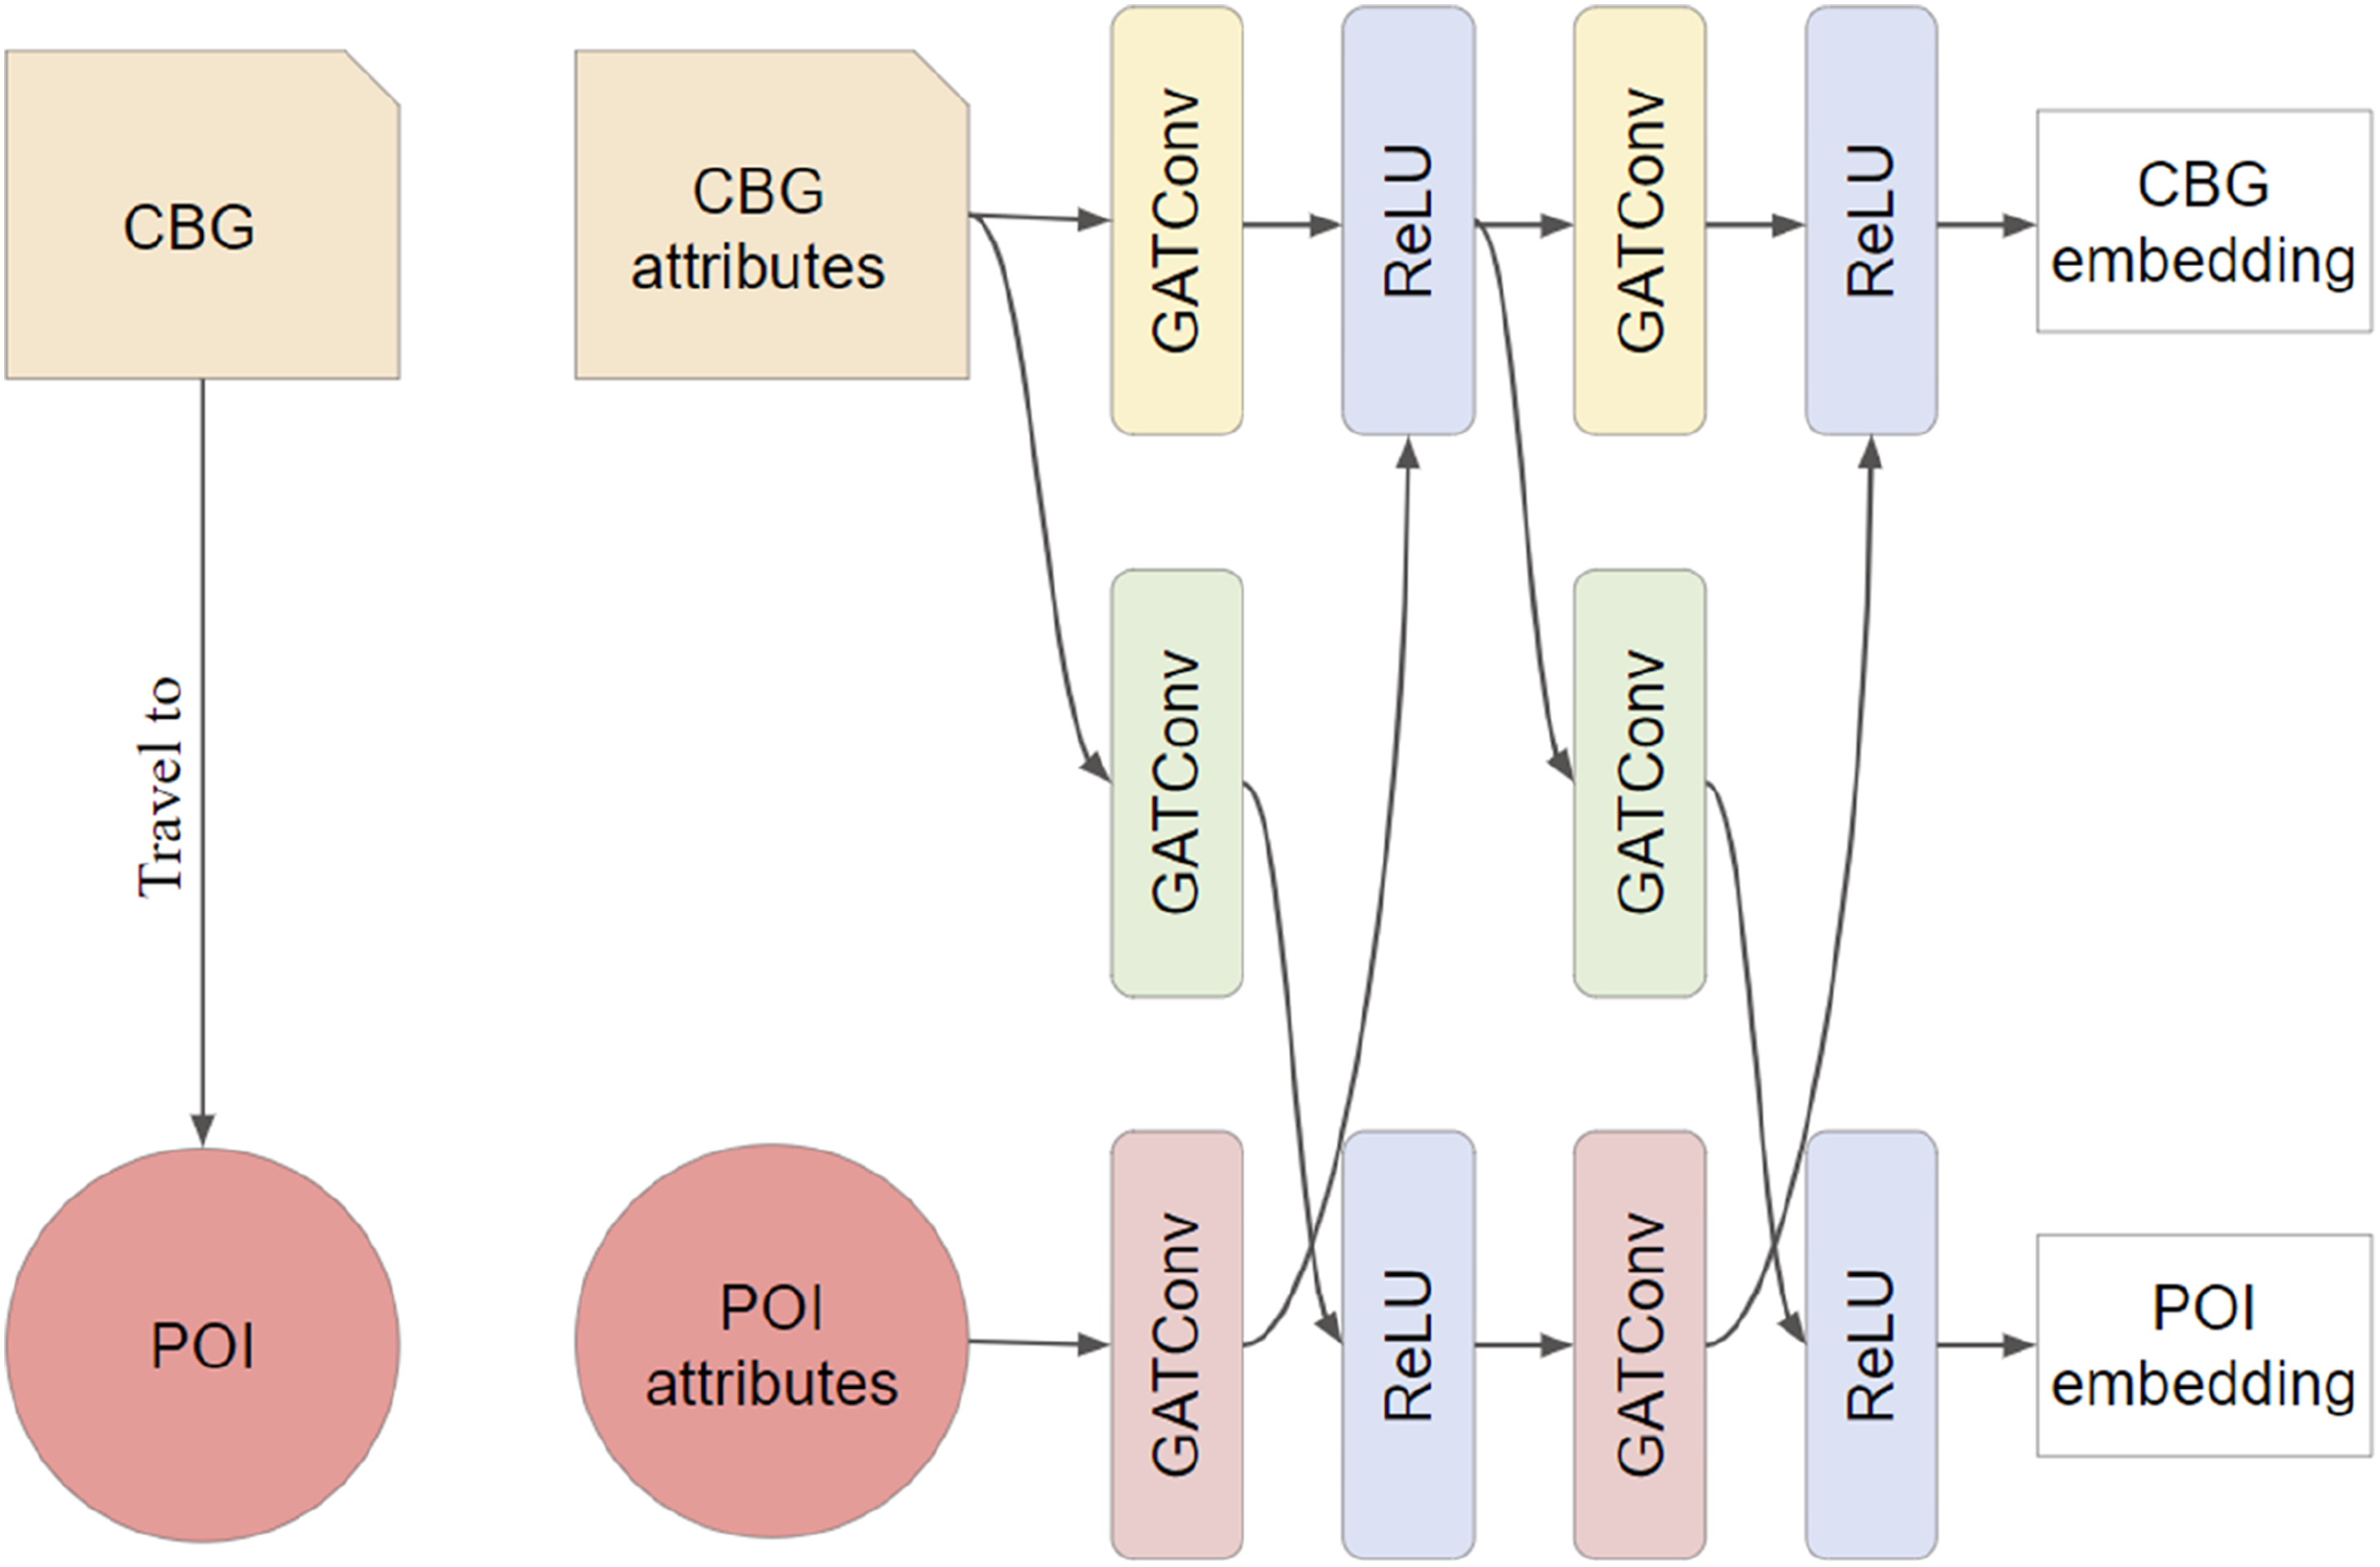
Differences on the resilience curve
We can colorize the previous figure based on the POI cluster schema. As Figure 3 shows, every line is colored according to its cluster. The solid lines are the median for that cluster, while other transparent lines in the background are the raw POI visits differences. Spatial distribution of the POI clusters. Node shows the POI locations. Clusters are color-coded.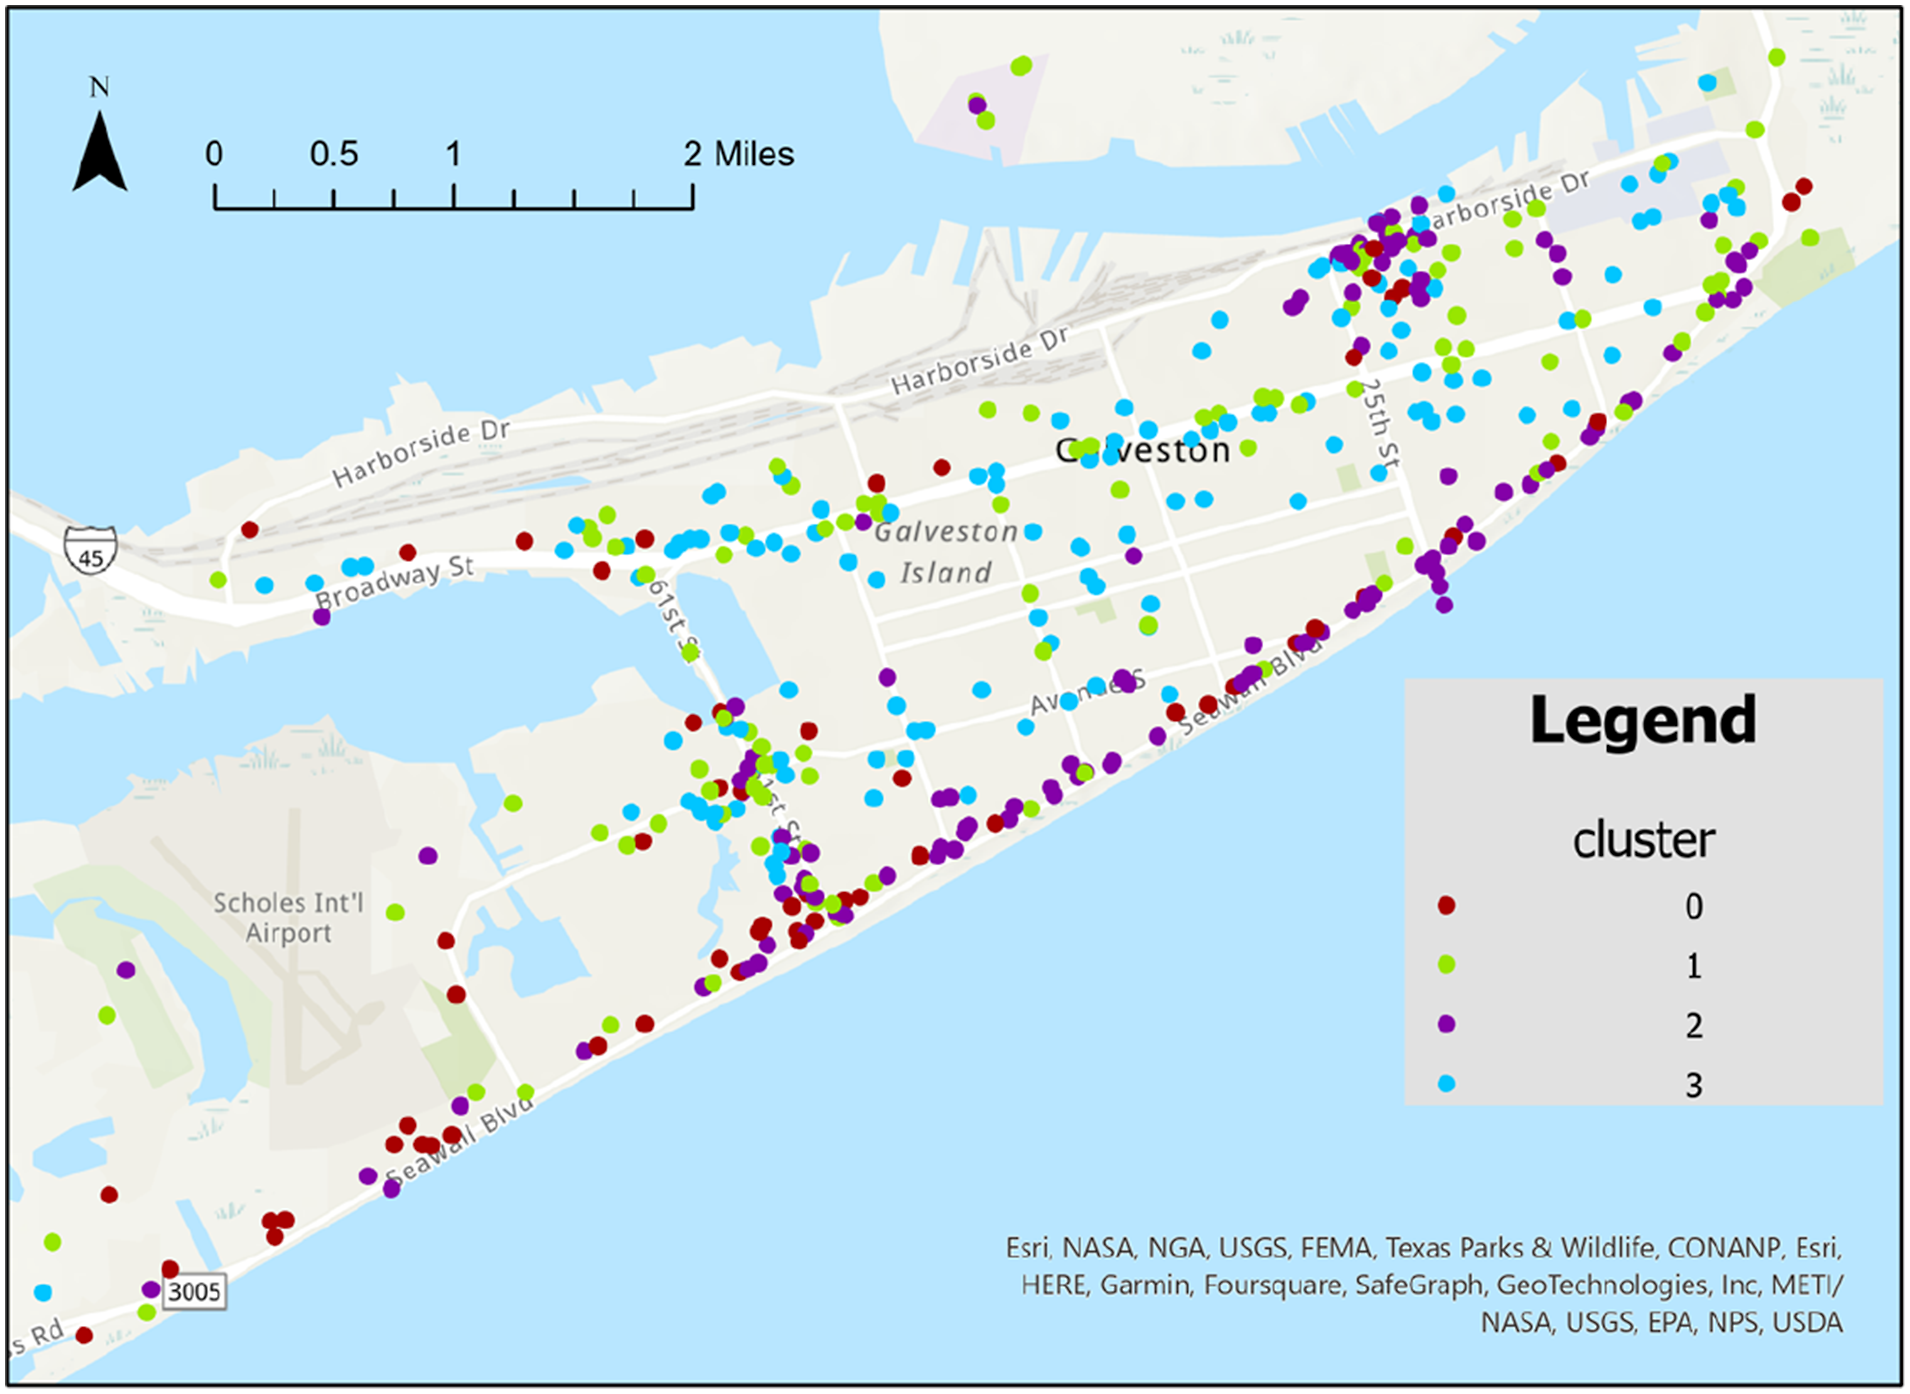
Two patterns are observed. Cluster 0 and 2 shows one type of visitation change pattern while cluster 1 and 3 shows the other. The first pattern (featuring clusters 0 and (2) of the visit number would decrease first, reaching the lowest on the day of the winter storm (day 3). Then the visit count would recover. The second pattern would keep a stable visit count during the first 2 days of the disaster but decrease the number of visitors after 2 days of the winter storm.
Note that hyperparameters in the clustering method may influence the clustering results even after we used the elbow method. We tested the number of clusters from 2 to 10 and found that there are generally two patterns in the spatial distribution and differences in the visit count. Getting more clusters would let certain POI categories dominate that cluster, though. Analyzing the specific POI category needs business and other domain knowledge. We left this for future discussion.
The role of heterogeneous information
We elaborate on the heterogenous information captured by our model during the analysis of place resilience beyond visit counts. Unlike previous studies that solely focused on studying differences in visit counts, our model incorporated heterogeneous information, including the category of the points of interest (POI) and visitor travel behavior, to better understand resilience.
We calculated two types of distance measures: (1) the distance between differences in visit counts and (2) the distance between embeddings pairwise for each POI. This approach allowed us to explore the relationships between POIs and their resilience characteristics from two different perspectives. We plotted each POI pair distance as a point on a graph, with the differences in visit counts on the x-axis and the embedding distance on the y-axis, as depicted in Figure 3.
This graph was divided into four distinct areas. If our model had only captured differences in visit counts, the graph would appear as a straight-line crossing regions i) and iii). However, since our model incorporates additional heterogeneous information, we anticipate observing more complex patterns in the graph. The experiment results are shown in Figure 4. Differences in the visit count for each cluster. Four solid lines show the median in each cluster.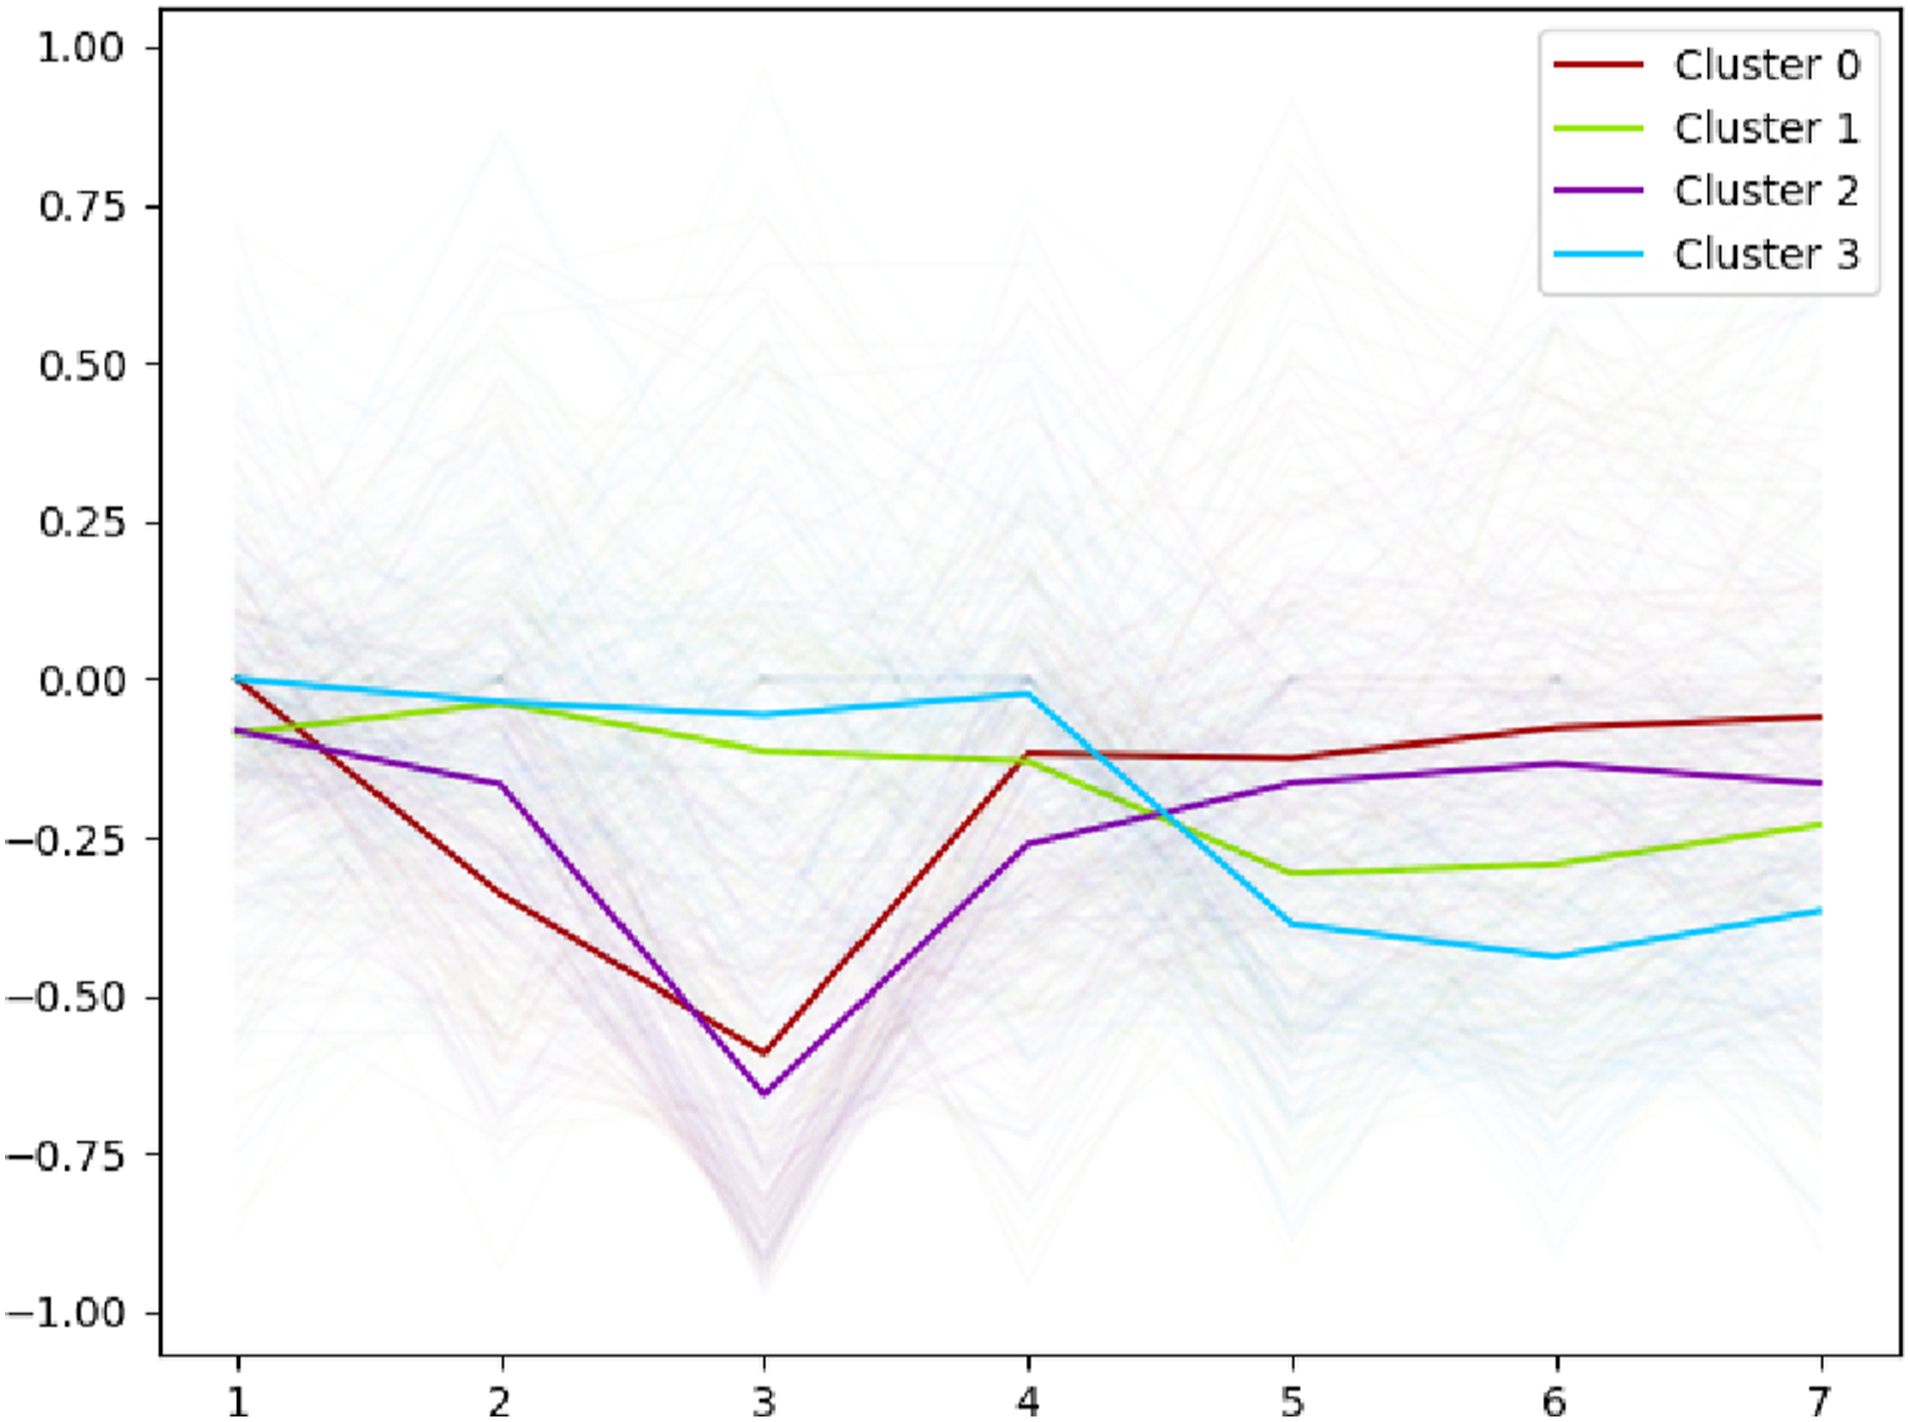
In the graph Figure 5, areas (ii) and (iv) revealed the most distinct information that our model was able to capture. In area iv), we observed a pair of points representing two POIs: Captain’s Landing and Chartwells. Captain’s Landing, being a very popular restaurant with hundreds of daily visitors, was paired with another POI with a significantly lower visitor count, approximately 20 or less. These two points were located at the bottom right of the graph. Upon mapping them, we identified that they were situated in close proximity to each other. Distance comparison. Every node is a pair of POI. The x-axis is the distance between the differences of visit count for each POI pair. The y-axis is the distance based on our embeddings.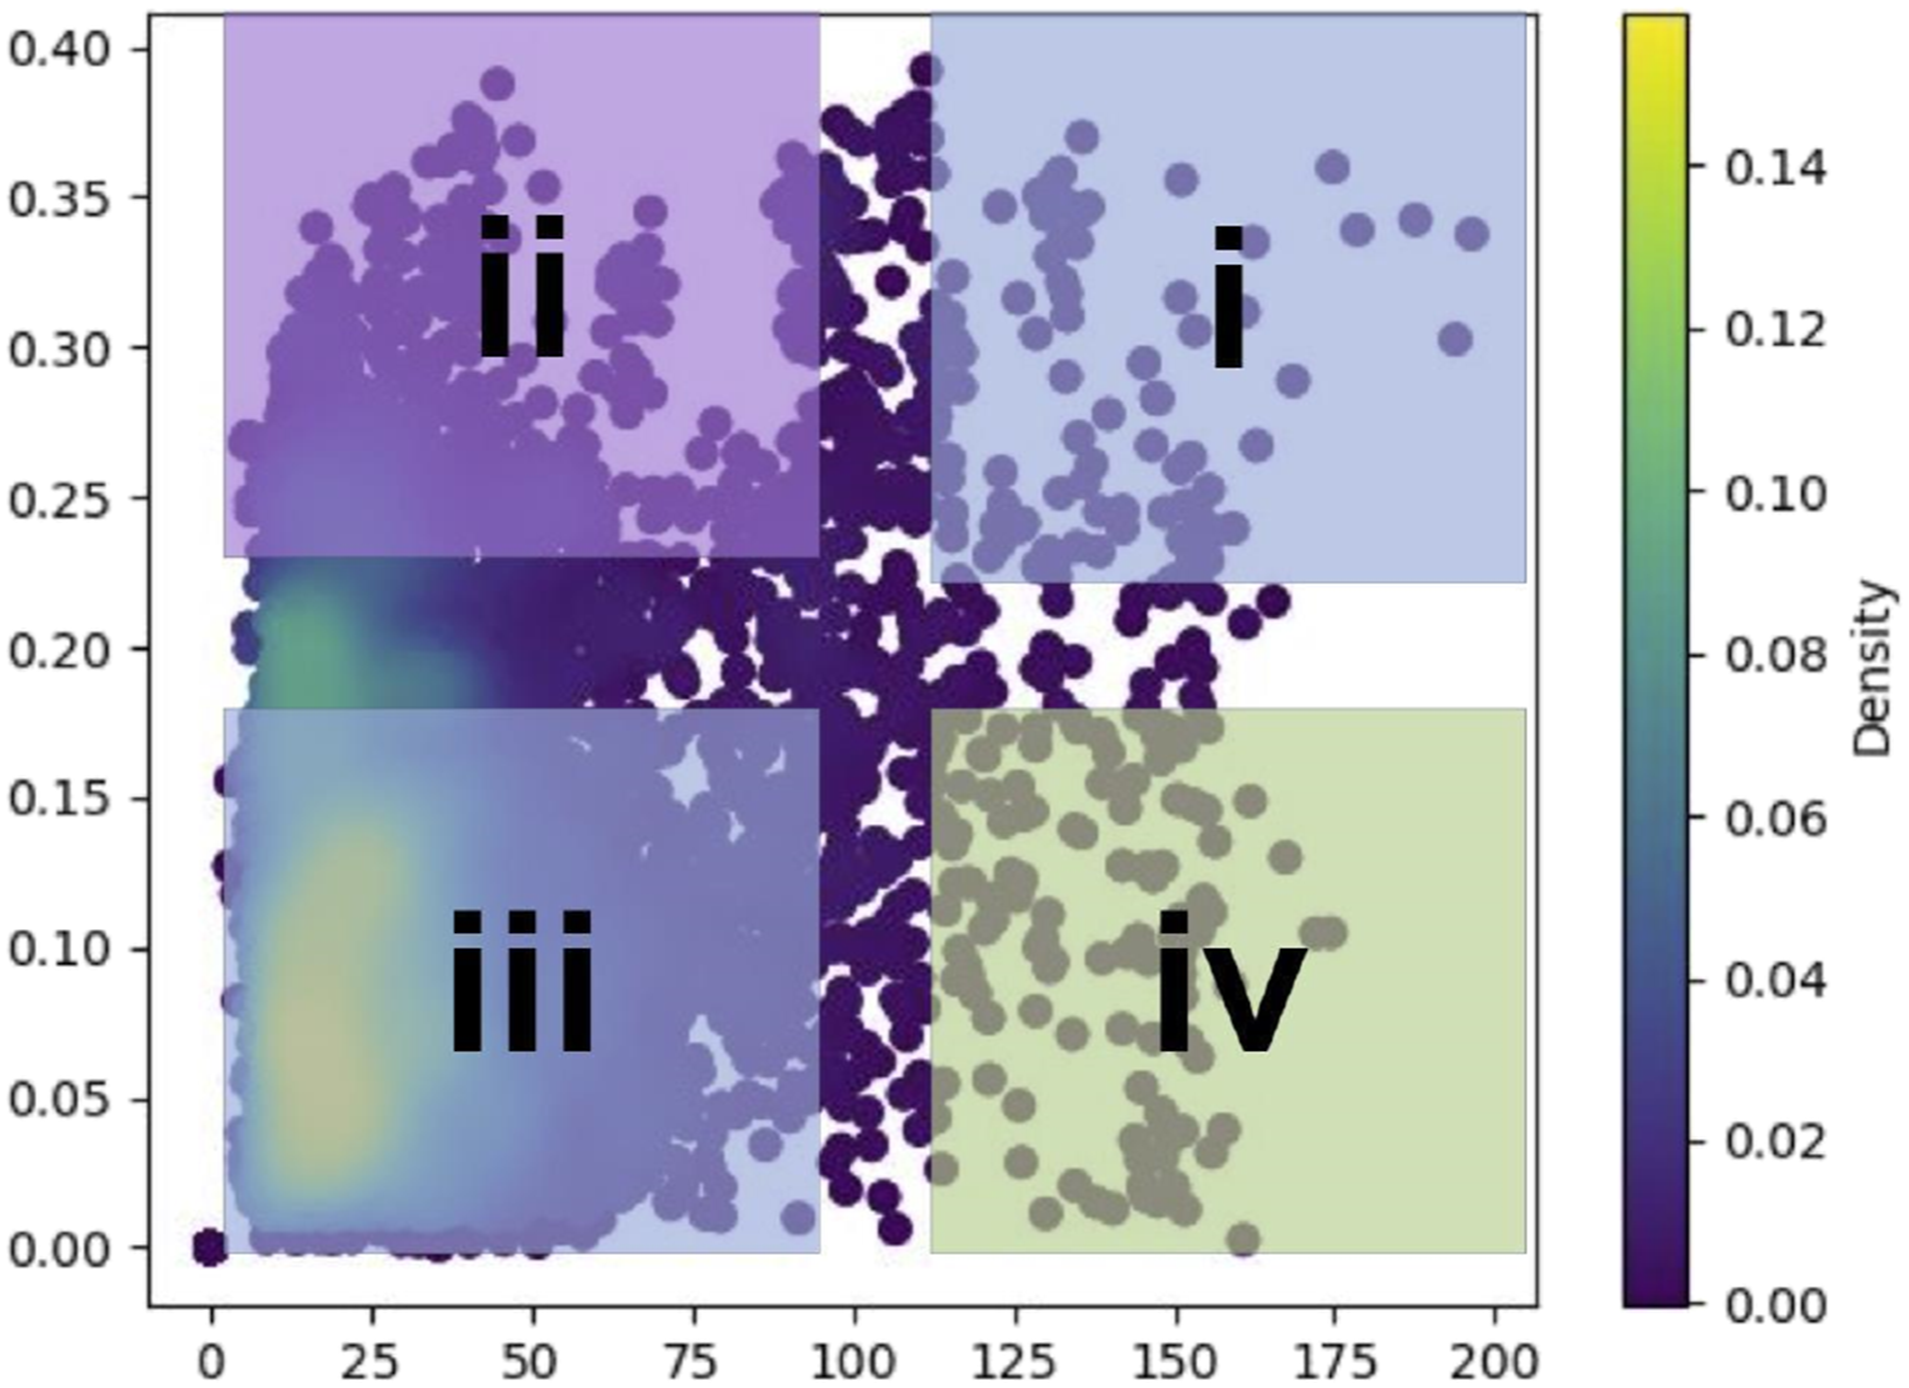
Additionally, we found that many visitors to Captain’s Landing and Chartwells came from the same places. This interconnectedness between the two POIs highlights the importance of considering visitor origins and their impact on resilience.
In area ii), the pairs of points had similar visitor counts and resilience levels. However, upon tracing back to the graph, we discovered that the travel distances for these visitors were different. Some visitors were locals, while others came from far away locations. This distinction in travel distances was verified through the original safe graph data. The results align with the findings of (Qiang and Xu, 2020), which indicated that travel distance significantly influences resilience.
Furthermore, the graph exhibited a dense distribution close to the y-axis. This density signifies that even minor differences in visit counts were effectively captured by our model based on other attributes of the POIs.
Discussion
Assessing resilience through heterogeneous graph analysis: A frontier approach
The integration of heterogeneous graph analysis into resilience studies marks a significant advancement in our understanding of complex systems. This approach, rooted in the capabilities of Graph Neural Networks, offers a nuanced perspective into the multifaceted relationships that exist within a disaster, particularly between various places.
Our method excels in detailing the intricate relationships between different places. For instance, consider a community affected by a natural disaster. Traditional models might look at the community as a singular entity, whereas our method can delve deeper, examining relationships between the flow of people and local institutions. This granularity allows us to understand how different components of a community interact and influence one another, especially in the face of adversity. Our approach offers a fresh perspective on resilience studies. Instead of viewing systems as monolithic entities, we advocate for a more granular, relationship-focused approach. This shift in perspective can lead to novel insights and more effective interventions.
These intricate relationships are paramount in resilience studies. They provide insights into the vulnerabilities and strengths of a system. By understanding these relationships, we can predict how a system might respond to shocks, and where interventions might be most effective. Our method, therefore, not only identifies the existing resilience of a system but also potential avenues for enhancing it.
With a deeper understanding of disaster impact, mitigation efforts can be more targeted and effective. For instance, our method identified the visitors were affected differently for various type of POI, then mitigation efforts can focus on customize solutions for each cluster of places. This targeted approach ensures that resources are used efficiently and have the maximum possible impact.
One of the standout features of our method is its adaptability. While our study focused on communities affected by natural disasters, the principles and techniques can be applied to a range of other scenarios, from human-induced disasters to economic shocks. The versatility of our method means that it can offer valuable insights across a range of contexts, highlighting its strengths and pinpointing areas where interventions can be most effective.
Implications for policy and practice
Our approach not only surpasses traditional linear regression and homogeneous graph models in accuracy but also provides a nuanced understanding of how different types of data can be integrated to improve predictive capabilities. It represents a significant shift towards more dynamic and precise resilience assessments. Urban planning agencies should consider incorporating such models into their analytic toolsets. This shift requires policies that support the training of staff and the allocation of resources towards the adoption of graph neural networks. Enhancing computational capabilities within planning departments can ensure that cities are not only reacting to disasters but proactively planning for them with greater precision.
The distinct patterns of visitation changes observed in different clusters during disasters highlight the necessity for dynamic resource allocation strategies. Emergency response could be tailored based on our method to provide support where it is most needed during the various phases of a disaster, improving overall community resilience. Our model’s ability to cluster POIs based on resilience characteristics allows for tailored policy interventions. For instance, different resilience strategies can be designed for areas with a high density of traveler accommodations versus areas dominated by bars and restaurants. This level of specificity in policy design, facilitated by advanced modelling, can lead to more effective allocations of resources before, during, and after disaster events. Urban planners can utilize these insights to draft zoning laws and resource allocation plans that reflect the unique needs of each urban cluster.
The inclusion of demographic, geographic, and categorical data within POI nodes has shown to significantly improve the accuracy of predictions concerning place resilience. Policies should promote the integration of heterogeneous data sources in urban planning and emergency management systems to enhance predictive capabilities and response strategies. Leveraging data from private entities such as businesses and social platforms can enrich public datasets, enhancing the robustness of resilience models. Encouraging public–private partnerships through incentives and supportive legislation can help build comprehensive datasets that are beneficial for both planning and real-time disaster response. The interdisciplinary nature of our research highlights the benefits of integrating insights from diverse fields such as computer science, geography, and social sciences in urban planning. Policies that foster collaboration across academic disciplines and between the public and private sectors can drive innovation in resilience planning. By supporting partnerships and funding interdisciplinary research projects, policymakers can facilitate the development of new methodologies that are both innovative and applicable in real-world settings.
Limitation and future directions
One of the primary limitations is the data quality that impacted by the mobile phone users, sampling strategy from US census, etc. The quality and completeness of the data directly impact the accuracy of the model. Incomplete or biased data could lead to misinterpretations or inaccuracies in the model’s predictions. The reliance on detailed demographic and behavioral data in our model also raises important considerations regarding privacy and security. It is essential for policymakers to enact robust data governance policies that protect individual privacy while allowing for the comprehensive analysis needed to enhance urban resilience. This includes strict adherence to data protection laws, transparent data usage policies, and the implementation of secure data handling and storage practices.
Additionally, while GNNs are powerful tools for modelling complex systems, they can sometimes be difficult to interpret. The “black box” nature of these models can make it challenging to understand exactly how they are making their predictions. For example, we checked if certain visitor CBG’s age and gender impacted the cluster results, but there are no significant statistical differences for each cluster. This phenomenon may be resulted from the measurement limitation of CBG data as we aggregated both POI and CBG into clusters hence individual information cannot be expressed easily. Though the model captures those visitor’s CBG data, it suffers from explain it, which is a major limitation of this method. This is an area where further research is needed to develop more interpretable models.
Future directions for this research could include incorporating more diverse data sources to improve the model’s accuracy and robustness. Additionally, more research could be done to improve the interpretability of GNNs, making them more accessible and useful for decision-makers. Finally, future work could also explore the application of this approach to other types of complex systems, expanding its potential impact.
Conclusion
In this study, we introduced a novel approach using a heterogeneous graph neural network to analyze place resilience. Our method incorporates diverse datasets into resilience modelling, revealing concealed patterns compared to traditional models. Empirical experiments during the winter storm Uri in Galveston, TX, demonstrated a close link between resilience, visitor information, mobility, and place characteristics. Our model unveiled two resilience patterns: immediate impact for some places and delayed effects for others, correlated with points of interest (POI) locations. A key strength is its applicability beyond the studied region and disaster due to the lack of spatial or temporal restrictions. This approach offers insights into resilience factors across different events, aiding policy-making.
Future research can enhance the model’s generalization and explore measures to improve resilience in various places. Analyzing resilience through human mobility helps uncover strengths and vulnerabilities, informing practical solutions and designs for future challenges. Our study contributes to place resilience knowledge, leveraging diverse datasets and advanced graph neural networks to guide decision-making and foster resilient communities.
Footnotes
Declaration of conflicting interests
The author(s) declared no potential conflicts of interest with respect to the research, authorship, and/or publication of this article.
Funding
The author(s) disclosed receipt of the following financial support for the research, authorship, and/or publication of this article: This work was supported by the National Science Foundation under 2401860 and 2430700, as well as NASA under 80NSSC22KM0052. The funders had no role in the study design, data collection, analysis, or preparation of this article.