






Abstract
Studying urban amenities is crucial for understanding their impact on quality of life, social equity, and sustainable city development. However, the valuation of urban amenities on a holistic level is understudied. This paper builds upon the framework of isobenefit lines, where residents supposedly receive the same level of combined benefits from all urban amenities. Specifically, our proposed approach takes into account the spatial heterogeneity of amenities and the proxy data of property transaction prices in Singapore to estimate their underlying monetary values. These monetary values were quantified using geographically weighted regression (GWR) that can adequately address spatial autocorrelation issues. Our results show that GWR outperforms the global linear regression model by approximately 150% increase in the R-square value, demonstrating a much better goodness of fit when dealing with spatial data sets. Additionally, the signs of the average coefficients of GWR are largely consistent with those of the global model, while the signs and magnitude of the GWR coefficients vary spatially. The spatial variations of modeling performance tend to intensify from older to younger towns. The results reveal that the central regions of Singapore are among the top spots that receive the highest levels of composite benefits. It is also observed that a spatial structure with multiple centers with high benefit scores emerges in the younger towns located in the peripheral rings of the city. This observation demonstrates the efforts of local authorities to promote a city with several regional centers of diverse functions. As the first study that applies the concept of isobenefit lines in a real urban setting, we demonstrate that the developed framework can be a useful addition to the existing toolbox of urban and infrastructure planners.
Introduction
Currently, the urban amenities in Singapore are well connected by an efficient public transport system. The Land Transport Authority (LTA) has made a progressive master plan to build Singapore as a 45-min city with 20-min towns by the year of 2040, thus providing the greater accessibility of amenities to all of her citizens (Land Transport Authority, 2023). However, Singapore is still under pressure to expand and infill to accommodate a projected population of 6.9 million by the year of 2030, a 25% growth from the current level (Ministry of Trade and Industry, 2023). The same is true for Hong Kong, Macau, and other cities with the highest possible population densities. Optimization of the spatial configuration of urban amenities is one of the main priorities when urban planners develop long-term plans. These plans will be better informed by the economic valuation of the external benefits of urban amenities (Jim and Chen, 2006). Therefore, the monetary quantification of non-market benefits and costs has commanded much attention from environmental economists and human geography researchers. However, for many of these amenities, such as urban green spaces, school quality, and healthcare facilities, there is no explicit trading market. For example, the absence of an explicit market specifying unit price for the view of open spaces and accessibility to a shopping mall usually underestimates the benefits of urban amenities and thus misaligns the demand and supply of different amenities in different demographic groups, during the development of long-term plans. The quantification of urban amenity benefits is crucial for understanding the spatial structure of cities and their impact on urban livability and sustainability. Recent studies have employed various computational and statistical methods to analyze the relationship between urban amenities and housing prices (Chin et al., 2024; Silva and Porsse, 2024).
In particular, researchers have developed tools to estimate the monetary evaluation of urban amenities, inspired by the locations choice theories of urban residents (Schirmer et al., 2014). Citizens do not choose a home location at random. Instead, they make rational choices, although not entirely rational, about home locations (De Palma et al., 2007)—by paying for the housing unit, locational qualities, and amenities with the neighborhood (Nicholls, 2019). The difference in housing prices symbolizes the difference in the characteristics of dwelling units and in the qualities of the surroundings of the units. This willingness-to-pay theory serves as a fundamental assumption of the well-known hedonic pricing model (HPM) that quantifies the relationships between housing price and a variety of influencing factors such as floor area, structure, location, and neighborhood attributes (Chau and Chin, 2003). A growing and voluminous body of literature has explored the valuation of amenities that provide non-market benefits, including urban forests (Derkzen et al., 2015; Song et al., 2018), agricultural lands (Brinkley, 2012; Peng et al., 2015), water bodies (Walsh et al., 2011), and quality primary education (Rosiers et al., 2001; Owusu-Edusei et al., 2007). For example, HPM results often draw the following inference: a unit rise in the area of parks within a walking distance of a property may prompt an increase in the transaction price of the property correspondingly. This exemplifies how HPM gives a money value to non-market benefits and facilitates the accurate comparison of the environmental qualities within a study area.
Such applications about the valuation of amenities have been widely seen in Europe, the US, and Asia. However, research that looks only at the valuation of external benefits on a neighborhood level neglects the full picture. What are the “perceived” benefits of urban amenities at any urban point? Studies on the monetary evaluation of urban amenities on a global level are growing but are still scarce (D’Acci, 2013). However, this omission cannot undermine the importance of deciphering factors affecting city living from the perspective of the cite-wide distribution of amenity benefits. Model cities evolve rapidly and in a complex spatial structure that may look entirely different from the traditional representation of a central business district. Cities consisting of multiple centers with different functions are planned. And this new view of money valuation of urban amenities can help refresh our understanding of the quality of city living while coping with increased complexity in spatial structure (MIT Technology Review, 2012). Furthermore, HPM is an effective tool for estimating the monetary values of amenities but has been criticized for its limited ability to account for spatial heterogeneity and non-stationarity among observations. The recent advancement in geographical information system, computing hardware, has contributed to a rapid development in the spatial regression techniques, among which geographically weighted regression (GWR) has gained popularity as an addition to HPM to model the non-market benefits. However, the implementation of GWR in quantifying the distributed benefits of amenities on a city scale has not yet been witnessed. In this study, we extended D’Acci (2015)’s framework to compute the isobenefit lines of Singapore, locations of equal benefit of amenities, by incorporating a GWR model in assigning a money value to each amenity type. The study relies on open data sets that contain records of resale transactions of public housing units in Singapore. Public housing flats in Singapore are managed by Housing & Development Board (HDB). HDB flats are home to more than 80% of Singapore’s resident population and therefore a sensible proxy data source for estimating the attractiveness of nearby amenities. This study contributes to the growing body of literature on urban analytics by applying advanced spatial statistical techniques to quantify the benefits of urban amenities. Our approach aligns with recent research that emphasizes the importance of considering spatial heterogeneity in urban systems (Ayouba et al., 2021; Quick and Revington, 2022).
Urban amenity types considered in this study.

aMRT and bus stations are essentially service points providing access to amenities. However, in Singapore people are so reliant on public transit that local authorities incorporate various urban amenities facilities, such as local shops and shopping malls, into these transit points. Therefore, they are parts of the modeling as well.
Related works
The computation of urban amenity benefits
One of the most thorny challenges facing researchers is how to quantify amenity benefits. After all, the term—benefit—sometimes is quite subjective. One may benefit from a park by being pleased aesthetically. Furthermore, it is argued that the “punctual benefit” should be separated from the “distributed benefit” (the terms were first defined by D’Acci (2013)). Punctual benefit refers to the utility or pleasure received by a person directly using a particular amenity such as a park, a supermarket, or a library. On the contrary, a distributed benefit refers to the utility that people receive at an urban point from an amenity, considering both the attractiveness of the amenity and the accessibility to it from that point (D’Acci, 2013). Consequently, the question boils down to how to quantify these two different types of benefits. Recent studies have highlighted the importance of considering both quantitative and qualitative characteristics of urban amenities when assessing their benefits. For instance, Talen (2023) analyzed the accessibility of public amenities in America’s largest cities, emphasizing the need for a comprehensive approach to urban planning that considers spatial equity. Various methods have been developed to quantify the punctual benefit of an amenity. In his recent paper on urban well-being, D’Acci (2014b) states that the measurement of amenity benefits should be considered within the framework of the estimates of urban life quality (ULQ). Assessing ULQ is a multi-attribute process, which “involves a monetary evaluation of various non-market costs and benefits, and the quantification of qualitative characteristics like aesthetics and ‘feeling factors’” (D’Acci, 2014a). How the visual comfort impacts the benefit provided by urban greenery has also been investigated by other researchers, such as Price (2003); Millward and Sabir (2011). The weights of the attributes are of interest and are normally obtained via mathematical-statistical models built upon structured survey data or other data sources. The input from face-to-face or online surveys can accurately represent various attributes of amenities. One advantage of survey-based approaches is that the weights of the interests can be measured directly by ranking or rating questions (D’Acci, 2014b). In the ranking questions, survey respondents are asked to rank a set of attributes by considering how important each attribute is in relation to one another. For example, a survey on home location choices may ask respondents the list of priorities given primary schools, shopping centers, and parks when buying a property. This information can be the basis of statistical models such as an analytic hierarchy process to obtain the weights of attributes (Wu et al., 2007). In rating questions, instead, they may be asked to rate each attribute independently given a scale of scores, but the information of relative importance among different attributes may be obscured. The score of each attribute can be further used to understand how people make a choice from a set of alternatives based on the theories of utility maximization (Herrnstein et al., 1993).
Another technique for estimating attributes’ weights is the reconstructive approach (D’Acci, 2014b). The reconstructive approach attempts to establish a link between the amenities and other attributes and a response variable that can reflect ULQ. A crucial requirement is that the linkage can be estimated with a weighted equation system and that the learned weights of attributes can be interpreted meaningfully. A technique fulfilling such a requirement is linear regression models, among which HPM is the most frequently cited. And housing price is believed to be a good indicator reflecting the ULQ of a certain place where residents are willing to pay for the general state of life quality. HPM has a long history and is a powerful tool in estimating the weights of attributes (Kee and Chau, 2020). It was originally derived from the consumer theory developed by Lancaster (1966) and was later refined and adapted to accommodate dynamic housing markets. Many empirical studies have examined the effects of locational housing attributes and environmental variables on property prices, although the set of explanatory characteristics is different due to different levels of data availability. Despite potential data discrepancies, a critical review by Chau and Chin (2003) identified a common set of price-influencing factors, among which house prices are likely to be positively influenced by the following amenities: view of the sea, lakes, rivers, valleys, and other types of water bodies and open spaces; and proximity to quality schools and places of worship. Interestingly, an unclear effect on housing price is also observed in the following variables: proximity to hospitals, shopping malls, and forests.
Although punctual benefits are straightforward to estimate via different methods, it is difficult to compute distributed benefits. On a conceptual level, for example, a citizen living 1 km from a regional shopping center may enjoy a certain level of benefits provided by the mall, but not so fair as the benefits received by a resident who lives immediate to the mall. In a sense, the distributed benefits are perceived. D’Acci (2015) drew a parallel between distributed benefit and contour lines such as elevation in a city and described it using positional benefit curves that connect urban points with the same level of distributed benefits. The authors proposed a procedure to convert the punctual benefits to the distributed ones via psychoeconomic distances that represent a commute factor from an urban point i to j.
Geographically weighted regression
GWR is an important contribution to the traditional regression technique and is designed to integrate spatial processes. It has widespread adoption in different disciplines that study the interactions of spatial components, such as environmental sciences (Fotheringham et al., 2019), urban mobility patterns (Zhu et al., 2023), and the evolution of pandemics (Mollalo et al., 2020).
GWR is a tool used in spatial modeling that aims at understanding spatial patterns involving maps comparisons. Comparing spatial patterns has vast applications in numerous domains, but this study focuses the scope of the review on applications that have immediate relevance to the built environment and amenities. The built environment can be thought of as a super set of amenities and plays a pivotal role in predicting a spatial entity of interest. Among different areas of interest, urban resident activity patterns, urbanization process, and spatial heterogeneity of urban economies are the main lines of pertinent questions. Specifically, transport geographers have built various forms of GWR models taking advantage of built environment factors to predict the levels of private hired transport, public transit, bike sharing, and other travel modes. For example, An et al. (2022) analyzed the preference of 840,000 commuters on public transportation in Wuhan, China, by employing a multi-scale GWR framework. They discovered that the factors of the built environment have a spatial hierarchical relationship with the share of public transportation, from the global to local scale. In a similar vein, Gao et al. (2022) focused their research on modeling metro ridership at the station level. They integrated a distance decay function to compute the distance from each station to land use characteristics, road network characteristics, and other variables of the built environment. This network distance-based approach is proved to generate the highest goodness of fit compared with a baseline model of the ordinary least squares regression, a normal GWR. These studies have demonstrated the effectiveness and efficiency of mixed-scale GWR in modeling the ridership of public transit, as further supported by a similar study by Yang et al. (2020). The mixed-scale GWR can capture the spatial heterogeneity among independent variables and result in fewer correlation residuals. In addition to transit ridership, other physical, social, and cultural aspects of urban activities can also establish a link with the built environment. For example, Wang and Chen (2017) developed an elegant index to quantify social inequity, as reflected by community opportunity, and their GWR model shows that distance from city centers and proximity to colleges are some of the built environment variables that have a significant impact on the opportunity index. Additionally, the mechanics of urban growth and spatial dimensions of urban economics are other streams of research that have also been studied with the help of GWR.
The review of the existing literature presents an opportunity for the computation of the isobenefit of urban amenities and the GWR. First, it is difficult to estimate the punctual benefits of amenities due to the lack of proxy data such as housing prices, even though effective tools such as HPM are available. The freely available detailed transaction data of residential properties is increasingly seen in many regions such as Singapore, removing the data inadequacy barrier. However, the ordinary least squares modeling used in HPM assumes that observations are spatially stationary, which may be violated when spatial attributes and heterogeneity are observed in a data set like the resale transaction records of public housing. This elicits our second point of introducing GWR to the computation. It has been demonstrated that GWR works well with different representations of amenities (Cao et al., 2019) (the Singapore housing price study), accounts for the relationships between the built environment and a response variable in different spatial scales, and can deal with big data sets (the Singapore case). Taken together, the integration of benefit computation and GWR is scientifically sound, yet not explored enough, which will be a major objective of this study.
Methodologies
Figure 1 shows the roadmap and critical assumptions in this study. It presents five steps to calculate the benefit scores at each urban location. In the first three steps, GWR was used to estimate the punctual benefits of urban amenities. Table 1 shows the types of amenities to be considered in the Singapore context, given data availability and the consistency with the original work. Because Singapore actively promotes transit-oriented development, this study also considered MRT and bus stops in the calculation of distributed benefits. In the fourth and fifth steps, the punctual benefits were distributed at each urban location in the study area. Proposed framework for computing benefits of urban amenities.
Computing amenity benefits
This study adopted the equation developed by D’Acci (2013) to calculate the benefit of a particular amenity in any urban cell in a study area:
Using geographically weighted regression to estimate the punctual benefit of an amenity
As described in the literature review section, the stated preference survey is an appropriate method to estimate the direct benefit of an amenity. The survey-based approach is not flawless: it may be time consuming and costly; it generates selection bias among respondents; and it unavoidably suffers from sampling bias that may not cover all population groups.
An alternative thinking is related to potential users’ willingness to pay to use amenities. This concept ties benefits with costs, among which housing prices in different neighborhoods reflect varying levels of living expenses. For example, a young couple with an infant may be interested in buying a property nearby good-quality childcare facilities, at a higher housing cost. The increase in housing costs may indirectly reflect the benefits of childcare facilities. In other words, housing price is a palatable proxy to quantify the benefits of the amenities that surround a property. Housing pricing models, hedonic pricing models (HPMs) for example, are therefore gaining widespread adoption since their introduction decades ago. Conceptually, an HPM can be expressed as H = f(amenity factors + housing features) where H is the price of a housing unit and f could be any functional form that models the relationship between the amenity factors and the price. This study used geographically weighted regression (GWR), as a spatial version of HPM, to quantify the influence of amenity variables on housing price. The use of geographically weighted regression (GWR) in urban studies has been shown to provide valuable insights into the spatial variation of relationships between variables. Recent research by Carlucci et al. (2023); Tang and Wong (2020) has demonstrated the effectiveness of GWR in analyzing urban growth patterns and housing market dynamics, respectively. GWR is mathematically defined by
Additionally, a key idea of GWR is the kernel that applies weights to the variables of observations within the kernel of a central point i. When estimating the parameters at the location i (equation (2)), GWR assumes that the model is less affected by the points that are far away from i. There exist several weight schemes, one of which is the exponential decay function.
The GWR algorithm starts with an initial guess of λ and transforms all the observations within the kernel of a central location i, according to
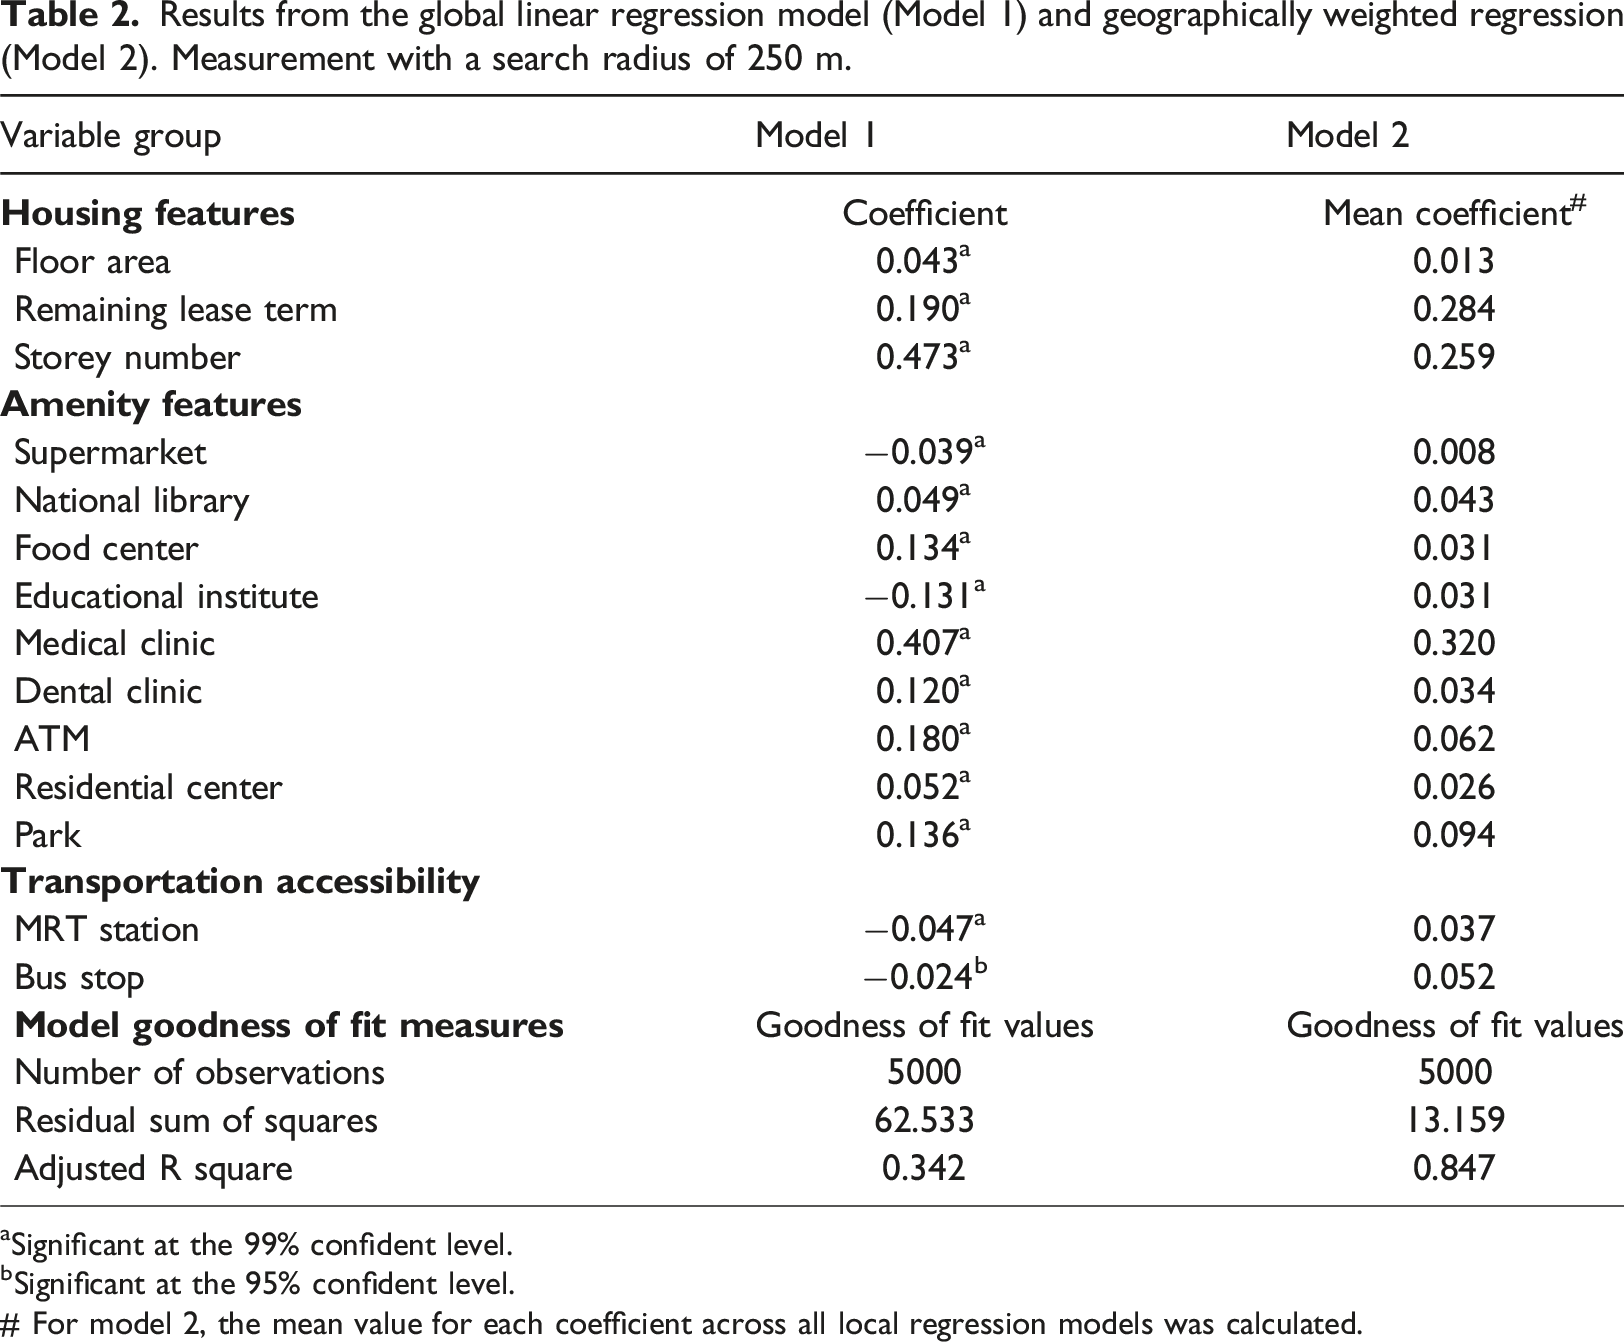
Results from the global linear regression model (Model 1) and geographically weighted regression (Model 2). Measurement with a search radius of 250 m.
aSignificant at the 99% confident level.
bSignificant at the 95% confident level. # For model 2, the mean value for each coefficient across all local regression models was calculated.
Calculating cumulative benefits of amenities
Assigning the A value to the location of an amenity
An amenity may not be located at the same place as an observation where A
j
is computed (equation (6)). Therefore, the punctual benefit of an amenity
Calculating the benefit of an amenity in a given urban location
The punctual benefit of an amenity,
Obtaining the “orography map” of the distributed benefits of a given urban location
Once we obtain the benefits of individual amenities in an urban location, the benefits are summed up with equal weight. The resulting quantity is a comprehensive indicator of the overall quality of amenities in the location and can be compared with that in other regions, namely, an “orography map” (D’Acci, 2015).
All data used in this study were obtained from open data sources in Singapore. For detailed descriptions, please refer to the data sources section of the Supplemental Material.
Results
Density maps of amenities
Figure 2 presents the density maps of six selected amenity types. The presented spatial patterns give the impression that most amenities are densely and evenly located within the regions. In particular, supermarkets and medical clinics are the two variables with the highest densities; most of these facilities are within walking distance of residential blocks. One may tend to make an inference that residents within the regions may enjoy fair benefits provided by these amenities. This potential inference begs the questions of how fairness is measured and the distribution of benefits is computed and mapped, which will be discussed in this section. Density maps of amenities (selected).
The GWR modeling results
Table 2 shows that GWR significantly outperforms the global model, as supported by an approximately 150% increase in R squares. This improvement suggests that the housing prices patterns and their relationships with explanatory features are spatially explicit. A closer inspection of the local trends of the R squares further illustrates this spatial heterogeneity of the modeling performance (Figure 3). One highlight is that the central regions and the southern waterfront that are home to mature towns witness higher R squares than younger towns located in the peripheral areas of the island. Furthermore, these suburb regions often see a larger gap between the maximum and minimum R squares of local models compared to the core areas, meaning the spatial variations of modeling performance tend to intensify from older to younger towns. In other words, in older towns, housing price is generally better informed by the set of housing and amenity features than in younger ones. Distribution of R squares across the island with a search radius of an observation is 250 m. Floor area (left). Remaining lease term (middle). Floor level (right).
Table 2 also corroborates the selection of the housing and amenities features, as suggested by the confident levels of the variables. According to Model 1 (global model), all variables are statistically significant at the 95% confident level. Furthermore, important features can also be inferred from the table. Among housing characteristics, floor level is the strongest indicator that contributes to a rise in housing price given a higher floor level (holding other variables constant). As expected, the remaining lease term of a flat is also positively associated with its housing price, which is intuitive. Most amenity features are positively related to the dependent variable, as well, with the exception of educational institutes. Counterintuitive as it may be, a higher number of educational institutes results in a lower housing price. Within the context of Singapore, there exist similar studies echoing the same finding. For example, McManus and Ong (2022) developed a pricing tool with which a potential buyer can interact to see how much the buyer is expected to pay by providing such information as address, property type, and floor size. The tool can return which factors impact the resale price. For certain locations, proximity to the food center indicates a negative effect, which is consistent with our observations. The spatial patterns observed in our GWR results are consistent with findings from recent studies on urban spatial structure. For example, Wang (2021) found that polycentric urban development influences the distribution of urban amenities, which is reflected in our analysis of amenity benefits across Singapore.
On a global level, the signs of the coefficients of Model 2 (GWR) tend to agree with those of Model 1 (Table 2). More intriguing are the spatial patterns of these coefficients, which is made possible by GWR and a palatable merit of applying a spatial regression. The sign and magnitude of the regression coefficients vary spatially. For example, floor area negatively affects the price per unit area in the northern and northeast areas, while it has a more positive influence in the central regions (Figure 4). The remaining lease term and floor level are spatially consistent with respect to their signs (all above zero). However, from the suburb to the city cores, the values of these two characteristics are at least triple. Furthermore, all three housing features are statistically significant across the entire study region, as demonstrated by the very few white pixels that represent zero value. Mapping of regression coefficients of housing features. Search radius is 250 m.
Figure 5 highlights a slightly different story from Figure 4. First, amenity features are even more spatially diverse than their housing counterparts. Five out of six amenity features have positive and negative signs throughout the island. The way the coefficients of the number of educational institutes are mapped is phenomenal: the count of those pixels showing negative values (red color) outnumbers those suggesting positive ones (blue color). One possible explanation may be the representation of education that is constrained by the availability of data. If other aspects such as school quality are introduced into the model, the outcomes may differ. Second, not all locations contain significant coefficients. In other words, in certain locations, housing prices may be indifferent to changes in a particular amenity feature, given the GWR modeling architecture developed. This is particularly true for the number of supermarkets: Only a handful of places appear to be significant. It is expected that the search radius may be at play, resulting in the insignificance of the variables in most of the regions. Therefore, a different search radius (400 m) was employed and the modeling results can be assessed in the Supplemental Material. Third, the spatial distribution of amenity variables appears to be more random than housing features. The effect of housing characteristics on the price of a flat follows the classic location theory: where a housing property is situated partially determines how valuable the property is (Xiao, 2017). Pricey properties are situated in city cores and waterfronts. However, the spatial variation of the amenity features needs to be understood on a case-by-case basis. For example, parks in the suburbs are highly positive in determining the price of housing, whereas food centers play a more contributing role in the western and eastern regions of the city. These patterns are appreciated as it is expected that they may contribute to a mapping of amenity benefits that shows a more multi-peak landscape than a single-peak one depicting the trends of housing price. Mapping of regression coefficients of amenity features (selected). Search radius is 250 m.
Island-wide benefit mapping
Figure 6 conveys two highlighted messages: first, the spatial configuration of each amenity adheres largely to what is observed in Figure 5; second, unlike observations based on the outcomes of the GWR modeling, negative benefits are not dominant. It unveils the spatial diversity of the benefits of different amenities. The accumulation of benefits of dental clinics, ATMs, and residential centers appears in the heartlands. Supermarkets provide the highest benefits in the eastern part of the city. There are scattered circles in the central and northern areas that benefit from the bus mode. The benefits of parks are more uniformly distributed within the city, while there is an increasing trend from the center to peripheral towns. Local peaks of benefits take “island”-like shapes, partly because of the implementation of local and regional distance thresholds. Furthermore, although rare, we do witness some negative scores. Specifically, MRT stations in some locations are associated with negative benefits. Mapping of benefit scores for each amenity type. E = 0.5. Local distance threshold = 400 m. Regional distance threshold = 800 m.
When these individual benefits are added, the resulting rendering of the overall benefits of all amenities presents several patterns that merit to be emphasized (Figure 7). First, it is foreseeable that the city cores—central and southern parts of Singapore — benefit the most from established amenities (Figure 7(a)). Not only do city centers enjoy the abundance and richness of various amenities but also contain higher-quality facilities (as partly reflected in the house pricing model). Although the unevenness of benefits is anticipated, it is encouraging to note some local optima in regional centers: an eastern community adjacent to Changi airport (Tampines), a western region that is close to the downtown (Clementi), another western community that is more distant (Jurong West), and two northern communities showing higher benefit scores. Although the magnitude of these local benefits optima is not as comparable to that of the city cores (Figure 7(c)), it is likely that the amenities may provide similar benefits to residents of both mature and young towns. The second observation is that the mapping of benefits is largely consistent with how housing prices vary spatially. This is understandable because the direct benefits of an amenity are informed by the regression models fitted against housing prices. Mapping of final benefit scores. (a) Spatial distribution of benefits. (b) Overlaid housing prices. (c) and (d) 3D visualization of distributed benefits. E = 0.5. Local distance threshold = 400 m. Regional distance threshold = 800 m.
Changing the modeling parameters
It should be acknowledged that the computation of amenity benefits is subject to the selection of a search radius, the efficiency of movement factor, local and regional distance thresholds, and other underlying parameters that define the modeling framework. Therefore, how sensitive the landscape of calculated benefits is must be demonstrated because the proposed framework may be insufficiently validated due to a lack of ground-truth data, although it may be theoretically sound. For example, how the amenity variables are represented can affect the final distribution of estimated benefits. Within a search radius of 250 m, some amenity variables such as library and supermarket are likely small. The higher efficiency of movement factors suggests that residents can make fewer efforts to reach the amenities on the other side of the city. Therefore, a sensitive analysis of these parameters becomes a necessity.
Figure 8 shows the resulting maps in different combinations of the efficiency of movement factors and the regional distance thresholds. The horizontal dimension with a fixed distance threshold presents the effect of different movement factors. When the factor is greater than one, the actual distances are discounted. In other words, the benefit of amenities is spread over a larger than expected distance. Interestingly, this results in a unique growth mechanism: Amenity benefits increase rapidly in the city cores. Local optima are absorbed, and the contour lines of benefits tend to circle around the center of the map. The efficiency of movement factor seems to outweigh regional distance thresholds as well. Figure 8 shows that the subfigures along the vertical dimension with a fixed movement factor only display negligible differences. Other experiments with a changed search radius were also performed, whose details can be found in the Supplemental Material. Distribution of amenity benefits given different efficiency of movement factors. RC: regional distance threshold. The local distance threshold is fixed at 400 m. The search radius is 250 m.
Taken together, the aim of this sensitivity analysis is not to justify which combination of parameters is more valid but rather to demonstrate the evolving landscape of amenity benefits that is explainable by the altered parameters. The quantification of the benefits of non-market goods is complicated: This study only stops at the point where certain combinations of model parameters are likely to generate a more homogeneous trending surface with concentric circles of scores. However, we also hope that the readers will have some insights that enrich their toolboxes of city planning and infrastructure management. For example, although urban amenities appear to be evenly distributed (Figure 2), the estimated benefits can be dynamically calculated. The benefit landscape develops several centers; this motivating result lends support to modern urban planning practices that promote multicenter development. The results can serve as a cross-validation benchmark for urban planning schemes and help planners develop long-term plans to reinforce location and fine-scale urban development.
Our findings on the spatial distribution of amenity benefits contribute to the ongoing discussion on urban equity and accessibility. The study by Heroy et al. (2023) has shown that the relationship between neighborhood amenities and mobility patterns varies by socioeconomic status, which aligns with our observations of spatial heterogeneity in amenity benefits.
Conclusions
This study quantified the benefits of urban amenities based on proxy data from the resale transaction records of public housing in Singapore. Geographically weighted regression was applied to obtain a monetary value of proximity to food centers, libraries, parks, and other urban amenities. The estimated monetary values of the amenities were further supplied to generate an island-wide distribution of composite benefit scores, based on the quantitative model proposed by D’Acci (2013). By concluding this study, we want to highlight the following findings: 1) Geographically weighted regression outperforms a global liner regression model by a 150% increase in R squares, indicating a better goodness of fit and suffering less from spatial autocorrelation of residuals and spatial heterogeneity issues among the attributes that influence the price of housing. 2) On average, the coefficient signs from the geographically weighted regression models largely agree with those of the global model. However, the sign and magnitude of the regression coefficients from the spatial model vary significantly in space. 3) The city cores take the top spot for the highest levels of composite benefits, with concentric circles of decreasing values of benefits spreading towards the peripheral rings of the island. If a parameter representing urban mobility efficiency is tuned, a benefit landscape with multiple centers is also observed.
However, these findings should be appropriately interpreted due to several limitations. First, the factor measuring how pleasant a commuter travels from one location to another is constant. Although this simplification generally works in the context of a small study area such as Singapore, the accessibility of transport still exhibits some degree of spatial variations that may impact the final calculation. Second, the curves of distributed benefits are still subject to validation. As a follow-up study, a survey may be designed to understand how much respondents value urban amenities through structured survey approaches such as the revealed preferences method. Third, the original concept of isobenefit lines was implemented based on two assumptions in the context of Singapore. The first is that transit services, which are normally access to amenities, were considered as a part of the computation. The second assumption is the implementation of distance thresholds of different amenity types. The distributed benefit of bus stops is zero above 400 m to an urban point, while that of MRT stations, food centers, and supermarkets is zero above 800 m of a point. Libraries and other global amenities are free of the limit of a distance threshold. Forcing the distributed benefit of certain amenities is a strong assumption so that the outcomes should be taken with a grain of salt. Despite its limitations, the mapping of urban amenities can enrich urban planners’ toolbox and be applied to other cities with comparable geographical and demographic characteristics. Emerging and generalizable patterns of cities with a complex spatial structure may be extracted from these applications.
Supplemental Material
Supplemental Material - Quantifying the benefits of urban amenities in Singapore with consideration of the effects of spatial heterogeneity
Supplemental Material for Quantifying the benefits of urban amenities in Singapore with consideration of the effects of spatial heterogeneity by Jie Song, Jeremy Oon, Rakhi Manohar Mepparambath, Diem Trinh Thi Le, and Hoai Nguyen Huynh in Environment and Planning B: Urban Analytics and City Science
Footnotes
Author contributions
Declaration of conflicting interests
The author(s) declared no potential conflicts of interest with respect to the research, authorship, and/or publication of this article.
Funding
The author(s) disclosed receipt of the following financial support for the research, authorship, and/or publication of this article: This research is supported by A*STAR project number (C211618005).

Data Availability Statement
Data sharing not applicable to this article as no data sets were generated or analyzed during the current study.
Supplemental Material
Supplemental material for this article is available online.
References
Supplementary Material
Please find the following supplemental material available below.
For Open Access articles published under a Creative Commons License, all supplemental material carries the same license as the article it is associated with.
For non-Open Access articles published, all supplemental material carries a non-exclusive license, and permission requests for re-use of supplemental material or any part of supplemental material shall be sent directly to the copyright owner as specified in the copyright notice associated with the article.
