
Abstract
The COVID-19 pandemic has profoundly disrupted urban systems, reshaping human mobility and activity patterns. While previous studies have documented macro-level declines using aggregated mobility indicators, the evolution of localized activity patterns throughout the pandemic phases remains unclear. This study integrates geotagged social media imagery with a geospatial AI-based analytical framework to examine long-term shifts in urban activity in Seoul, South Korea. We collected 14,875 Flickr photographs from 2018 to 2023 and applied HDBSCAN to delineate urban areas of interest. We classified image content using a ResNet-50 model fine-tuned on the Places365 dataset to capture semantic activity patterns. The results revealed sharp contractions of indoor-oriented categories—such as shopping malls and coffee shops—during 2020–2021, alongside a rise in outdoor categories, including parks and plazas, reflecting both formal restrictions and heightened risk perceptions. By 2022–2023, indoor activities gradually reappeared while outdoor activities remained significant, suggesting a rebalancing of urban behavior rather than a simple return to pre-pandemic conditions. The analyses highlight differentiated adaptation pathways: cultural resilience in the central district, rapid commercial recovery in Gangnam–Songpa, and balanced leisure–work restoration in Mapo–Yeouido. Interpreted through the stimulus–organism–response framework, these findings provide empirical evidence of how external shocks reshaped perceptions and behaviors, mediated by district-specific functions. The study demonstrates the value of linking behavioral framework with geospatial AI-based spatial analysis to monitor place-specific adaptation. By offering a 6-year longitudinal perspective, it contributes to both conceptual integration and empirical insights for adaptive and resilient urban planning.
Introduction
In 2020, the COVID-19 pandemic imposed substantial constraints on global activities, intensifying existing socioeconomic challenges and reshaping human mobility and behavior (Lesser and Nienhuis, 2020; Li et al., 2021; McCarthy et al., 2021). Travel restrictions and social distancing measures altered patterns of urban activity, which is defined as the spatiotemporal patterns of individuals’ everyday activities—such as living, working, shopping, and leisure—within urban environments, inferred from data sources like mobile phones, travel diaries, and social media (Hasan and Ukkusuri, 2014; Hong and Yang, 2025; Kar et al., 2022; Newsome et al., 1998; Yin et al., 2018). However, limited research has examined how urban activity evolved across the pre-, during-, and post-pandemic phases.
In times of large-scale disruptions such as pandemics and natural disasters, individuals and societies experience a cycle of disruption, response, and adaptation as part of broader management and behavioral adjustment processes. These shifts can be interpreted through the stimulus-organism-response (SOR) framework (Woodworth, 1929), where the pandemic serves as an external stimulus influencing individuals’ perceptions and, in turn, their spatial decisions and activity patterns (Mladenović et al., 2023; Pandita et al., 2021). This study builds on this perspective to empirically examine how external stimuli (i.e., pandemic-induced restrictions) translated into behavioral responses reflected in spatial activity patterns. For instance, prolonged home confinement and social distancing disrupted routines, prompting individuals to reorganize their daily activities and reconfigure urban spaces to accommodate work, study, and leisure (Bao et al., 2023; Mao et al., 2024; Song et al., 2021). However, most existing studies have relied on traditional mobility datasets or aggregated statistics, which, while valuable for revealing overall trends, lack the contextual depth needed to operationalize behavioral adaptation frameworks (Hu et al., 2021). To address this gap, we employ social media data in conjunction with advanced analytical tools to capture the complex and dynamic nature of urban activity. Compared to traditional top-down data, social media data offer more granular insight into individuals’ spatial behavior amid major environmental disruptions and evolving urban conditions, serving as valuable bottom-up and near real-time data for understanding human-environment interactions (Lee et al., 2022; Liu et al., 2015).
Leveraging the potential of social media data requires addressing the limitations of conventional spatial analysis techniques in processing and interpreting large-scale, heterogeneous, and unstructured datasets (Yin et al., 2021). Recent advances in artificial intelligence (AI) technologies have significantly improved our capacity to extract insights from unstructured data, such as text and images (LeCun et al., 2015), by enabling scalable and nuanced analysis that can reveal complex patterns embedded within high-dimensional data. Within the geospatial domain, geospatial AI (GeoAI) has been increasingly applied to areas such as disaster management, transportation, tourism, and urban analytics (Janowicz et al., 2020; Ser and Yang, 2025). Nevertheless, most applications of GeoAI studies on social media have focused on mapping popular locations or characterizing urban areas of interest (AOIs) (Kádár, 2014; Kim et al., 2019; Kurashima et al., 2013), with relatively little attention paid to how large-scale disruptions like the COVID-19 pandemic have reshaped spatial behavior and urban activity patterns across time.
Guided by the broader response and adaptation processes observed during the pandemic, this study seeks to comprehensively understand how urban activity evolved across different stages of disruption and recovery. To this end, we pose the following research questions: (1) How did urban activity patterns shaped by individuals’ behavioral responses to pandemic-induced disruptions evolve across the pre-, during-, and post-pandemic periods? (2) How can geotagged social media data be used as a bottom-up, near real-time indicator of spatial behavior and adaptation during large-scale disruptions? (3) How can machine learning and deep learning models be employed to detect, classify, and interpret dynamic shifts in urban activity, and what insights can they offer for future adaptive urban planning? To address these questions, this study leverages geotagged social media data and GeoAI techniques to examine how AOIs have adapted to the spatial and behavioral disruptions triggered by the pandemic. By analyzing spatiotemporal patterns of urban activity and its characteristics, we aim to clarify how individuals responded to the constraints and how such responses reshaped the use of urban space. This study extends GeoAI-based approaches in three ways: theoretically, by operationalizing the SOR framework in an empirical urban context; methodologically, by integrating spatial clustering and deep learning-based image classification over a 6-year time span; and empirically, by identifying changes in urban activity across the pandemic periods. Together, these contributions provide evidence of how behavioral resilience is spatially manifested due to large-scale disruptions.
Literature review
The COVID-19 pandemic profoundly disrupted urban systems, altering not only infrastructure and governance but also everyday patterns of human mobility and activity. Studies across diverse contexts have documented sharp declines in urban movement, reductions in central business district visitation, and shifts from indoor to outdoor spaces as individuals sought safer environments under lockdowns and social distancing mandates (Gao and Zhao, 2024; Li et al., 2021; McCarthy et al., 2021; Sharifi and Khavarian-Garmsir, 2020). These disruptions highlighted the vulnerability of urban areas to sudden shocks and underscored the need to better understand how people reorganize their spatial behaviors during crises. While existing research has provided valuable insights at city or regional scales, often using aggregated mobility indices or administrative data (Ehlert and Wedemeier, 2022; Hu et al., 2021; Zhang et al., 2022), such approaches primarily capture macro-level declines in activity and fail to reveal how localized, place-specific activity patterns changed or persisted. Consequently, how disruptions affected specific urban AOIs and how activity adaptations unfolded within them over time remains unclear.
Traditional approaches to examining urban activity have relied on surveys, administrative records, transportation data, and mobile phone traces (Hu et al., 2021). While such sources provide valuable baseline information, their limitations became especially apparent during the pandemic. Surveys are prone to lags and memory distortion, making them poorly equipped to reflect dynamic disruptions in real time (Flanagin and Metzger, 2008). Administrative datasets and smart-card transactions can track the volume of trips or service use but cannot differentiate the purposes or semantic contexts of activities (Sui and Goodchild, 2011). Mobile phone-based data, including call detail records and GPS traces, offer broader spatial coverage, yet they typically reflect aggregate movement rather than the nature of activities, and they cannot effectively distinguish indoor from outdoor behaviors (García-Palomares et al., 2015; Pan et al., 2014). Remote sensing sources, such as night-time lights, provide complementary indicators of human presence but operate at coarse spatial resolutions and fail to capture behavioral nuances (Zhang et al., 2019). During the pandemic, when activity patterns shifted abruptly and at fine spatiotemporal scales, these constraints became more acute. Consequently, conventional data and methods are limited in their capacity to reveal the localized, activity-specific dynamics needed to understand behavioral adaptation under disruption.
Understanding how individuals reorganize their daily activities during crises requires grounding in behavioral theories. Urban resilience theory emphasizes cyclical processes of disruption, response, and recovery (Ribeiro and Pena Jardim Gonçalves, 2019), positioning the pandemic as a disruption that reorganized activity spaces and prompted gradual renewal in the post-pandemic phase (Holling, 2001; Sharifi and Khavarian-Garmsir, 2020). Similarly, time geography highlights the role of spatiotemporal constraints in shaping individual behavior; under lockdown conditions, these constraints tightened dramatically, compressing people’s activity prisms and reorienting their daily routines (Kwan, 2013; Miller, 2005; Toger et al., 2021). Risk perception and behavioral adaptation theories further explain how heightened awareness of disease led individuals to avoid indoor spaces in favor of outdoor alternatives (Lindell and Perry, 2012; Presti et al., 2022; Slovic, 1987). Moreover, the SOR framework (Woodworth, 1929) conceptualizes external shocks such as pandemic as stimuli that influence perceptions and emotions, which in turn shape behavioral responses. Applied to urban contexts, the pandemic served as a stimulus that altered risk perceptions and motivated individuals to substitute constrained activities with alternative options (Mladenović et al., 2023; Pandita et al., 2021). This logic aligns with the activity substitution perspective, which posits that people adapt to restrictions by seeking functionally similar but safer or more accessible alternatives (Bao et al., 2023; Song et al., 2021). While these frameworks offer complementary insights, they point to the need for empirical approaches that can integrate behavioral theory with fine-grained spatiotemporal observations. Among them, the SOR framework provides a particularly useful foundation because it explicitly links external shocks, such as the pandemic, to individuals’ perceptions and subsequent behavioral adjustments. Building on this perspective, the present study emphasizes the need to empirically operationalize the SOR framework by linking behavioral theory with fine-grained spatiotemporal observations of urban activity across the pre-, during-, and post-pandemic phases. Thus, identifying appropriate data and analytic methods is essential to advance our understanding of how such processes unfolded at the local scale during the pandemic.
The rapid proliferation of GPS-enabled smartphones and location-based platforms such as Flickr, Twitter, and Instagram has accelerated the production of spatially embedded user-generated content (UGC) (Pan et al., 2014; Sui et al., 2013). These data function as bottom-up proxies of human presence, mobility, and perception in urban environments (García-Palomares et al., 2015; Khan et al., 2020; Rattenbury and Naaman, 2009; Shao et al., 2017). Previous studies have demonstrated the utility of UGC in examining tourism flows (Kurashima et al., 2013; Xin and MacEachren, 2020; Zhang et al., 2019), monitoring urban change (Ilic et al., 2019), and supporting emergency response (Avvenuti et al., 2014; Yan et al., 2017). In parallel, advances in GeoAI have enabled scalable processing of high-dimensional UGC through deep learning models, particularly convolutional neural networks, for tasks such as scene classification, object detection, and semantic segmentation (Chen et al., 2019; Koylu et al., 2019; Li et al., 2018). Such models have enabled researchers to extract semantic meaning from imagery to assess landscape transformation, spatial heterogeneity, and human-environment interactions (Hu et al., 2015; Kruse et al., 2021; Lee et al., 2016; Ren et al., 2020). Nevertheless, most existing GeoAI applications remain focused on static or short-term contexts. Critically, they have rarely been employed to empirically operationalize behavioral frameworks, such as the SOR framework, across the pre-, during-, and post-pandemic phases. In particular, few studies have analyzed spatiotemporal dynamics at the level of specific urban AOIs, where behavioral responses to crises are most directly manifested.
In sum, prior studies have either emphasized aggregated mobility indicators or demonstrated the technical capacity of GeoAI, but few have connected these approaches to behavioral frameworks or applied them across pandemic phases. Existing research therefore revealed overall declines in activity but offered limited insight into how specific urban areas adapted over time. This study addresses that gap by empirically integrating a behavioral framework with GeoAI-driven analysis of geotagged social media imagery. Specifically, it contributes by (1) conducting a 6-year longitudinal analysis, (2) examining AOI-level rather than aggregate trends, and (3) applying image classification to operationalize the SOR model through measurable indicators of urban activity.
Materials and methods
Study area and research flow
Figure 1 presents the study area and the analytical workflow used to examine spatiotemporal shifts in urban activity patterns across the pandemic. This study focuses on Seoul, the capital of South Korea, located in the country’s northwestern region. As a densely populated metropolis with approximately 9.38 million residents and a population density of 15,506 people per square kilometer (Korean Statistical Information Service, 2024), land use is diverse, including residential, commercial, and green spaces. The pandemic severely impacted daily activities and human mobility in the city, reducing foot traffic and limiting social interaction (Hunter, 2022; Jo et al., 2021). Study area and analytical flow: (a) location of Seoul, South Korea; (b) Land use and land cover map of Seoul; (c) Data collection and preprocessing; (d) Spatial clustering to identify areas of interest; (e) Image classification using a deep learning model.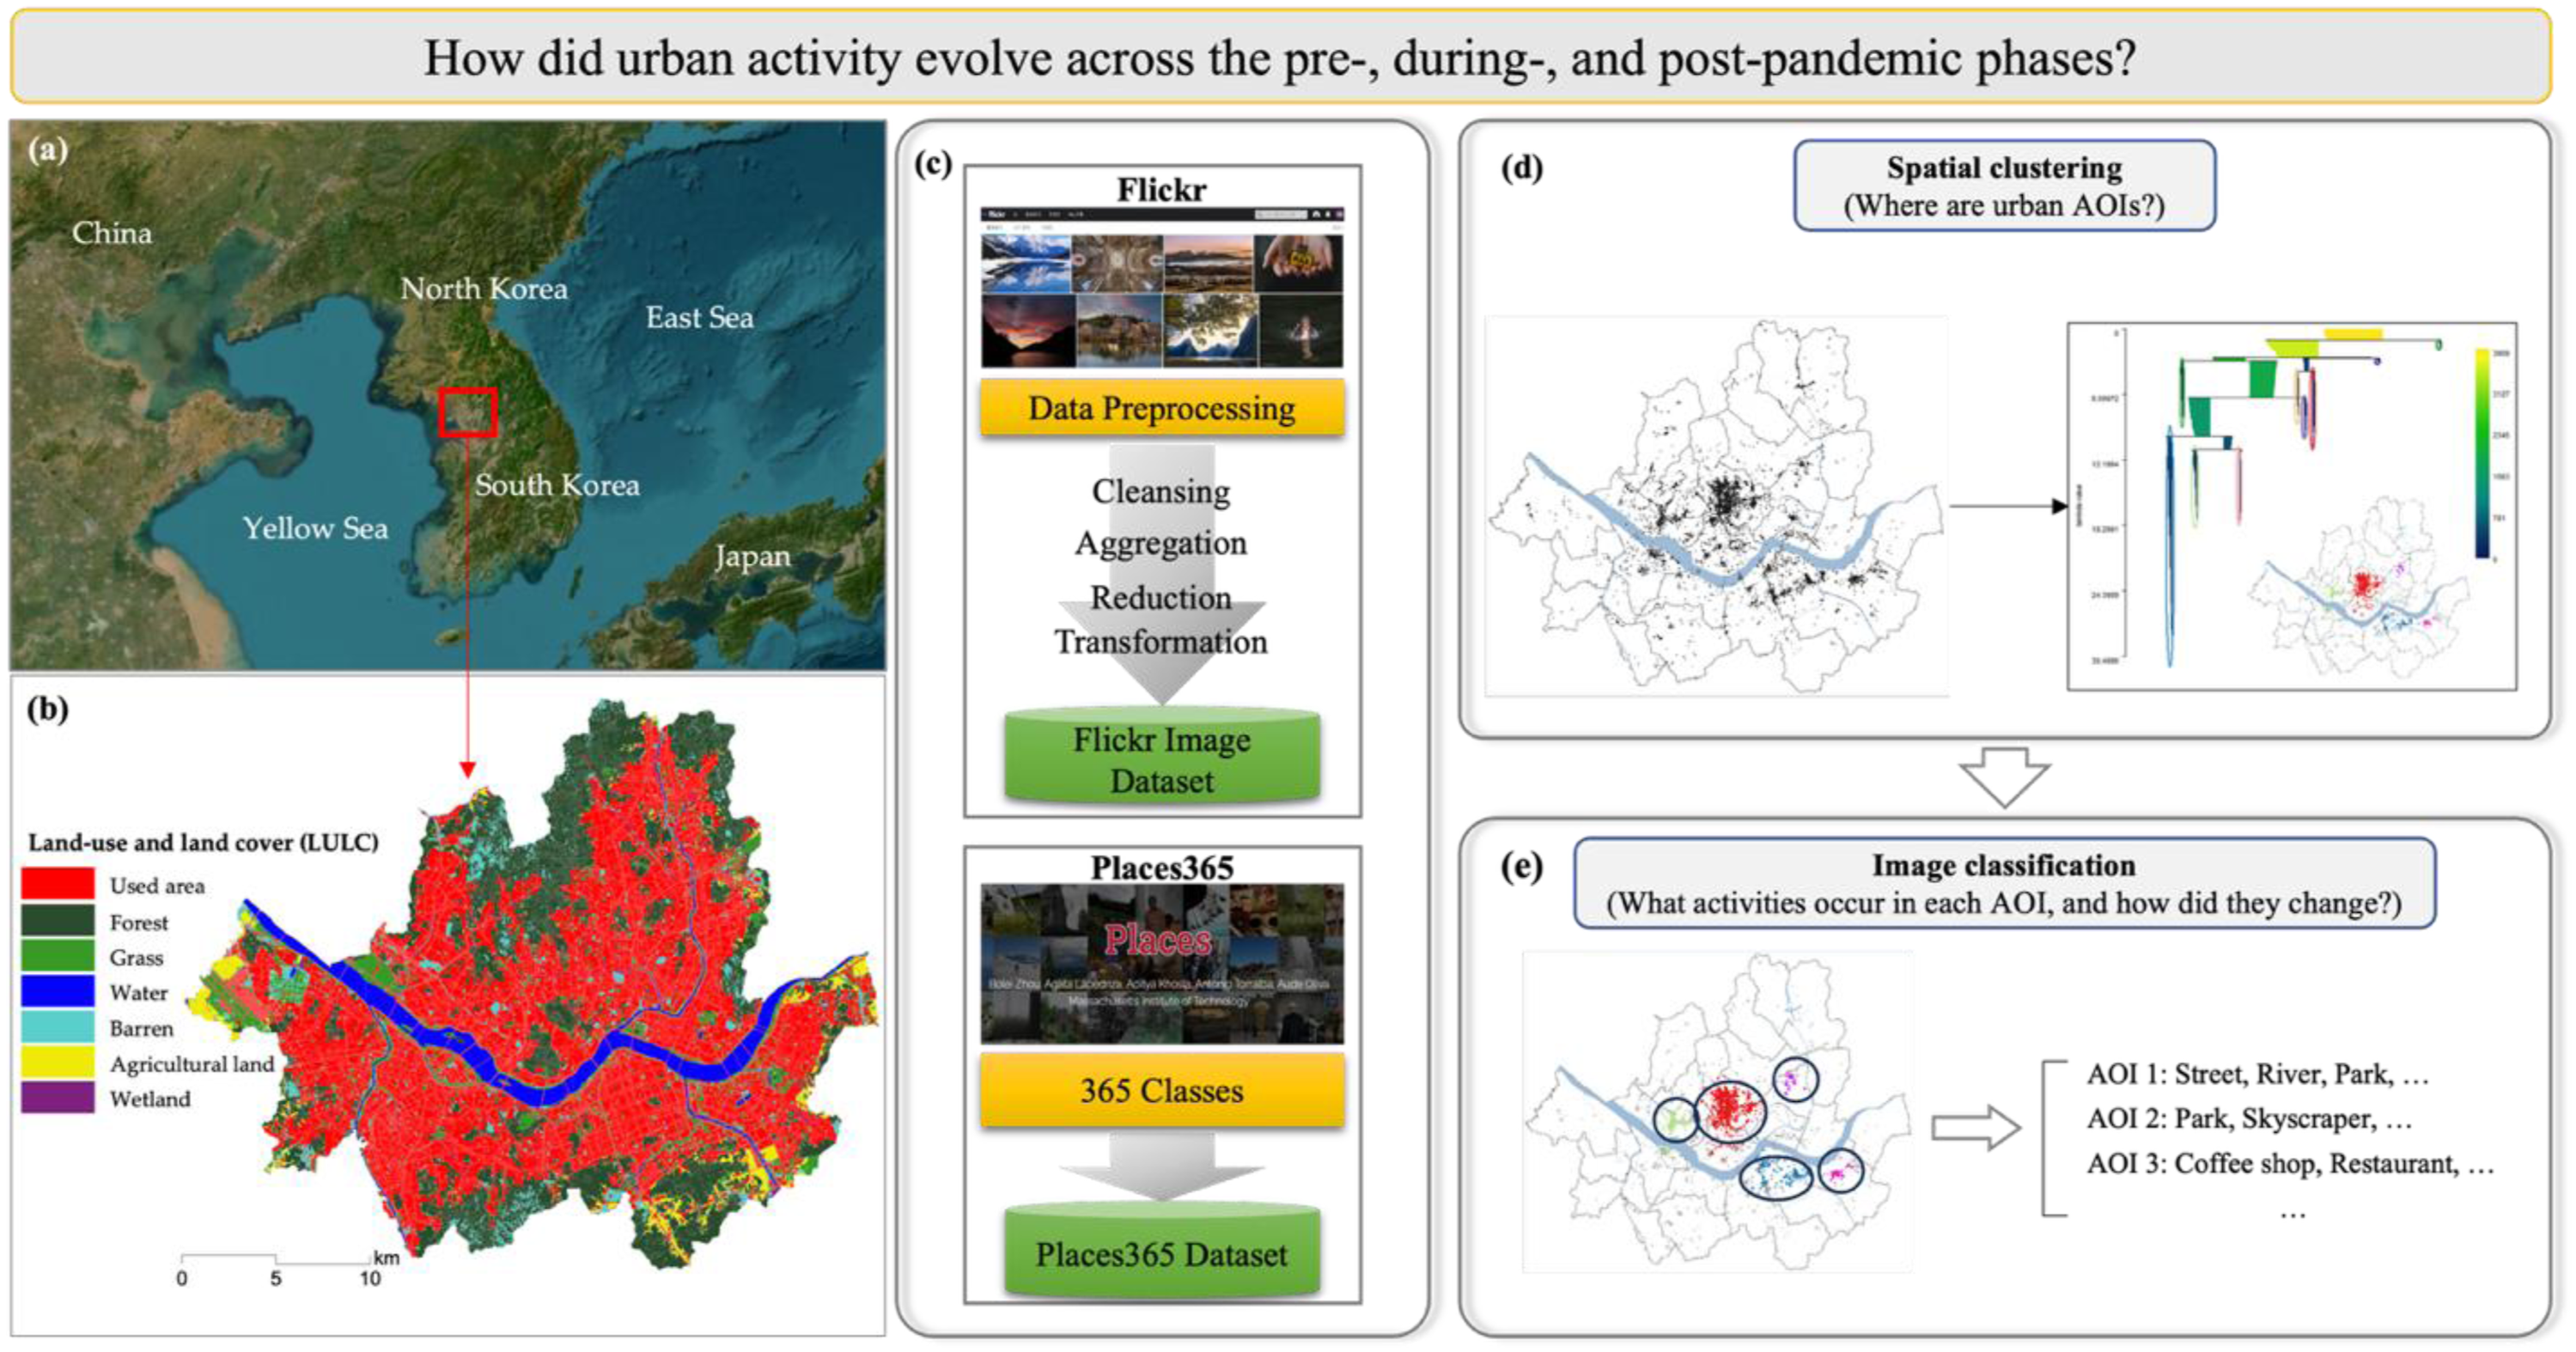
The analysis follows three steps. First, we collected and preprocessed geotagged social media data, removing duplicates and formatting records. Second, we identified spatial clusters of activity concentrations to delineate AOIs by employing a machine learning-based clustering method. Third, we classified the visual content of images within these AOIs to examine how urban activity patterns evolved across the pre-, during-, and post-pandemic phases, using a computer vision deep learning model. In this study, we defined AOIs as spatial units that emerge from the actual distribution of urban activity, rather than static administrative or planning zones, making them more suitable for capturing rapid and localized shifts during large-scale disruptions. Their size varied flexibly depending on the density and spatial concentration of activity in each year, typically ranging from neighborhood-scale clusters to larger subdistrict concentrations.
Data collection and preprocessing
Examples of metadata on Flickr images.
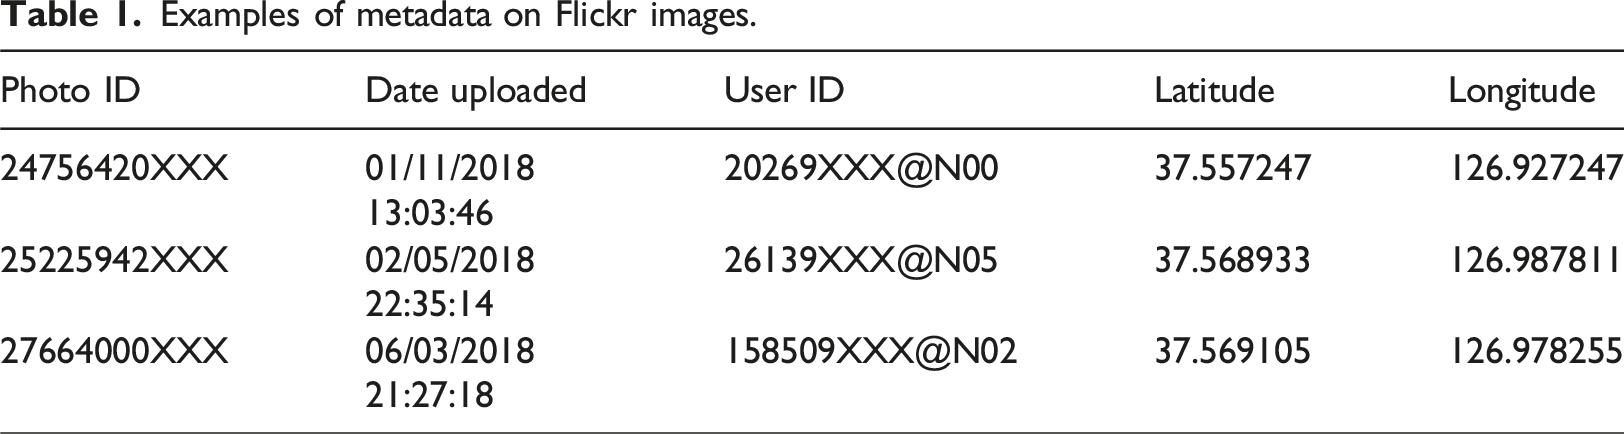
To classify the visual characteristics of the Flickr images, we employed a deep learning model trained on the Places365 dataset, which contains over 1.8 million labeled images across 365 scene categories, such as street, skyscraper, restaurant, and shopping mall, and has been widely used for visual scene recognition (Zhou et al., 2018). The trained model was used to categorize Flickr images by scene type, supporting a systematic assessment of visual and functional changes in Seoul’s urban activity over time.
HDBSCAN for clustering
To identify spatial clusters of urban activity, we applied hierarchical density-based spatial clustering of application with noise (HDBSCAN), which is suited for analyzing irregularly distributed data, as it detects spatial clusters based on local density variations and is resilient to noise (McInnes et al., 2017). The HDBSCAN method, built upon the density-based spatial clustering of application with noise (DBSCAN) method, groups points based on density connectivity and categorizes them into core, border, and noise points (Campello et al., 2013; Stuetzle and Nugent, 2010). Unlike DBSCAN, which produces clustering based on two parameters—
This process is visualized in Figure 2, where the original clusters are shown in the mutual reachability distance-based dendrogram (Figure 2(a)), and the selected clusters appear in the condensed dendrogram (Figure 2(b)). The stability of each cluster HDBSCAN operation: (a) graph of mutual reachability distance; (b) condensed dendrogram.

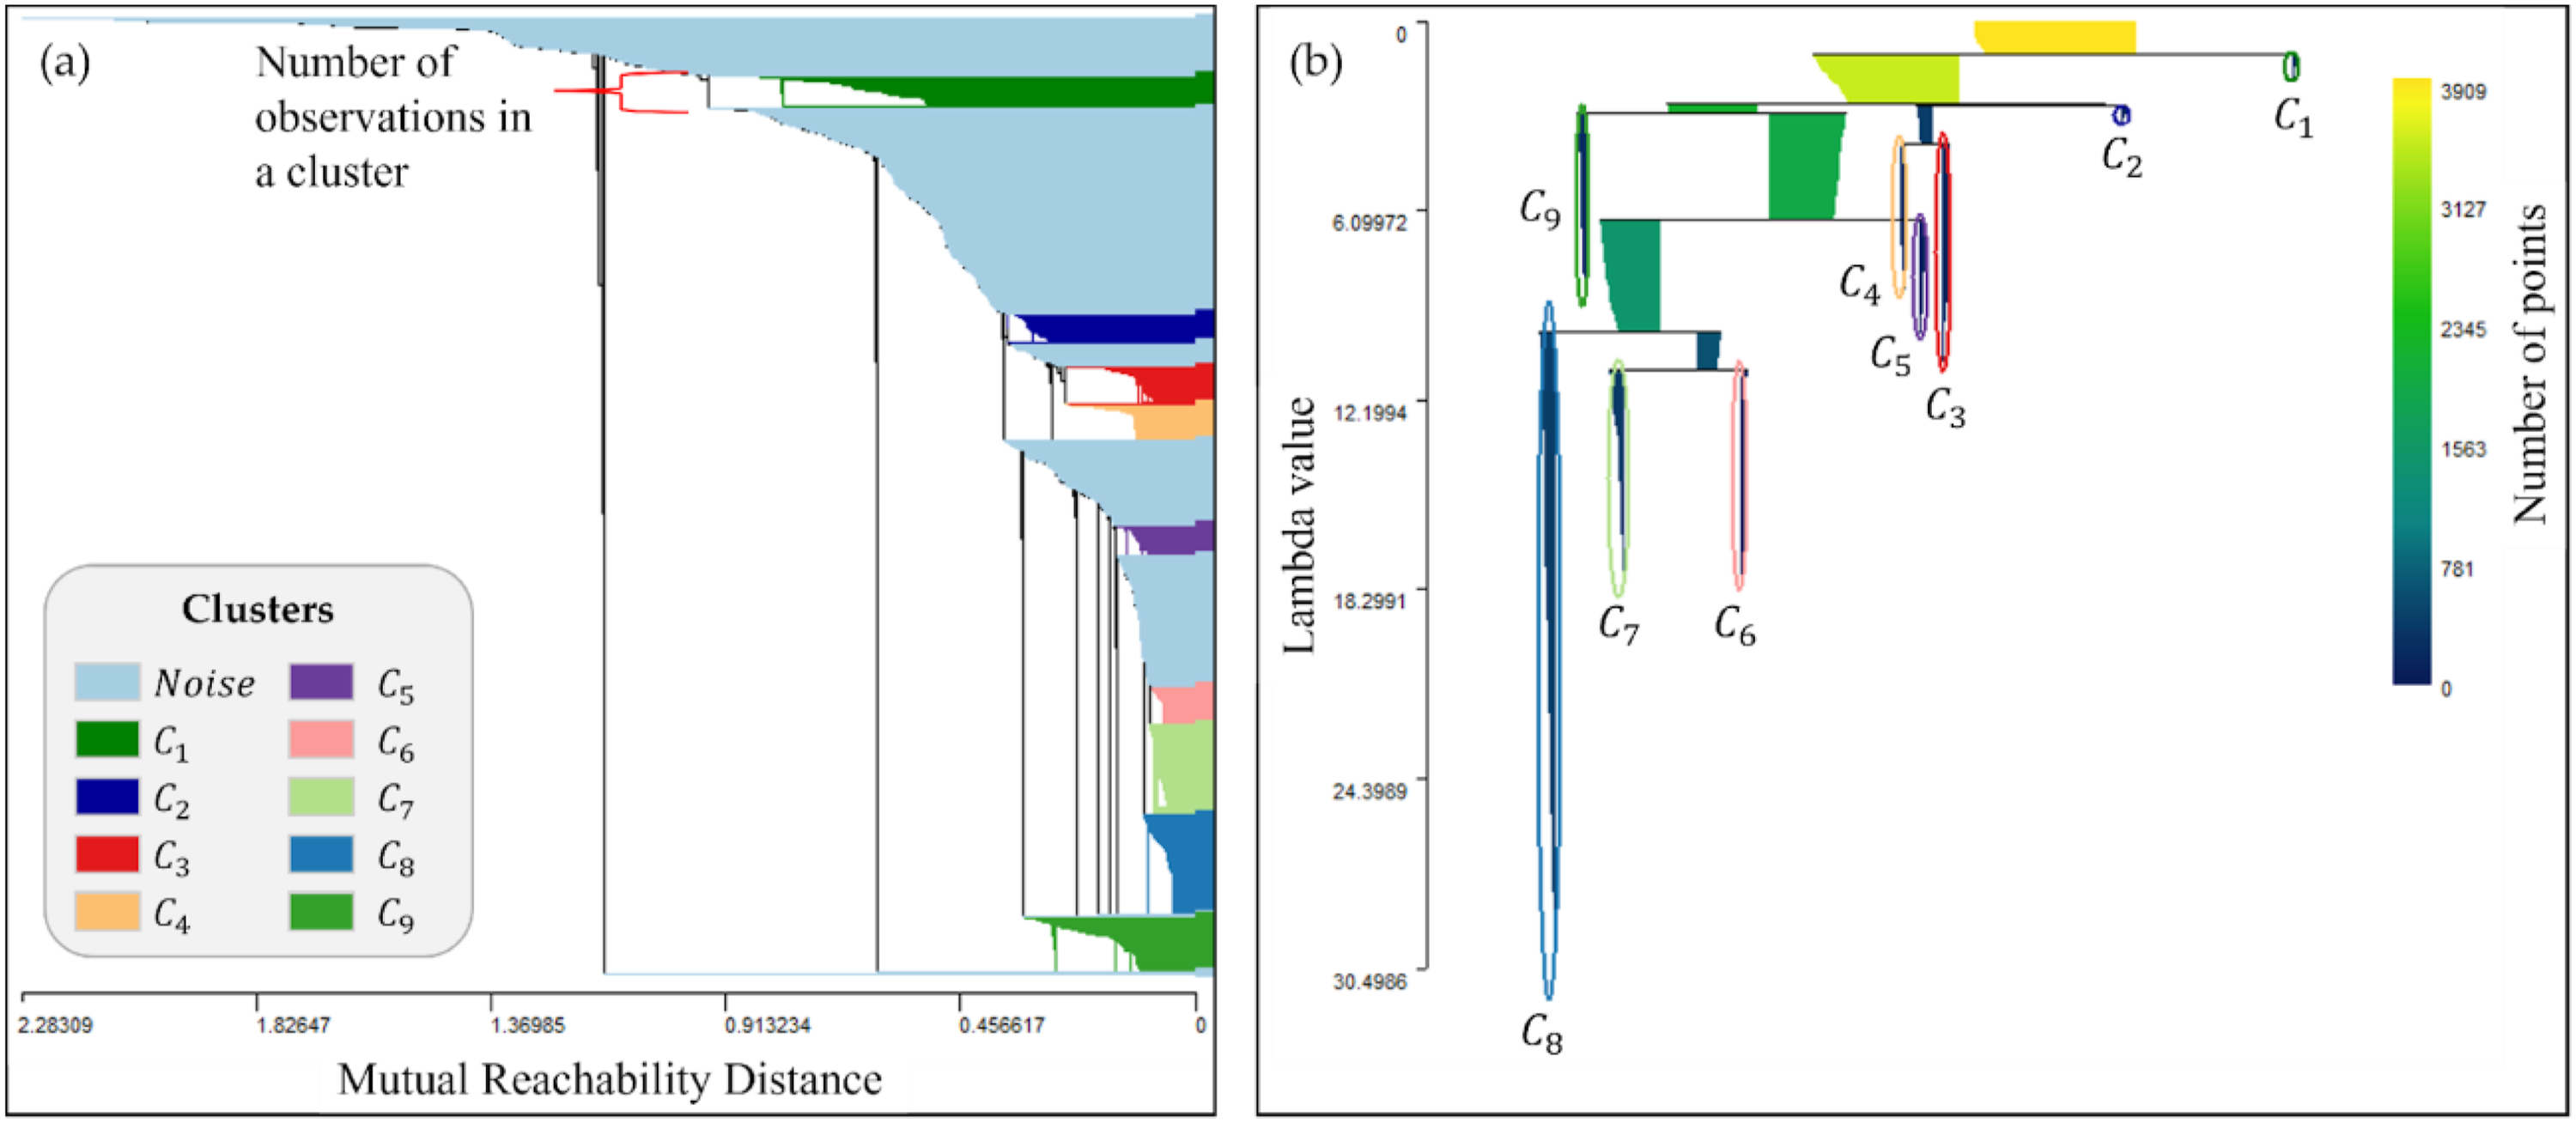
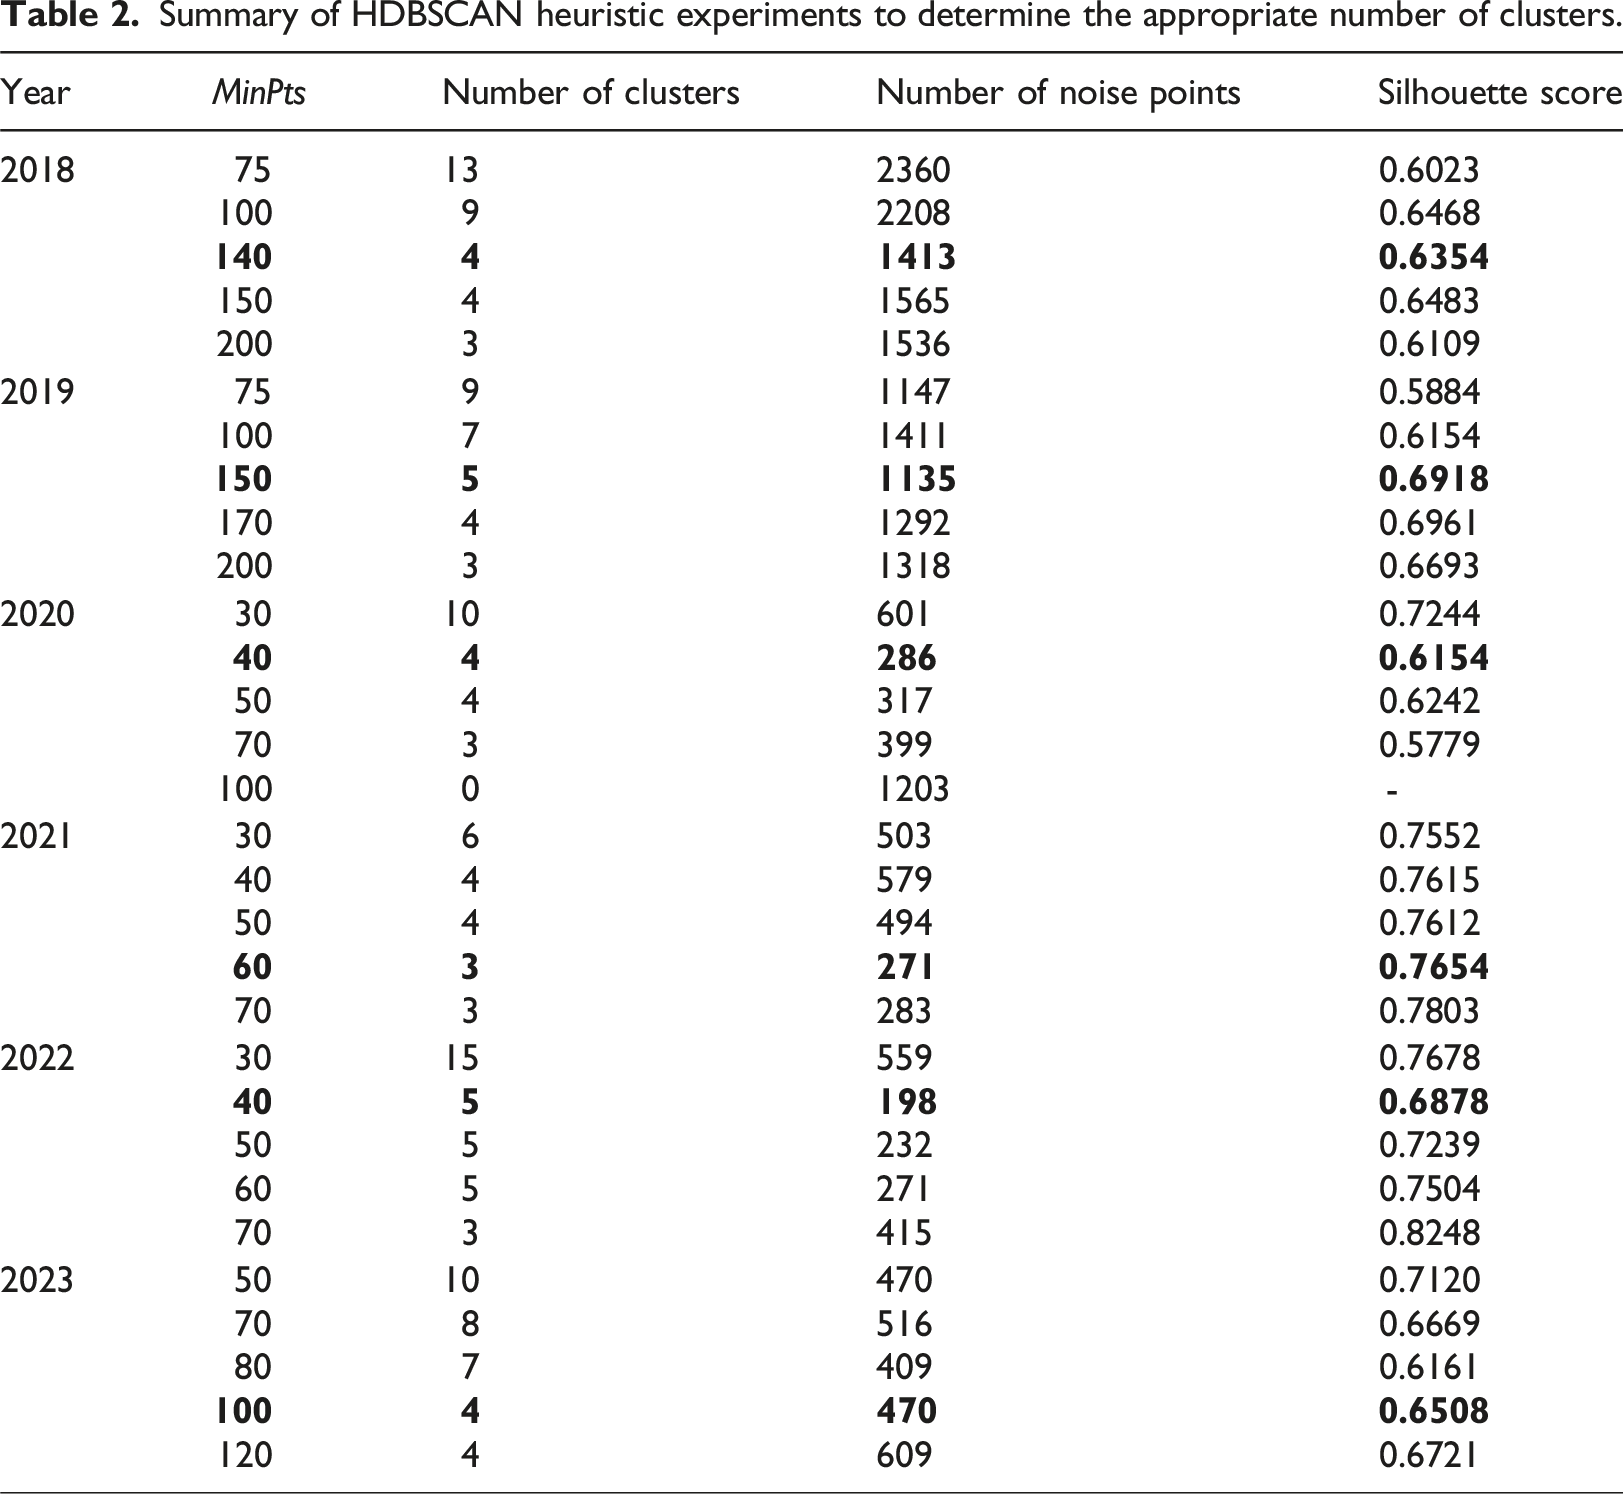
Finally, we applied HDBSCAN independently for each year to capture temporal variations in urban activity. To evaluate the quality of the clustering solutions, we used the silhouette score (Rousseeuw, 1987), which measures how well each data point fits within its assigned cluster compared to other clusters. The score ranges from -1 to 1, where values close to 1 indicate well-defined clusters, values near 0 suggest overlapping clusters, and negative values imply potential misclassification. The overall silhouette score is computed as the mean of the individual scores across all points. Clusters that consistently emerged across multiple years were defined as major AOIs and used for subsequent deep learning-based image classification.
ResNet-50 for image classification
In the final step, we applied a deep learning approach to analyze the visual content of geotagged social media images within the selected clusters, enabling the examination of spatial and temporal variations in urban landscapes and activities across the pre-, during-, and post-pandemic periods. We employed ResNet-50, a 50-layer deep convolutional neural network based on the residual network (ResNet) architecture, which shortcut (residual) connections to mitigate vanishing gradient issues and improve the stability and accuracy of model training (He et al., 2016a; 2016b). Each input image was resized to 224 × 224 pixels and processed by the ResNet backbone. To perform scene classification, we adopted a transfer learning approach: ResNet-50 pre-trained on ImageNet was further trained on the Places365 dataset to adapt its scene recognition capability to the Places365 categories and improve generalization to the diverse visual contexts present in the Flickr imagery. The original classification head was replaced with a GlobalAveragePooling layer, a dense layer with L2 regularization and ReLU activation, and a final softmax layer with 365 nodes corresponding to the Places365 scene categories. Early stopping was applied based on validation loss. Figure S1 illustrates the overall architecture of the ResNet-50 model used in this study.
Results
Description of the collected Flickr images
A total of 14,875 geotagged images were collected from Flickr after data preprocessing, comprising 4,974, 3,934, 1,203, 966, 1,395, and 2,403 images in 2018–2023, respectively. The number of uploads declined sharply in 2020 and 2021 due to pandemic-related restrictions, followed by a gradual recovery beginning in 2022. Monthly trends in image uploads are illustrated in Figure 3. The number of images peaked in January 2019, followed by April 2018. While monthly data revealed some fluctuations, no consistent seasonal patterns were observed; therefore, subsequent analyses were conducted using annual aggregates to capture broader temporal trends. Number of Flickr images by month.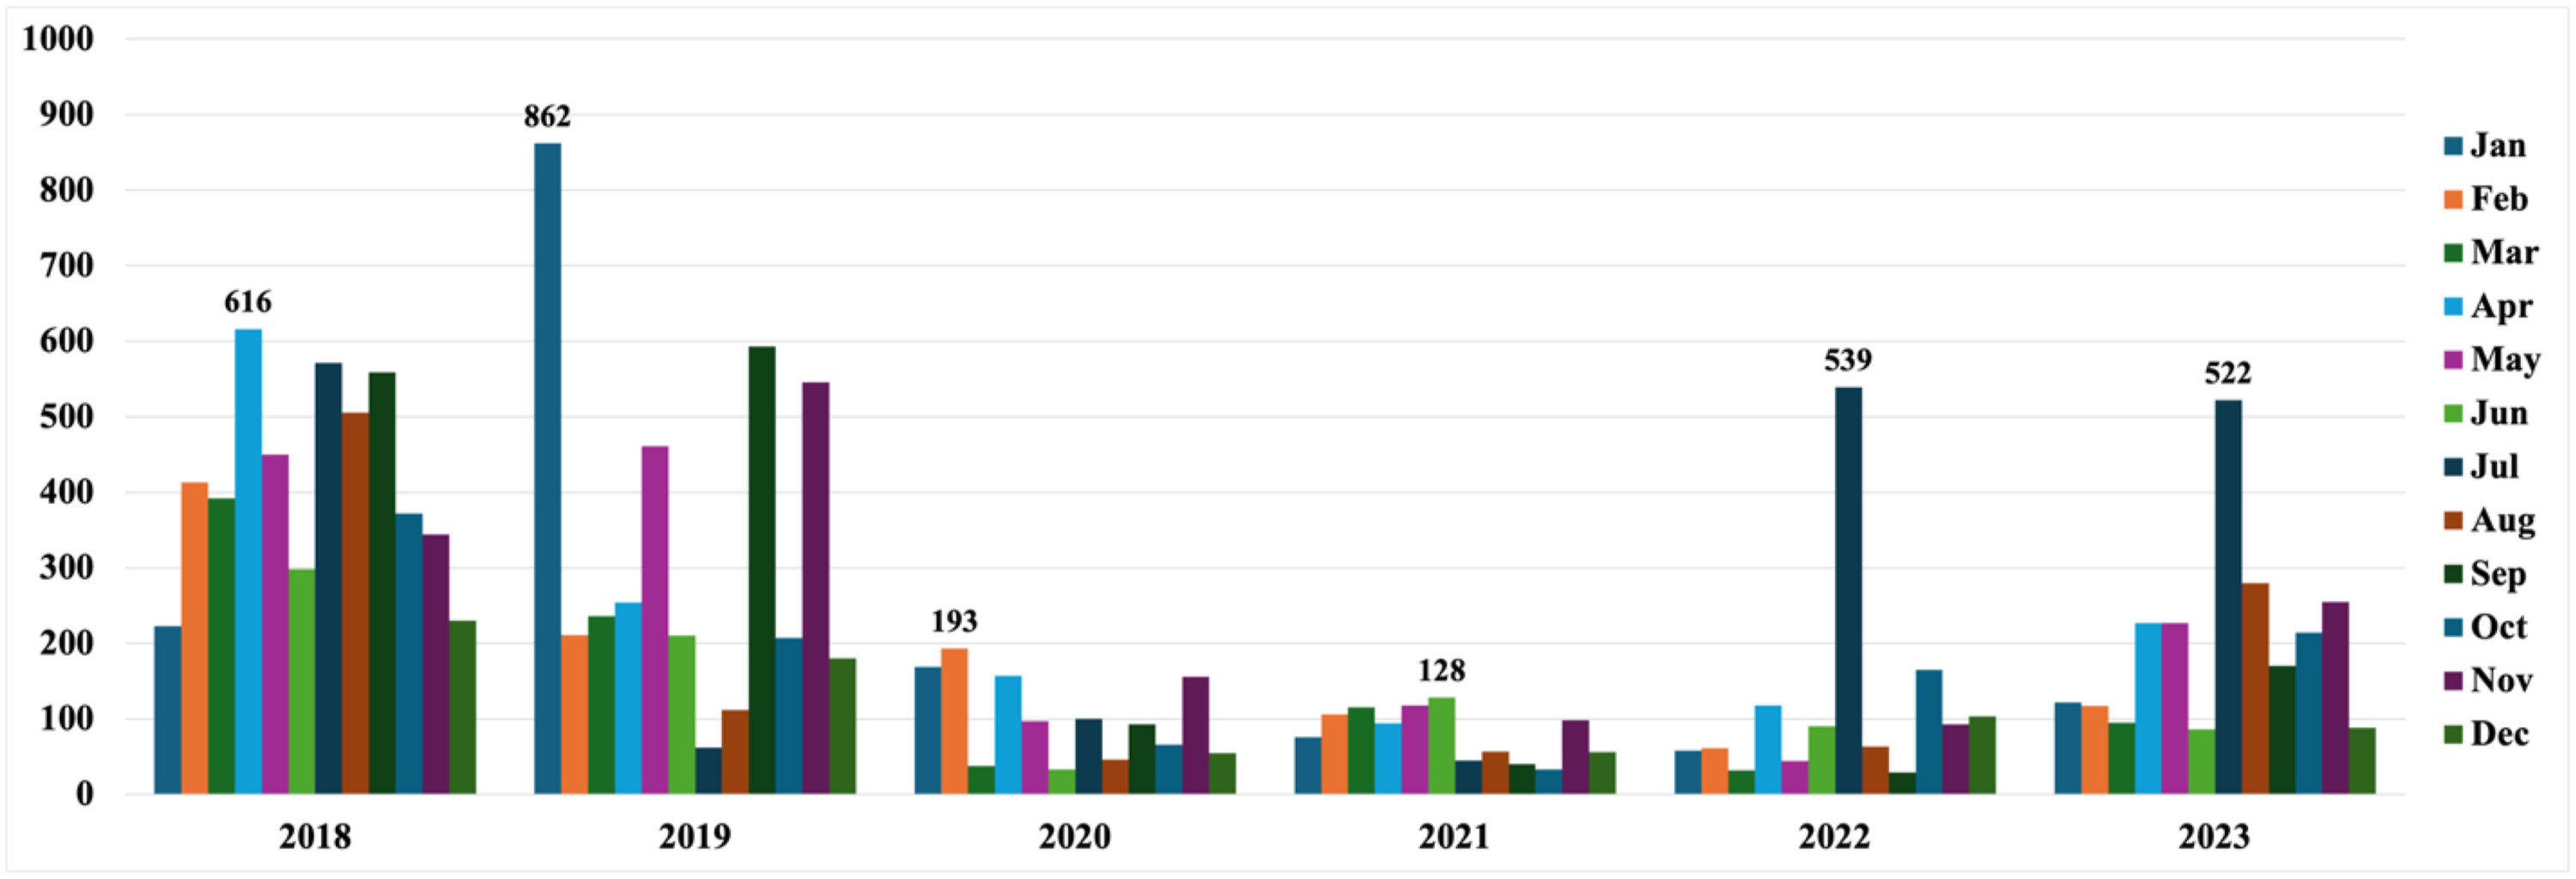
Extracting urban AOIs using HDBSCAN
Summary of HDBSCAN heuristic experiments to determine the appropriate number of clusters.
The clustering results revealed several major AOIs that consistently emerged across multiple years (Figure 4). The most prominent AOI was located in the Jongno-gu/Jung-gu/Yongsan-gu region, collectively forming Seoul’s central business district. In South Korea, gu refers to an administrative district, functionally comparable to a borough or ward in other large metropolitan areas. This central district includes key governmental offices and tourist attractions, such as the five palaces, N Seoul Tower, and the Itaewon Special Tourism Zone. Additional major AOIs were identified in the southeastern region (Gangnam-gu/Songpa-gu) and midwestern area (Mapo-gu/Yeouido). The southeastern AOI contains large companies, luxury shops, and event venues, as well as a major sports complex that regularly hosts sports and cultural events. The Mapo-gu/Yeouido AOI is characterized by a mix of commercial and tourism infrastructure. Mapo-gu is known for its vibrant cultural and entertainment scene, and Yeouido, an island with numerous financial headquarters and shopping complexes, saw the opening of one of Seoul’s largest shopping centers in 2021. AOIs in Seoul identified by HDBSCAN (from 2018 to 2023).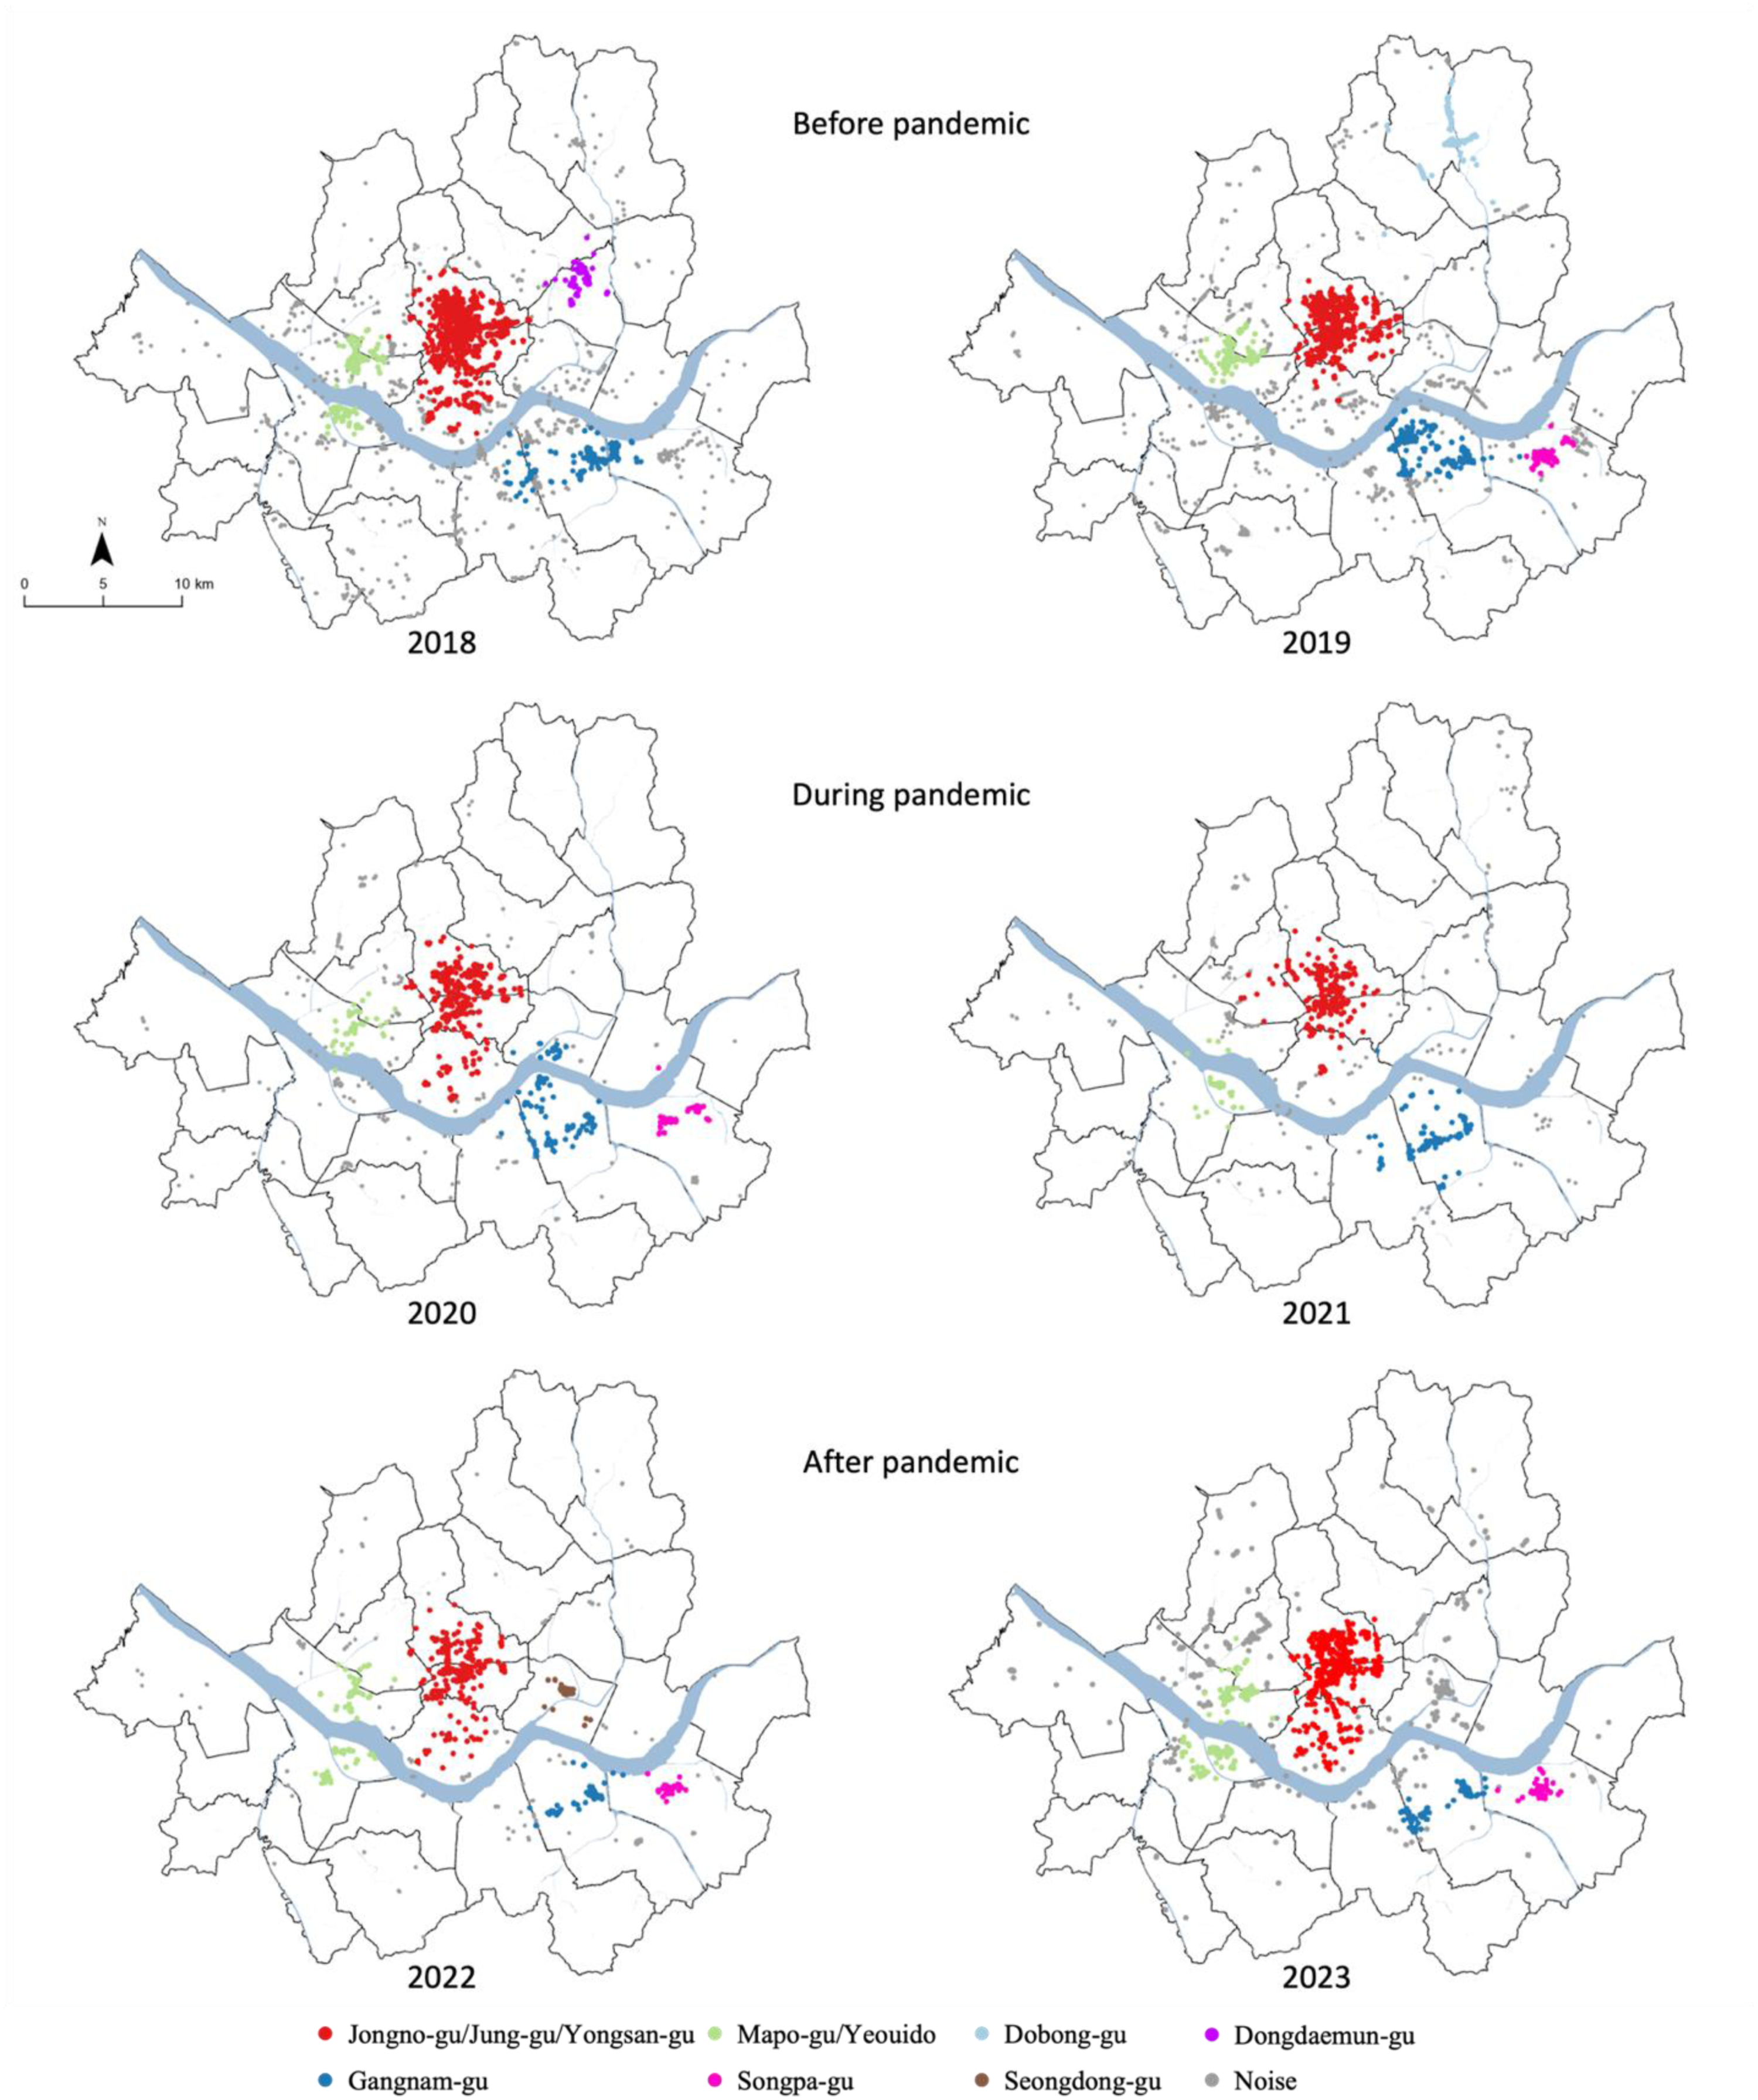
In addition to these persistent cluster, HDBSCAN also detected small clusters that appeared in specific years only, such as Dongdaemun-gu in 2018, Dobong-gu in 2019, and Seongdong-gu in 2022. Based on the frequency of occurrence and their prominence, we selected three representative AOIs for subsequent deep learning-based Flickr image classification: AOI 1—Jongno-gu/Jung-gu/Yongsan-gu, AOI 2—Gangnam-gu/Songpa-gu, and AOI 3—Mapo-gu/Yeouido. The annual distribution of Flickr images across these AOIs is summarized in Table S1.
Visual content analysis to explore urban activity patterns
To examine changes in urban activity across Seoul and within the major AOIs, we classified Flickr images using the ResNet-50 model described in Section 3.4. The model was implemented in Python with TensorFlow and Keras. We first applied the model to the full Flickr dataset covering the entire city, followed by focused analyses of images corresponding to the major AOIs identified in Section 4.2. Training was performed for up to 24 epochs with early stopping. The final model achieved a training accuracy of 86.3% and a validation accuracy of 83.9%, with corresponding categorical cross-entropy loss values of 1.91 and 2.43, respectively.
Figure 5 summarizes the annual proportions of the top eight scene categories regardless of the major AOIs. These categories were selected for visualization because the top eight categories account for approximately 70–85% of all classified images each year. Focusing on these dominant categories provides a clear yet representative picture of how urban activity patterns evolved. In 2018–2019, the distribution was dominant by urban commercial and social categories such as “street,” “shopping mall,” and “coffee shop,” reflecting the vibrancy of everyday routines before the pandemic. Cultural and leisure-related categories, including “plaza” and “temple,” were also visible, consistent with dense patterns of central-city tourism and recreation. With the onset of COVID-19, indoor-oriented categories nearly disappeared, while outdoor scenes such as “park,” “skyscraper,” and “forest path” became more prominent, mirroring restrictions on indoor gatherings and the public’s shift toward open-air environments. Notably, some categories that had been dominant before the pandemic, such as “shopping mall” and “coffee shop,” dropped outside the top eight during 2020–2021 (ranked 11 and 14, respectively), before reappearing in later years. The overall contraction in total images during this period further underscores the decline in urban activity. By 2022–2023, the composition diversified once again. Outdoor categories such as “park” and “street” remained important, but indoor-oriented categories, including “shopping mall,” “coffee shop,” and “museum indoor,” reappeared, indicating a gradual rebalancing of urban activity in the post-pandemic recovery phase. These results highlight not only a quantitative rebound in activity but also a qualitative broadening, as people re-engaged with a wider spectrum of urban spaces ranging from retail and workplaces to cultural and leisure destinations. Yearly changes in category composition across Seoul (from 2018 to 2023).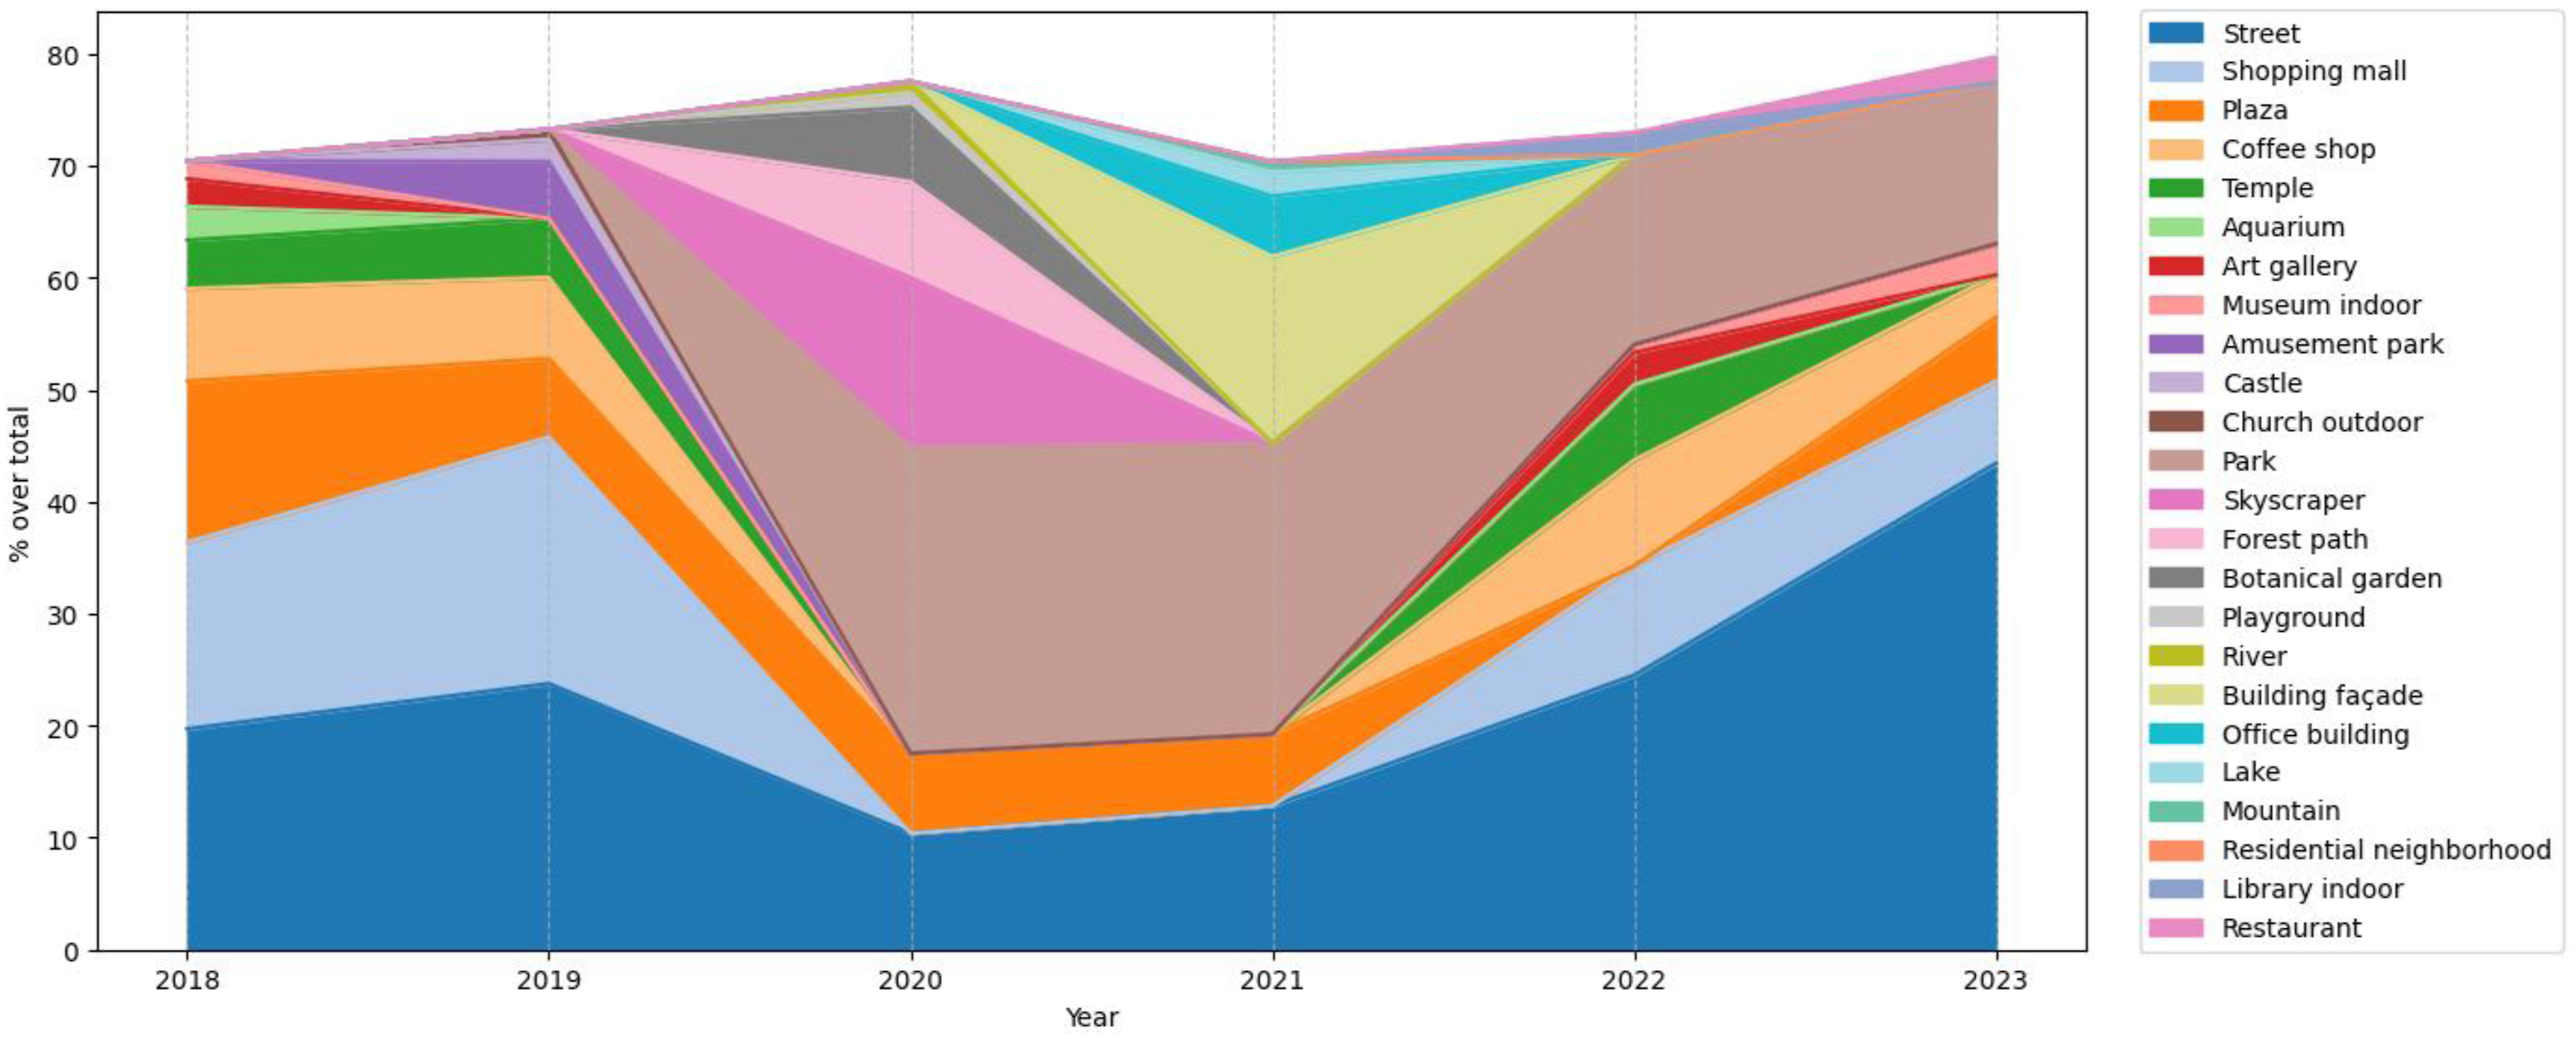
Figure 6 illustrates classification trends across the three major AOIs identified by HDBSCAN. Unlike the citywide results, these AOI-specific patterns reveal how local urban functions shaped different responses to the pandemic. In AOI 1 (Jongno-gu/Jung-gu/Yongsan-gu), cultural and historical categories such as “plaza” and “temple” were dominant in 2018–2019, highlighting the district’s role as Seoul’s cultural and administrative core. With the onset of the pandemic, indoor-oriented categories largely disappeared, while outdoor-related categories such as “park,” “river,” and “residential neighborhood” became more prominent. By 2022–2023, a partial rebound occurred: “temple” and “art gallery” re-emerged, alongside “shopping mall” and “library indoor,” indicating renewed engagement with both cultural heritage and commercial spaces. In AOI 2 (Gangnam-gu/Songpa-gu), the pre-pandemic years emphasized commercial activity, with “shopping mall,” “skyscraper,” and “restaurant” accounting for a large share of images. These categories nearly vanished in 2020–2021, when outdoor substitutes such as “park” and “office building” briefly gained prominence. During this period, categories like “shopping mall” fell outside the top five (ranked 7 in 2020 and 11 in 2021), underscoring the depth of contraction in consumer-oriented activity. The post-pandemic phase showed a recovery of commercial categories, including “shopping mall,” “restaurant,” and “hotel outdoor,” suggesting that consumer and leisure activities in this business-oriented district quickly rebounded once restrictions eased. AOI 3 (Mapo-gu/Yeouido) displayed a distinct trajectory. Pre-pandemic years highlighted “park,” “plaza,” and cultural venues such as “art gallery” and “music studio.” Activity contracted sharply in 2020, but “park” remained consistently represented, reflecting the area’s role as an accessible outdoor and leisure space. By 2023, the share of “office building” scenes increased markedly, signaling the restoration of workplace functions, while “park” and “plaza” continued to provide recreational balance. Yearly changes in category composition by AOI (from 2018 to 2023).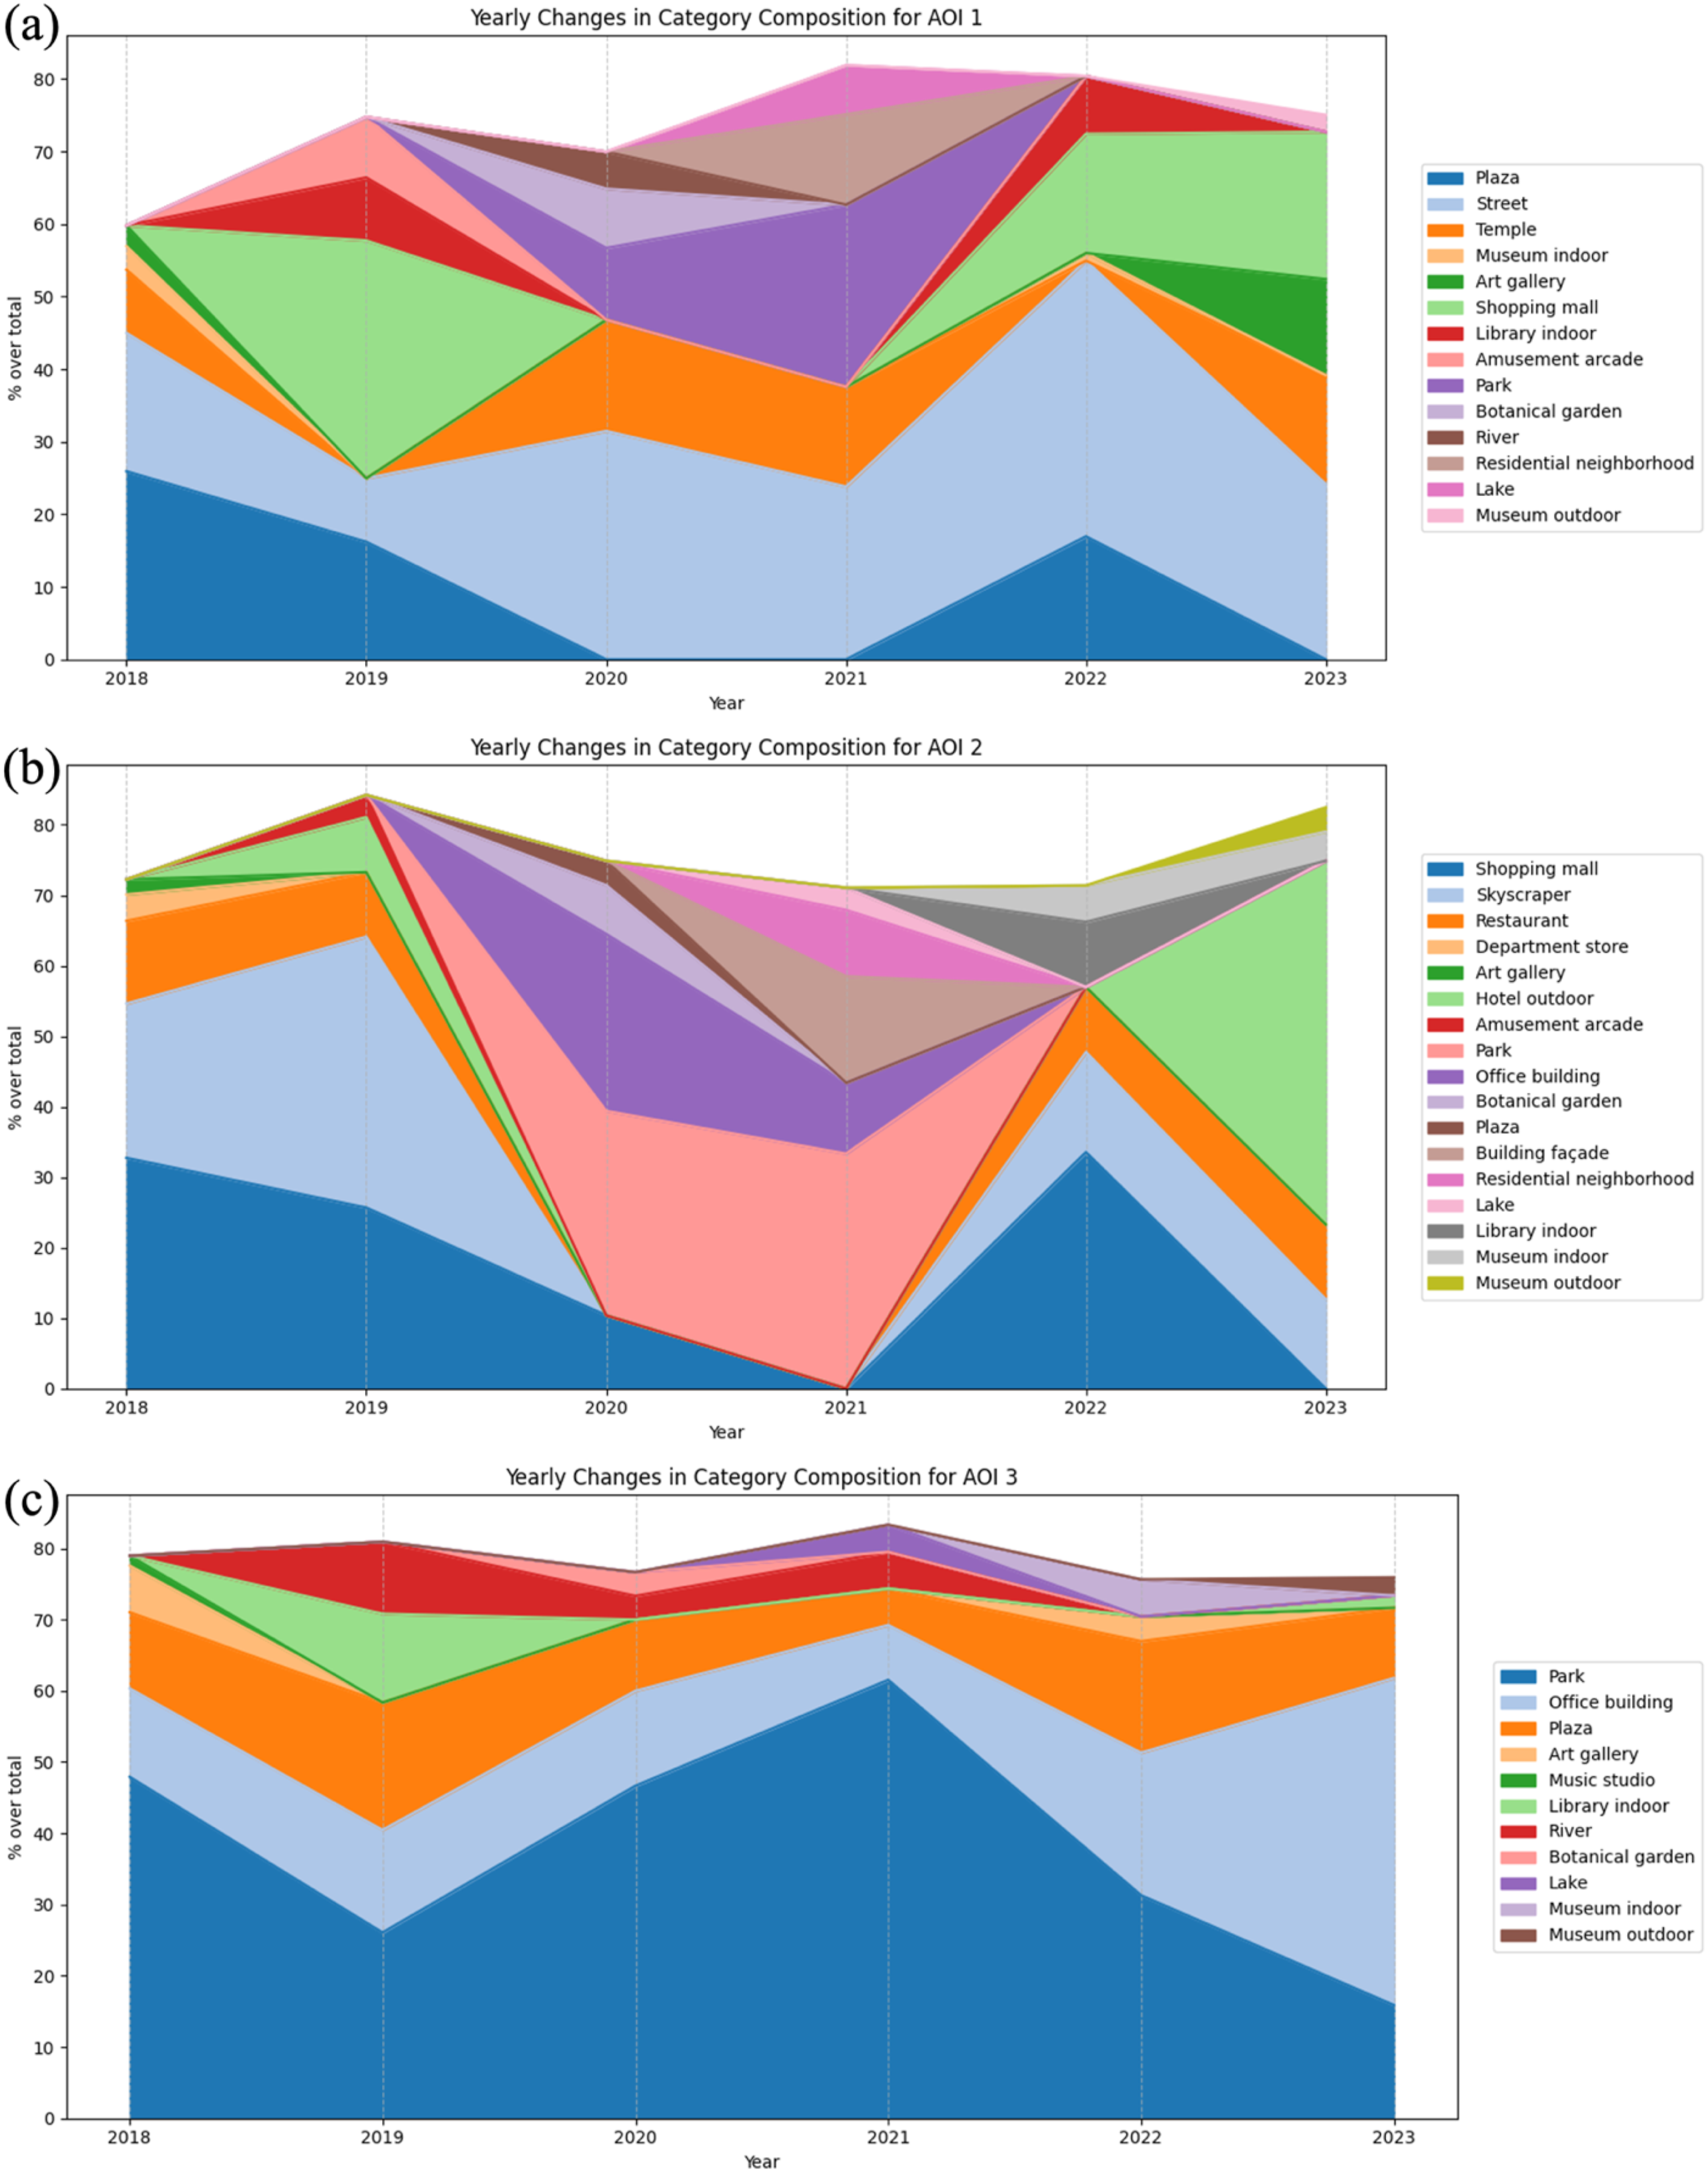
Overall, these AOI-level results highlight how the pandemic not only reduced activity volumes but also reconfigured the balance between cultural, commercial, and outdoor categories in ways closely tied to the functional character of each district. Across all AOIs, indoor-oriented categories contracted sharply during 2020–2021, while outdoor categories such as “park” and “plaza” temporarily gained prominence, reflecting a citywide shift toward open-air environments. Notable differences also emerged: AOI 1 retained its cultural and historical orientation, AOI 2 exhibited the strongest rebound of commercial activities, and AOI 3 consistently balanced outdoor leisure with workplace functions. Taken together, these findings underscore both the shared disruptions and the place-specific pathways of urban activity adaptation in Seoul. Finally, Figure 7 illustrates the representative Flickr photographs of each major AOI. Representative Flickr images of three major AOIs.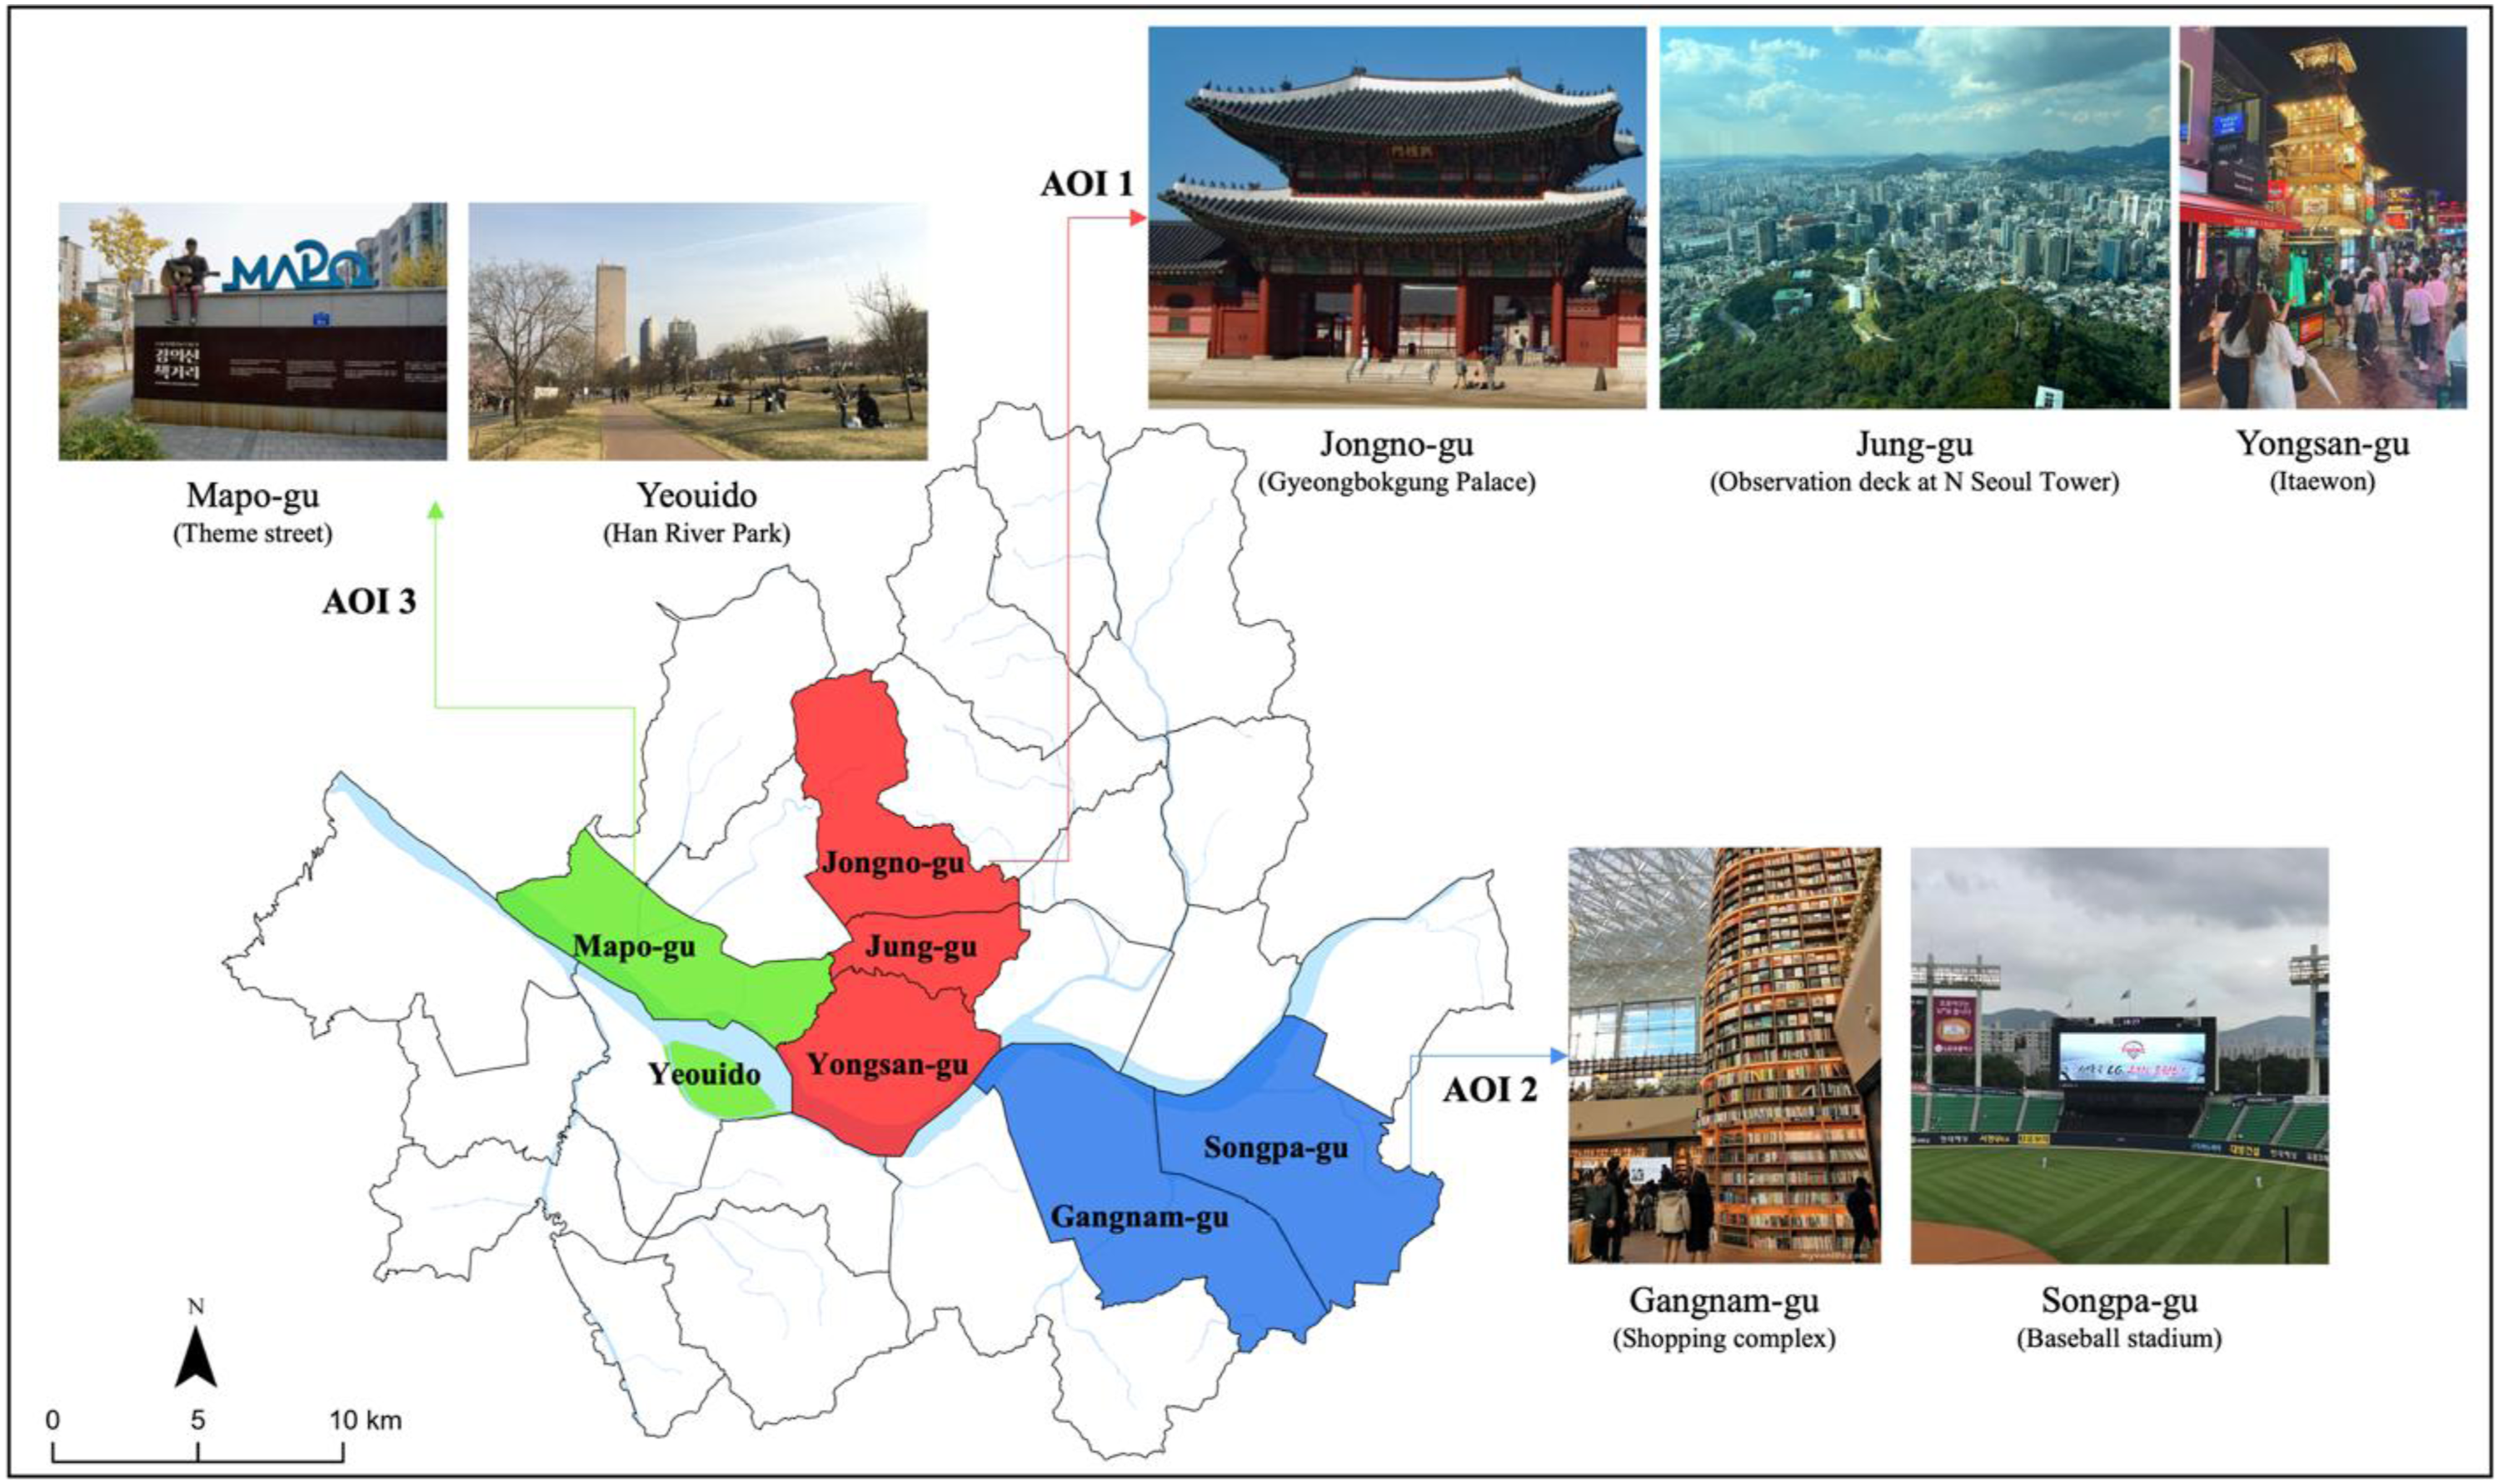
Discussion
This study aimed to clarify (1) how urban activity shaped by individuals’ behavioral responses to pandemic-induced disruptions evolved across the pre-, during-, and post-pandemic periods; (2) whether geotagged social media imagery can serve as a bottom-up, near real-time indicator of spatial behavior and adaptation during large-scale disruptions; and (3) how GeoAI techniques can be employed to detect, classify, and interpret dynamic shifts in urban activity. First, the 6-year longitudinal analysis revealed sharp contractions in indoor-oriented activities during 2020–2021, followed by a diversified recovery that balanced indoor and outdoor scenes in 2022–2023. Second, the use of Flickr imagery captured not only overall declines but also semantic reconfigurations of activity, such as the substitution of indoor with outdoor categories that traditional datasets cannot reveal. Third, by integrating HDBSCAN clustering with ResNet-50 scene classification, the study demonstrated how GeoAI methods can be systematically integrated with behavioral frameworks to yield interpretable insights into spatial adaptation, thereby advancing our understanding of the spatial foundations of resilience.
While the citywide analysis highlighted broad shifts, the AOI-level findings revealed how functional characteristics shaped distinct adaptation pathways. AOI 1, as the cultural and administrative core, retained heritage-oriented activities even under disruption, while AOI 2, centered on commerce, experienced the most dramatic contraction but rebounded rapidly. AOI 3, combining leisure and work, maintained outdoor activity and later restored workplace functions. These differentiated trajectories align with prior studies documenting general reductions in mobility and a shift toward outdoor spaces (Heiler et al., 2020; Zhang et al., 2023), yet they extend this literature by uncovering place-specific responses that aggregated mobility indices or administrative datasets cannot capture (Bai et al., 2023; Gao et al., 2021; Habib and Anik, 2023). Moreover, whereas earlier social media research has typically remained descriptive and short-term (Pasquinelli et al., 2022; Prayag et al., 2024), our 6-year analysis demonstrates how semantic scene-level changes unfolded over the full pandemic cycle, thereby providing a more comprehensive account of behavioral adaptation grounded in urban functionality rather than aggregate mobility trends.
Interpreted through the lens of the SOR framework, these results illustrate how an external shock triggered perceptual and behavioral adjustments. The pandemic heightened perceptions of risk, prompting individuals to reorganize their activities by substituting indoor gatherings with outdoor alternatives, as evident in the rise of categories such as “park” and “plaza” during 2020–2021, coupled with the disappearance of indoor-oriented categories like “shopping mall” and “coffee shop.” The gradual reemergence of indoor scenes after 2022 illustrates the resilience cycle, in which disrupted practices evolve toward recovery and renewal. By empirically linking this spatial reorganization to the SOR process—stimulus, perception, and behavioral response—the study moves beyond observation to demonstrate how perceived environmental risk translated into measurable urban activity patterns. This integration offers new insight into how risk perception and spatial constraints jointly mediated the rebalancing of urban activities during and after the pandemic.
Beyond theoretical contributions, these findings carry practical implications for urban planning and management. The citywide rise of outdoor activity categories during the pandemic underscores the importance of resilient public spaces that can accommodate safe social interaction under crisis conditions. Parks, plazas, and riverfront areas served as critical substitutes for restricted indoor venues, suggesting that investments in accessible open spaces are central to urban preparedness (Kamil and Tuma, 2025). Additionally, the rapid rebound of commercial activity in AOI 2 highlights the economic vulnerability of consumption-oriented districts and the need for contingency strategies that support retail and leisure economies during disruptions (Mohsin et al., 2021). In AOI 1, the persistence of cultural and administrative functions suggests that safeguarding heritage sites and institutional services is essential for maintaining urban continuity. AOI 3’s balanced recovery, combining outdoor leisure with workplace restoration, illustrates the value of multifunctional districts that can adapt flexibly to shifting demands. Taken together, these patterns indicate that social media and GeoAI-based monitoring can provide timely, bottom-up insights to guide spatial interventions, helping cities design adaptive environments that sustain both daily life and resilience in the face of future shocks.
Despite its contributions, this study has several limitations that suggest directions for future research. First, Flickr users do not represent the entire population of Seoul and are often skewed toward tourists and digitally active residents, potentially underrepresenting certain demographic groups such as older adults or individuals with limited online engagement. Nevertheless, the obtained dataset provides a consistent record of urban activity, serving as a useful proxy for analyzing relative behavioral changes. Incorporating additional demographic data—such as age, gender, or mobility intent—would provide a more comprehensive perspective on urban activity. Second, the study employed established GeoAI techniques—HDBSCAN clustering and ResNet-50 classification. The contribution, however, lies in demonstrating how these tools can be integrated within a behavioral framework to empirically operationalize the SOR model. Third, while scene classification using ResNet and Places365 enabled semantic analysis of urban imagery, potential misclassifications remain, particularly in ambiguous or culturally specific urban contexts. Future work could benefit from fine-tuned models or multimodal approaches that jointly analyze image and textual metadata, and this approach to other cities to test cultural generalizability.
Overall, this study demonstrates the potential of combining social media imagery with GeoAI techniques to capture and interpret long-term shifts in urban activity across different phases of disruption. By situating the results within behavioral frameworks such as the SOR framework, the analysis highlights how risk perceptions and spatial constraints shaped the reorganization of everyday practices. These insights underscore the utility of user-generated content for revealing place-specific pathways of adaptation and suggest that data-driven approaches can inform more resilient and adaptive urban planning strategies in the face of shocks.
Conclusions
This study examined how urban activity in Seoul evolved across the pre-, during-, and post-pandemic phases by integrating geotagged Flickr imagery with GeoAI-based scene classification. Using HDBSCAN to identify AOIs and ResNet-50 to analyze semantic activity patterns, we revealed both citywide and district-specific adaptations to pandemic-induced disruptions. The findings demonstrate sharp contractions of indoor activity and a substitution toward outdoor environments during 2020–2021, followed by a gradual rebalancing of cultural, commercial, and workplace functions in the recovery phase. Interpreted through the lens of the SOR framework, these shifts illustrate how risk perception and spatial constraints shaped behavioral responses, with variations reflecting the functional character of each district. Beyond advancing empirical evidence on pandemic impacts, the study underscores the value of user-generated content and GeoAI as bottom-up, near real-time tools for operationalizing behavioral theories and informing adaptive urban planning. While limitations remain in terms of data representativeness and model specificity, the approach highlights promising avenues for future research to enhance the robustness and generalizability of insights into urban resilience under large-scale disruptions.
Supplemental Material
Supplemental material—GeoAI-driven analysis of urban activity shifts using geotagged social media data across the COVID-19 pandemic
Supplemental material for GeoAI-driven analysis of urban activity shifts using geotagged social media data across the COVID-19 pandemic by Yunsik Kim and Byungyun Yang in Environment and Planning B: Urban Analytics and City Science.
Footnotes
Funding
The authors disclosed receipt of the following financial support for the research, authorship, and/or 26 Sage UK House Style publication of this article: Ministry of Education of the Republic of Korea and the National Research Foundation of Korea; NRF-2023S1A5A2A01082853
Declaration of conflicting interests
The authors declared no potential conflicts of interest with respect to the research, authorship, and/or publication of this article.
Data Availability Statement
Data sharing not applicable to this article as no datasets were generated or analyzed during the current study.
Supplemental material
Supplemental material for this article is available online.
Author biographies
References
Supplementary Material
Please find the following supplemental material available below.
For Open Access articles published under a Creative Commons License, all supplemental material carries the same license as the article it is associated with.
For non-Open Access articles published, all supplemental material carries a non-exclusive license, and permission requests for re-use of supplemental material or any part of supplemental material shall be sent directly to the copyright owner as specified in the copyright notice associated with the article.