
Abstract
The built environment is critical in fostering vibrant cities, and evaluating urban vitality (UV) and its interplay with the built environment is essential for building people-oriented cities. Most existing studies have overlooked the nonlinear relationship, threshold effects, and spatial heterogeneity of the built environment on UV. Taking the Xi’an central urban area as a case study, this study constructs a block-scale UV evaluation index system and a built environment indicator system based on multi-source data. Then, the nonlinear effects of built environment factors on UV are explored via the Geographically Weighted Random Forest (GWRF) and SHapley Additive exPlanations (SHAP) models. The findings show that the spatial distribution of UV exhibits a core-periphery structure and transportation dependence characteristics. Among various built environment factors, floor area ratio (FAR) and mixed land use (MLU) are identified as key drivers. UV exhibits an S-shaped curve with FAR and diminishing returns with MLU. Spatial heterogeneity indicates that the polycentric UV spatial pattern as a pivotal model for improving urban quality and efficiency stage. This study provides empirical foundations for the refined governance and high-quality development of UV.
Introduction
As urban spatial development shifts from outward expansion to inward-focused renewal, enhancing UV has become a critical strategy for improving land-use efficiency and easing human-land conflicts (Barreca and Curto, 2020; Niu et al., 2019). However, rapid urban expansion has led to spatial agglomeration and functional differentiation of UV, marked by high-intensity activity in core areas and vitality deficiencies in peripheral zones (Chen et al., 2023; Jin et al., 2024). This imbalance intensifies urban problems such as job-housing mismatch, traffic congestion, and inefficient allocation of public resources, thereby weakening overall urban system performance (Doan et al., 2025). As a result, identifying the spatial configurations and formation mechanisms of UV has become an important research topic in contemporary urban studies.
The measurement of UV has gradually shifted from an emphasis on integrating sociological and architectural perspectives (Sinkienė et al., 2017) to an analytical focus on the interaction between diverse residential activities and complex urban environments (Li et al., 2022; Lyu et al., 2025; Osunkoya and Partanen, 2024; Shi et al., 2019). Economic, social, and cultural vitality collectively represent the magnitude, intensity, and spatial configuration of human activities, and research structured around these dimensions has become the dominant framework in UV studies (Boessen et al., 2018; Xia et al., 2020). Nevertheless, existing studies mainly concentrate on single-dimensional evaluations, with vitality meanings across dimensions insufficiently integrated, which limits the explanatory capacity of UV assessments (Ha and Kim, 2025; Wang et al., 2022).
UV research traces back to Jane Jacobs’ urban diversity theory, which highlights the crucial role of the built environment in shaping vitality (Sinkienė et al., 2017). Most existing studies rely on linear models to explore the influence of the built environment on UV (Alonso De Andrade et al., 2018; Ha and Kim, 2025; Mouratidis and Poortinga, 2020), even though the built environment shows evident nonlinear characteristics at the block scale (Doan et al., 2025; Xu et al., 2024). Ignoring such nonlinearity may result in less effective planning policies. Therefore, revealing nonlinear UV–built environment relationships and related thresholds is essential for precise UV regulation and spatial efficiency improvement.
Urban spatial growth has shifted from rapid expansion to a more refined, intensive development, making enhancing UV through the built environment increasingly vital (Jiang et al., 2022). However, existing research still lacks a systematic measurement framework that integrates multidimensional vitality and explains nonlinear UV–built environment relationships at the block scale, which restricts support for refined urban governance. So, the research is guided by two questions: (1) How can UV be quantitatively assessed at the block scale? and (2) What are the nonlinear relationships, threshold effects, and spatial heterogeneity of built environment factors on UV? By addressing these questions, this study adopts the central urban area of Xi’an as study area and constructs a research framework (Appendix A). By integrating social, economic, and cultural dimensions, a multidimensional UV evaluation system is developed to systematically measure and analyze the spatial distribution of UV using multi-source geographic big data. Then, based on the “5D” built environment framework, a GWRF-SHAP model is applied to investigate the nonlinear impact mechanisms of built environment variables on UV.
The remainder of this paper is organized as follows: Section “Literature review” provides the literature review. Section “Study area, data, and methods” presents the study area, data sources, and methods. Section “Results” analyzes the spatial distribution of UV and identifies its key factors. Section “Discussion” explores the underlying mechanisms, effects of the built environment, planning strategies. Finally, Section “Conclusion” outlines the principal conclusions, and innovations and limitations.
Literature review
UV measurement is gradually shifting from traditional data sources toward multi-source data-driven approaches (Li et al., 2022; Lyu et al., 2025; Osunkoya and Partanen, 2024; Shi et al., 2019). In the initial stages, limitations in data availability and collection methods impeded the accuracy and objectivity of UV assessments (Delclòs-Alió and Miralles-Guasch, 2018).
In recent years, big data, characterized by high spatiotemporal resolution, low acquisition cost, and broad coverage (Kim, 2025), has substantially strengthened the ability to analyze UV spatial pattern (Delclòs-Alió et al., 2019; Wu et al., 2018a). UV is a multidimensional expression of human-environment interaction, reflecting the spatial dynamics of economic, social, and cultural factors (Li et al., 2022; Lyu et al., 2025; Osunkoya and Partanen, 2024; Shi et al., 2019; Sinkienė et al., 2017). Within this framework, economic vitality serves as the foundation, social vitality constitutes the core, and cultural vitality shapes the quality (Sinkienė et al., 2017). Accordingly, based on multi-source geographic big data, many studies have measured UV using single-dimensional economic, social, or cultural perspectives. Economic vitality refers to a city’s economic capacity and development level, reflected in the intensity of economic activities, and is commonly measured using nighttime light imagery and business data (Lyu et al., 2025; Wu et al., 2023; Xia et al., 2020). Social vitality indicates the capacity for urban social interaction and activity, manifested through the spatiotemporal gathering and movement of people, and is often measured using mobile signaling data, social media analytics, and Baidu heat maps (Chen et al., 2019, 2023; Doan et al., 2025; Ha and Kim, 2025; Wang et al., 2022). Cultural vitality reflects the vibrancy of urban cultural life, emphasizing public engagement in cultural activities through cultural facilities, and is evaluated based on the distribution of cultural POIs and cultural participation metrics (Kim, 2020; Montalto et al., 2019; Ta et al., 2020). These works identified central concentration and peripheral gradient decline in cities (Chen et al., 2023; Ling et al., 2024; Ta et al., 2020), along with polycentric vitality patterns (Chen et al., 2019; Doan et al., 2025; Wang et al., 2022), highlighting that vitality polycentricity plays an important role in improving urban operational efficiency (Chen et al., 2023; Ha and Kim, 2025; Wang et al., 2022).
Given the breadth and complexity of the concept of UV (Li et al., 2022), recent research has increasingly adopted multidimensional methods for in-depth analysis, aiming to comprehensively reveal the spatial distribution and interaction patterns of human activities (Della Spina, 2019; Dogan and Lee, 2024; Jin et al., 2024). However, consensus is still lacking on indicator system construction for multidimensional UV measurement and the effective use of multi-source big data (Della Spina, 2019; Dogan and Lee, 2024; Jin et al., 2024; Wu et al., 2025). At the block scale in particular, a quantitative framework integrating economic, social, and cultural vitality dimensions remains absent (Zumelzu and Barrientos, 2019). This makes it difficult to identify block-scale vitality characteristics and their intrinsic links with built environment.
The built environment profoundly influences the spatial distribution of UV (Zhang et al., 2023). Scholars have consistently underscored the significance of built environment attributes such as development intensity (Wu et al., 2018b), traffic capacity (Niu et al., 2019), MLU (Zhang et al., 2021), and green coverage (Wang et al., 2022) in structuring patterns of UV, and have analyzed the impact of built environment factors on UV (Wu et al., 2018b, 2023). Higher-intensity development patterns (Alonso De Andrade et al., 2018), convenient transportation accessibility (Mouratidis and Poortinga, 2020), and land-use diversity (Ha and Kim, 2025) have been recognized as foundational spatial conditions for fostering vibrant urban environments. Although prior research on urban texture, urban form (Zumelzu and Barrientos, 2019), and spatial structure (Liu and Shi, 2022; Wu et al., 2023) and traffic accessibility (Mouratidis and Poortinga, 2020) has offered valuable insights into how individual built environment factors influence UV, there is a lack of the capacity to reveal the complex, interactive effects among multiple variables that jointly shape vitality outcomes. Despite the direct impact of block-scale features on residents’ everyday experiences and their close association with UV, empirical studies at this finer spatial scale remain scarce (Delclòs-Alió et al., 2019; Wu et al., 2018a).
Furthermore, the research methods for quantifying the impact of the built environment on UV require further refinement. Traditional approaches, including ordinary least squares, multiple linear regression, and geographically weighted regression, have been widely employed to examine the relationships between UV and built environment factors (Jiang et al., 2022; Lu et al., 2019; Lyu et al., 2025; Ta et al., 2020), helping to clarify spatial effects and scale sensitivities (Lyu et al., 2025; Mouratidis and Poortinga, 2020). However, at the micro-scale, these relationships tend to be highly nonlinear (Doan et al., 2025; Xu et al., 2024). Due to traditional methods’ neglect of nonlinear relationships, threshold effects, and spatial heterogeneity (Lyu et al., 2025; Pan et al., 2025; Xu et al., 2024; Zhan et al., 2025), accurately capturing this complexity remains challenging (Ling et al., 2024). In contrast, machine learning methods, particularly algorithms like random forests and SHAP, offer strong capabilities in analyzing nonlinear relationships (Doan et al., 2025; Zhan et al., 2025). Therefore, it is necessary to establish a multidimensional UV evaluation framework at the block scale and to solve the problem of how and where to optimize the building environment using explainable machine learning approaches (Dogan and Lee, 2024; Lee and Cho, 2025).
Study area, data, and methods
Study area
Xi’an as the economic, social, and cultural center of the Guanzhong urban agglomeration and Northwest China, and has been designated as China’s ninth national central city. During the early stage of reform and opening up in 1978, urban development was concentrated in Zone I, forming a monocentric pattern centered on Ming and Qing historical city. Since 2000, incremental expansion has driven rapid urbanization in Zones II and III, with the built-up area increasing from 187 km2 in 2000 to 810 km2 in 2023 (Figure 1). However, this rapid expansion has resulted in inefficient land use, declining spatial quality, and escalating tension in human-environment relationships. As Xi’an has transitioned from incremental expansion to urban renewal, the functional restructuring of land uses has accelerated. Currently, urban development is at a critical stage of transitioning from large-scale incremental expansion to improving the quality and efficiency of existing resources. In this context, optimizing the built environment and stimulating vitality have emerged as critical strategies for advancing urban regeneration. To this end, this study focuses on the Xi’an central urban area. Using road network data and satellite remote sensing imagery, the study area was partitioned into 1251 analytical blocks, with boundaries defined by spatial separation elements such as highways, urban expressways, primary roads, secondary roads, and rivers. The urban spatial structure and ring roads in Xi’an can be roughly divided into four geographic units: Zone I (Historical core area), Zone II (Commercial area), Zone III (Transitional area), and Zone IV (Peripheral area). The research area.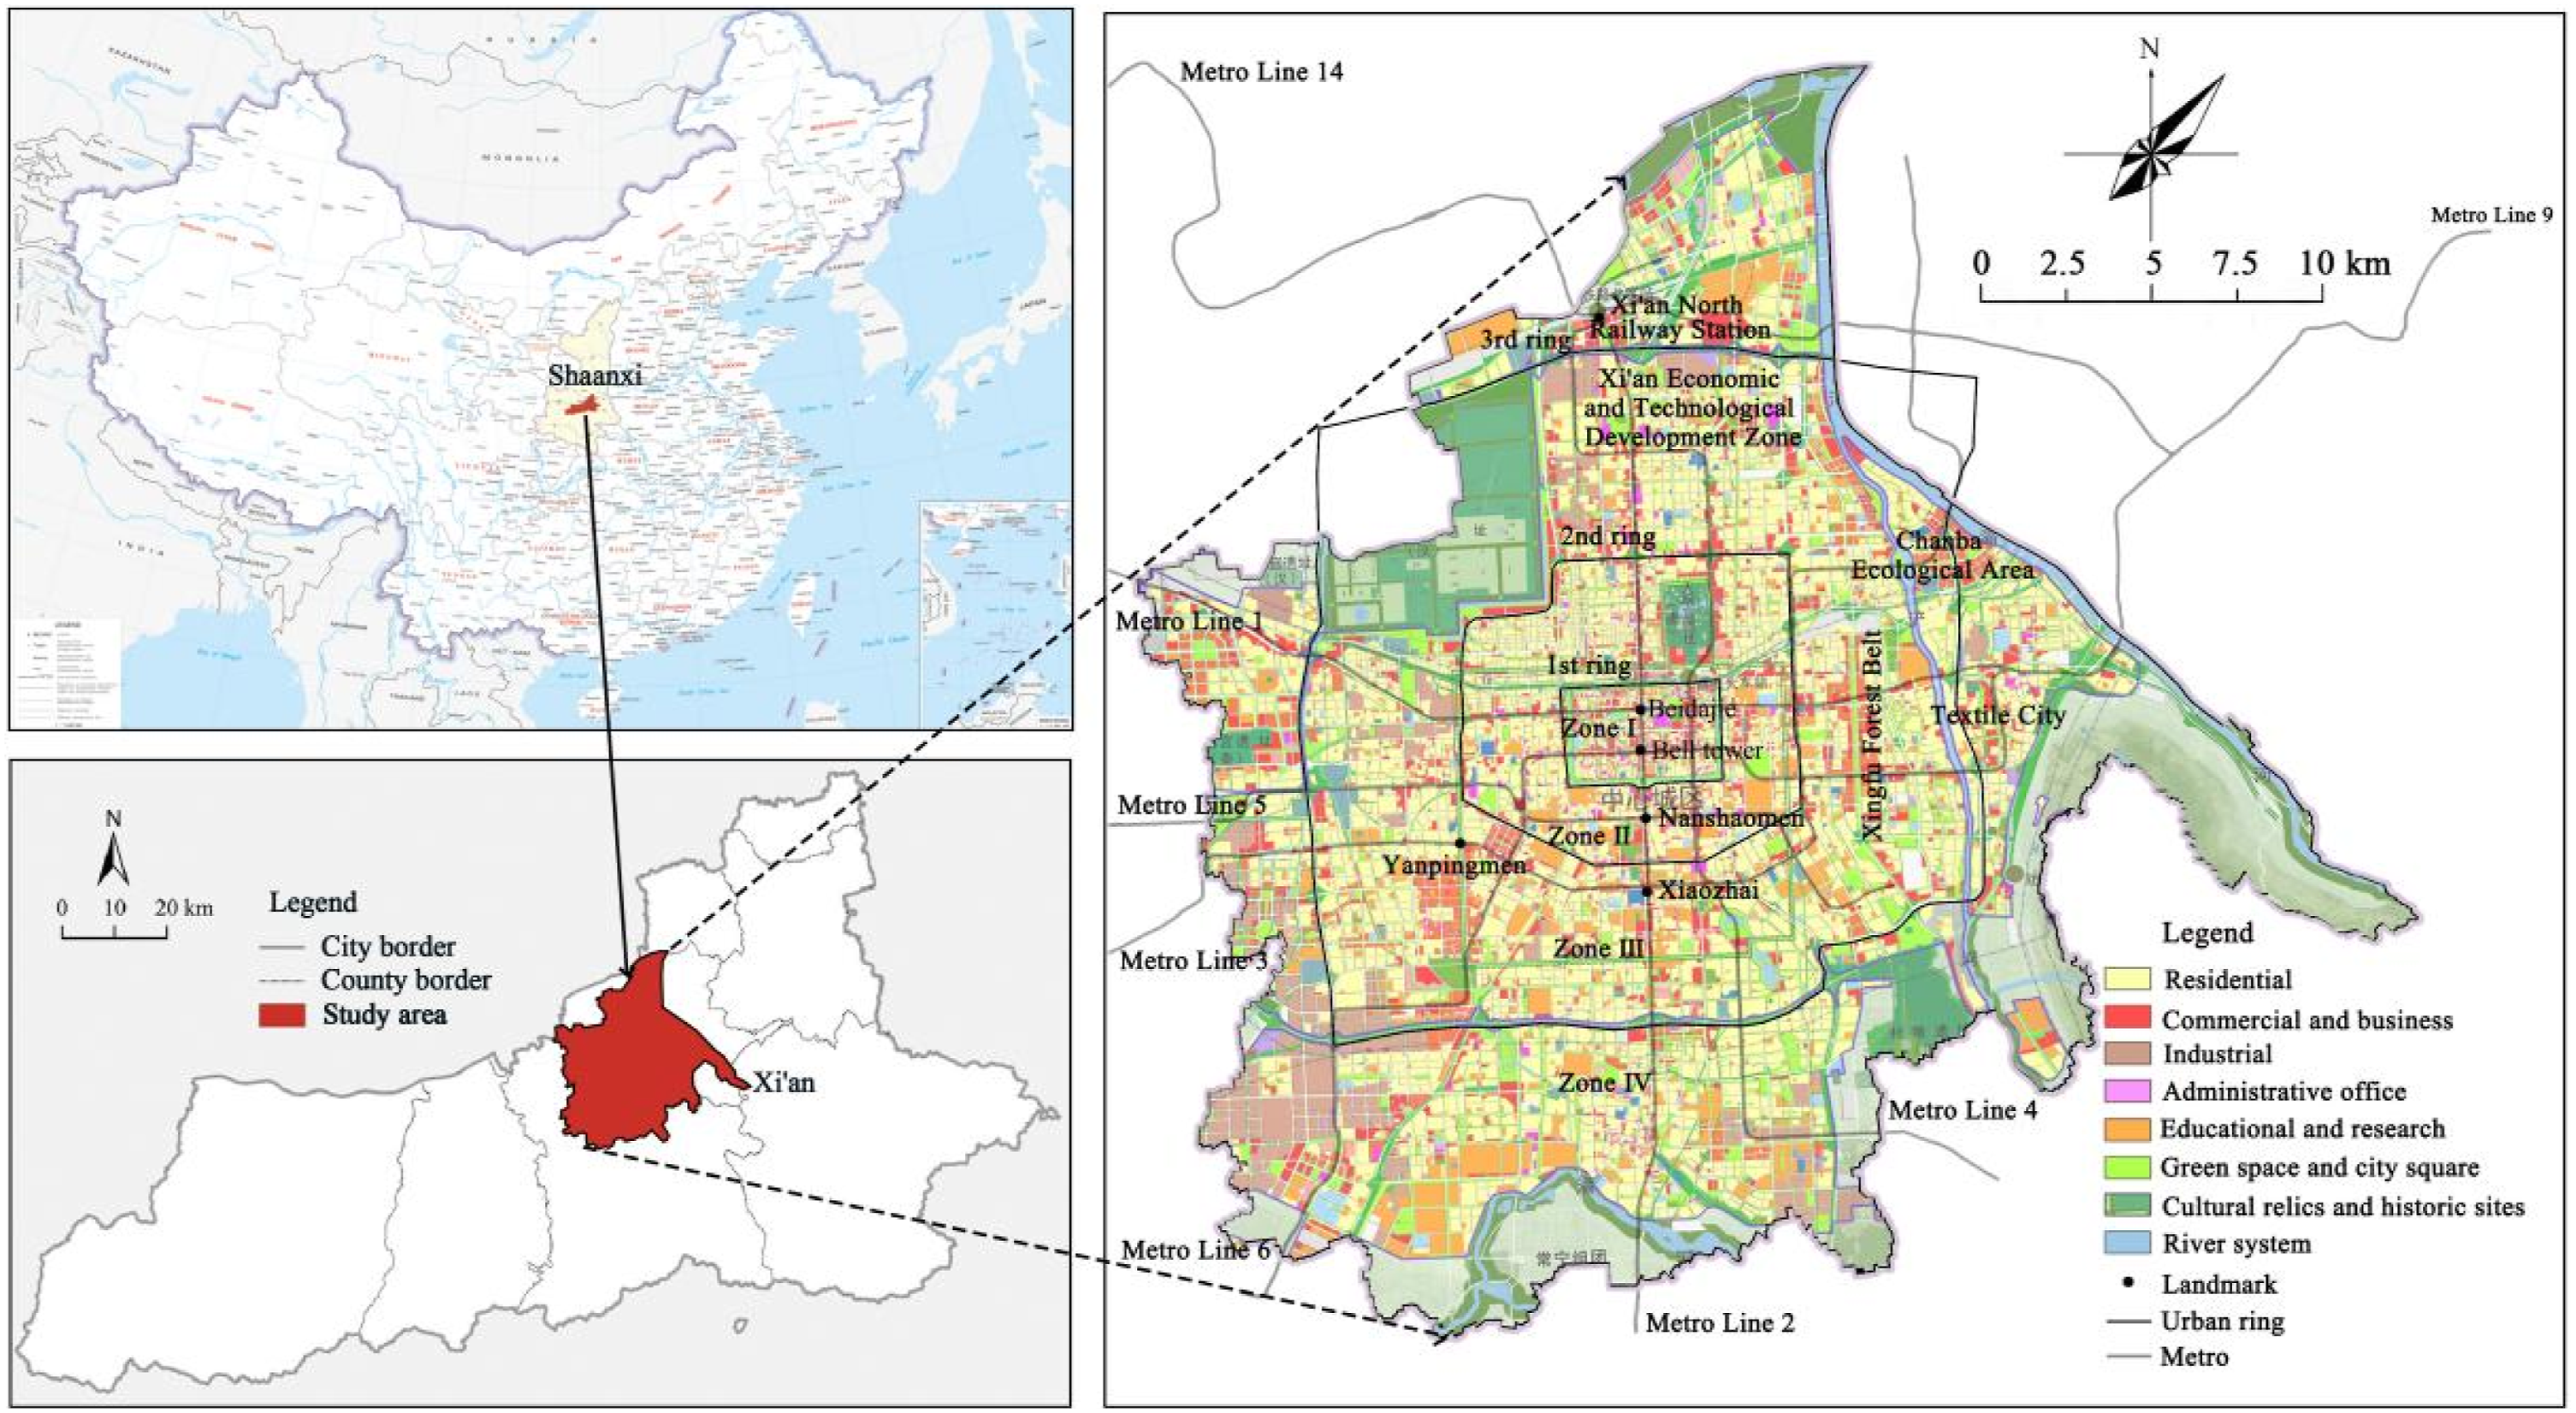
Data
The research data include Baidu heatmap, nighttime light imagery, POI, buildings, road network, planning documents, and remote sensing imagery. To ensure data quality and comparability, all spatial data were standardized to the WGS 1984 coordinate system, temporally aligned to June 2023, and normalized via the range method (Appendix B). All data originate from public sources, with no involvement of personal privacy or sensitive information handling.
Baidu heatmaps (https://rq.baidu.com) record spatiotemporal crowd activity dynamics with high temporal and spatial resolution, providing a core data source for characterizing social vitality (Li et al., 2019). The data were collected every 2 hours from 7:00 to 23:00 on both June 6th (Tuesday, a weekday) and June 10th (Saturday, a weekend), 2023, yielding a total of 18 heat-map samples. Following calibration and cropping, a Baidu heatmap GIS database was constructed.
Nighttime light imagery was obtained from NASA’s NPP-VIIRS satellite (https://www.earthdata.nasa.gov/data/instruments/viirs), reflecting the intensity and spatial distribution of economic activities and serving as an important indicator of economic vitality (Wu et al., 2023). The monthly composite NPP/VIIRS dataset for June 2023 was selected, and after calibration and cropping, a city-scale nighttime light GIS database was developed.
POI data were obtained from Gaode Map (https://lbs.amap.com) and encode spatial location attributes for diverse facilities. These data enable precise quantification of facility distribution density and provide a key basis for evaluating public service supply (Ta et al., 2020). The June 2023 POI dataset for Xi’an comprises nearly 600,000 data points spanning 16 categories, and following data cleaning, aggregation, and reclassification, a POI GIS database was established.
Building data were also sourced from Gaode Map (https://lbs.amap.com), which contains attributes such as floor area, floor count, and spatial coordinates. The 2023 Xi’an building dataset served as the foundation for constructing a building GIS database.
Road network data were acquired from OpenStreetMap (https://www.openstreetmap.org). The 2023 vector road network data were utilized to construct a road network GIS database.
Urban planning information, including materials related to the city’s comprehensive plan, was gathered from the Xi’an Natural Resources and Planning Bureau’s official website (https://zygh.xa.gov.cn).
Remote sensing imagery was sourced from the Geospatial data cloud platform (https://www.gscloud.cn/). Landsat 8 imagery from 2023 formed the basis for developing a remote sensing imagery GIS database.
Methods
Evaluation index system for UV
Building on previous research (Lyu et al., 2025; Montalto et al., 2019; Ta et al., 2020), this study constructs an UV evaluation system integrating social, economic, and cultural dimensions. (1) The social vitality index is quantified using Baidu heatmap data (Li et al., 2019). Given the observed weekly periodicity in population distribution patterns, and to mitigate potential biases arising from disparities in population mobility between weekdays and weekends, the weekly average population heat index is employed to characterize social vitality at the block scale. (2) The economic vitality index is determined by the average nighttime light imagery intensity for each block (Zikirya et al., 2021). (3) The cultural vitality index is assessed through the density of cultural facility POIs within each block. The entropy weight method is subsequently applied to assign weights to each index, and a composite UV index is derived via weighted aggregation of these three components (Appendix C).
Built environment indicator system
This study adopts the 5D framework to develop an indicator system comprising 11 built environment factors aimed at evaluating how spatial characteristics influence UV (Pan et al., 2025) (Appendix D). The indicators are organized as follows: (1) Density: Floor area ratio (FAR) and building density (BD) are selected to represent development intensity and the capacity of urban spaces to accommodate activity within each unit of analysis. (2) Diversity: A single indicator—Mixed land use (MLU)—is used to assess the degree of functional variety and its effect on spatial vitality. (3) Design: Road network density (RND), shape index (SI), and fractional vegetation cover (FVC) are included to capture how spatial form and physical environment contribute to vitality at the block scale. (4) Distance to Transit: This dimension is assessed through two indicators—distance to the nearest subway station (DNSS) and bus stop density (BSD)—to examine how transport accessibility shapes patterns of resident mobility. (5) Destination Accessibility: Represented by distance to the city center (DCC), nearest park (DNP), and nearest shopping center (DNSC), this dimension reflects how spatial proximity to key urban nodes affects residents’ engagement in urban activities.
GWRF model
The GWRF model incorporates the foundational principles of GWR into the RF structure, enabling the construction of localized models that effectively capture spatial variability. GWRF conceptually extends the RF framework into a spatial domain by leveraging the spatial variation coefficient model (Zhang et al., 2025) and constructing multiple geographically weighted RF submodels. Unlike conventional models that assume normality, GWRF accommodates non-Gaussian data distributions, delivering spatially localized predictions and allowing for the assessment of variable importance at individual geographic locations. The formulation is as follows:


SHAP model
To address the precise contribution of individual features to prediction outcomes by the inherent black-box nature of the RF algorithm (Yang et al., 2024), the present study incorporates the SHAP interpretability framework. SHAP is an additive feature attribution method that assigns each input variable a SHAP value, representing its marginal contribution to a specific prediction. The formula is as follows:

Results
Spatial characteristics of UV
UV exhibits a pronounced core-periphery spatial distribution pattern (Figure 2). The high-vitality areas are mainly concentrated within Zones I–III, whereas areas in Zone IV emerge as low vitality areas. The UV index demonstrated a distinct declining gradient from the city center toward the periphery: Zone I (Average UV index, 0.370) > Zone II (0.301) > Zone III (0.218) > Zone IV (0.086). Zone I display the most pronounced vitality concentration, with its average vitality level about 4.3 times higher than that of Zone IV. Moreover, the average vitality scores for Zones I, II, and III all surpass 0.2, substantially higher than that observed in Zone 4. The spatial pattern of UV closely follows urban spatial evolution. In Zone I, leveraging historical and cultural resources to concentrate high-end commercial and cultural tourism activities forms a high-vitality core. In Zones II–III, the functional influence of this core extends outward, with vitality levels gradually declining toward the urban periphery. By contrast, service infrastructure in Zone IV remains relatively weak, leading to lower vitality levels. Spatial distribution of UV classified using the Jenks natural breaks method.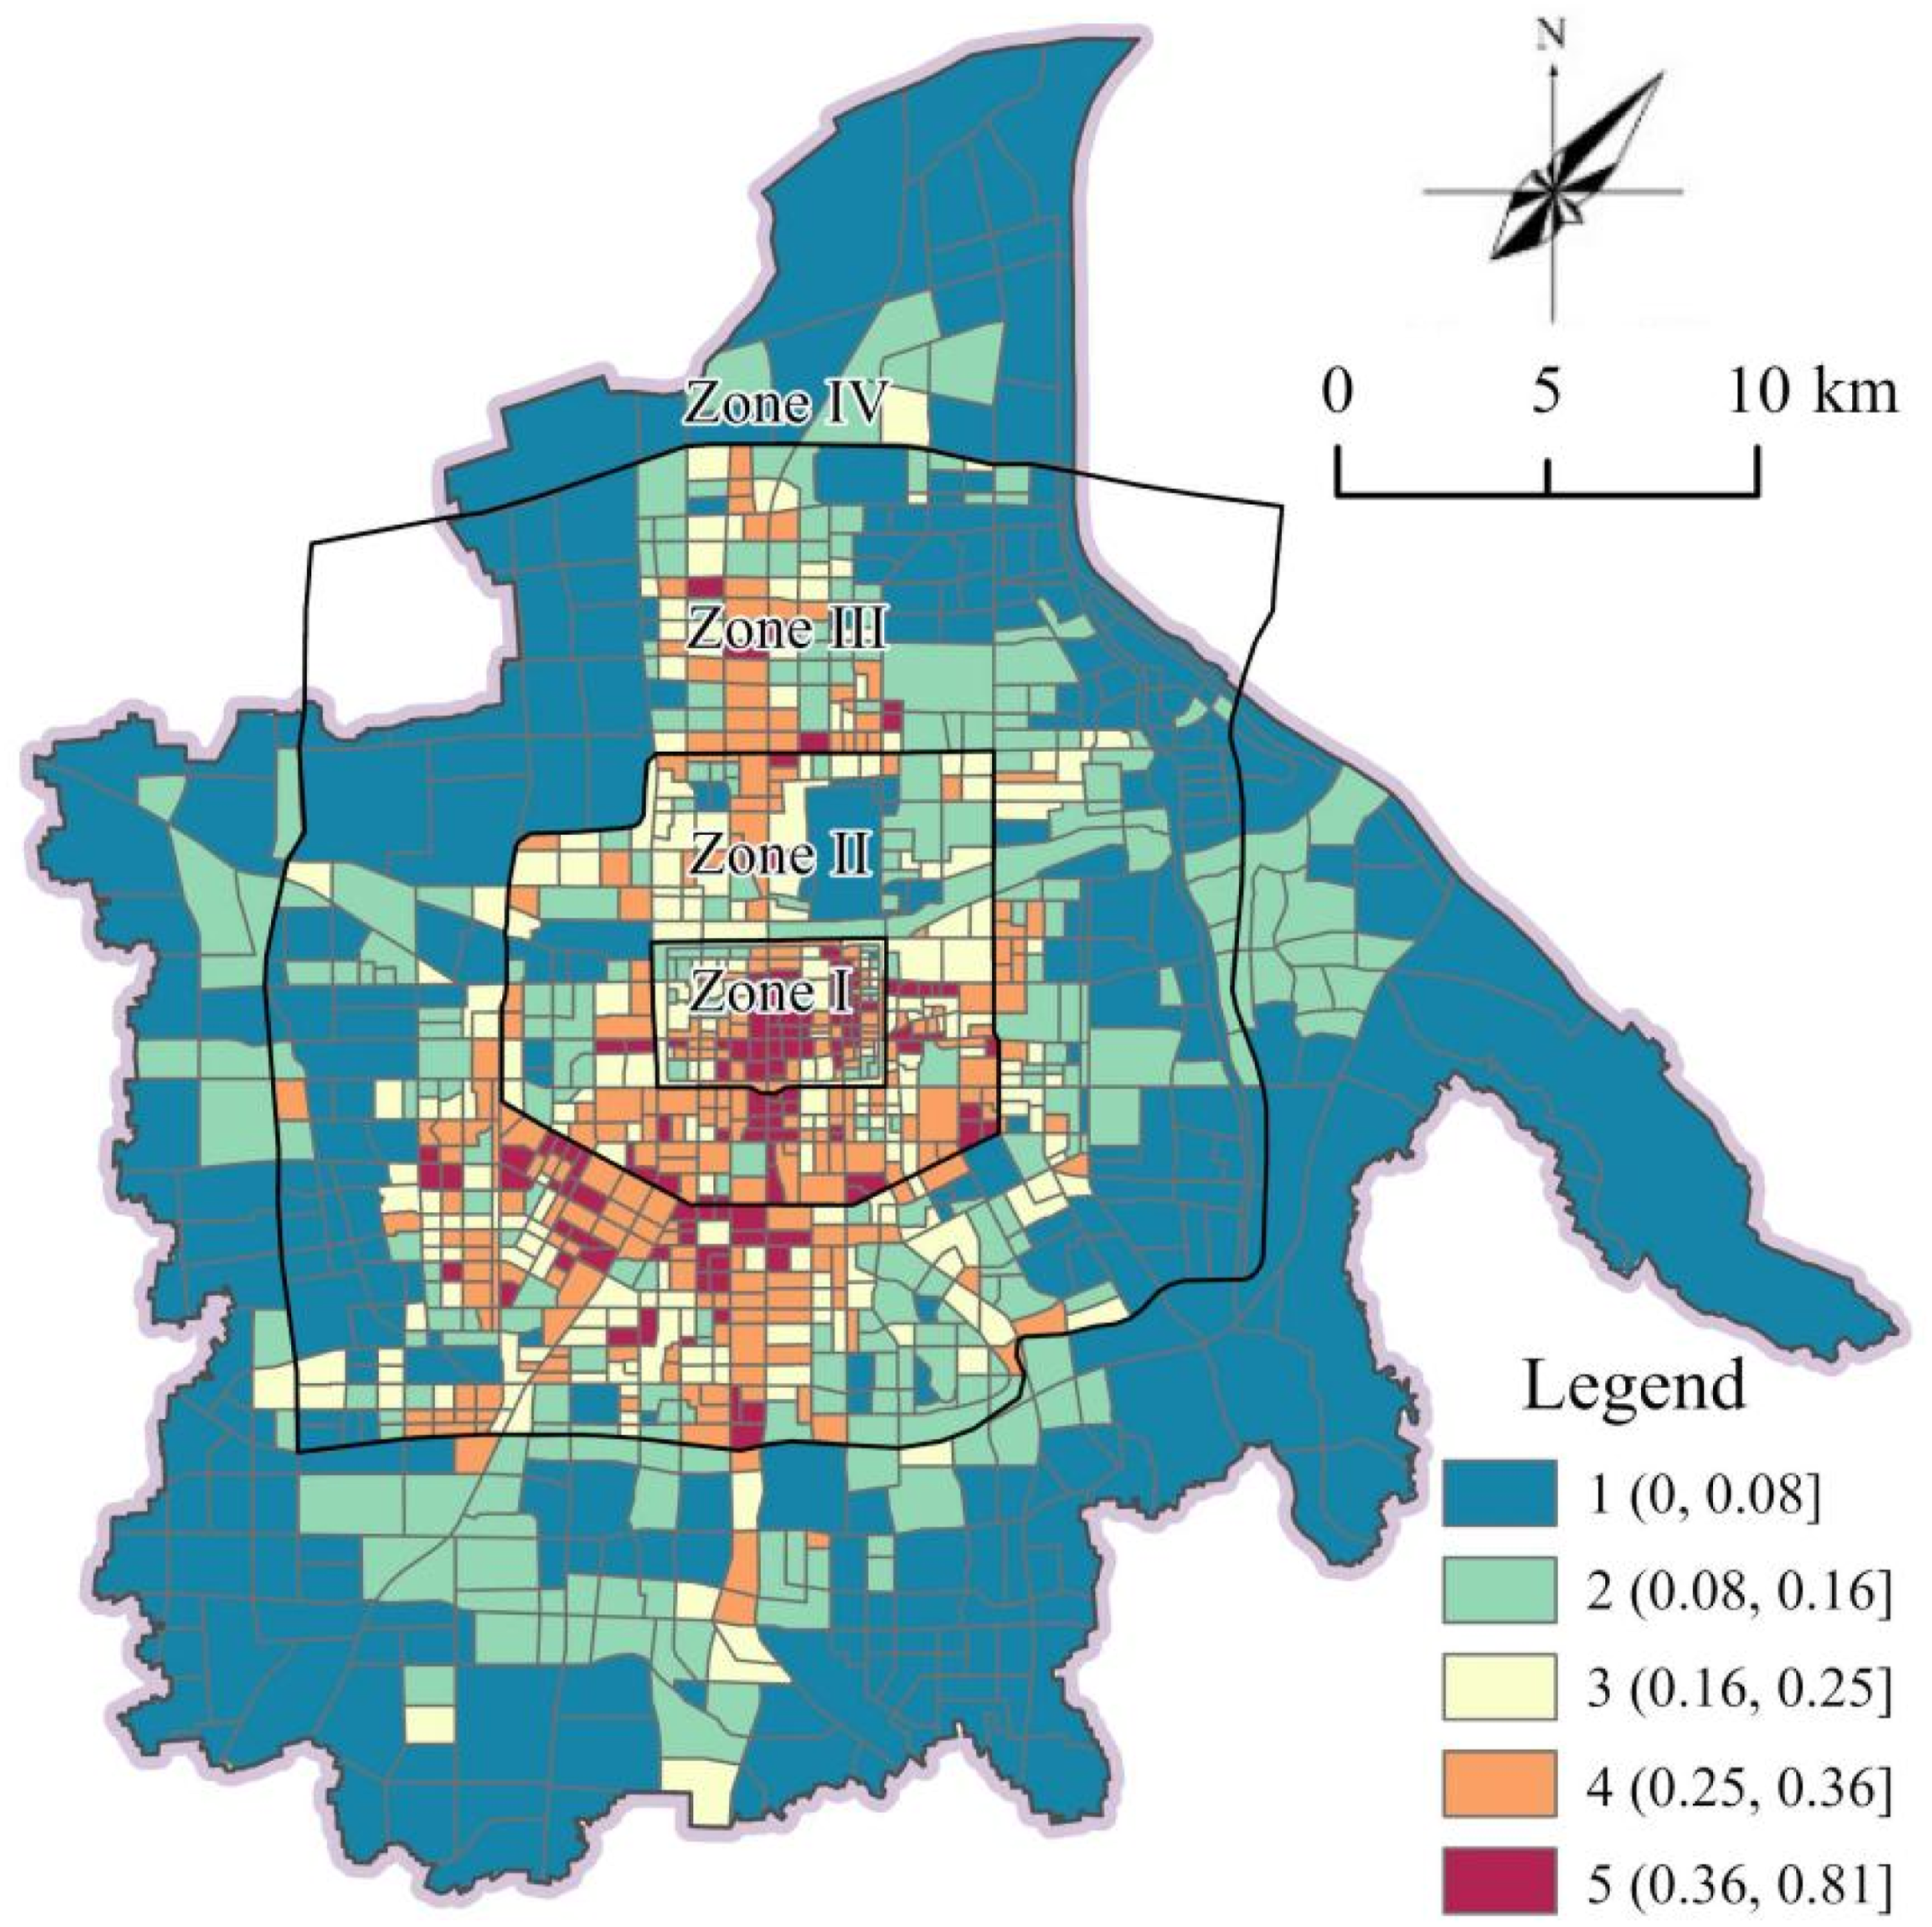
The spatial distribution of UV is characterized by a pronounced dependency on transportation, tending to cluster along major transit routes, with notable concentrations observed near subway lines and the second ring road. The clustering effect is especially prominent along metro corridors, where vitality intensity exceeds that of the ring roads. A case in point is Metro Line 2, which passes through several high-activity areas—including Beidajie, Bell Tower, and Xiaozhai—highlighting its role in fostering significant spatial agglomeration.
Identification of influencing factors
Global-level influencing factors
The FAR and MLU are the main influencing factors of UV in Xi’an (Figure 3). Based on sum normalizing global feature importance values, the explanatory variables can be divided into four categories using K-means clustering method: (1) High-impact factors: FAR (feature importance = 0.38, same below) shows the strongest explanatory ability, with higher values positively associated with increased spatial intensity, indicating that high-intensity development markedly enhances UV. (2) Moderate-impact factors: MLU (0.17), ranking second after FAR, suggests that greater land-use diversity and complexity reinforce block vitality. (3) Weak-impact factors: FVC (0.09) exhibits negative contributions at higher values, implying that lower vegetation coverage is more favorable for UV. DNSC (0.08) and DNSS (0.06) indicate that shorter walking distances to key destinations correspond to higher vitality. DCC (0.06) shows stronger effects at certain distances from the urban center. Overall, the influence of these weak-impact factors is limited compared with FAR and MLU. (4) Negligible factors: Other building environment indicators (≤ 0.04) display SHAP values clustered near zero, indicating no statistically meaningful association with UV. Relative importance and beeswarm plot of built environment indicators. Note: The definitions of variable abbreviations are provided in Section 3.3.2.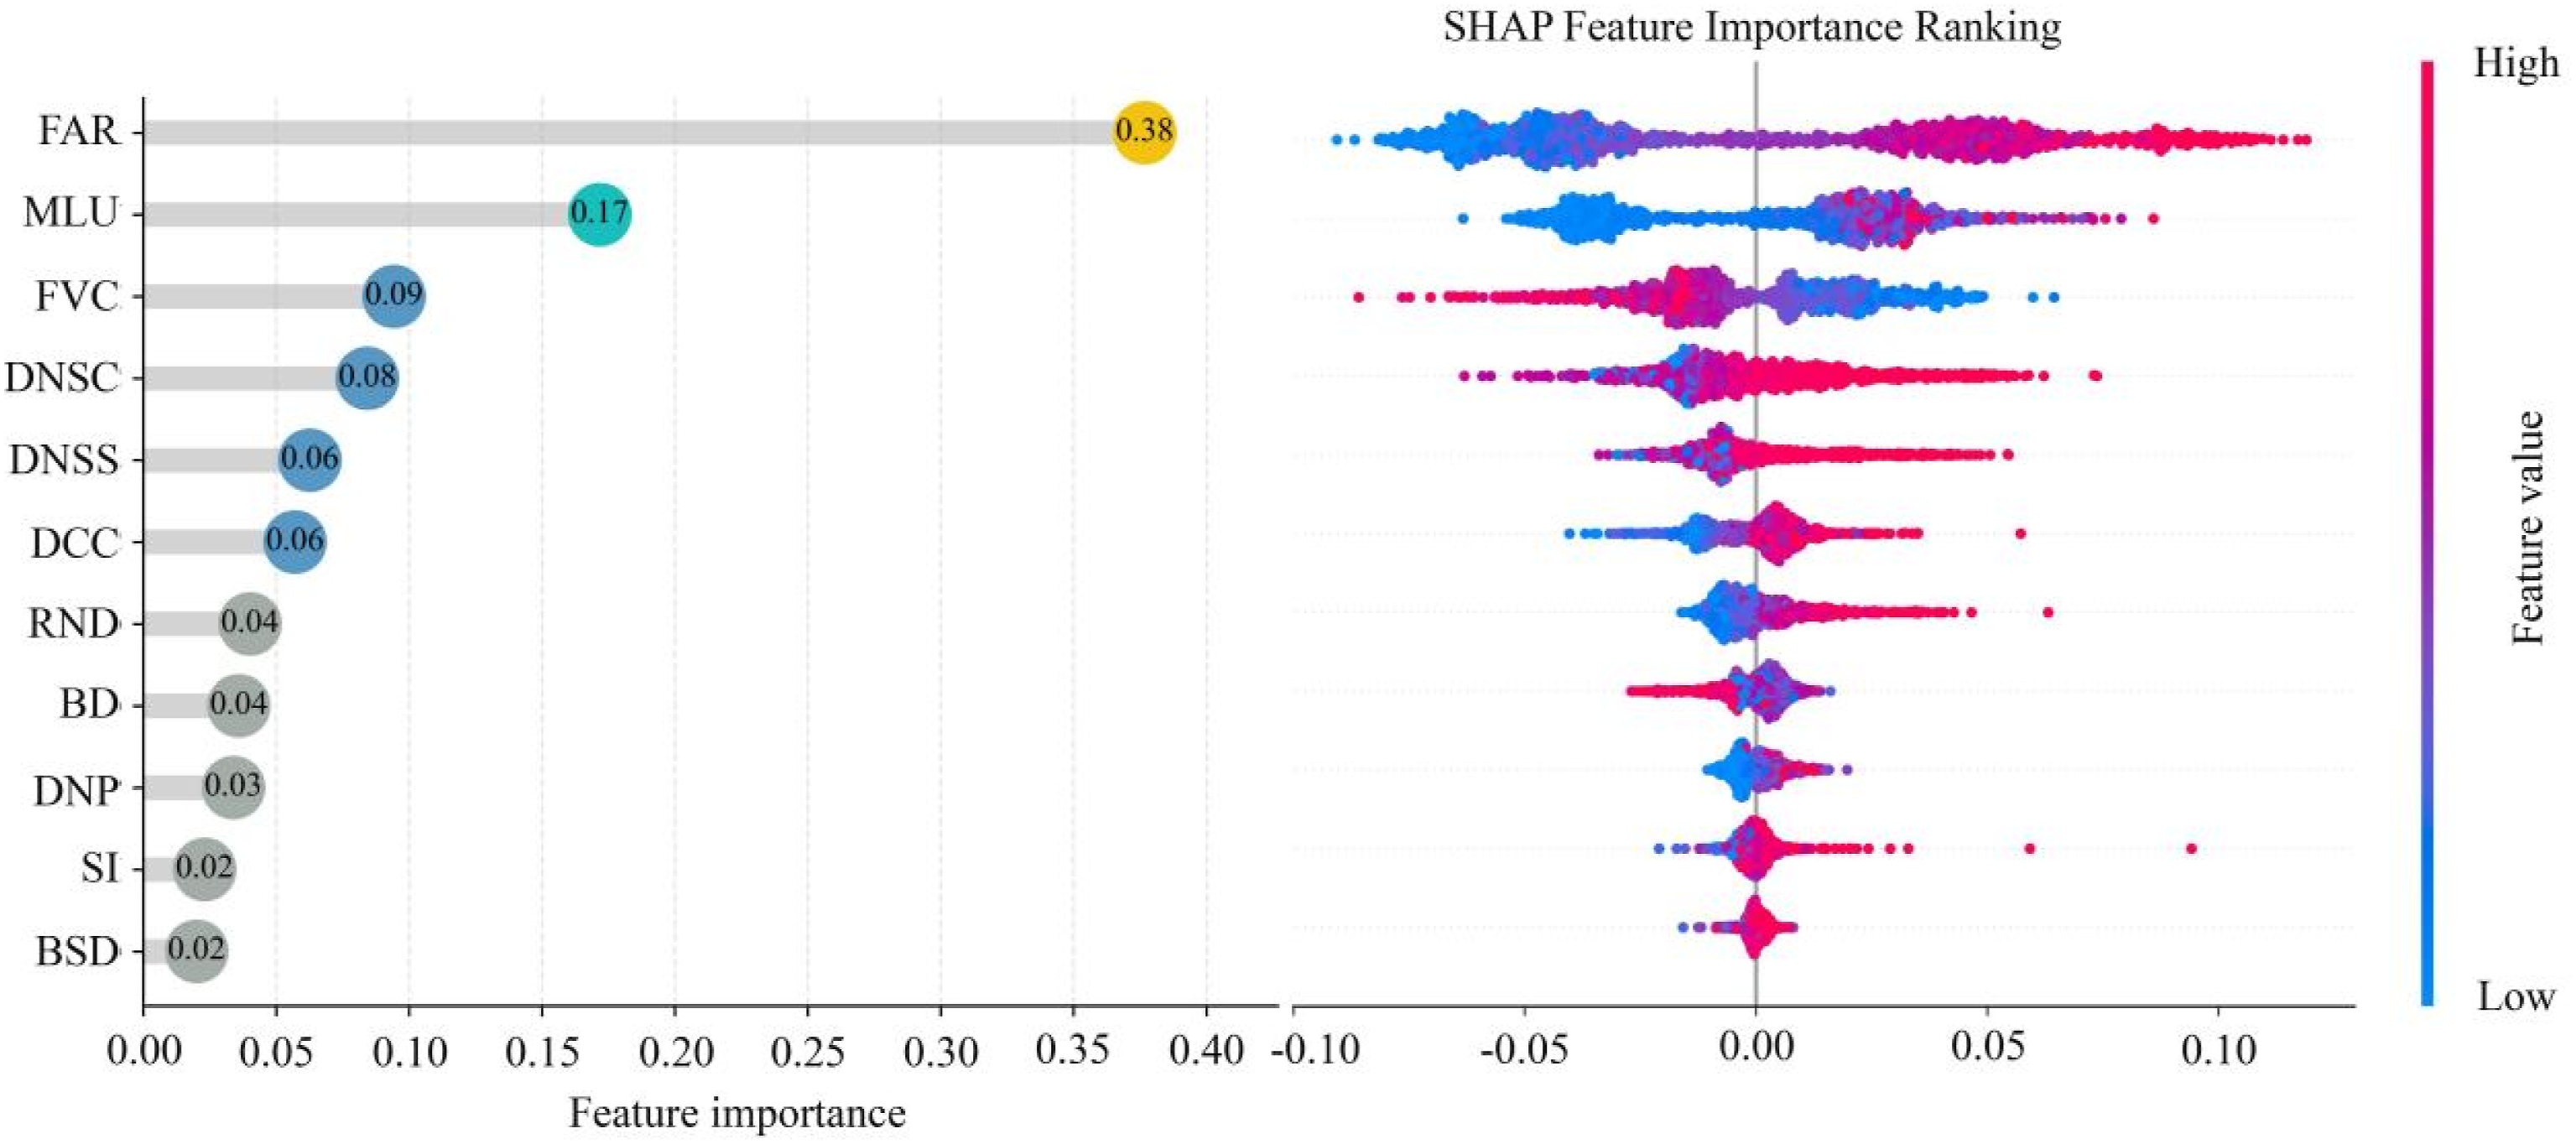
The FAR and MLU emerged as the primary drivers of UV with both variables exhibiting pronounced nonlinear dynamics and threshold effects (Figure 4, Appendix E). Their impacts can be systematically characterized as follows: (1) S-shaped curve effect of FAR: Moderate development intensity maximizes vitality, whereas over development (FAR > 2.3) or inefficient construction (FAR < 0.5) suppresses vitality. (2) Diminishing returns of MLU: Vitality is significantly enhanced when the MLU index falls within the range of 1.7 to 8.7. However, once the index exceeds 8.7, the incremental benefits decline markedly. (3) Negative correlation of FVC: When FVC is below 0.4, vitality levels are relatively higher, and vice versa. (4) The optimal distance for accessibility indicators: There is an optimal spatial threshold for DNSC, DNSS, and DCC, with vitality decreasing as distance increases, at 750 m, 600 m, and 3-7 km, respectively, signifying reduced urban activity in outlying areas. Collectively, these results highlight the complex, nonlinear relationships between built environment factors and UV. They challenge the assumptions of linearity embedded in conventional urban planning models. SHAP dependence plots for variables.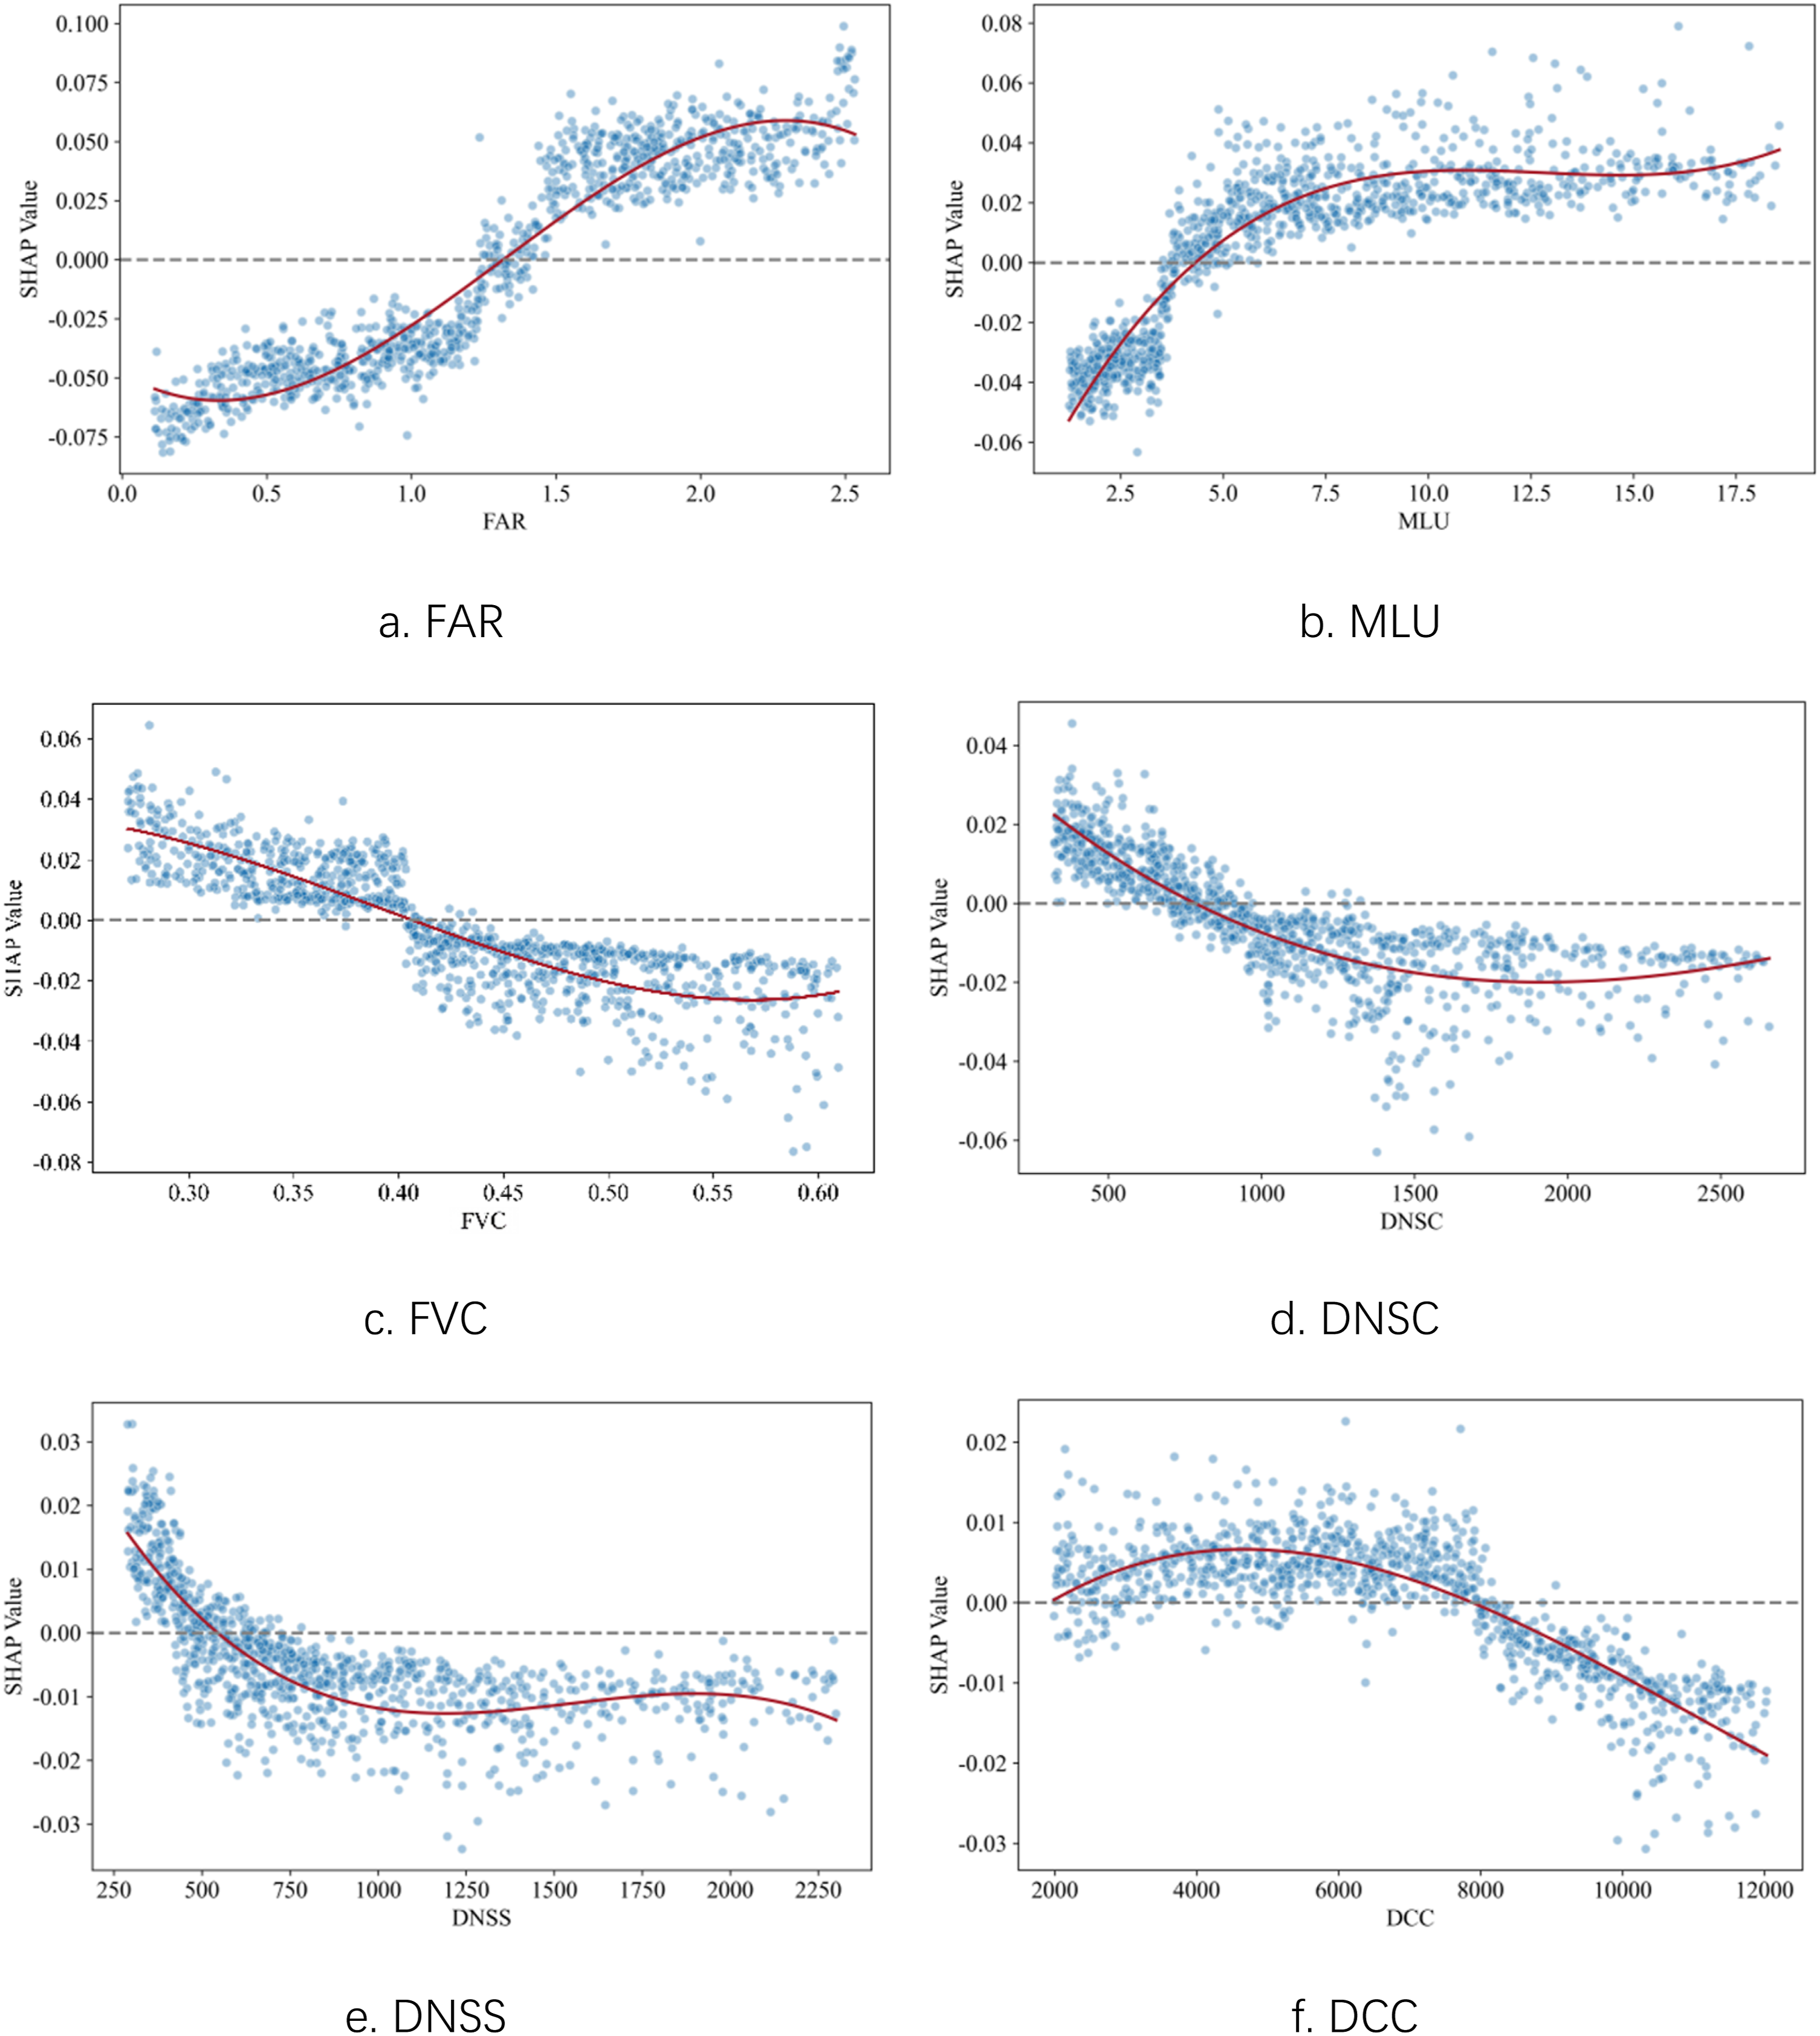
Local-level influencing factors
The effects of built environment factors on UV reveal significant spatial heterogeneity. (1) DNSS and DNSC: Areas with the highest influence from these variables are primarily located in Zone I, with some extension into Zones II and III (Figure 5). In particular, the influence of DNSS extends into the northeastern portions of Zones II and III, while the impact of DNSC is more pronounced in the northwestern section of the central urban zone. (2) FAR, MLU, FVC, and DCC: These factors exhibit stronger effects in Zones III and IV. FAR has the greatest influence in the northern and eastern areas of Zone III, while MLU is most impactful in its southern and western sectors. FVC forms a high-influence belt along the southern stretches of Metro Lines 2 and 4. The impact of DCC appears in scattered high-influence clusters, primarily concentrated in the southwestern parts of Zones III and IV and the southeastern section of Zone III. Spatial distribution of local-level influencing factors classified using the Jenks natural breaks method.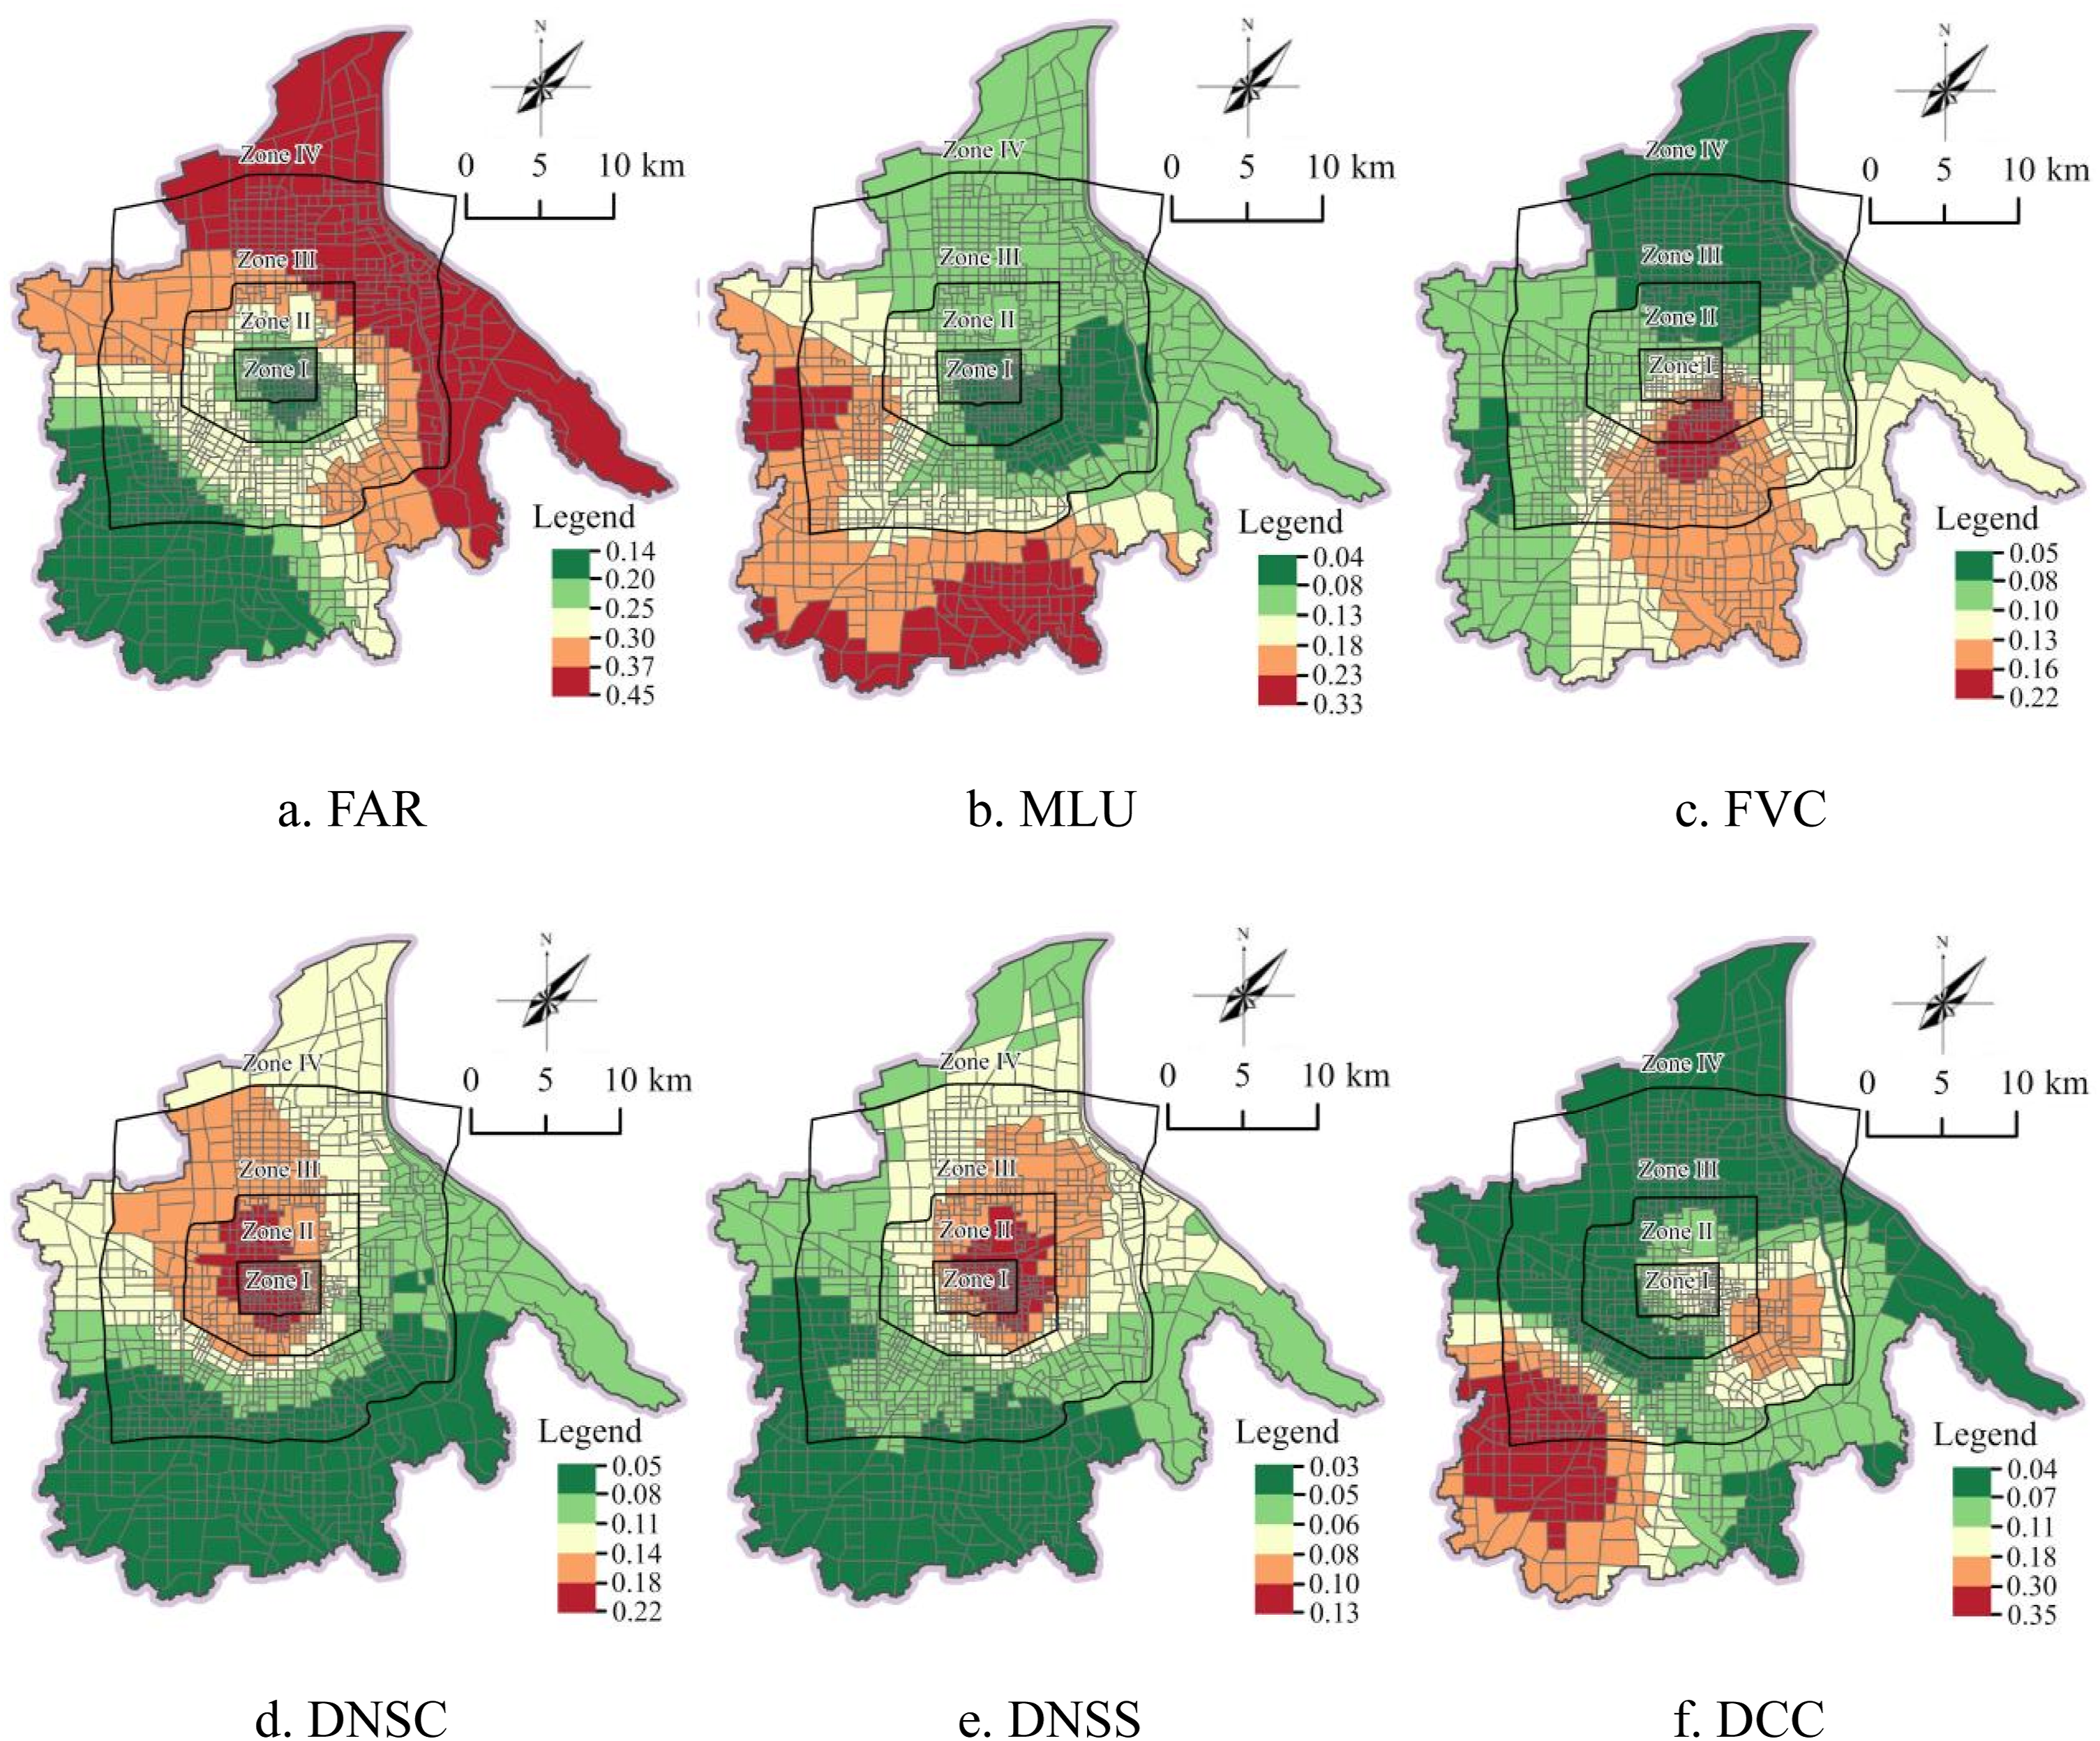
Discussion
Analysis of spatial characteristics of UV
Compared with traditional research paradigms that rely on single proxy indicators (Chen et al., 2023; Wu et al., 2023), the social-economic-cultural three-dimensional vitality measurement framework proposed in this study simultaneously captures diverse urban activity features, including block-scale economic activities, daily population mobility, and cultural activities. This approach reduces the bias risks associated with single-dimensional measurements tied to specific time periods, populations, or functions. Empirical results show that the comprehensive measurement outcomes (Appendix C) exhibit strong consistency and reliability, supporting the theoretical view that vitality constitutes a system of diversified activities.
Xi’an exhibits a strongly monocentric urban form, with functions and resources concentrated in the central area, resulting in a core-periphery gradient in UV. (1) The core area (Zone I-III) features developed infrastructure, comprehensive public services, and a rich cultural concentration, positioning it as the city’s economic and cultural hub, effectively supporting daily life and leisure needs (Dhanani et al., 2017; Xu et al., 2024; Zhan et al., 2025). (2) The periphery area (Zone IV) is indicative of recent spatial expansion. While the area contains an industrial base, it lacks adequate supporting facilities and suffers from functional discontinuities, limiting its capacity to attract and retain population. This spatial pattern not only confirms the inherent path dependence of urban spatial structure but also reveals a vitality trap arising from mismatches between public services, infrastructure, and spatial development patterns during the expansion of single-center city (Chen et al., 2019, 2023; Doan et al., 2025).
The transportation dependence of UV spatial distribution arises from transportation arteries, which, as the urban framework, concentrate commercial facilities, public services, and high-density population activity areas (Dhanani et al., 2017; Jin et al., 2024). For example, Metro Line 2, which has served as the Xi’an primary north-south axis since its 2011 inauguration, has cultivated mature service ecosystems along key nodes such as Beidajie, Nanshaomen, and Xiaozhai. These areas, characterized by robust development foundations and high-quality amenities, exhibit significantly greater vitality than do peripheral zones.
Effects of the built environment
Built environment factors demonstrate notable nonlinear and threshold effects in their influence on UV. (1) FAR: The S-shaped response curve for FAR indicates that moderate increases in development intensity tend to promote UV (Doan et al., 2025). While high-intensity development can enhance UV (Doan et al., 2025; Wu et al., 2018b; Zhan et al., 2025), this study highlights the benefits of moderate intensification, suggesting an optimal FAR threshold beyond which marginal gains diminish (Ling et al., 2024). (2) DCC: The inverted-U relationship reflects a spatial vitality gradient from the urban core, with a clear threshold beyond which vitality begins to decline (Tu et al., 2021). This pattern suggests the need to develop new vitality hubs in peripheral zones to extend core area spillover benefits. (3) MLU: Land-use diversity is regarded as an important driving factor for UV (Jacobs-Crisioni et al., 2014; Mouratidis and Poortinga, 2020; Zikirya et al., 2021), this study reveals that beyond a certain threshold, the marginal contribution of diversity to vitality growth diminishes. This nonlinear relationship highlights the need to balance land-use strategies and avoid excessive diversification (Liu et al., 2025; Lyu et al., 2025). (4) FVC: The negative correlation between FVC and UV contrasts with the findings of some studies (Mouratidis and Poortinga, 2020; Zhang et al., 2025). In Xi’an, zones with high greening are mostly large parks and open green spaces with low development intensity and sparse foot traffic, supporting the argument that green-space ratios alone can’t sustain full-time street activity (Jin et al., 2024). (5) DNSS/DNSC: Negative associations between vitality and DNSS/DNSC confirm these facilities as core nodes of UV (Mouratidis and Poortinga, 2020; Wu et al., 2025), further confirming the significant promoting effect of functional element agglomeration on UV (Li et al., 2022).
The spatial heterogeneity of built environment factors reflects the differing functional demands and spatial dynamics across various urban zones in stimulating vitality (Lyu et al., 2025; Wu et al., 2025; Xu et al., 2024): (1) FAR and MLU: Contrary to previous studies that highlight the vitality-boosting effects of compact planning in core urban areas (Xia et al., 2020), our analysis shows that FAR and MLU exert greater influence in peripheral zones. In Zones III and IV, moderate densification and land-use mixing provide more effective pathways for vitality enhancement. In the core area of a monocentric city, saturated high-intensity development and functional mixing lead to diminishing marginal vitality effects as FAR and MLU continue to increase. In contrast, peripheral areas remain in a phase of element absorption and functional refinement, where moderate densification and functional integration attract population activities and generate stronger vitality responses (Chen et al., 2019, 2023; Doan et al., 2025). (2) DCC: The spatial fragmentation observed in the influence of distance to the city center suggests that vitality patterns are shaped by evolving urban structures, infrastructure development, and degrees of functional integration. Spillover effects from the core require relatively complete development intensity and functional composition in peripheral areas to transform into new growth points (Tu et al., 2021). This finding is consistent with the view that, in polycentric cities, functions and activities diffuse from a single core toward multiple nodes, with the urban spatial network reorganized through inter-node connections (Bartosiewicz and Marcińczak, 2020). (3) FVC: The strongest vitality gains associated with FVC occur along the southern metro corridor in Zone II, where the co-location of tourist attractions, residential developments, office areas, and public services—coupled with high metro accessibility and quality green spaces—creates synergies between environmental quality and urban accessibility. This supports the argument that integrated green infrastructure is particularly effective in enhancing vitality in dense urban settings (Li et al., 2022). (4) DNSC, DCC and MLU: Localized high-impact zones for subway and shopping center accessibility within Zone I indicate that UV in core areas is primarily sustained by a combination of land-use diversity and high accessibility (Lyu et al., 2025). While policies such as urban renewal and improvements in public transport have enhanced spatial quality and connectivity in some peripheral districts, commercial clustering in these areas also plays a role in attracting cross-district pedestrian flows, thereby reinforcing their emerging vitality (Niu et al., 2019; Wang et al., 2022; Zhang et al., 2021). This process also aligns with the service threshold logic of central place theory (Li et al., 2022; Mouratidis and Poortinga, 2020; Wu et al., 2025) and deepens the understanding of service radii for transportation and commercial systems.
Strategies for enhancing UV
As a typical single-center city, Xi’an exhibits saturated vitality in its core area and limited vitality in peripheral zones. The S-shaped relationship of FAR and the marginally diminishing returns of MLU suggest minimal vitality gains from further intensifying development in the core. At the same time, peripheral areas show greater potential for vitality response with respect to FAR and MLU. The inverted U-shaped pattern of DCC provides empirical support for the pivotal significance of fostering secondary vibrancy clusters and cultivating polycentric UV systems within the 3–7 km urban transition zone. Therefore, in the stage of improving quality and efficiency, Xi’an should cultivate new UV blocks in the transition zones in an orderly and phased manner, thereby improving urban spatial performance and sustainability.
Firstly, in the spatial layout dimension, a multi-node network layout guided by FAR optimization should be constructed to guide the urban spatial structure pattern through differentiated development intensity (Chen et al., 2019, 2023). Zones III and IV hold the potential to capitalize on their existing resource advantages and increase development density to cultivate secondary urban nodes with integrated functions. By concentrating office and retail developments, these zones can attract dense population clusters and encourage functional diversity, laying the groundwork for a more polycentric vitality structure (Kim, 2020; Ta et al., 2020).
Secondly, in the functional integration dimension, the precise and targeted regulation of MLU is essential (Jiang et al., 2022)—particularly for facilitating functional transformation in old industrial zones and advancing industry-urban integration within development areas. To revitalize these areas, block-scale renewal strategies should transcend traditional single-use industrial zoning paradigms, incorporating commercial, research, and cultural functions. Properly raising the FAR and enhancing the MLU index can effectively stimulate vitality. Moreover, development zones require industry-urban integration via residential, commercial, and cultural facility infusion.
Conclusion
The innovation of this study is twofold. Firstly, it establishes a three-dimensional evaluation framework that that integrates society, culture, and economy at the block scale. Conventional studies typically adopt unidimensional perspectives—social, economic, or cultural vitality—thereby overlooking systemic inter-dependencies between human behavior and socioeconomic and spatial structures (Della Spina, 2019; Jin et al., 2024). Such single-dimensional approaches cannot capture the interplay among social activities, the real economy, and spatial factors, and they may yield biased results (Lyu et al., 2025). This evaluation framework links social, economic, and cultural dimensions with spatial performance, offering a scientifically robust tool for objectively assessing vitality.
Secondly, to address the methodological constraints of traditional regression models, this study employs a GWRF-SHAP model to explore the nonlinear relationships, threshold effects, and spatial heterogeneity in the influence of the built environment on UV (Wu et al., 2025). Departing from the assumptions of conventional linear modeling (Lu et al., 2019; Lyu et al., 2025; Ta et al., 2020), built environment factors display FAR and MLU emerge as primary determinants, with significant nonlinear relationships and threshold effects, thus answering the question of “how to optimize the built environment.” Meanwhile, contrary to the idea that compact development in the core area inevitably leads to higher vitality (Xia et al., 2020), the vitality-enhancing potential of these variables is more pronounced in developing peripheral areas than in mature urban cores. In particular, the spatial heterogeneity of DCC indicates that the polycentric dynamic spatial pattern serves as a critical framework for enhancing urban quality and efficiency. This addresses the question of “where to optimize the built environment” while aligning with fostering vitality in peripheral zones (Chen et al., 2019; Doan et al., 2025; Wang et al., 2022).
The results show that UV in Xi’an has a pronounced core-periphery structure and transportation dependence characteristics. Empirical findings demonstrate that FAR and MLU constitute the primary drivers shaping the UV landscape. Notably, the relationship between FAR and vitality follows an S-shaped nonlinear trajectory, and MLU follows the principle of diminishing marginal utility. Furthermore, the potential for significant vitality uplift driven by FAR, MLU, FVC, and DCC is especially prominent in Zones III and IV, highlighting these areas’ untapped growth potential as future multipolar development hubs. Through a three-dimensional evaluation and nonlinear relationship analysis, the findings indicate that UV emerges from the combined effects of multiple built environment elements and advocates constructing a polycentric UV spatial pattern. This study provides a more refined analytical perspective for examining UV–built environment relationships.
There are three limitations to this study. Firstly, the spatiotemporal dynamics of UV should be strengthened. While urban residents’ activities demonstrate notable spatiotemporal variability, this study relies on cross-sectional data, which inherently limits the depth of analysis regarding urban dynamics and residents’ daily behavioral patterns. Future research may incorporate long-term, multi-period datasets to develop dynamic UV models and test the temporal robustness of nonlinear mechanisms. Secondly, data exploration should be performed. At the block scale, nighttime light data present a viable complementary approach to conventional statistical sources for measuring residents’ socioeconomic activity intensity, particularly during evening hours. However, such data exhibit reduced efficacy in capturing daytime behaviors and productive economic activities. Future research may integrate finer-grained data, such as business operation records and consumer reviews, to strengthen the economic dimension. Thirdly, the contextual applicability of the results requires further validation. As a single-case study focused on Xi’an, this research cannot determine whether thresholds and spatial heterogeneity of parameters such as FAR and MLU are universally applicable across different urban contexts. Comparative studies across multiple cities are needed to identify contextual differences and assess generalizability.
Supplemental material
Supplemental material - How the built environment affects urban vitality at the block-scale: Empirical evidence from Xi’an’s central urban area
Supplemental material for How the built environment affects urban vitality at the block-scale: Empirical evidence from Xi’an’s central urban area by Jianwei Li, Jiagang Zhai, Lina Shen, Dan Zhao in Environment and Planning B: Urban Analytics and City Science.
Footnotes
Funding
The authors disclosed receipt of the following financial support for the research, authorship, and/or publication of this article: This work is supported by the National Natural Science Foundation of China (No. 42071211) and Natural Science Basic Research Program of Shaanxi (No. 2025JC-YBMS-537)
Declaration of conflicting interests
The authors declared no potential conflicts of interest with respect to the research, authorship, and/or publication of this article.
Data Availability Statement
Data sharing not applicable to this article as no datasets were generated or analyzed during the current study.
Supplemental material
Supplemental material for this article is available online.
Author biographies
References
Supplementary Material
Please find the following supplemental material available below.
For Open Access articles published under a Creative Commons License, all supplemental material carries the same license as the article it is associated with.
For non-Open Access articles published, all supplemental material carries a non-exclusive license, and permission requests for re-use of supplemental material or any part of supplemental material shall be sent directly to the copyright owner as specified in the copyright notice associated with the article.