
Abstract
China’s rapid economic growth has led to an intricate interprovincial freight circulation network, contributing significantly to national carbon emissions. This study uses 4,001,666 truck transaction records to develop cartogram-based and topology-based visualizations of China’s interprovincial freight circulation network and carbon emissions. The results show spatial patterns of freight flows across eight goods categories and their environmental impacts, highlighting heterogeneity in network structure and spatial inequality in emissions. Furthermore, it reveals a clear core–periphery pattern where higher connectivity and carbon burdens concentrate in developed provinces. The findings highlight key emission hotspots and dominant freight types, informing sustainable logistics planning and regional development policies.
Keywords
Freight transportation is the backbone of China’s domestic supply chains and an increasing contributor to the transport sector’s carbon footprint (Wang et al., 2025; Zhang et al., 2024). Understanding the spatial organization of these flows and their carbon emissions is critical for effective environmental policy and for equitable and sustainable development. Previous studies often examine freight circulation networks or carbon emissions separately (Chang et al., 2024; Li et al., 2022). However, many studies do not distinguish the role of different goods types in shaping freight flows and emission patterns. As a result, it remains difficult to visually capture how province-level nodes, dominant goods types, and carbon-emission burdens correspond within the national freight system. This gap limits targeted interventions and efforts to balance economic efficiency with environmental sustainability.
To address this gap, we develop a visualization that integrates interprovincial freight network analysis with carbon-emission mapping. Using 4,001,666 truck freight records from a national fourth-party logistics (4PL) digital platform in 2023, we construct China’s interprovincial freight circulation network. The network covers eight goods categories: energy and fuels; minerals and metals; construction materials; chemical products; machinery and electronic equipment; consumer goods; agricultural and fishery products; and other categories. Figures 1 and 2 present these relationships through two complementary visualizations that connect interprovincial freight flows, goods composition, and carbon emissions. The interprovincial freight circulation networks and carbon emissions in China. (1-a) Interprovincial circulation networks of eight goods categories and overall carbon emission patterns in China. (1-b) Provincial carbon emission intensity in China. Topology network of interprovincial freight connections, carbon-emission intensity, and GDP tiers.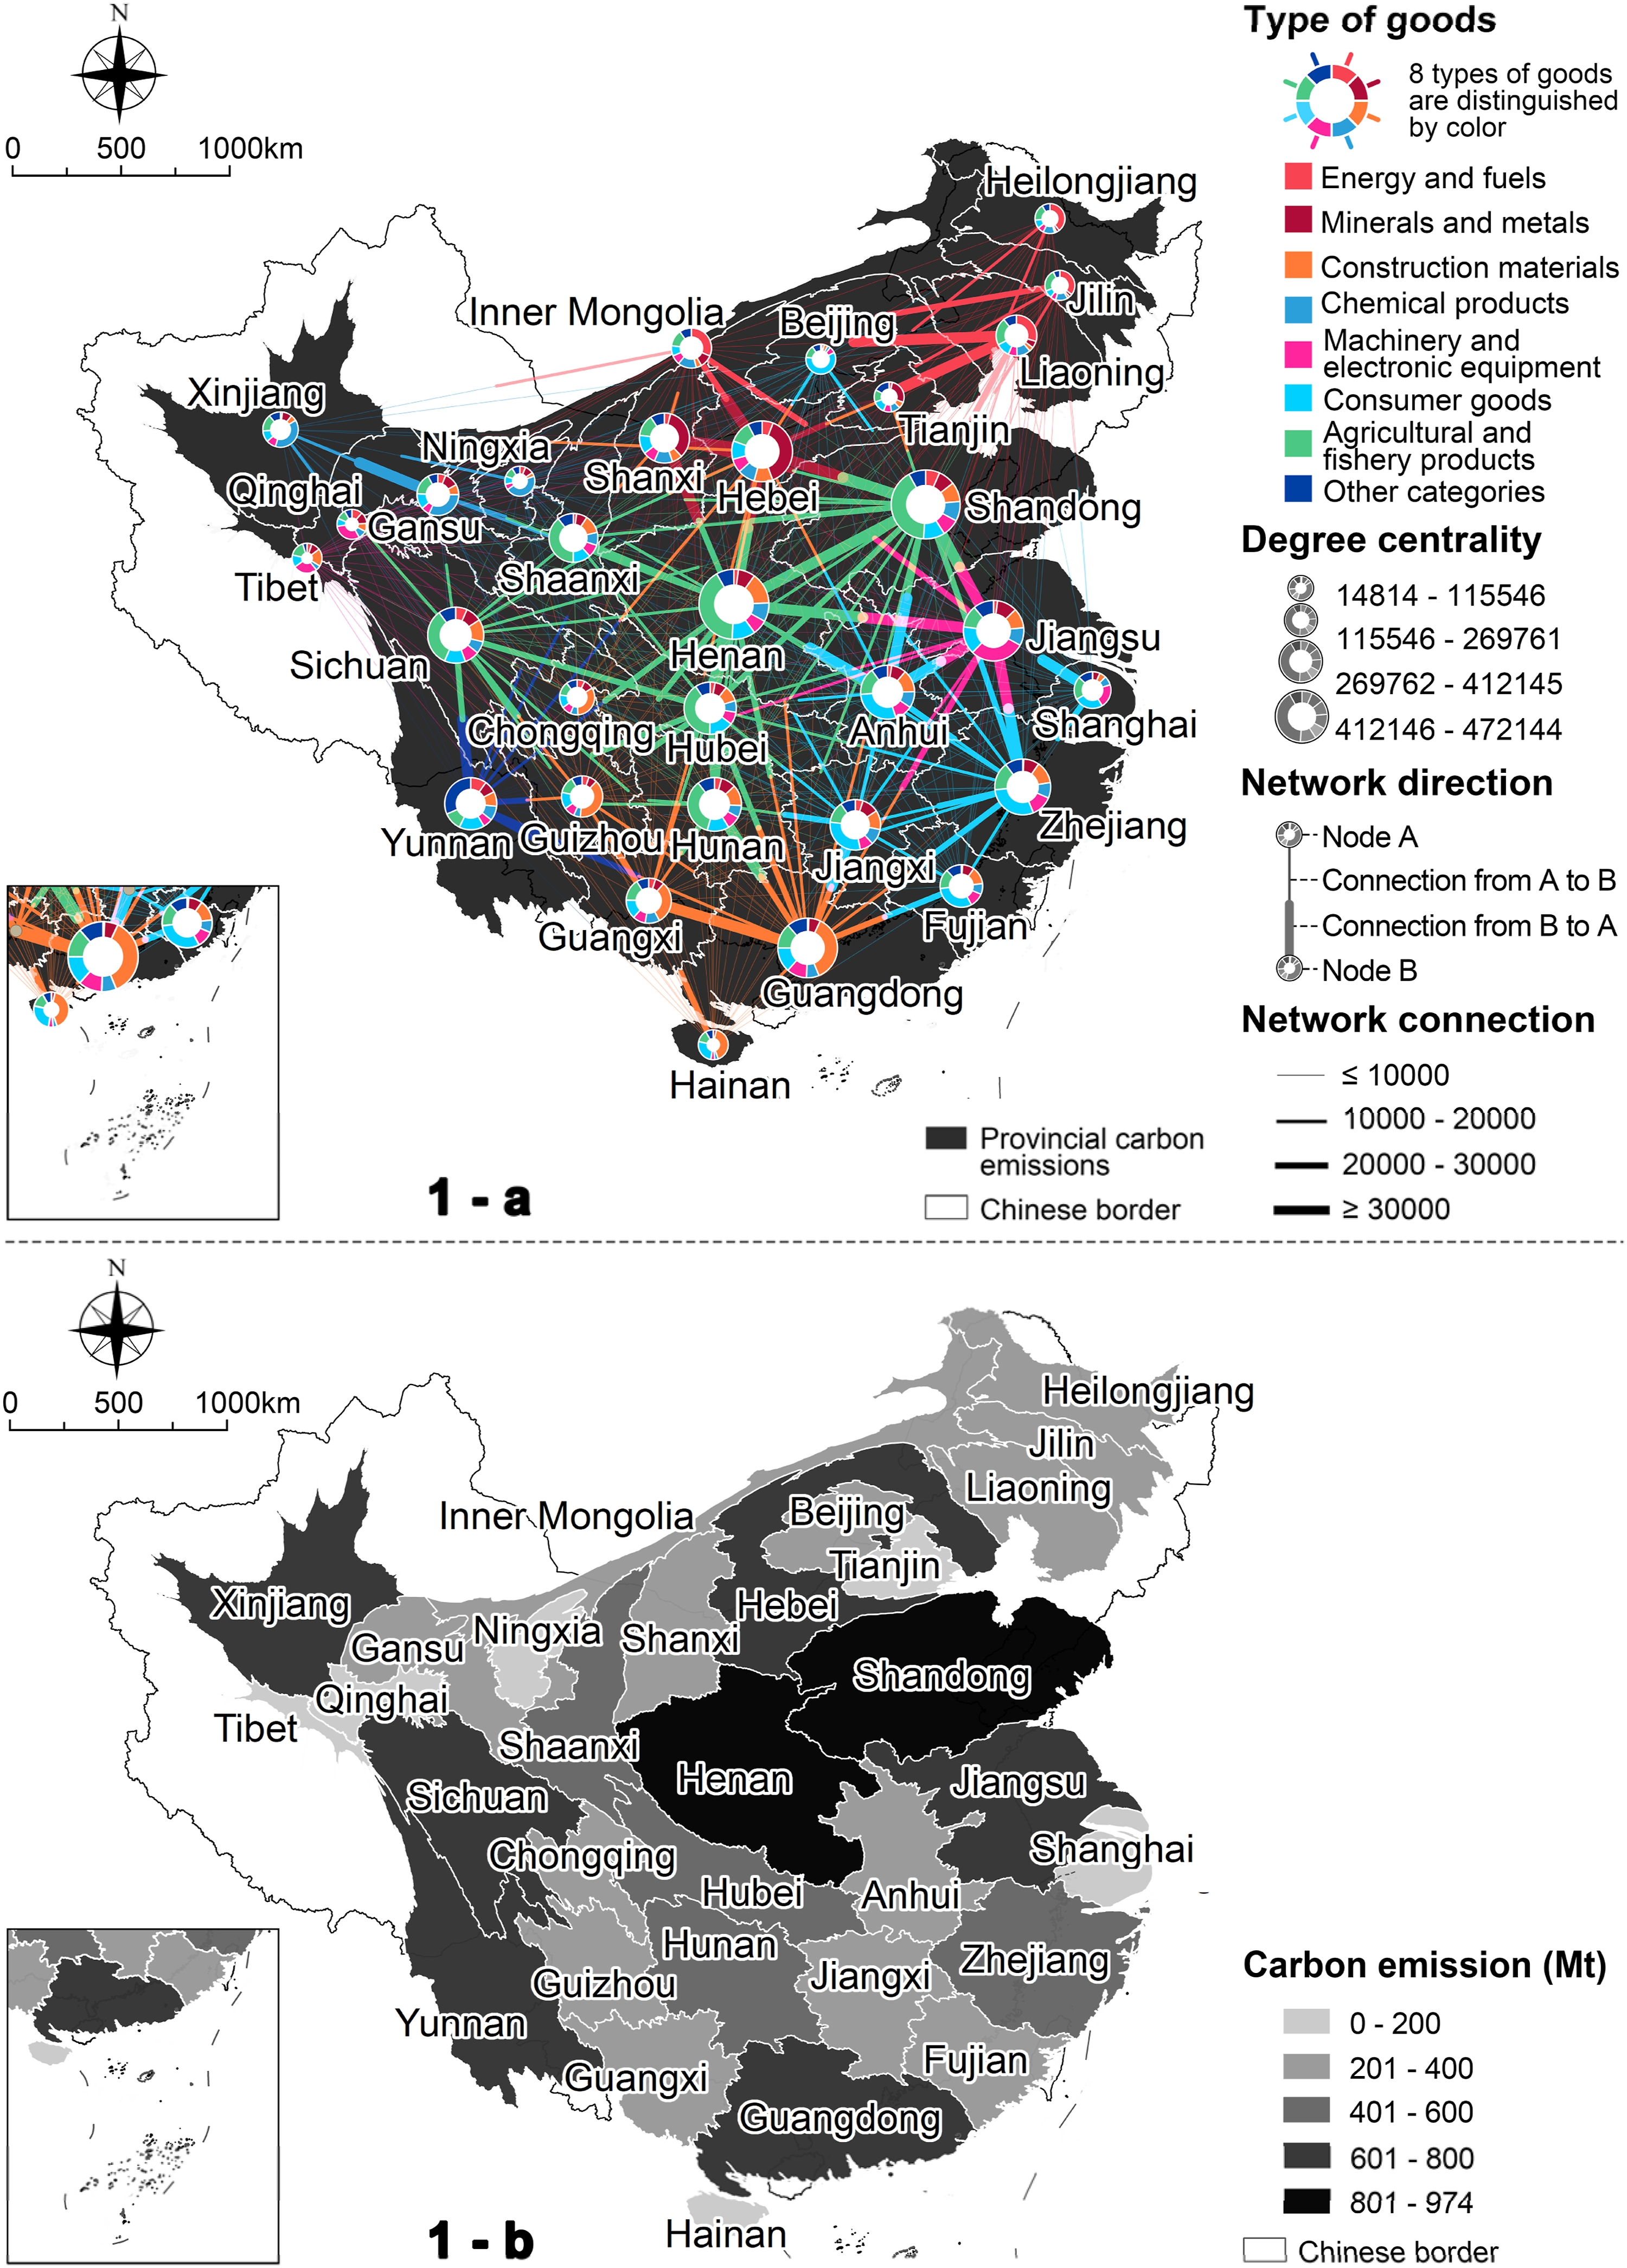
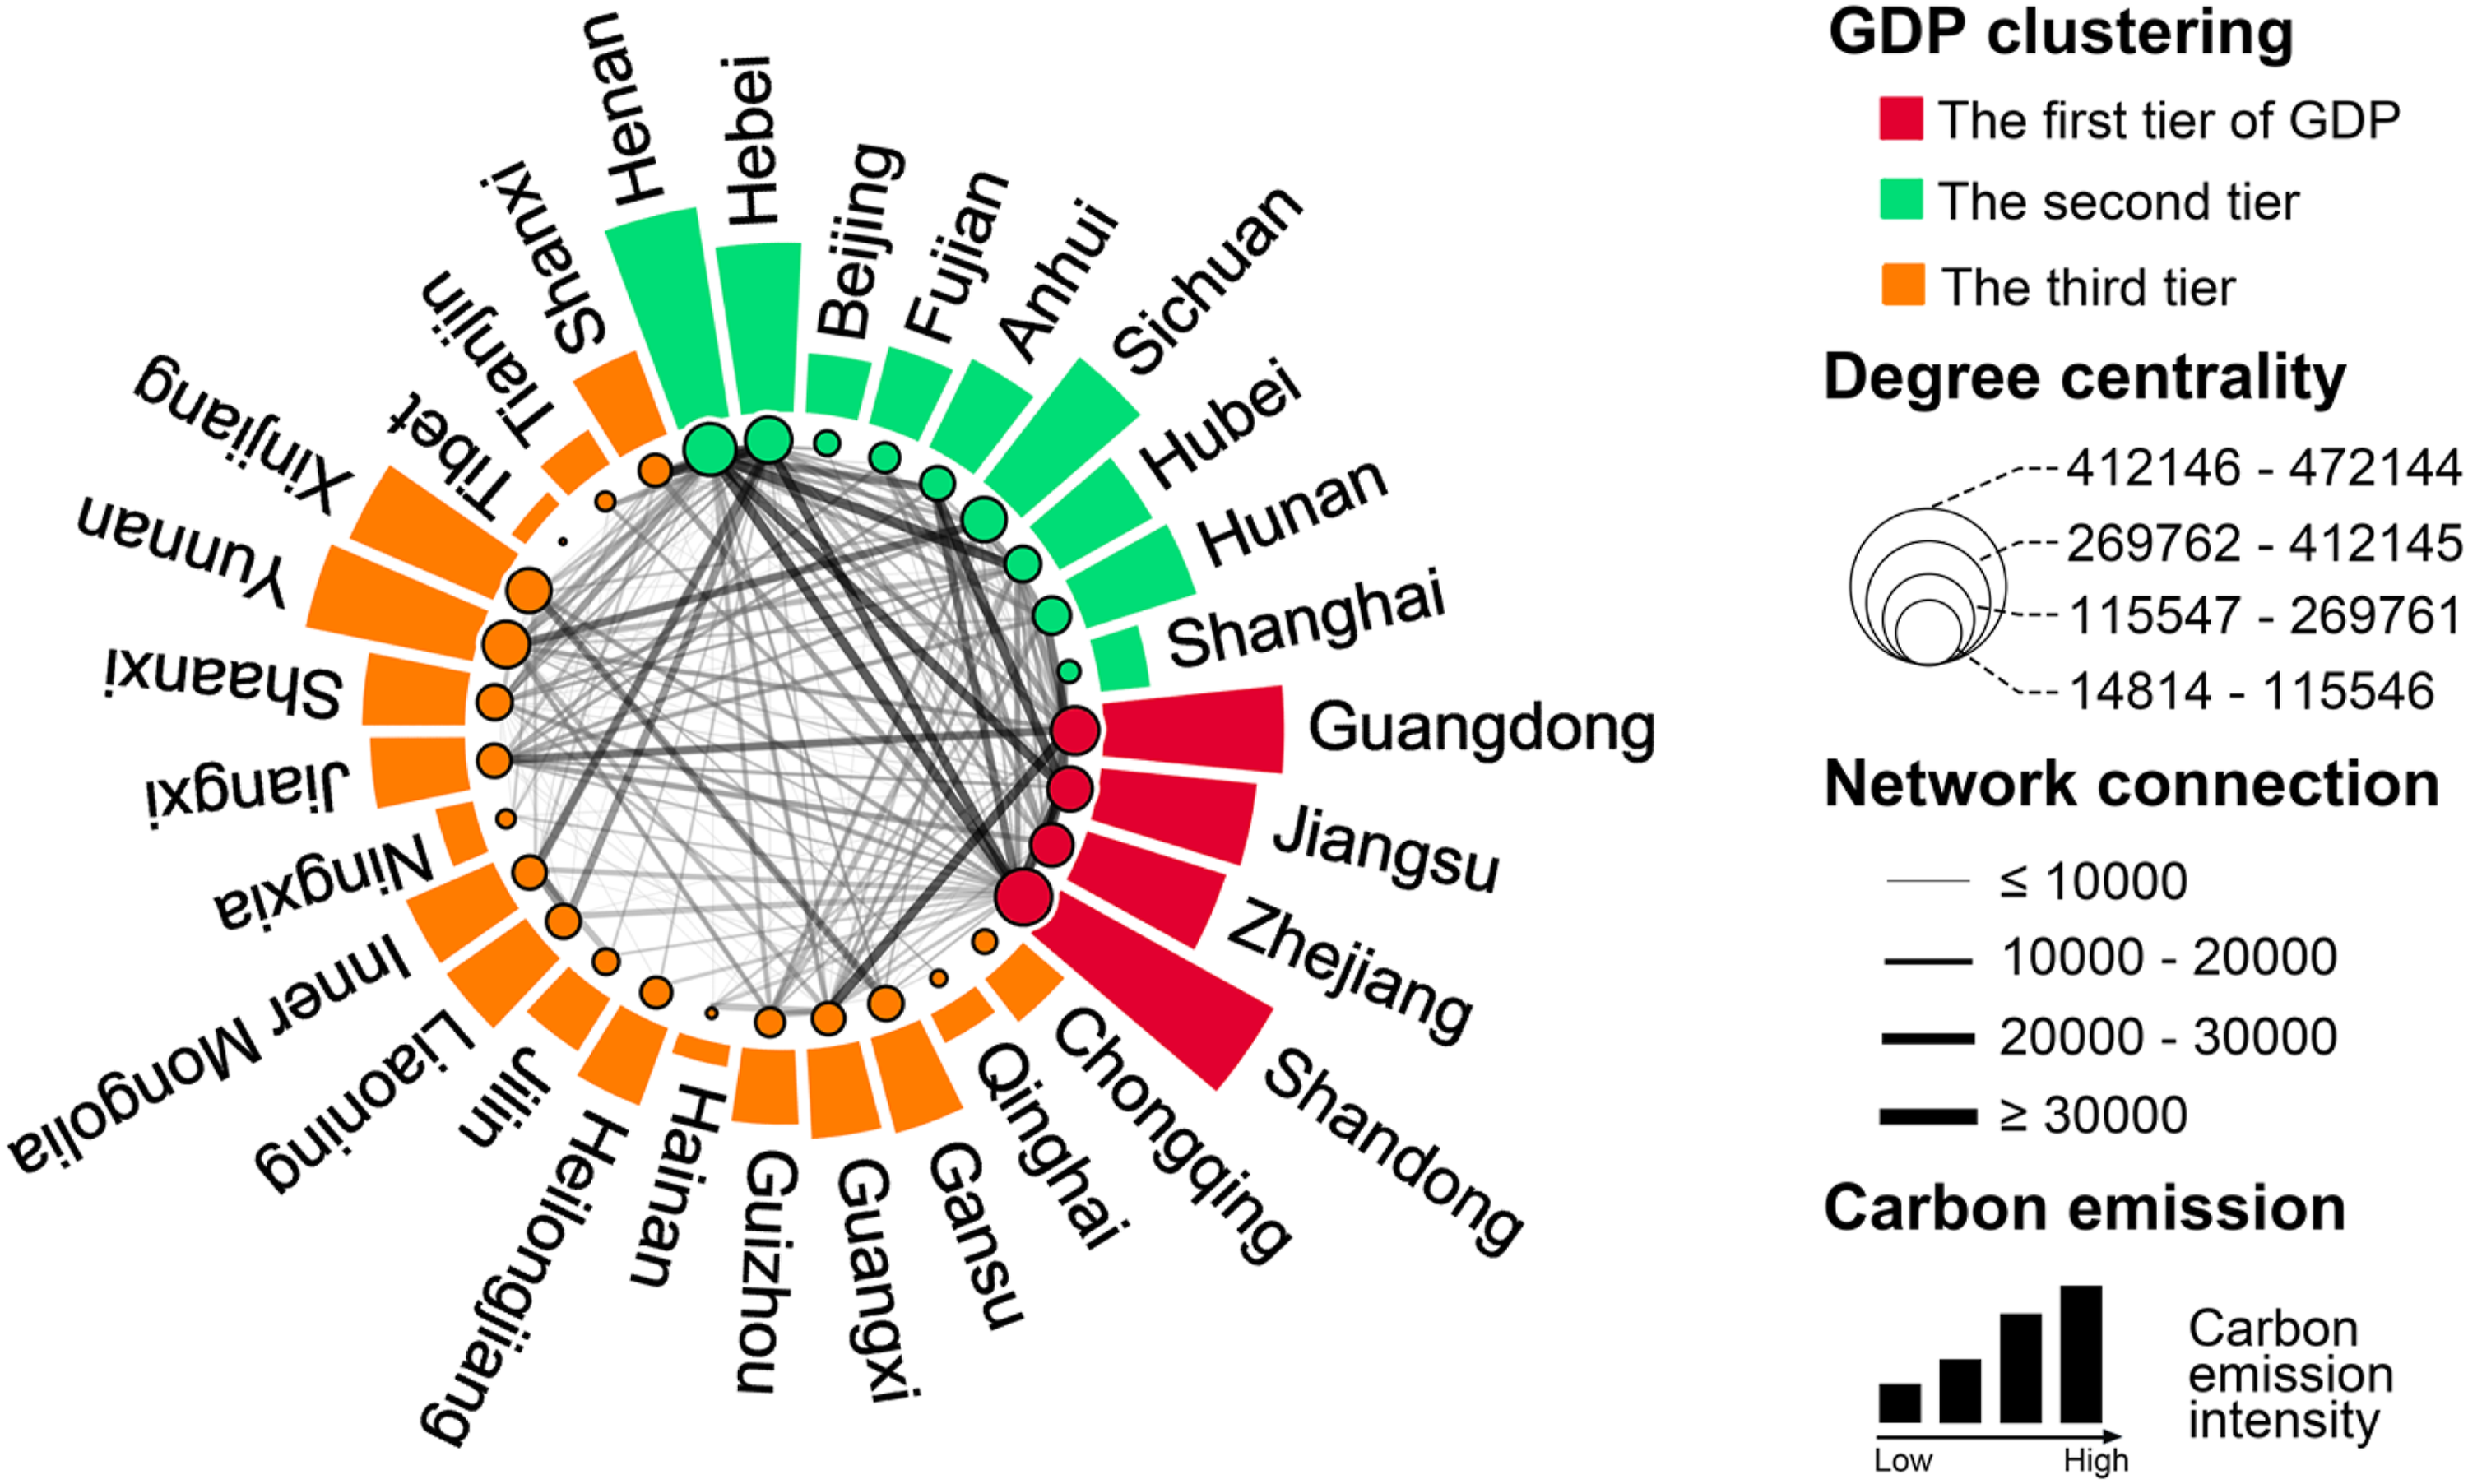
Figure 1 presents a cartogram-based view of China’s interprovincial freight circulation network and carbon-emission intensity. In Figure 1(a), each province is represented as a node on the cartogram. Node size is proportional to degree centrality, indicating each province’s hub role, and the outer ring summarizes the eight goods types. Edge color denotes the dominant commodity in interprovincial flows, while edge width indicates connection strength. The two-segment edge design shows two-way freight connections between provinces. The cartogram resizes provinces by freight-related carbon-emission intensity, so provinces with higher values appear larger. This design shows the national freight network and the expansion or contraction of carbon-emission areas in the same spatial frame. In Figure 1(b), graded shading is used to show provincial carbon-emission intensity more directly. This panel provides a clearer comparison of emission differences among provinces and further details the carbon-emission information shown in Figure 1(a). These emissions are estimated from the ton-kilometer turnover of road freight and standard emission factors for different truck types.
Figure 1 reveals a spatially heterogeneous freight circulation network and spatial inequality in carbon emissions. Central and eastern coastal provinces, especially Henan, Shandong, and Guangdong, stand out as key hubs with high freight volumes and large carbon footprints, as shown by their enlarged cartogram areas. These provinces also have high connectivity and diverse goods composition. Meanwhile, dominant freight types vary across provinces, but energy and fuels, agricultural products, consumer goods, and construction materials contribute much of the national flows. Moreover, specific goods categories drive different regional flow patterns. For example, minerals and metals and other categories show strong intra-regional movements. In contrast, agricultural products and consumer goods show broader and longer-distance interprovincial connections. Figure 1(b) further shows that carbon-emission intensity is uneven across provinces, with higher values concentrated in several key freight provinces.
Figure 2 presents the same system as a circular bar-based topology network view with socioeconomic information. Nodes and links represent provinces and the strength of their freight connections, respectively. The outer bars show carbon-emission intensity, with longer bars indicating higher intensity. Additionally, colors distinguish three GDP tiers (GDP clustering), effectively separating higher-GDP and lower-GDP provinces.
Figure 2 further highlights a clear core–periphery structure in the national freight system. First-tier GDP provinces in red (e.g., Guangdong, Jiangsu, Zhejiang, and Shandong) take central positions with higher degree centrality, connecting closely with second-tier provinces in green (e.g., Henan, Hebei, and Sichuan). By contrast, many third-tier provinces in orange (e.g., Tibet, Hainan, and Qinghai) are linked mainly through fewer and weaker connections, often relying on higher-tier provinces. Furthermore, within each GDP tier, connection strengths also vary. The outer bars indicate that carbon-emission intensity also differs across GDP tiers and network positions. Overall, this grouping suggests that stronger network connectivity and heavier carbon burdens tend to concentrate in provinces with higher socioeconomic levels.
In conclusion, by linking flows, network roles, and emissions, these graphics provide evidence for cross-provincial coordination on freight decarbonization. They support targeted interventions that reduce emissions without weakening distribution efficiency. Future reduction efforts should focus on high-emission hubs and key corridors, while considering how network organization differs across goods types. Ultimately, these approaches can support a more sustainable and efficient national logistics system in China.
Footnotes
Funding
This study was supported by the following projects: Construction System and Key Technologies of Grassland Human Settlements (YLXKZX-NGD-004), and Guangdong Basic and Applied Basic Research Foundation (2024A1515011547), Guangdong Philosophy and Social Sciences Planning Project (GD25CGG27), National Ethnic Affairs Commission Belt and Road Country and Regional Studies Center and the Japan Emergency Management Research Center (2025RBYJGL-2), Fundamental Research Funds for the Central Universities (QNMS2511).
Declaration of conflicting interests
The authors declared no potential conflicts of interest with respect to the research, authorship, and/or publication of this article.
Data Availability Statement
The freight circulation data used in this study were obtained from a fourth-party logistics (4PL) digital platform. Due to data purchase agreements and relevant confidentiality regulations, the original data cannot be publicly shared. However, to ensure academic transparency, partial data or data samples analyzed in this study are available from the corresponding author upon reasonable request.