
Abstract
Urban form plays a crucial role in shaping transportation patterns, accessibility, service provision, and energy consumption, among many other factors. This study examines the relationship between urban form and transportation energy use by developing a parametric model that simulates urban forms and their impact on travel distances. It explores various morphologies, including sprawling, elongated, and compact cities. The study defines the city’s profile, capturing its heterogeneity and spatial distribution of building heights. It considers five urban profiles: ‘needle’, ‘pyramid’, ‘pancake’, ‘bowl’, and ‘ring’. An interactive visualisation and calculator were designed using this parametric approach, offering an intuitive framework for systematically analysing trade-offs among different urban forms. Findings suggest that the city’s profile, along with sprawl and elongation, are the most influential factors in determining the total travel distance in the city.
Introduction
Urban form, understood as the physical forms and spatial arrangements of human settlements, plays a central role in shaping some of the most pressing sustainability challenges (Zhang et al., 2023). Among these, the influence of urban form on transportation systems and their associated energy use is critical, given that urban areas account for approximately 75% of global energy use and 70% of greenhouse gas emissions (International Energy Agency, 2018). The distances people travel daily are mainly determined by a city’s structure and are a key driver of urban energy consumption and related emissions (Kaza, 2020). Besides transport, the shape of a city and how it grows also drive other urban outcomes, such as the impact of heat waves (Mashhoodi and Muñoz Unceta, 2024), land cover change, and biodiversity loss (Seto et al., 2010). At the human scale, it profoundly affects the lived experiences of city residents, influencing mental and physical health outcomes (Miles et al., 2012), daily accessibility, and social cohesion (Bramley et al., 2009; Lenzi and Perucca, 2023). Yet the ways in which cities grow can result in urban forms that undermine both sustainability and quality of life (Duque et al., 2019). Unplanned city growth often leads to fragmented urban landscapes and social segregation (Brelsford et al., 2018; Legeby, 2010), where poor connectivity (Mihigo and John, 2022) and uneven access to essential services, such as education, water (Prieto-Curiel et al., 2025), healthcare, and sanitation (Corburn and Karanja, 2016), disproportionately impact the most vulnerable. Even planned cities often fall short of their ambitions (Jacobs, [1961] 1992), as the inflexibility of the plans, flawed execution, or a disconnect between the assumptions made in planning and residents’ real needs can all contribute to these shortcomings (Faria et al., 2013; Watson, 2009). Studying urban form is, therefore, essential to planning and building more equitable, resilient, and sustainable cities.
Specific urban form attributes, such as density and the spatial configuration, translate these spatial relationships into concrete mobility behaviours and emission patterns. Elongated and sprawling cities, characterised by low-density development and extended urban footprints, tend to increase average travel distances (Prieto-Curiel et al., 2023), foster car dependency, and elevate transportation-related energy use and emissions (Monteiro et al., 2024; Osorio et al., 2017). This spatial fragmentation not only reduces accessibility but also contributes to traffic congestion, time losses, and environmental degradation (Gössling, 2020; Resch et al., 2016). In contrast, compact cities concentrate amenities and services, shorten trip distances, and support more sustainable mobility options such as walking, cycling, and public transit (Batty et al., 2008; Foraboschi et al., 2014; Rossi-Hansberg et al., 2009). The idea of ‘compactness’ in urban form is also reflected in contemporary planning paradigms such as transit-oriented development and the 15-min city. While transit-oriented development promotes higher-density, mixed-use development around public transport nodes (Cervero, 1998; Cervero and Kockelman, 1997), the 15-min city framework advocates decentralising amenities so that residents can access essential services within a short walk or cycle (Bruno et al., 2024; Moreno et al., 2021). In addition to compact and transit-oriented paradigms, the ‘Hollow City’ (Maupu and Stransky, 2017) proposes an alternative spatial organisation to reduce energy demand. Ultimately, those urban paradigms aim to improve accessibility, shorten trip distances, and reduce dependence on private vehicles.
Beyond the horizontal extent, the vertical shape of cities, defined by building height and its spatial profile, plays a critical role in shaping transport energy outcomes. ‘Pyramid’ cities, characterised by dense, high-rise cores that descend into lower peripheries, are often associated with shorter per capita travel distances and greater transit accessibility (Lall et al., 2021; Zhou et al., 2022). In contrast, flat or ‘pancake’ cities, with uniformly low buildings spread evenly across the urban area, tend to promote longer trips, higher private vehicle use, and increased infrastructure demands (Lall et al., 2021; Zhou et al., 2022). Both pancake and pyramid cities were concepts developed to characterise the volume and layout of cities and to highlight relevant heterogeneities (Lall et al., 2021). Yet, despite this recognition, creating a unified analytical model that captures all relevant aspects of city form remains a significant challenge. While taller buildings require more energy for operations like heating, cooling, and vertical circulation (Godoy-Shimizu et al., 2018; Hamilton et al., 2017), their potential to reduce surface-to-volume ratios and enable compact land use often offsets these costs in dense environments (Bibri et al., 2020; Schläpfer et al., 2015). Moreover, the spatial distribution of building heights and open spaces significantly influences pedestrian accessibility, microclimates, and social cohesion, underscoring the multifaceted relationship between vertical urban form and urban sustainability (Schläpfer et al., 2015; Watson, 2009). Taken together, these insights underscore the need for a multidimensional understanding of urban morphology to optimise accessibility, reduce energy demand, and enhance urban sustainability (Biljecki and Chow, 2022).
Previous research has attempted to approximate this complexity through simplified models of spatial structure. Some studies rely on analytical approximations to describe interactions among spatially distributed elements (Ribeiro et al., 2024), while others examine how morphological features like sprawl and elongation scale with city size (Prieto-Curiel et al., 2023). Parallel efforts have introduced typological and classification frameworks to organise the multiple dimensions of city morphology based on spatial indicators (Biljecki and Chow, 2022) and literature-based taxonomies (Zhang et al., 2023). While these approaches yield valuable insights, they have analysed urban form beyond the possibility of controlling and better designing cities. For instance, the height of buildings in pyramid cities has been modelled as a function of city-wide factors, such as population and income, with wealthier and larger cities achieving taller peaks in the centre (Lall et al., 2021). Yet, these many elements mask key real-world constraints and interactions among urban form characteristics that ultimately shape travel patterns. Consequently, it remains unclear how to integrate these partial insights into a comprehensive model of an optimal urban shape that minimises energy and mobility burdens, capturing key dimensions of urban form in a way that is comprehensive and directly interpretable by planning practitioners. This study addresses this gap by developing a parametric simulation explicitly designed to quantify the independent effects of urban form attributes and translate these complex relationships into an intuitive model for decision-making.
The model focuses on how urban form influences travel distances within a city. While transportation is only one aspect of urban sustainability, its impact on commuting time and share in total energy use and carbon emissions is substantial. To quantify how different urban shapes influence travel behaviour, we develop a parametric model that varies elongation, sprawl, average building height, population size, and vertical profile to generate synthetic layouts including configurations in which building heights vary with distance to the city centre. Rather than replicating the full complexity of real urban systems (such as transport modes, congestion, and heterogeneous infrastructure), the model functions as a conceptual laboratory that systematically varies individual form parameters to isolate their spatial effects and examine their relative influence on mobility outcomes. For each configuration, we simulate commuting journeys and calculate the average travel distance as a proxy for mobility-related energy demand (Prieto-Curiel et al., 2023). The results confirm that a compact, round city reduces travel distance, and that taller, more pyramidal shapes further reduce it. Compared with models that rely on analytical approximations, our parametric approach captures nonlinear effects and interactions among characteristics, providing tractable and comprehensible insights for planning applications. An interactive version is available at https://vis.csh.ac.at/cities-morphology, where users can explore different city profiles and calculate mobility indicators, such as travel distances and traffic volumes, for various configurations.
Literature review
Urban form is widely recognised as a key factor shaping urban performance and sustainability (Echenique et al., 2012). Empirical studies over the past decades have explored these relationships in depth. Urban form has been shown to shape travel behaviour, energy use, congestion, and air quality through its influence on spatial structure and accessibility (Ewing and Hamidi, 2015). Other studies link compactness and density with urban heat island intensity (Zhou et al., 2013), public health (Frank and Engelke, 2001), social cohesion (Bramley et al., 2009), and subjective well-being (Mouratidis, 2019). Together, these findings suggest that the spatial organisation of cities is deeply intertwined with urban performance and quality of life. Since transportation is closely related to sustainability in terms of energy consumption and carbon emissions, many of these studies focused on how urban form affects mobility patterns. Evidence consistently shows that compact or monocentric cities tend to have shorter travel distances and lower energy use, while sprawling or highly elongated forms often increase travel demand and infrastructure costs (Ewing, 1997; Kenworthy and Newman, 1990).
The term urban form, though widely used, spans multiple spatial scales and disciplinary perspectives. At the microscale, urban morphologists and designers examine the configuration of streets, blocks, and buildings (Kropf, 2018), exploring how the built fabric shapes spatial experience and local interaction (Aiello et al., 2025; Lynch and Rodwin, 1958; Oliveira, 2016). At the macroscale, urban form refers to the overall spatial structure or shape of the city (Sharifi, 2019; Su et al., 2021). This distinction is crucial, as each scale reflects different processes and policy implications. Micro-form relates to design quality and liveability, while macro-form is closely tied to efficiency, mobility, and energy use. In this study, we focus on the overall city shape and explore how the macro-scale configuration influences travel distances.
From a practical perspective, planners and policymakers have long sought to guide urban growth toward more sustainable forms, including several planning movements from Garden City to Eco-Urbanism (Sharifi, 2016). Recognising how urban form shapes travel and energy use, planners have introduced policies to shape city development through density controls, zoning regulations, and growth management (Cervero, 1998; Talen, 2013), influencing both horizontal and vertical dimensions of a city. Yet, many studies find that such interventions deliver mixed or limited results in achieving specific outcomes, such as reducing travel distances, vehicle use, carbon emissions, and energy consumption (Fan and Chapman, 2022). Despite extensive research and the common belief that ‘compact is better’, there is no clear consensus on what constitutes an optimal urban form. Its impacts depend heavily on local context and the complex interplay among factors such as density, building height, and population distribution.
Researchers have examined different dimensions of urban form to understand their influence on urban performance. These studies often distinguish the horizontal and vertical dimensions (Biljecki and Chow, 2022; Zhang et al., 2023). Horizontally, urban form is often described by its spatial extent, shape, and density distribution, using indicators such as compactness and sprawl indexes (Tsai, 2005), elongation (Prieto-Curiel et al., 2023), and monocentricity (Meijers, 2008), which describe how urban population and economic activities spread in space and shape the efficiency of movement and infrastructure. Vertically, building height, number of floors, total floor area, or floor-area-ratio capture vertical density (Lall et al., 2021; Zhou et al., 2022).
Despite these advances, many studies still treat these dimensions separately or focus on typological classification rather than on integrated modelling (Zhang et al., 2023). Existing approaches often describe urban form rather than explaining how overall spatial configuration shapes urban outcomes (Biljecki and Chow, 2022). This fragmentation echoes earlier attempts to mathematically describe city form as a whole, which showed that, while certain scale-dependent regularities exist, no simple geometric model can fully capture the irregularity and heterogeneity of real urban structures (Longley et al., 1991). Later studies explored optimisation and analytical formulations, but the complex interactions among spatial, vertical, and demographic factors make such generalisation extremely difficult (Ribeiro et al., 2024).
Faced with these challenges, researchers have increasingly turned to simulation and computational modelling to study urban form. Recent approaches propose interactive frameworks that iteratively test and compare design scenarios, linking physical form with simulated performance outcomes (Urech et al., 2022; Vermeulen et al., 2013). While current simulations offer many insights, few allow planners or citizens to adjust urban form, instantly see its effects, and apply these models across different cities. The complexity of urban systems also makes it challenging to communicate planning outcomes intuitively, thereby limiting public understanding and participation. Building on these developments, this study introduces an interactive simulation tool that allows users to explore ‘what-if’ scenarios and visualise how changes in form influence mobility. We expect that our solution will be useful both in high-level policy debates among urban planners and decision-makers, in communication and engagement with the wider public, and in educational settings as well.
Methods
To capture how different urban forms affect commuting distances, we simulate cities with varying morphologies and measure travel time within them. Our modelling strategy is driven by the need to quantify various aspects of urban form in a context where experimental approaches are limited, interactions among numerous variables are complex, and commuting distances cannot be measured analytically.
Modelling virtual cities
We model cities as a street network N = (V, C) and the heights of the buildings H. Here, V = {v i , v j , … } represents the set of street crossing positions in a two-dimensional Euclidean space. The set of undirected edges between crossings is denoted by C = {c i , c j , … }, and the edges correspond to the streets of our city, whereas ‖c i ‖ = ‖v i − v j ‖ is the length of the street. Each building (including its size, shape, and location) is described by the four streets that surround the property. In the modelled cities, each building is surrounded by four streets, and each crossing is part of at most four properties. Hence, N is a quad mesh, where each property is a face, each street crossing is a vertex, and each street is an edge.
We model city layouts based on seven parameters. Four parameters primarily define the physical layout and shape of the city (Figure 1): elongation, sprawl, average building height, and city profile; and three parameters relate to the city’s population and the characteristics of its residential buildings: population size, the number of people living in a building, and floor area per resident. Effect of four key parameters on the urban form: elongation (E), sprawl (S), profile (W) of a city, and average building height (F).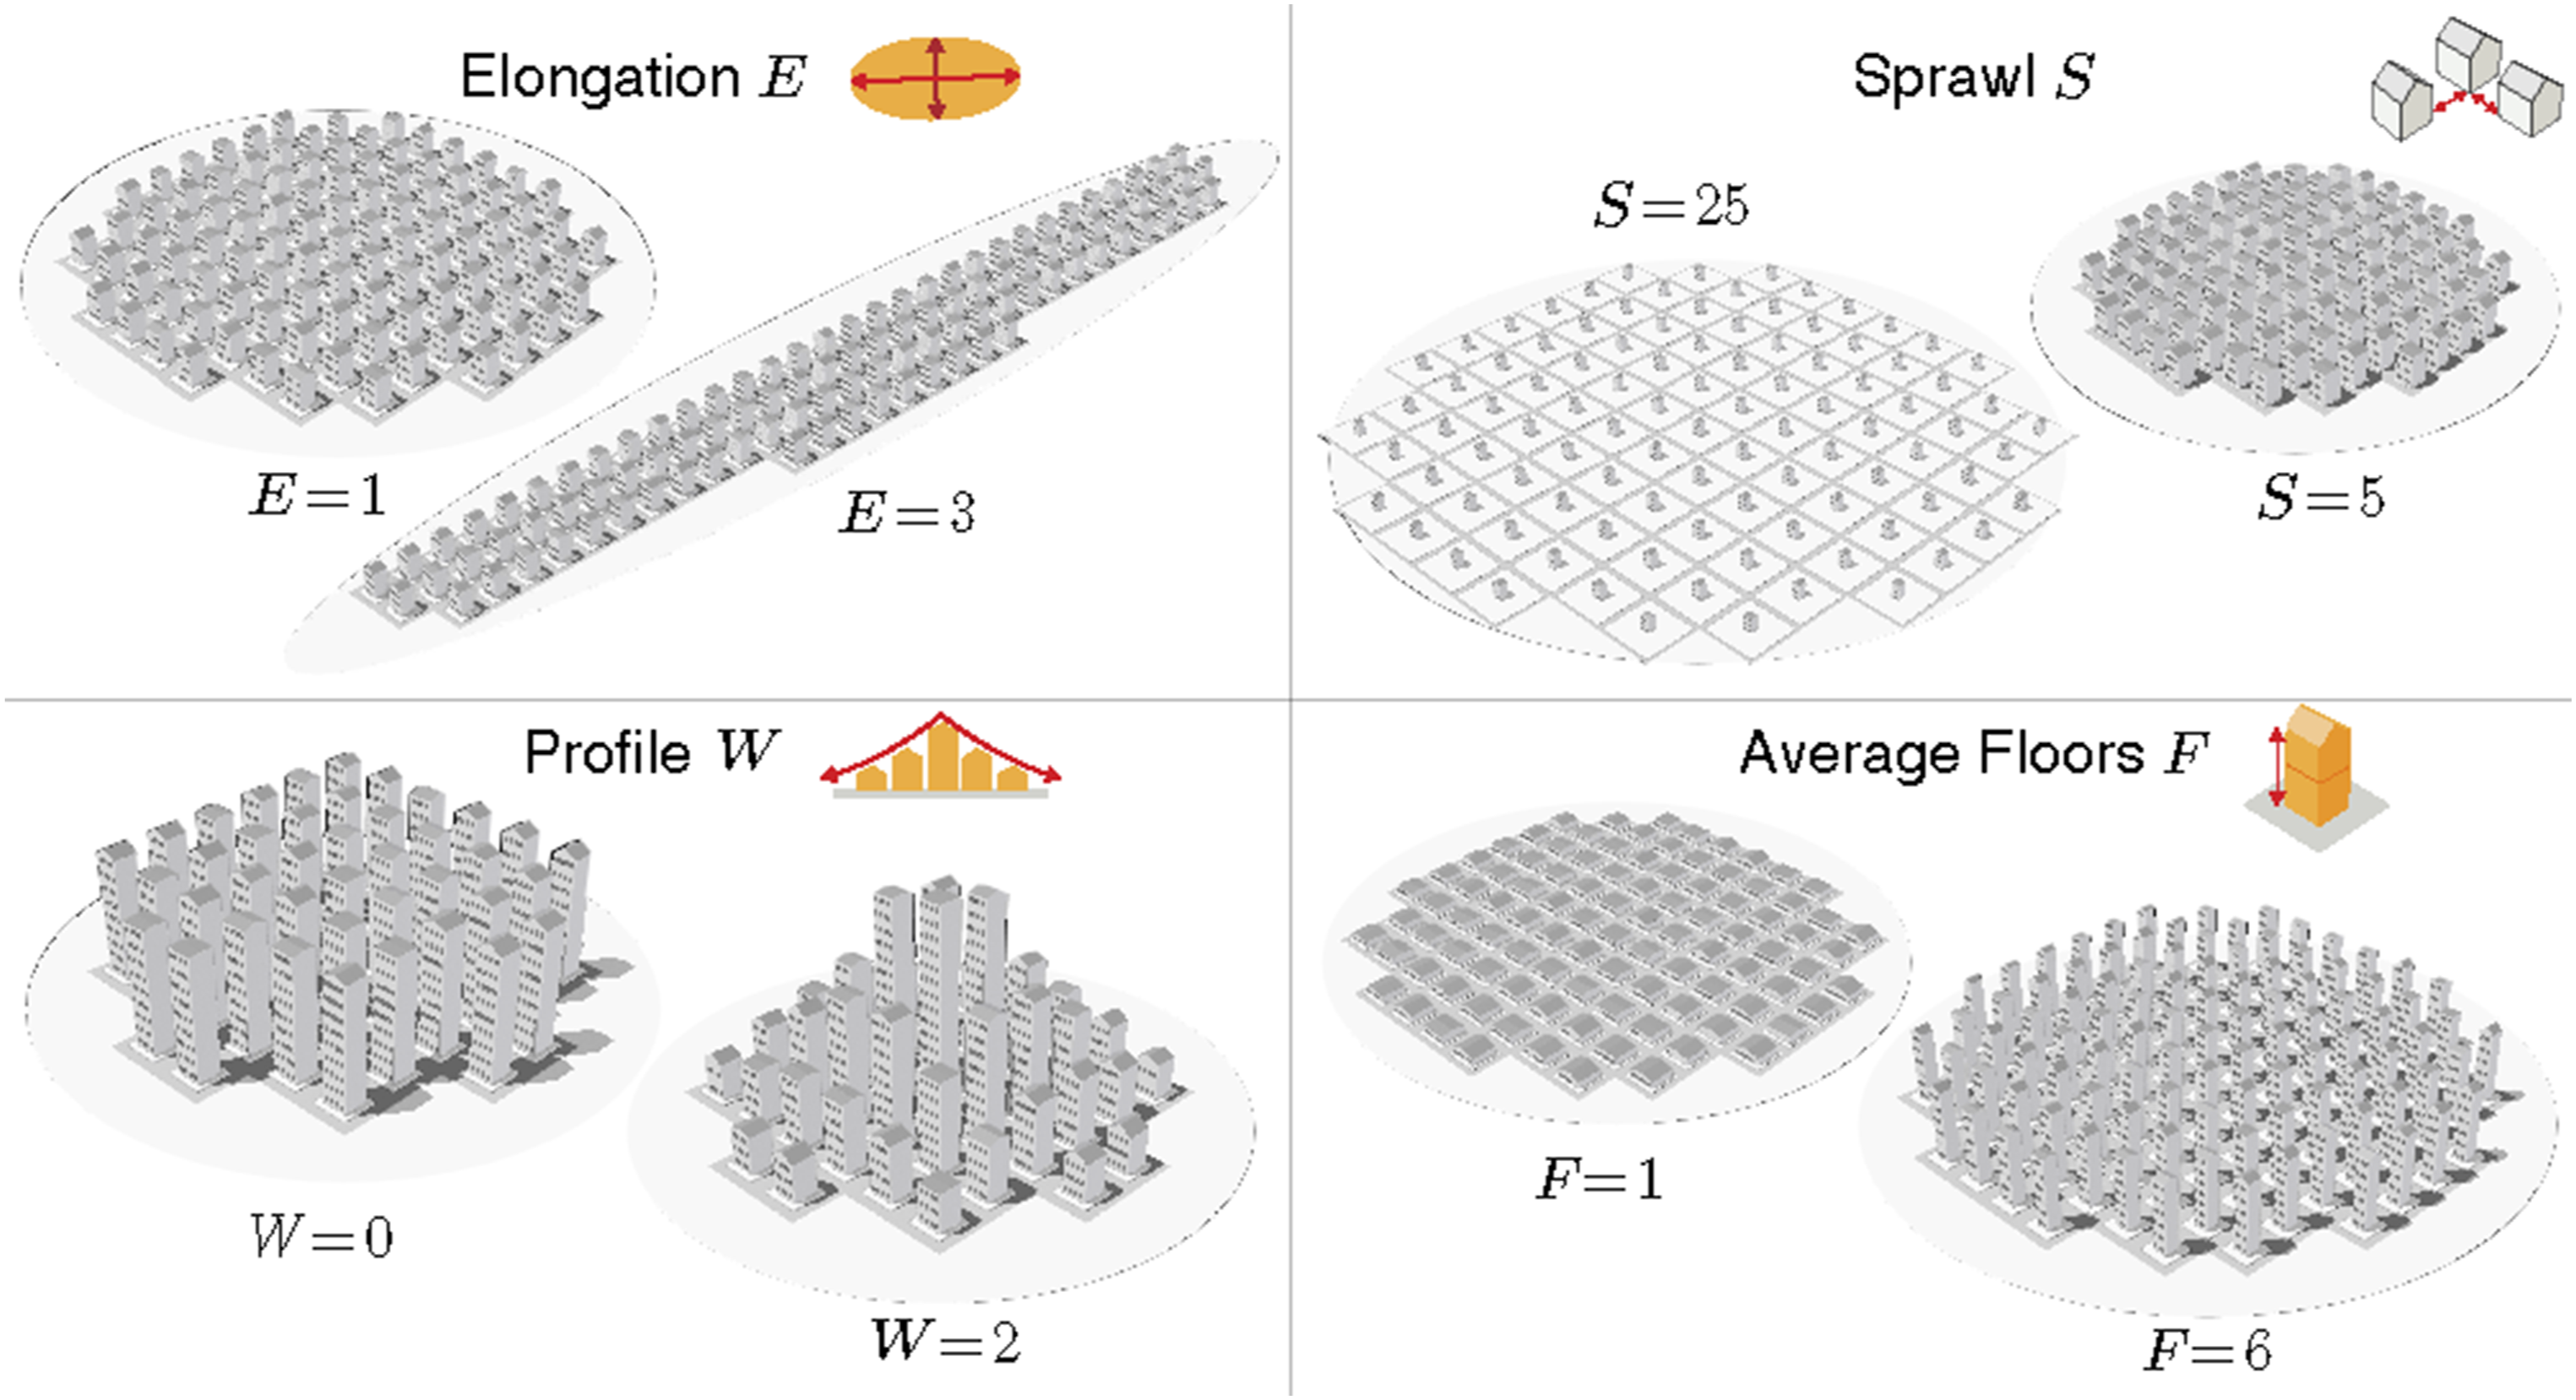
The elongation of a city, denoted by E, captures its horizontal shape and is defined as the ratio between the major (M) and minor (m) axes of the ellipse enclosing the city (Prieto-Curiel et al., 2023). A value of E = 1 corresponds to a circular city, while larger values indicate increasingly elongated or elliptical forms.
The sprawl, denoted by S, characterises the degree of dispersion of buildings within the urban area. It is measured as the average distance between neighbouring buildings, expressed in metres, and given by
The average building height, denoted by F, refers to the mean number of floors per building across the city, assuming uniform floor-to-floor height. In our model, an increase in F corresponds to a decrease in the footprint of individual buildings, maintaining the total residential volume per capita constant.
The population size, denoted by P, specifies the total number of residents in the simulated city and determines the aggregate demand for interior space. The number of residents per building, denoted by B, sets the average number of individuals housed within a single building. Together with P, this parameter defines the number of buildings required to accommodate the population. The floor area per resident, A, specifies the average floor space used by a resident. Together with F and B, it determines the footprint of individual buildings. Taken together, the parameters S, F, P, B, and A determine the overall building footprint of the city.
The profile of the city is denoted by W. It is a key parameter that defines if the building heights are evenly distributed in the city (forming a flat or ‘pancake’ city), if there are taller buildings in the centre (forming a ‘pyramid’ city), or if, inversely, there are shorter buildings in the centre and taller buildings by the periphery (forming a ‘bowl’ city). For extreme values of W, we obtain a ‘needle’ for large values of W ≫ 0 or a ‘ring’ for negative values of W ≪ 0 (Figure 2). Different values of the profile of a city (W) result in different typologies, which we classify into five: a ring, a bowl, a pancake, a pyramid, and a needle city.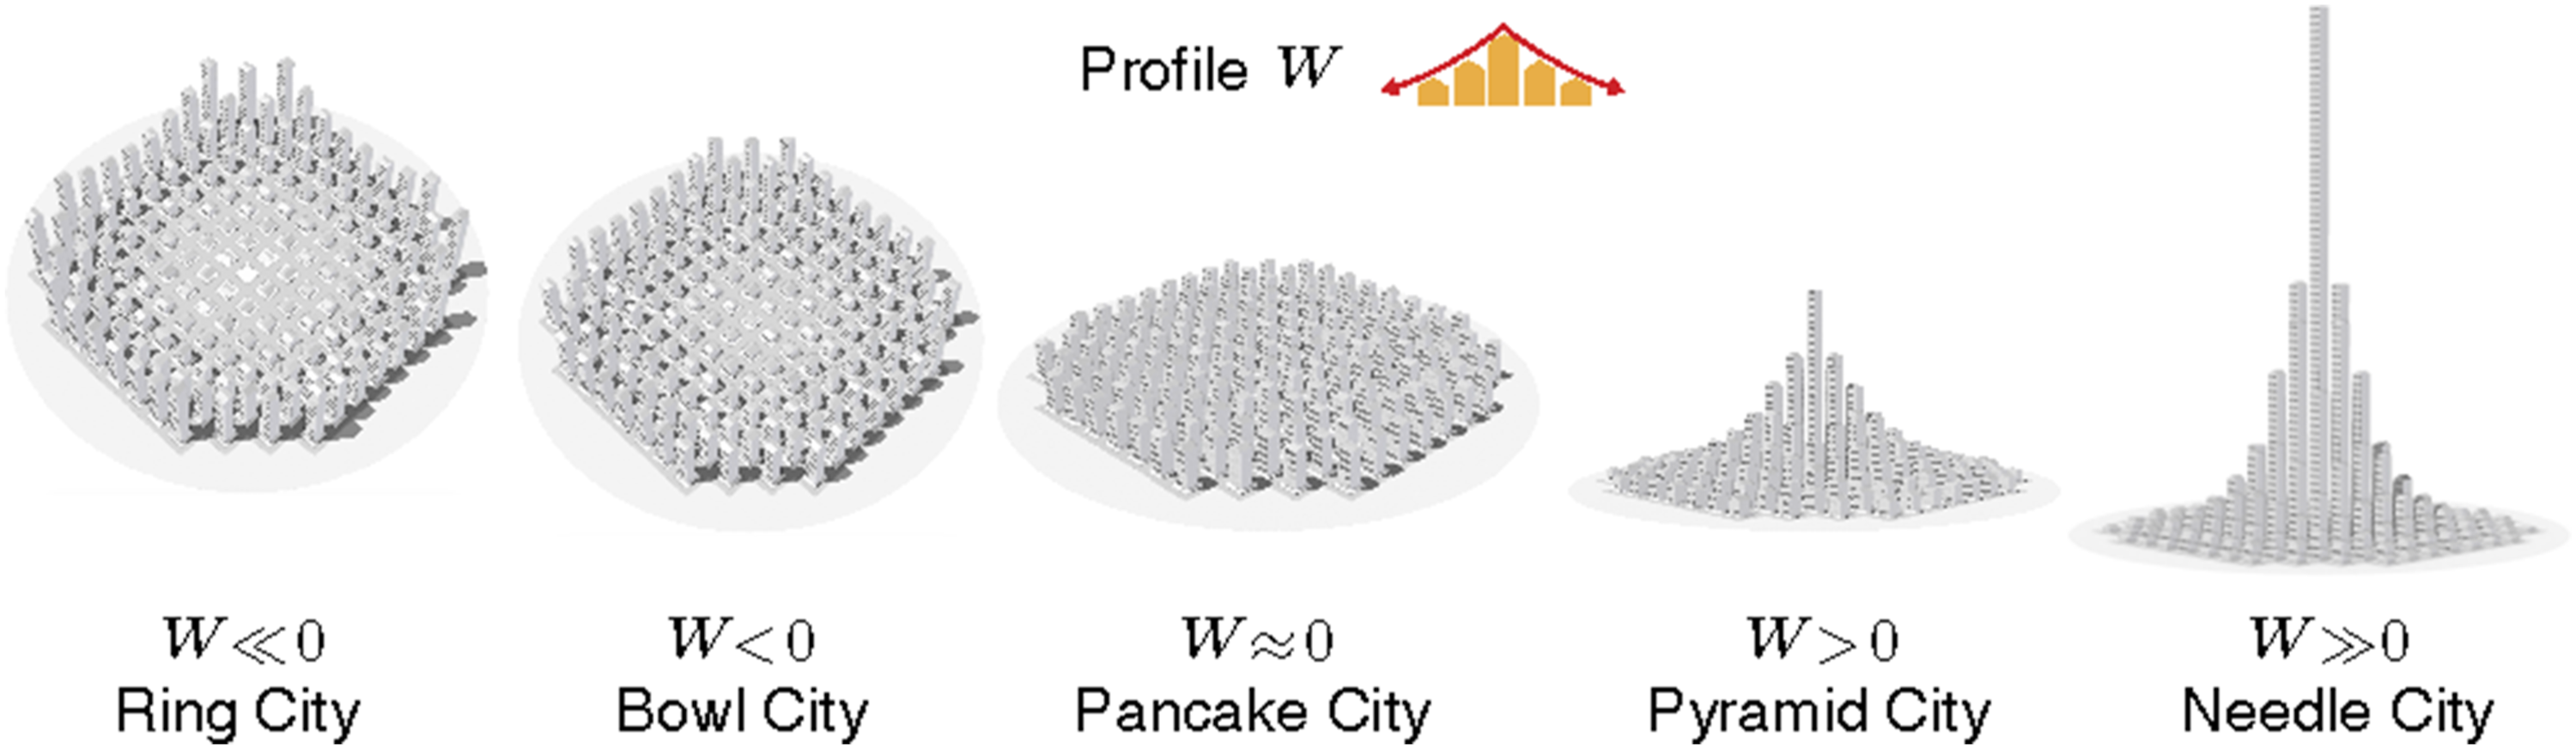
We consider the height of buildings in a city to be a function of the (appropriate) rescaled distance from the city centre. For some location at distance d, we vary the height H(W, d) according to the profile parameter W as

Based on equation (1), the ratio between the height of the tallest and shortest building in the city is R H = 2|W|. A stereotypical city in the USA, for example, with skyscrapers in the centre and single-story detached homes in the suburbs, corresponds to R H ∼ 50, implying W ∼ 5 − 6. Physical constraints on real buildings using current construction technologies constrain R H ≤200, meaning that |W| ≤ 7.6. However, we allow even higher values of |W| in line with the probabilistic interpretation of H in the simulations, to explore the conceptual relationship between profile and travel distances (although in real cities, a range of constraints limits |W| to smaller values). Most real-world cities are somewhere between the ‘bowl’ and ‘pyramid’ cases, while it is instructive to consider how travel distances would change in the ‘extreme’ cases for very small or very large values of W (Figure 2).
While the model captures macro-level morphological features of a city, it does not aim to realistically reproduce the complexity of the micro-level layout, such as the presence of ‘empty’ areas (parks or plazas) or ‘barriers’ (rivers, highways, railways, etc.) that can have substantial effects on individual travel patterns (Aiello et al., 2025). However, the macro-level effects of such features can be incorporated by adjusting the model parameters to reasonably reproduce average densities.
We illustrate the effect of each parameter on the inner-city travel distance, measured as the average distance a person must travel from one arbitrary point to another in the city. To compute this for a single city, we sample 100,000 pairs of positions and compute the average distance between them. Repeating this process, while varying a single city parameter, allows us to observe its effect on travel distance.
Computing the urban morphology
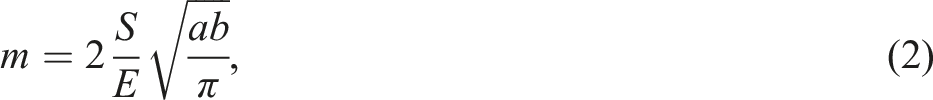
Based on the parameters, we first construct the network N and the corresponding building heights H. Then, we define an ellipse that encloses the whole city. The size of the ellipse depends on S and the footprint of the individual buildings a given as a = AB/F. Based on a and the number of buildings b = ⌈B/P⌉, we compute the ellipse characterised by its minor extension m and major extensions M as

We limit the city’s layout to equal long c with a length of
To compute the average travel distance of a city, a proxy for travel-related energy consumption (Prieto-Curiel et al., 2023), we sample 100,000 journeys in N. Each journey has a randomly selected starting and endpoint v i , v j ∈ V. The probability that a street crossing v i is selected is proportional to the average number of floors of all neighbouring buildings. The city has a regular grid, and the distances between the start and endpoints are measured. We use the Manhattan distance to capture how a person might navigate the streets and highways (rather than cutting through blocks and buildings). The resulting average travel distance differs from the average length of all possible shortest paths because not all v are equally likely to be picked for a city with W ≠ 0.
The source code of the model implementation is publicly available at https://github.com/TobiasBat/Cities-Morphology. The repository includes all necessary resources to reproduce the experiments outlined in this paper, our implementation of the parametric city model, and the source code of the visualisation page, Cities Morphology. It further provides the resources required to run simulations for additional cities beyond those considered in this study.
Results
To anchor our simulation framework in observed parameter values, we empirically derive them from Vienna data. The total number of residents (P = 2 million) and the average area per resident (A = 38 m2) were obtained from official statistics on Vienna’s housing and population (Stadt Wien, 2023). The average number of persons per building (B = 11.4) was calculated from data on residential buildings and housing units (Stadt Wien, 2023). The sprawl was set to S = 21.2 m based on an estimated total street width of 20 m and an additional 10% of an average building side
Impact of urban form on travel distances
To isolate the effects of specific urban shapes, we vary four key shape parameters while holding other factors constant: sprawl (S), elongation (E), average building height (F), and profile (W). Starting with the set of parameters derived for the city of Vienna, we alter the values of the parameters individually by sampling values within each parameter range (Figure 3). We vary the elongation from E = 1, observed when the city forms a circle, to E = 5, observed for a very elongated form. The sprawl ranges from S = 0 m, corresponding to a compact city, to S = 60 m, indicating a highly sprawled city. The average number of floors ranges from F = 1 for a flat city to F = 20 for a more vertical layout. Since we maintain a constant number of residents per building, this variation also corresponds to adjusting the building’s footprint accordingly. Finally, the profile of the city ranges from W = −20 (resulting in a ring-shaped city) to W = 20 (a needle-shaped city). Effect of urban form parameters (horizontal axis) on the average commuting distance in km in the city (vertical axis). The average travel distance of the base configuration (which resembles Vienna) is shown as a blue circle.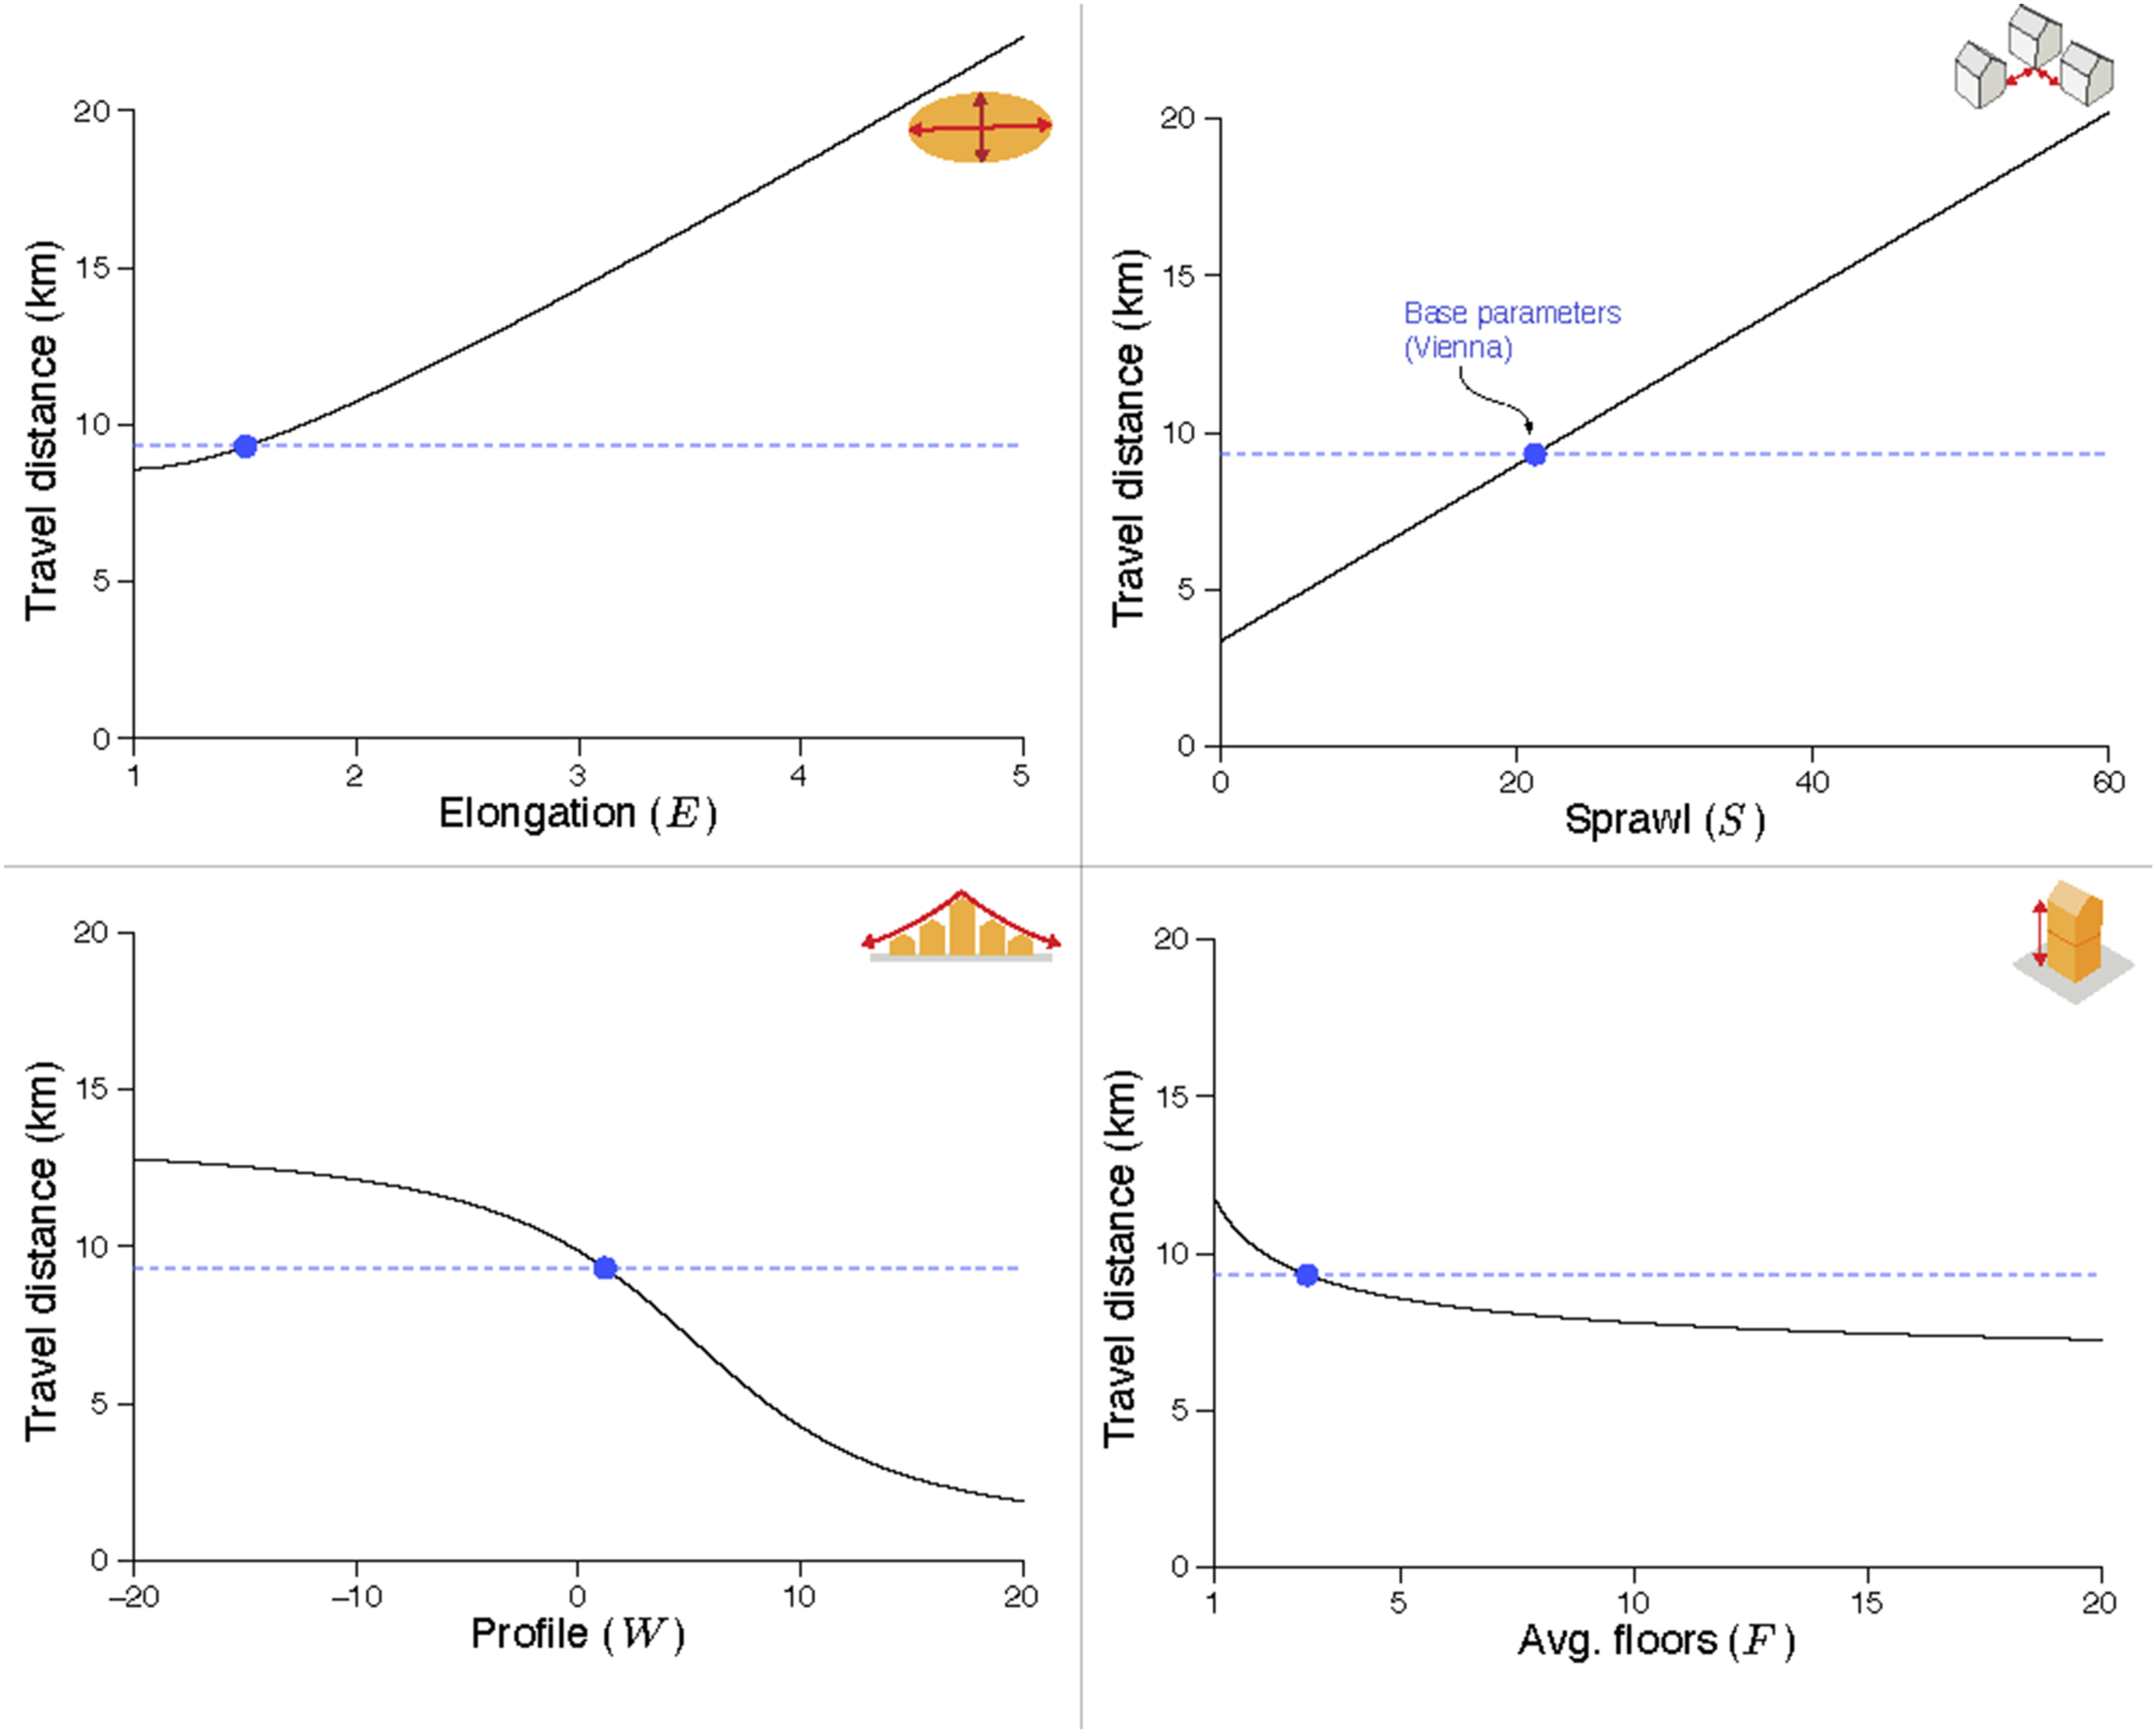
Our analysis reveals a clear hierarchy among urban form parameters in determining travel efficiency. A city’s internal density distribution, its vertical profile, is the most powerful factor, followed by its elongation. These parameters have a stronger influence on commuting distances than generalised urban sprawl or average building height, which produce more moderate, linear effects. For example, reducing the travel distance of a moderately peaked city profile could not be achieved through vertical construction or sprawl reduction alone within the tested parameter ranges. This hierarchy underscores that strategic spatial organisation is a more effective tool for influencing urban mobility than generalised densification.
The city’s profile proved to be a critical factor. Concentrating density in the urban core to create a ‘pyramid’ shape yielded the largest efficiency gains, with moderately peaked profiles (W ≈ 2 − 3) already reducing distances by 20–25%, while extreme values in a ‘needle’ city (W >15) reducing the average travel distance by up to 80% compared to a uniform height distribution. This is because a dense core minimises the distance between a high volume of origins and destinations. Conversely, ‘ring’ cities, which push density to the periphery (W < − 15), degraded accessibility, increasing commute distances by over 40%. The relationship is non-linear, with the most significant gains or losses occurring as the profile deviates moderately from a flat distribution. This non-linearity is reflected in the high gradient of the curve around W ≈ 0 (Figure 3).
The elongation also degrades travel efficiency with a non-linear impact. While an increase from a circle (E = 1) to an ellipse with a 2:1 axis ratio increased travel distances by roughly 25%, further elongation caused this penalty to accelerate sharply, rising by roughly 68% at E = 3 and more than doubling at large values. This suggests a critical threshold beyond which elongated urban forms become fundamentally inefficient in average point-to-point distances. However, highly elongated or linear city forms can be intentionally designed to favour transit corridors where longer physical commutes do not necessarily translate to a proportional increase in carbon footprint (Rabinovitch, 1992). No saturation is observed within the tested range. However, a maximum travel distance is reached for an extreme value of E when all buildings are arranged in a single row (similar to the planned city The Line, in Saudi Arabia), suggesting that continued elongation consistently degrades network efficiency and complicates the provision of uniformly accessible urban services (Prieto-Curiel and Kondor, 2023).
Compared to the effects of shape and profile, sprawl (S) and average building height (F) exhibited seemingly linear relationships with travel distance. Urban sprawl, which radially expands the urban fabric by introducing unused space between buildings, uniformly increases travel distances. Increasing sprawl from S = 0 to S = 25 m raises the average travel distance from 3.4 km to 4.9 km, an increase of approximately 44%. The effect is consistent across the entire tested range (Figure 3). No saturation is observed, indicating that sprawl is a reliable, if predictable, source of urban inefficiency. Conversely, vertical densification by increasing average building height compresses the urban footprint, shortening commute paths. However, this strategy is subject to significant diminishing returns. The greatest accessibility benefits are when transitioning from single-story to low-rise developments (e.g. F = 3 floors), which can shorten travel distances by over 10%. Further increases to mid- and high-rise structures yield progressively smaller gains (Figure 3). For instance, expanding from 3 to 12 floors reduces the average distance by approximately 5%. This suggests that beyond a certain threshold, increasing building height alone is less effective at improving accessibility. However, taller buildings in real cities typically house more residents. Increasing residential occupancy per building also substantially reduces travel distances, indicating that the combined effect of vertical growth and increased density may offer even greater benefits for reducing urban travel distances (details in Supplement Materials C).
Links between urban form and mobility
The shape of a city directly affects how people commute. In highly sprawled and elongated cities, commutes tend to be longer, requiring more energy (Prieto-Curiel et al., 2023), but also discouraging people from walking or cycling (Berrill et al., 2024). Here, we estimate the share of journeys that are feasible to walk or cycle. We take a city like Vienna (with two million inhabitants and fixed parameters such as an elongation of E = 1.5, and an average area per resident A = 38 m2, and so on), and set a threshold κ w = 1 km for walking distances and a threshold of κ c = 3.8 km for cycling distances (Langer et al., 2023). These two thresholds were constructed by considering maximum travel time and average travel speeds for the two forms of active mobility (Pajares et al., 2021), and the resulting cut-off points are frequently used to quantify how much of a city is reachable on foot or by bicycle (Langer et al., 2023). In the test, we alter the profile of a city W and calculate the share of trips that fall below the threshold for walking and cycling.
For a city that occupies the surface of Vienna and considering possible journeys in that city, we find that only a small share of journeys are feasible by walking (approximately 1%) and cycling (less than 15%). Thus, the results show that a city of two million people is already sufficiently large to rely heavily on public transport for sustainable mobility (Prieto-Curiel and Ospina, 2024). Additionally, results show that a city’s profile has a significant impact on the share of journeys that are feasible to walk or cycle (Figure 4). Cities with a higher profile W (so in the shape of a pyramid) have a much higher share of trips that can be done by bicycle and on foot compared to a pancake city with a more even distribution of building height. Effect of urban profile W (horizontal axis) on the share of commuting journeys that are feasible by walking (yellow) and cycling (orange) in a city with the parameters observed in Vienna (vertical axis). Cities with a higher profile have a larger share of journeys that are feasible by Active Mobility (walking and cycling) (Prieto-Curiel and Ospina, 2024).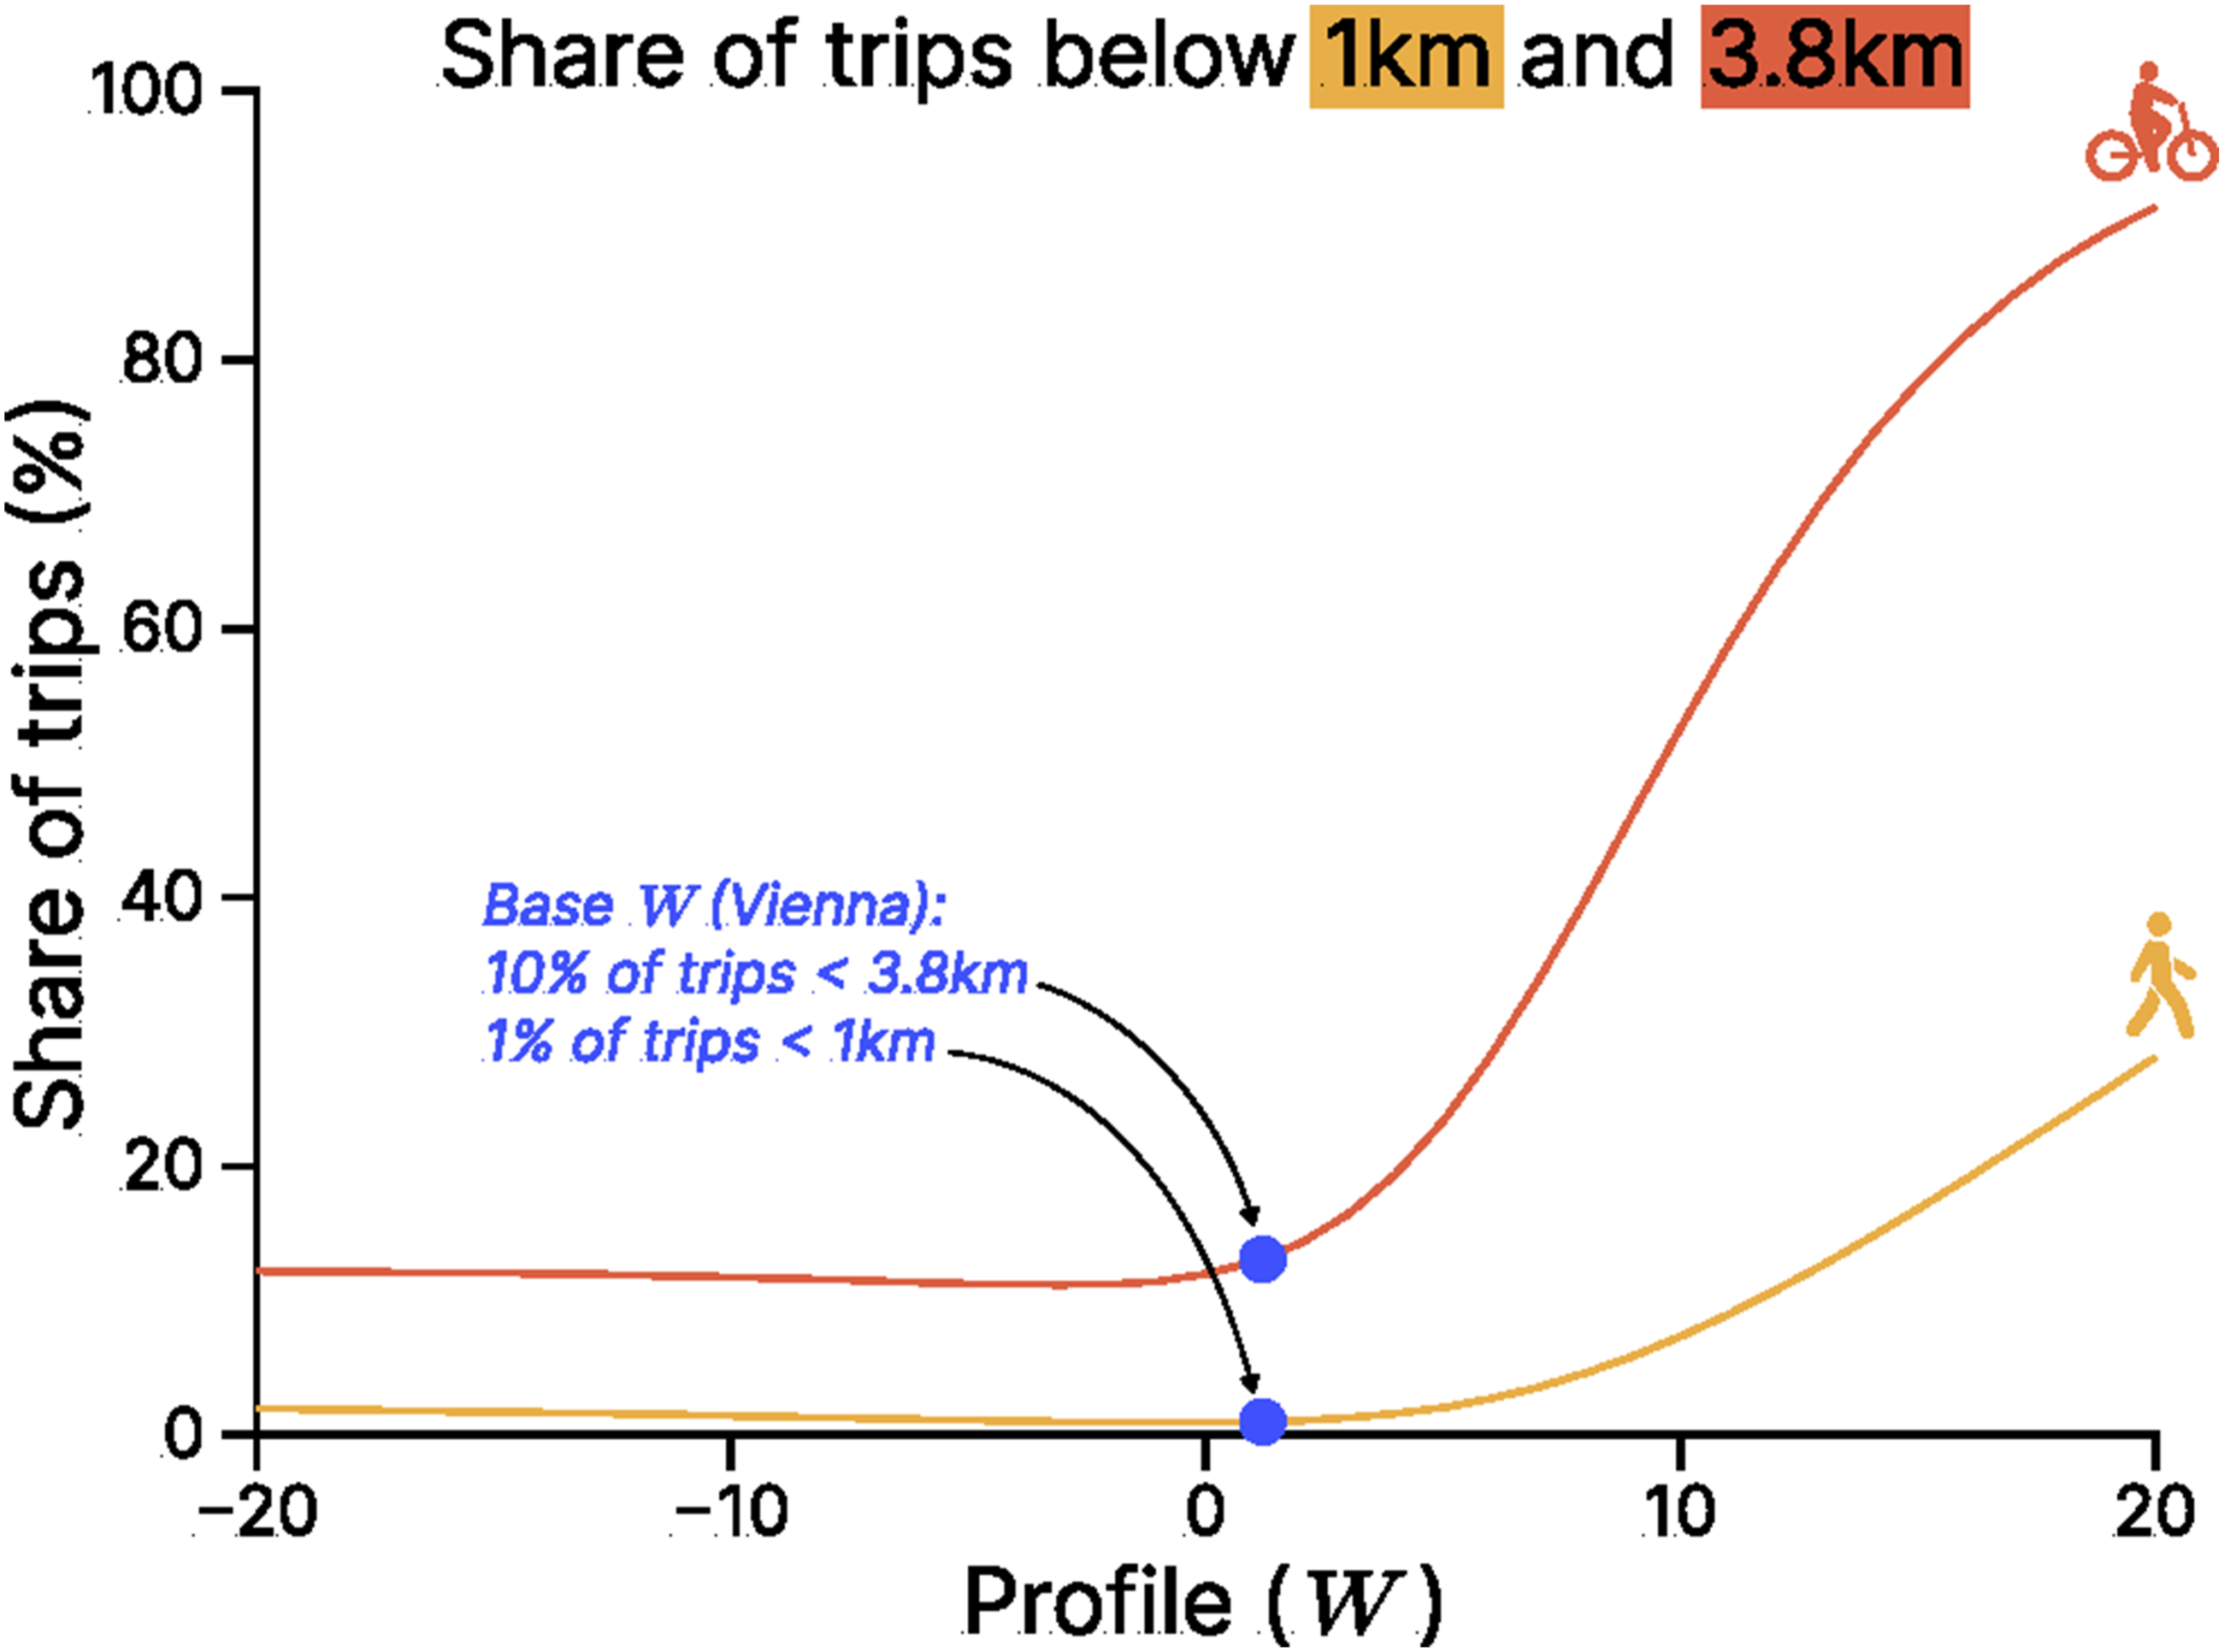
Cities with a negative profile (i.e. W <0) have a slight increase in the number of journeys that are feasible by walking and cycling compared to a pancake city. This is consistent with the increased density in the outer ‘ring’ of such a city. However, this increase is only marginal compared to the total number of journeys in the city, as in this case, crossing the central hollow area by active mobility will not be feasible.
Urban form also affects the use of other commuting modes. For example, public transport relies on high passenger volumes to be more financially viable (though not necessarily financially self-sustaining), and to provide a service that is sufficiently frequent (Bar-Yosef et al., 2013). However, high passenger volumes are rarely observed in suburban and sprawled areas. As a result, public transport typically has much greater coverage near the city centre (Prieto-Curiel and Barroso, 2025). Similarly, in high-income countries, people who live farther from the city centre are more likely to own and use a car for commuting (Berrill et al., 2024). Thus, in pyramid and needle cities, a greater share of commutes is expected to be made by Active Mobility and public transport, despite higher congestion in the city centre. Conversely, in flat cities, higher car ownership and greater car use should be observed.
Discussion
This study used a simulation model to systematically quantify the impact of a city’s elongation, sprawl, height, and profile on average travel distances. Our findings confirm that a compact, circular city with a centrally concentrated ‘pyramid’ density profile is the most efficient form for minimising travel distances. The analysis demonstrated that deviations from this ideal shape, such as increased elongation, sprawl, or a dispersed ‘bowl’ profile where density is pushed to the periphery, all lead to significant increases in average commuting distances. While increasing average building height also contributes to shorter trips, the spatial distribution of that height, the city’s profile, proved to be the most influential factor.
The modelled parameters are the direct outcomes of real-world development processes. Urban form is often shaped by spontaneous or fragmented growth without a comprehensive strategy, as well as by barriers, political decisions, and transportation limitations. These are the very forces that can elongate a city along a coastline, encourage sprawl in the absence of growth boundaries, create a dense ‘pyramid’ core through economic agglomeration, or a ‘bowl’ shape if new development occurs around a preserved historical centre. While it has been argued that cities follow similar trajectories (Carra and Barthelemy, 2019; Lemoine-Rodríguez et al., 2020), these varied local forces evidence divergent examples. The vertical, compact growth of Hong Kong, the pyramid-shaped growth of Dubai, and the sprawling expansion of many cities in the USA show that cities do not converge on a single urban form. Our model does not aim to replicate these complexities or provide normative recommendations for any specific city. Rather, it functions as a conceptual framework for exploring trade-offs among spatial effects of urban form such as compactness, vertical profile, and accessibility. Understanding these trade-offs is crucial, as cities are subject to a range of pressures that can favour either densification or sprawl, and identifying these factors and how they interact with sustainability can be important when debating policy responses.
The four key parameters of urban shape in this model strongly influence a city’s average travel distance. Even small changes in factors such as elongation, building height, and profile can have a significant impact (Biljecki and Chow, 2022). These results highlight the importance of considering these macro-scale elements when planning urban growth. While terrain, rivers, and seas may limit planning, adjusting vertical profiles and reducing unused space can further reduce travel distances. Compared with studies that focus on more detailed aspects of urban form, such as street patterns, intersection density, and land-use mix, our findings suggest that broader shape attributes have a greater impact on travel distances and energy costs. This raises questions about traditional studies on how urban form influences travel behaviour, which often concentrate on smaller-scale factors that sometimes show conflicting or minimal effects (Dalde et al., 2025; Stead and Marshall, 2001). In practice, larger-scale urban form may already shape or constrain travel patterns, making cross-city comparisons in those behaviour studies challenging, even when socio-economic factors are controlled for.
Our simulation of urban forms and the interaction between different parameters emphasises that urban planning is a multi-dimensional problem. Planners need to consider a range of metrics, including the total area, average travel distance, sprawl indices, and the city’s profile, to achieve an optimal balance. For example, increasing the number of persons per building reduces both the total building footprint and the average travel distance. However, if done excessively, it may lead to overcrowded spaces or even slums (Pierce, 2017). Thus, the optimal city shape results from iterative modelling and stakeholder engagement, in which different parameters are balanced against the community’s long-term vision. Through a hands-on, interactive web tool, our model is made accessible to a broad audience. The tool offers an easy-to-understand, relatable introduction to the model’s individual parameters, making it suitable for non-domain experts and feasible for classroom use. It aims to highlight the importance of urban form while enabling users to iteratively explore the model by adjusting parameters and adapting virtual cities, and to compare different urban development scenarios (such as central densification vs urban sprawl), thereby fostering open discussion about a city’s potential future development.
Reducing urban energy consumption contributes to long-term sustainability (Toth and Videla, 2012). While reducing average travel distances provides clear benefits, the urban form must also cater to human-scale experiences. Excessively high densities might compromise access to services (Pierce, 2017), daylight, open space, and even community interaction if not appropriately managed. The design trade-offs here involve balancing the efficiency gains from vertical densification with the need for spaciousness, greenery, and a comfortable living environment. The simulated cities and their shapes are simplifications of myriad urban elements, such as important variations in density due to open spaces and in transport networks due to various types of ‘barriers’ (Aiello et al., 2025). However, we expect it to capture important relationships among aggregate features, such as macro-scale density variation. Although our model provides estimates of travel distances and volumes, we do not explicitly account for congestion, which significantly affects citizens’ quality of life, drives decisions, and contributes to energy use and emissions. We do not consider how city form affects the feasibility of public versus private transportation. Our active mobility analysis illustrates this point: even under a pyramidal profile, walking accounts for roughly 1% and cycling for less than 15% of feasible trips in a city of Vienna’s size. This suggests that macro-scale profile optimisation primarily enhances the conditions for public transport rather than enabling a shift to active modes (Langer et al., 2023). These estimates rely on fixed distance thresholds and do not account for factors such as topography or the quality of cycling infrastructure, which further shape actual uptake. While some morphological features affect the feasibility of public transportation, at the macroscale we expect travel distances to be primarily determined by the parameters included in our model. Extensions of our model could include a mode choice (Prieto-Curiel and Ospina, 2024), allowing us to investigate the interplay between urban form, travel mode choice, congestion, and energy use. However, this is intertwined with travel modes: with faster travel modes (e.g. by car), people might be willing to take longer commutes (considering the travel time budget hypothesis (Kung et al., 2014; Marchetti, 1994; Mokhtarian and Chen, 2004)). Urban form combined with transportation infrastructure layout can have disparate effects on different travel models with respect to accessibility.
While our findings confirm the established principle that compact, centrally dense cities reduce travel distances, the primary contribution lies in the systematic quantification and accessible methodology we provide. First, by isolating parameters such as elongation, sprawl, height, and profile, our model offers clear, quantitative insights into their relative and non-linear impacts, clarifying how much each specific design choice matters. Second, the model’s parametric approach serves as a crucial methodological bridge between complex urban modelling and practical application, offering an alternative to black-box or overly complex analytical models. This approach, embodied in the accompanying interactive tool, showcases the strength of simulations to explore trade-offs and build an intuitive understanding of how large-scale urban form affects mobility outcomes.
Supplemental material
Supplemental Material - What is the best shape of a city? Modelling the effect of urban form on travel distance
Supplemental Material for What is the best shape of a city? Modelling the effect of urban form on travel distance by Tobias Batik, Guillermo Prieto-Viertel, Jiaqi Liang, Liuhuaying Yang, Dániel Kondor, and Rafael Prieto-Curiel in Environment and Planning B: Urban Analytics and City Science.
Footnotes
Funding
The authors disclosed receipt of the following financial support for the research, authorship, and/or publication of this article: The research was funded by the Austrian Federal Ministry for Climate Action, Environment, Energy, Mobility, Innovation and Technology (2021-0.664.668) and the Austrian Federal Ministry of the Interior (2022-0.392.231). DK acknowledges support from the Austrian Ministry for Innovation, Mobility and Infrastructure | Bundesministerium für Innovation, Mobilität und Infrastruktur (BMIMI) to CSH’s PostDoc Program for Complexity Science and Data Competence (GZ 2023-0.841.266).
Declaration of conflicting interests
The authors declared no potential conflicts of interest with respect to the research, authorship, and/or publication of this article.
Data Availability Statement
The source code for the model implementation is publicly available at ![]() . The repository includes all materials required to reproduce the experiments reported in this study, including the implementation of the parametric city model and the source code for the Cities Morphology visualization platform. It also provides the necessary resources to run simulations for additional cities beyond those analysed in this work.
. The repository includes all materials required to reproduce the experiments reported in this study, including the implementation of the parametric city model and the source code for the Cities Morphology visualization platform. It also provides the necessary resources to run simulations for additional cities beyond those analysed in this work.
Supplemental material
Supplemental material for this article is available online.
Author biographies
References
Supplementary Material
Please find the following supplemental material available below.
For Open Access articles published under a Creative Commons License, all supplemental material carries the same license as the article it is associated with.
For non-Open Access articles published, all supplemental material carries a non-exclusive license, and permission requests for re-use of supplemental material or any part of supplemental material shall be sent directly to the copyright owner as specified in the copyright notice associated with the article.