
Abstract
Cadastral vector data has become particularly important in urban studies due to its ability to accurately represent different urban realities, such as vulnerability assessment, densification processes and the development of simulation models. This paper proposes a framework for analysing changes in cadastral parcels in Spanish cities, identifying transformation process involving geometric and land use changes. Land use maps were obtained for two dates, one in 2022 and another in 2024, covering 48 Spanish cities and consisting of six categories: single-family residential, multi-family residential, industrial, commercial and office, others and undeveloped. The framework combines thematic and spatial analyses, intersection operations, graph construction, and geometric characterisation of changes through different spatial metrics of parcels. The results revealed three main processes affecting cadastral parcels: Aggregating, Subdividing and Non-impactful. These processes mainly affected on undeveloped land with varying geometric characteristics. Large parcels with complex shapes were transformed into simple and elongated parcels through Subdividing processes, while average-sized parcels with simple shapes were transformed into compact, more complex parcels through Aggregating processes. These results provide insights into how urban spaces are evolving not only in terms of land use change, but also through transformations in parcel geometry. This opens several future research lines grounded on the monitoring of cadastral data, such as urban densification studies, policy impact assessment and urban growth simulation models coupled with parcel transformation algorithms.
Introduction
The sustainable development goals require a deep understanding of the complex dynamics that define cities (United Nations Human Settlements Programme, 2022). Land Use and Land Cover Change (LULCC) remains a primary focus of diverse research (Benhammou et al., 2022; Hussain et al., 2024; Sun et al., 2023), with literature ranging from the mapping of general long-term metropolitan patterns (Dadashpoor et al., 2019), to the utilisation of bottom-up morphological approaches to identify building-level growth patterns (Perez et al., 2021).
These studies are typically conducted using either (i) satellite imagery and remote sensing data (Wang et al., 2023) or (ii) polygon/line vector-based datasets (Yao et al., 2022). The first has a high capability to be conducted globally and in remote areas efficiently with no need for extensive ground surveys (Verburg et al., 2011). Due to the growing availability and update frequency of satellite imagery, they allow for a temporal evolution analysis (Herold et al., 2005). However, they also present some limitations, mainly related to the usage of pixel-based representation whose spatial resolution and precision must be carefully handled (Ez-zahouani et al., 2023).
On the other hand, studies that use highly detailed vector-based data benefit from a more accurate representation of urban realities. As urban areas have evolved, so have their dynamics, which are currently marked by several overlapping processes that do not fit well within a single, linear model of core-periphery expansion (Pradhan et al., 2025). Edge expansion often combines with redevelopment and gradual densification within the existing fabric, while leapfrogging incorporates discontinuities and fragmentation to growth patterns (Zhang et al., 2017). These changes can also produce spillover effects, where development pressures and their impacts extend beyond municipal limits and influence nearby areas (Kim, 2013). At the same time, growth can coexist with urban shrinkage, that reduces the sustainability and efficiency of the urban fabric (Haase et al., 2014). In these settings, urban function loss may appear through urban perforation, as gaps and vacant parcels accumulate within built-up areas (Usui, 2025), or through building abandonment and underuse, where structures remain but are no longer in active use (Caramaschi and Chiodelli, 2023). Thus, these complex dynamics are best addressed through bottom-up approaches, which are greatly strengthened by detailed vector-based data, enabling fine-grained changes in land use and form to be tracked over time and linked to broader urban trajectories (Fleischmann et al., 2022).
In this context, cadastral data offer rich and precise land parcel information that has recently increased in usage and reliance thanks to greater availability and to general enhanced hardware capabilities (Molinero-Parejo et al., 2024). Moreover, cadastral data are updated regularly to reflect changes in land ownership, including changes in urban uses and parcel geometries, ensuring that the information remains current and reliable. Hence, by comparing historical and current datasets, it is possible to identify trends in urban growth, land use changes and infrastructure development, shedding light on long-term patterns influenced by economic, policy and social shifts. Some applications of this data include urban vulnerability (Sánchez Ondoño and Prada Trigo, 2023), planning (Dalmau et al., 2014), sprawl (Mansour et al., 2024), densification processes (Domingo et al., 2023), land use change simulation (Barreira-González et al., 2019) and risk management (Grădinaru et al., 2023). However, few studies focus on the changes in urban land uses from a parcel geometry transformation perspective.
In this regard, identifying and understanding transformations processes affecting urban parcel geometry might be valuable for diverse urban studies, such as vertical growth pattern studies (Huang et al., 2023), accessibility studies (Kane et al., 2017) and Vector-based Cellular Automata (VCA) models. The latter specifically incorporate cadastral data as a spatial representation unit (Molinero-Parejo et al., 2023) and have successfully addressed land use change simulation (Stevens et al., 2007), but incorporating changes in parcel geometry is still at a very early stage (Yao et al., 2017). Algorithms aimed at assessing cadastral parcel geometry transformations that have been developed recently (Colomb et al., 2022; Dahal and Chow, 2014; Wickramasuriya et al., 2011) might benefit from the proposed analysis, incorporating knowledge derived from parcel geometry transformation analysis.
Within this framework, this study is focused on analysing geometry transformation in urban parcels, using Spanish urban areas as a case study. These urban areas represent an excellent case laboratory for two key reasons: first, they have a history of fast urban growth in recent decades, economic downturns and recovery, which was exacerbated before the 2008 housing crisis and is now resurging due to high demand and low supply in the real estate market (Cardesín Díaz and Araujo, 2017; Villar Navascués et al., 2023). Second, Spanish cadastral data is highly detailed and fully accessible to users. It also can handle large-scale downloads, which, when combined with the appropriate processing tools, enables the coverage of almost the entire country.
Consequently, the main objective of this study is to address the existing gap in the analysis of changes to parcel geometry by developing an analytical framework to detect, map, and characterise cadastral parcel transformations between two dates. This framework was tested for Spanish cities between 2022 and 2024 and allowed us to address the following research questions (RQs): • RQ1: How geometry transformations undergone by cadastral parcel can be identified, classified and mapped? • RQ2: How can these transformations be characterised through changes in cadastral parcel morphology (e.g. shape, size, and configuration) and associated land use? • RQ3: Based on this characterisation, are there systemic differences between parcels targeted by and resulting from a transformation, and those that remain unchanged?
The paper is structured as follows: Section 2 presents the case study and cadastral data used. Section 3 describes the methodology employed. Section 4 presents the results and Section 5 discusses them, highlighting main limitations and future research lines. Finally, Section 6 provides the conclusions.
Datasets and study area
This paper studies 48 of the 52 provincial capital cities and autonomous cities of Spain (excluding Vitoria-Gasteiz, San Sebastián, Bilbao and Pamplona due to data availability limitations). These cities are home to a total of 15 million of Spanish citizens, representing more than 30% of Spain’s total population.
The Spanish urban landscape has witnessed dramatic changes since the early 2000s, initially driven by a real estate boom fuelled by low interest rates, easy credit and speculative investment (Burriel, 2011) and followed by rapid construction on urban outskirts (Andrés López, 2023). Later, the 2008 global financial crisis led to halted construction projects, urban sprawl and environmental degradation (Cardesín Díaz and Araujo, 2017). Meanwhile, recent years have seen a focus on policies aimed at redeveloping and regenerating existing urban areas (Rodríguez-Suárez et al., 2023).
This study employs Spanish cadastral data provided by the Directorate General for Cadastre (2024). This data is available on three levels: INSPIRE level, detailed level and historical level. INSPIRE level is easily accessible and usable, and it provides standardised and harmonised information about land parcels across Europe, enabling cross-border cooperation and consistency in spatial data usage.
Detailed level is a more complete version. It offers a much more precise and thorough description of parcel properties than the INSPIRE level, including specific construction types. It supports large-scale downloads since 2022 and requires advanced knowledge to properly be used since it is presented in a complex structure separated into two data types: geometries, composed of different types of spatial units such as blocks, parcels and buildings; and alphanumeric data, which includes information on urban land use (see Figure S1 in the supplementary material).
Lastly, the historical level gathers all the changes that the cadastral parcel has undergone over the past 20 years. This data is also presented in a complex format that requires advanced knowledge to use effectively. Its applications are more limited, particularly for large-area studies, since it provides no information beyond the geometrical properties of the parcels and does not support large-scale downloads.
With all this considered, detailed cadastral data was selected to conduct our study since it combines the richest amount of information with large-scale download. Thus, datasets for 2022 and 2024 (the latest available data) were obtained and processed with the Cadastral Classifier QGIS plugin (Shurupov et al., 2023). Custom classification option was selected to produce six urban land use classes from the original cadastral categories: 01 – Single-family Residential, 02 – Multi-family Residential, 03 – Industrial, 04 – Commerce and offices, 05 – Other uses and 06 – Undeveloped (a more detailed description of classes can be found in Table S1 of the supplementary material). This yielded two land use maps from 2022 to 2024 for each selected city. Figure 1 illustrates this data preprocessing with an example of the resulting classification for the city of Zaragoza in 2024. Cadastral data processing workflow with a classification map example.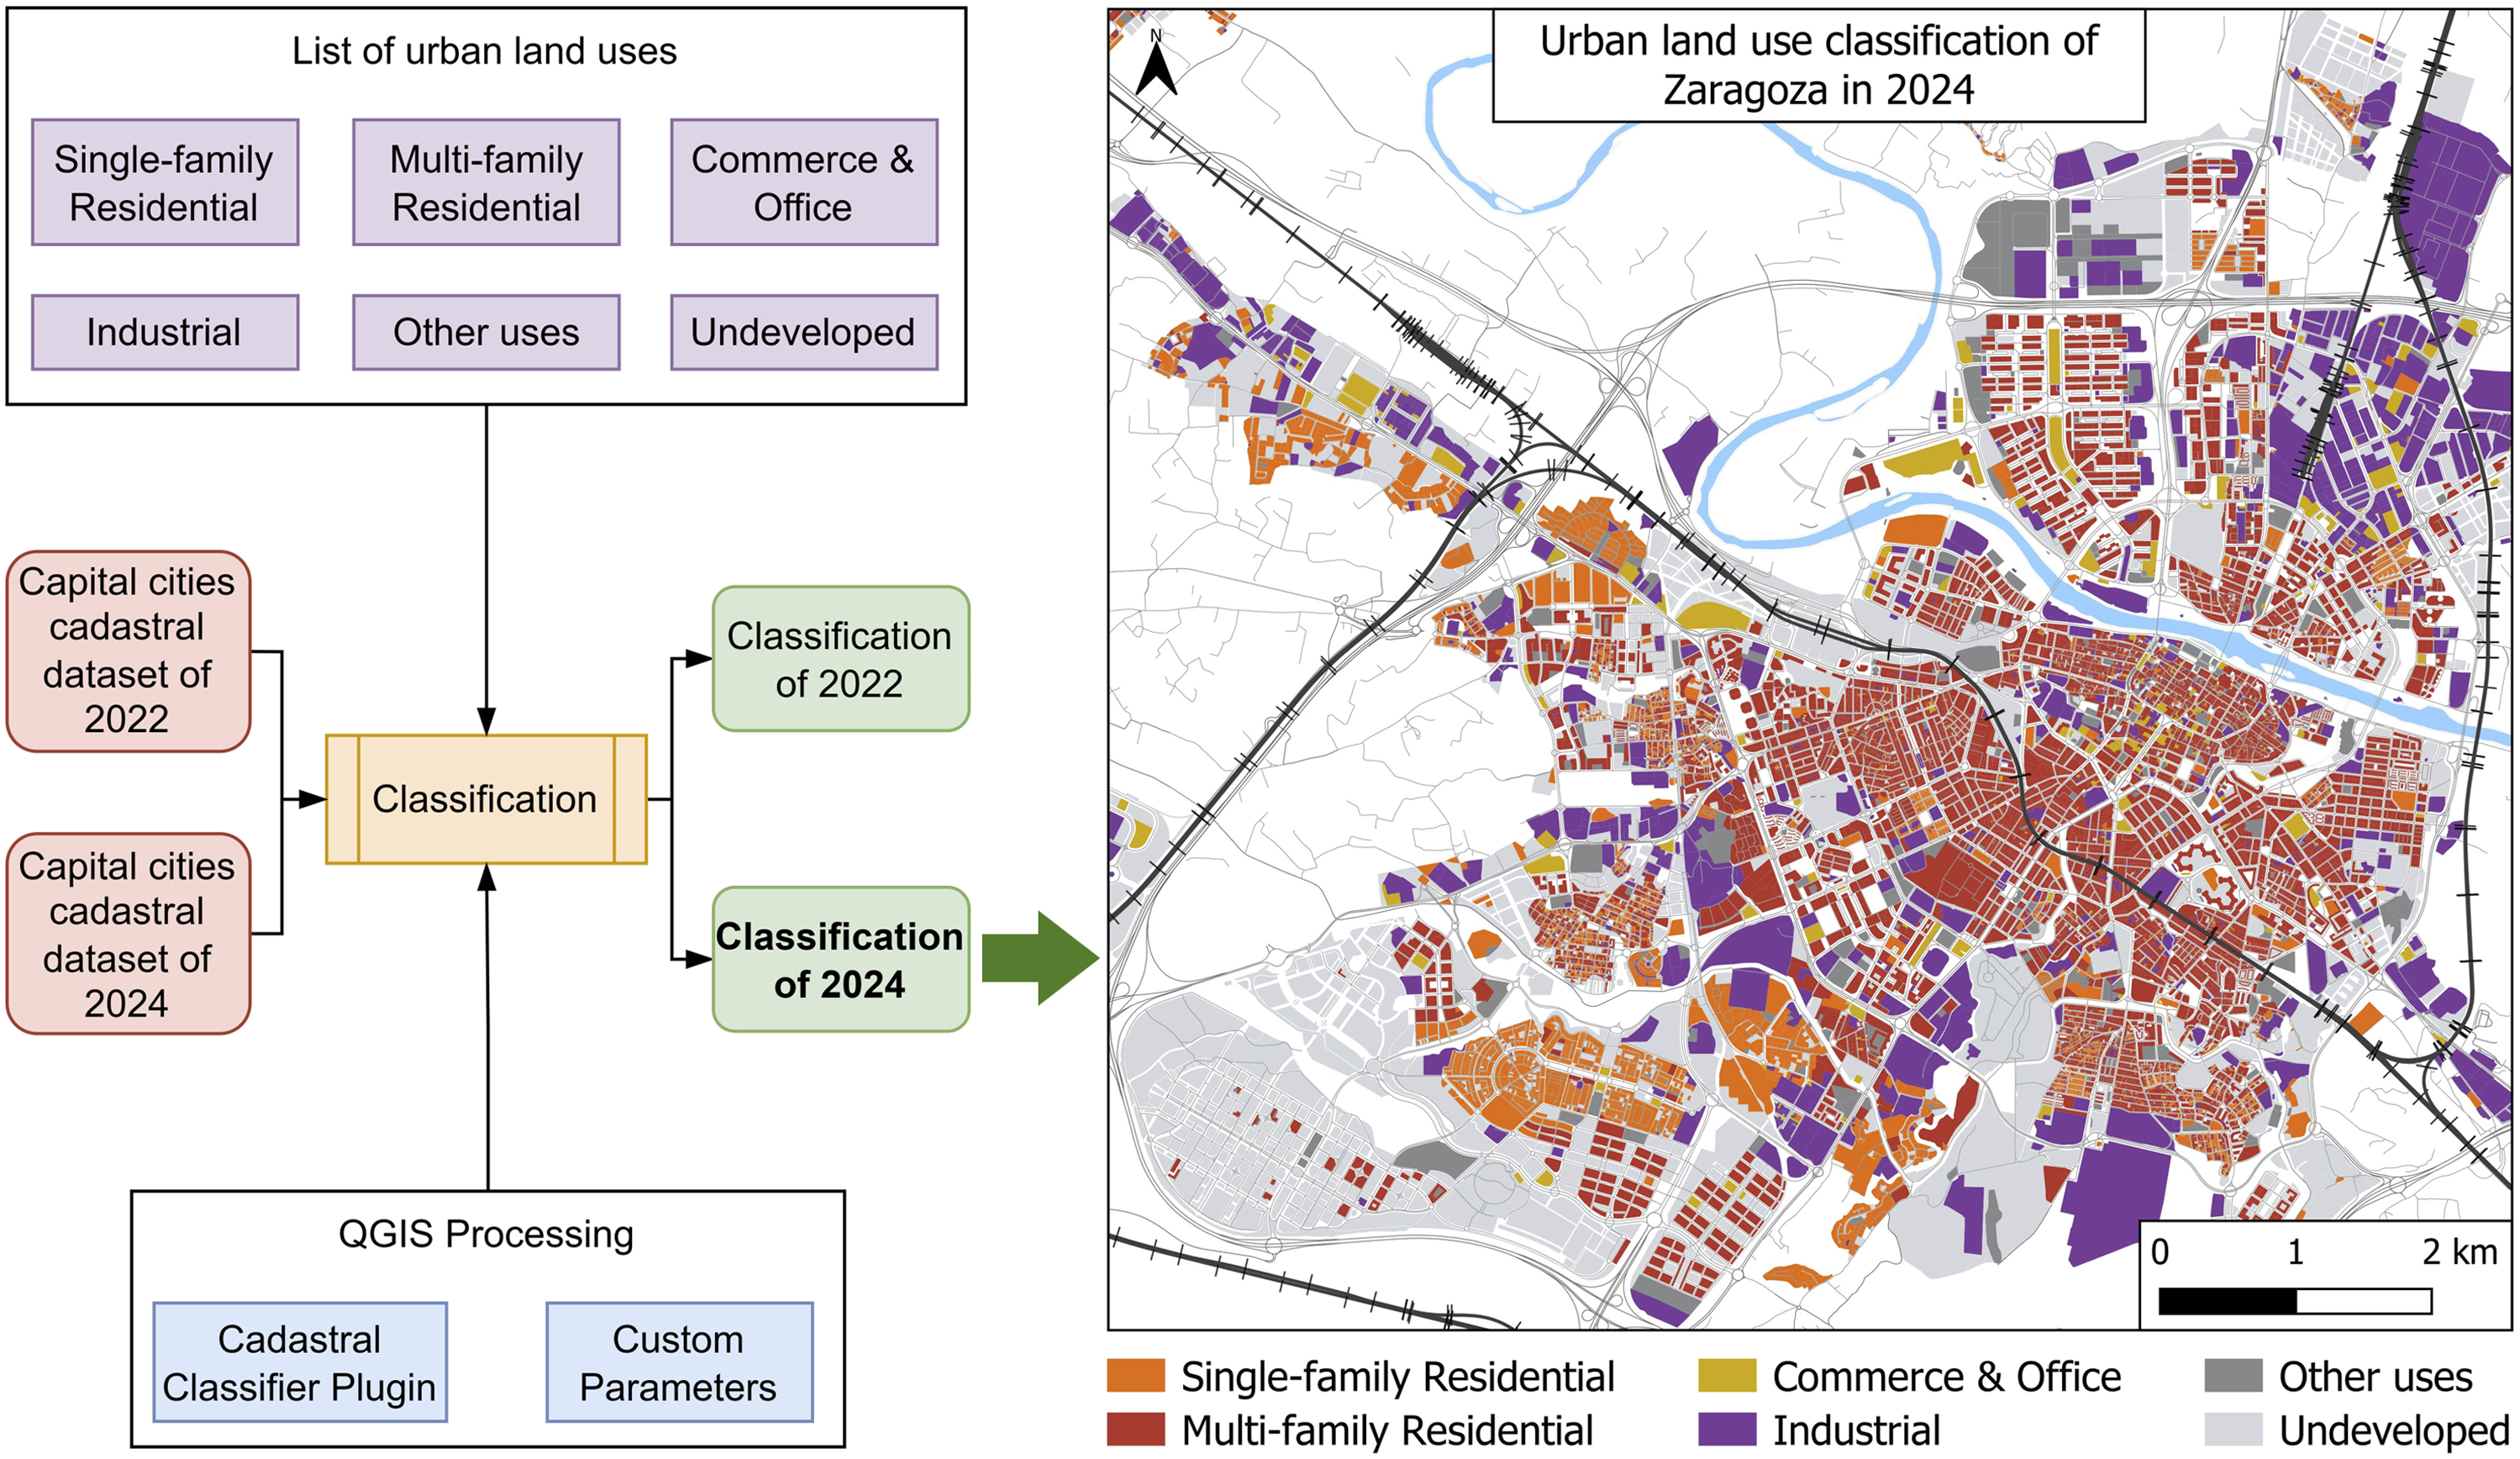
Methodology
The research has been divided into three blocks, each designed to address one of the research questions. Firstly, a series of attribute and spatial analyses were conducted to identify, classify and map the Transformations Processes (TPs) that cadastral parcels undergo (RQ1). Secondly, a series of spatial metrics were calculated to measure the characteristics of parcel geometries, and a Factor Analysis (FA) was implemented to select those that best represented the different spatial dimensions of parcels. Subsequentially, each TP was then characterised by evaluating the magnitude of the alterations produced in the involved parcels (RQ2). Finally, to compare groups of parcels that participate in each TP and those that remained unchanged, an analysis of the metric distribution through boxplot combined with Kruskal–Wallis test, Dunn test and Cliff’s Delta, was used (RQ3). A comprehensive overview of these stages can be consulted in the supplementary material (Figure S2).
Identification of transformation processes
The aim of this stage is to display cadastral geometry changes and classify them in a proposed set of TPs. A three-step analysis was conducted. This consisted of (i) attribute analysis using Cadastral Reference (CR) and geometry; (ii) spatial analysis through the intersections of the parcel geometries from both years; and (iii) a spatial analysis employing a graph. To exclude detected changes resulting from minor boundary adjustments or routine cadastral data corrections, two thresholds were applied. First threshold consisted of a minimum of 1% area value change to consider that a parcel has undergone geometry modification, calculated as
An illustrative diagram and detailed explanation of the steps can be found in the supplementary material (Figure S3).
Identification of the changes made by TPs to parcels
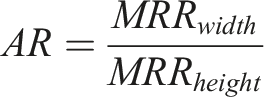
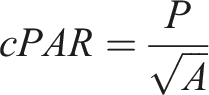
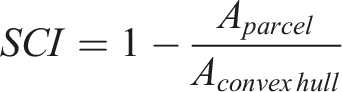
To capture the changes, a set of spatial metrics that explain the different spatial characteristics of parcel geometries was initially selected. For this research, only metrics measuring spatial characteristics of parcels as independent objects were considered. These were grouped into three categories: size, complexity and shape. A detailed list can be consulted in the supplementary material (Table S2). A statistical analysis was conducted on all the metrics considered to select the most representative ones. This was achieved through correlation analysis to reveal potential redundancy and FA to determine which metrics had the greatest factor loadings, allowing to identify the following metrics as the most representative for the dataset: - AR: directly related to the shape of the parcel geometry, specifically its elongation by comparing the length to the width of the geometry using the minimum rotated rectangle: - cPAR: measures the intrinsic complexity of a parcel geometry by comparing its area and perimeter and adjusting it to square standard to solve size dependency: - SCI: measures the extrinsic complexity, by comparing the area of the parcel geometry with the area of a geometry derived from the polygon of minimal geometry enveloping the parcel. However, it was shown to be related to the form metrics COMP and RECT, which also make a similar comparison, but with a circle and a rectangle, respectively: - SK_NB: measures intrinsic complexity by analysing the internal complexity of parcel geometry’s skeleton: - Additionally, AREA was also considered since it is directly related to the size of parcels.

More details of this selection can be consulted in the supplementary materials (Figures S4 and S5).
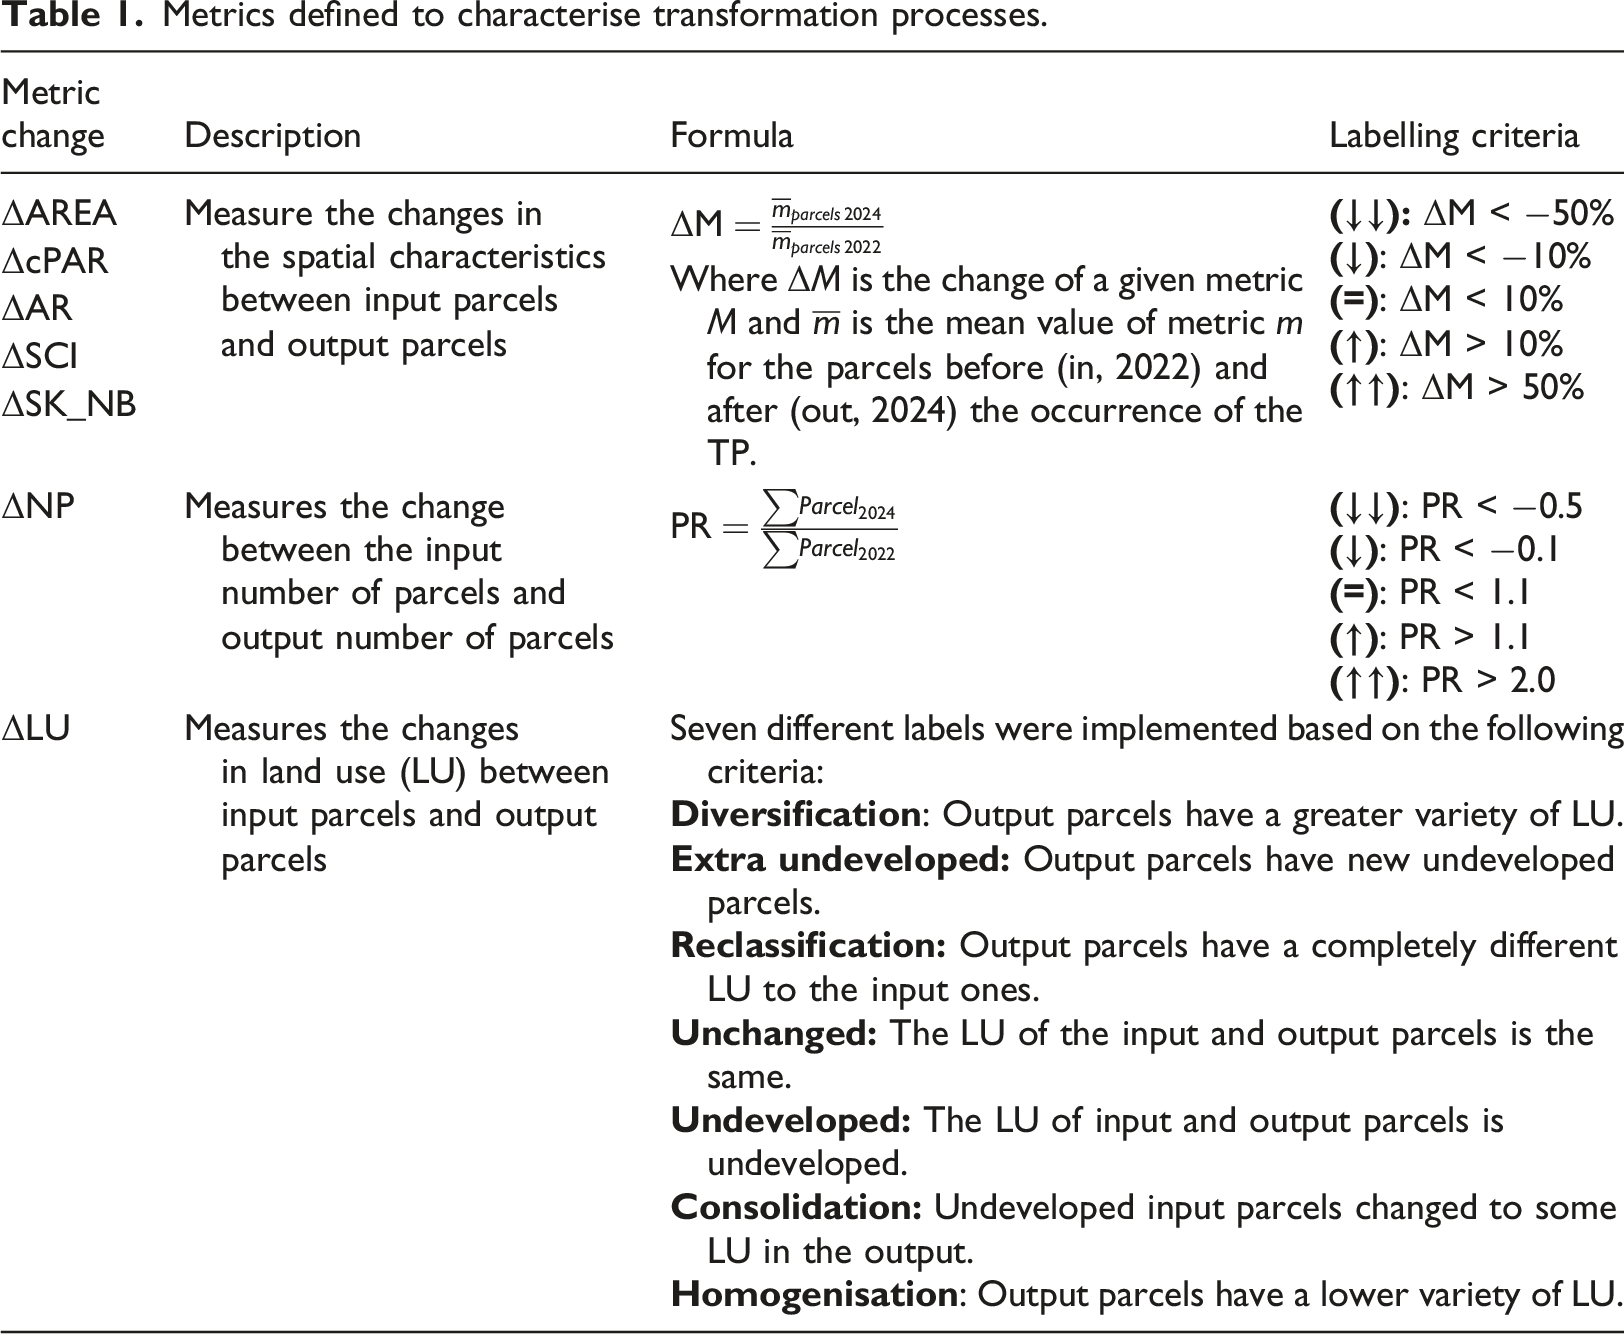
Metrics defined to characterise transformation processes.
Characteristics of parcels resulting from TPs
To analyse the characteristics of both parcels targeted by and resulting from the TPs, their metric distribution was obtained. To evaluate the differences in size, shape and complexity between them and unchanged parcels, a series of statistical tests were conducted: (i) a Kruskal–Wallis test to determine significant differences in parcel geometries across all TP; (ii) a Dunn’s post-hoc test to further analyse and show specific statistically significant differences in the selected metrics between TP pair-wise combination; and (iii) Cliff’s Delta to measure the magnitude of these differences. These tests provided precise results about the characteristics of parcels targeted by and resulting from each TP and how they compare to unchanged parcels. Additionally, a boxplot for all metrics was obtained, providing a graphic visualisation of the differences.
Results
Classification of the transformation processes: Mapping changes in urban parcels
The analytical framework developed allowed to identify six different spatial parcel transformation processes: (i) reshape, (ii) aggregation, (iii) subdivision, (iv) reconfiguration, (v) reconfiguration towards aggregation and (vi) reconfiguration towards subdivision. Additionally, a negligible/not intersected category grouped together parcels without any spatial relationships and those that did not meet the threshold criteria. Figure 2 illustrates an example of these results for the city of Zaragoza. Figure 2(a) shows the results of the first analysis conducted using the attributes of CR and Area attributes of the datasets. Figure 2(b)–(e) show the results of the second spatial analysis that uses intersection operation to detect single relationships of independent parcels. Finally, Figure 2(f) shows the classification with the third spatial analysis that incorporate a graph construction upon the previous single TP classification. In this case the relationships of single independent parcels are extended using connected components: leveraging graphs where each parcel is a node and connections each of the spatial relationships between them. TPs identified. Example for Zaragoza.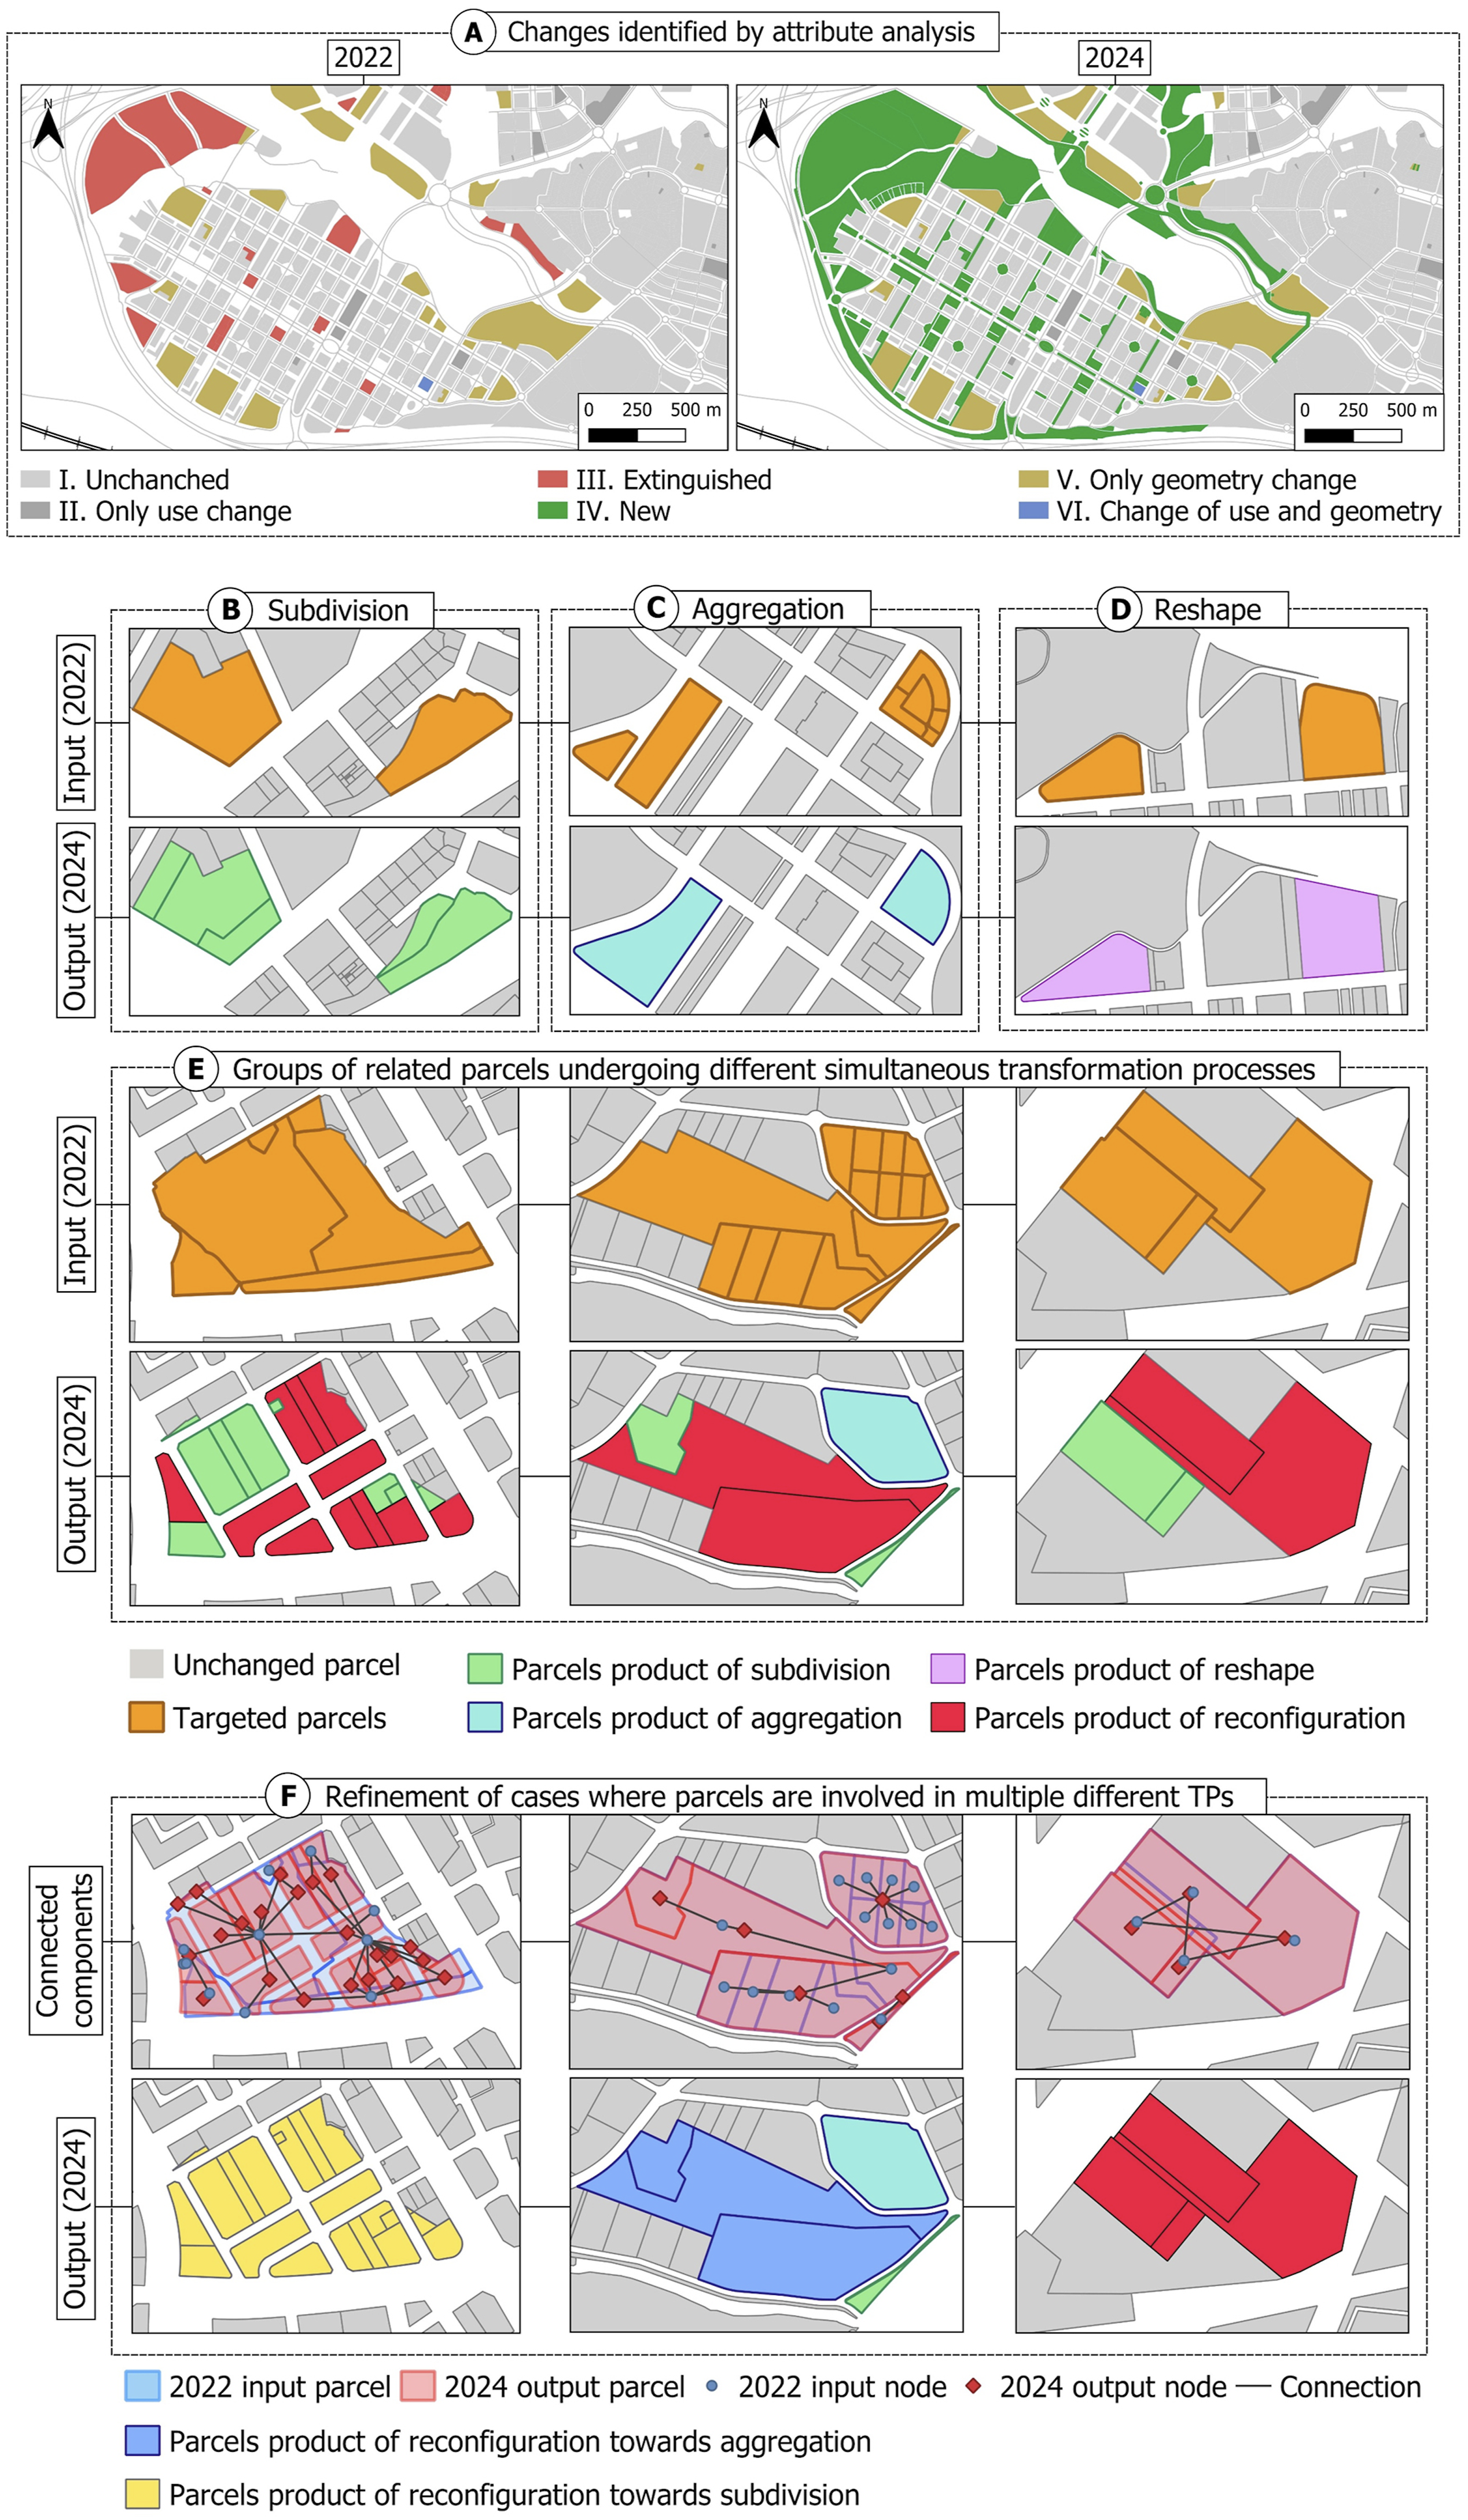
To compile the results, an interactive web viewer was developed. The outputs for all Spanish capital cities were mapped and can be accessed via the following link https://nikoshur.github.io/Spanish_parcel_transformations/, where the 2022 and 2024 maps can be compared. The viewer includes multiple visualisation options for the results of each analytical step, from the initial land use classification to the final classification of TPs.
As regards TP prevalence, Figure 3 shows an overview of the TPs that occurred in all Spanish capital cities between 2022 and 2024. The left graph shows the raw amount TPs, the central graph shows the number of input (targeted by a TP) and output (resulting from a TP) parcels impacted by those TPs and the right graph accounts for the total area of these participating parcels. TP frequencies.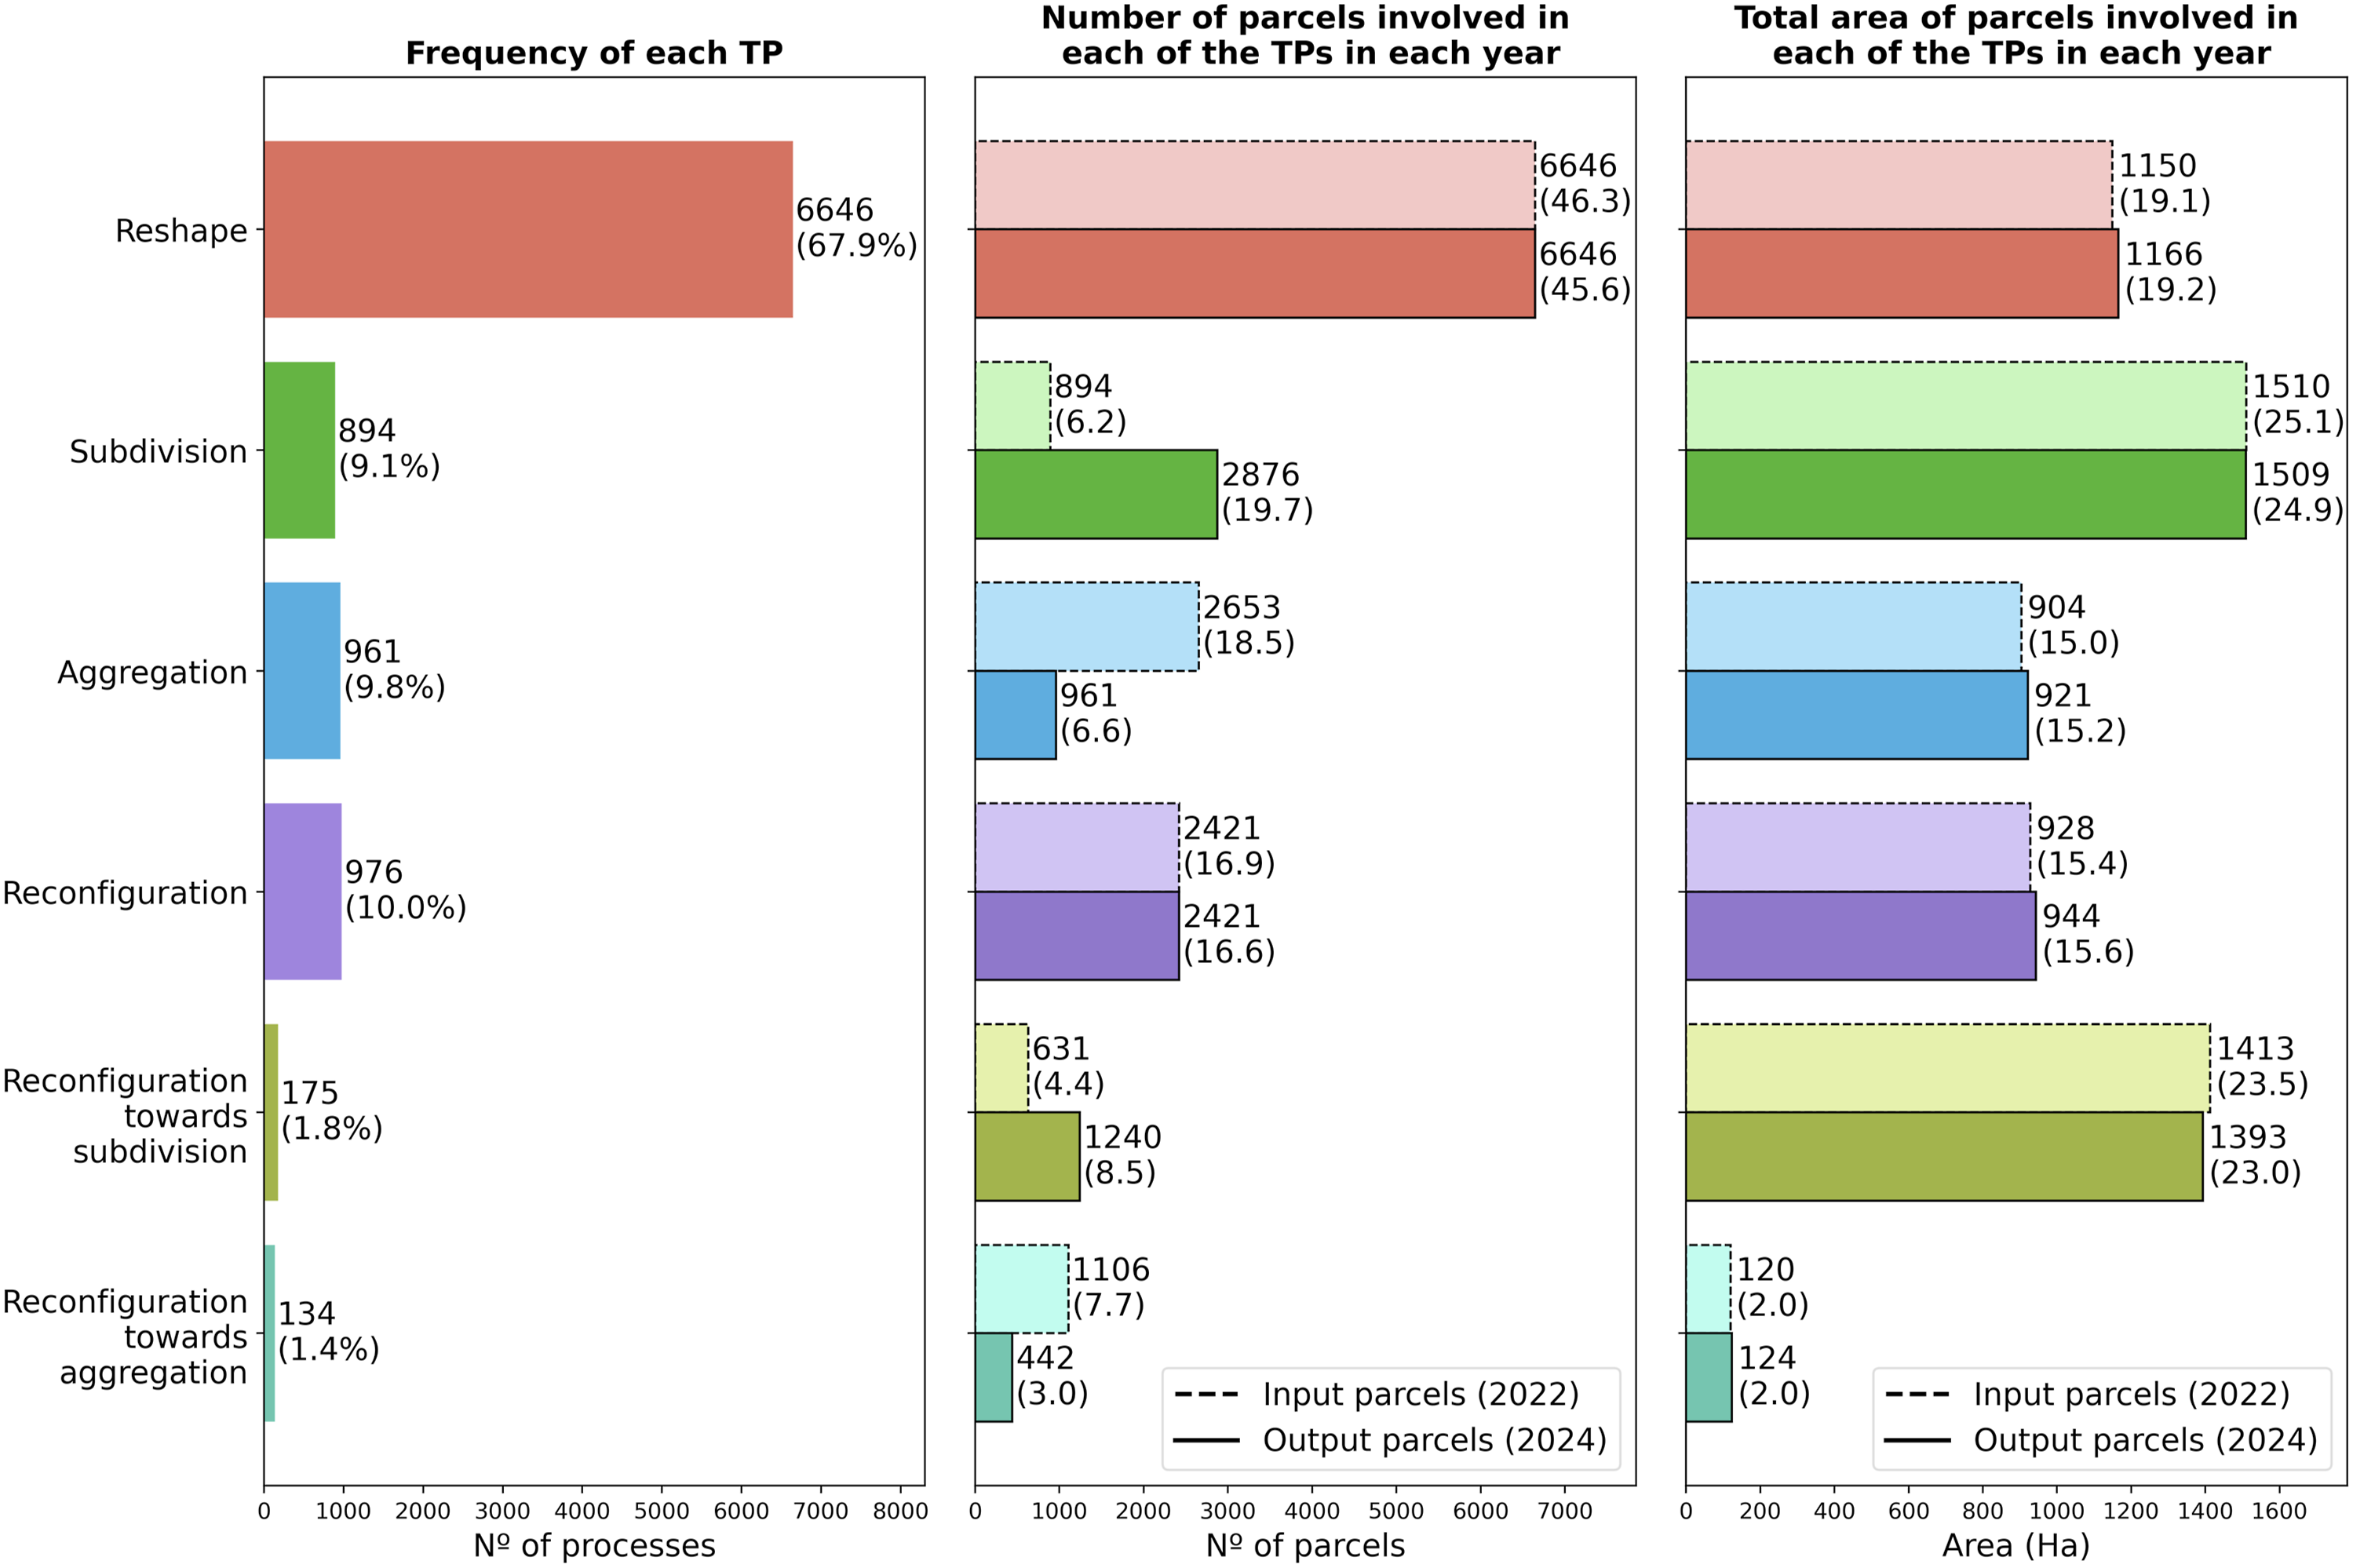
Of the six TPs identified, Reshape has been shown to be the most frequent, accounting for ∼68% of total individual TPs and ∼46% of total parcels (both targeted and resulting). However, it tended to focus on small, localised parcels that often require routine cadastral adjustments, which have no impact on large portions of urban land (∼19%). Conversely, Subdivision and Reconfiguration towards subdivision had the greatest impact in terms of area, covering a large amount of urban land (∼48% of total area) and involving a significant number of parcels (∼28% of total resulting parcels). Aggregation, Reconfiguration and Reconfiguration towards aggregation, meanwhile, are less frequent (∼25% of total parcels created) and cover a smaller area of urban land (∼33% of total area).
Changes produced on parcel geometries by each TP
Changes produced by each TP are summarised in Figure 4 (labels defined Table 1). Percentages represent the number of parcels involved in each process undergoing high increase (↑↑), low increase (↑), stability (=), low decrease (↓) and high decrease (↓↓) in the corresponding metric. Changes produced by each TP on the parcel’s geometric characteristics and LU.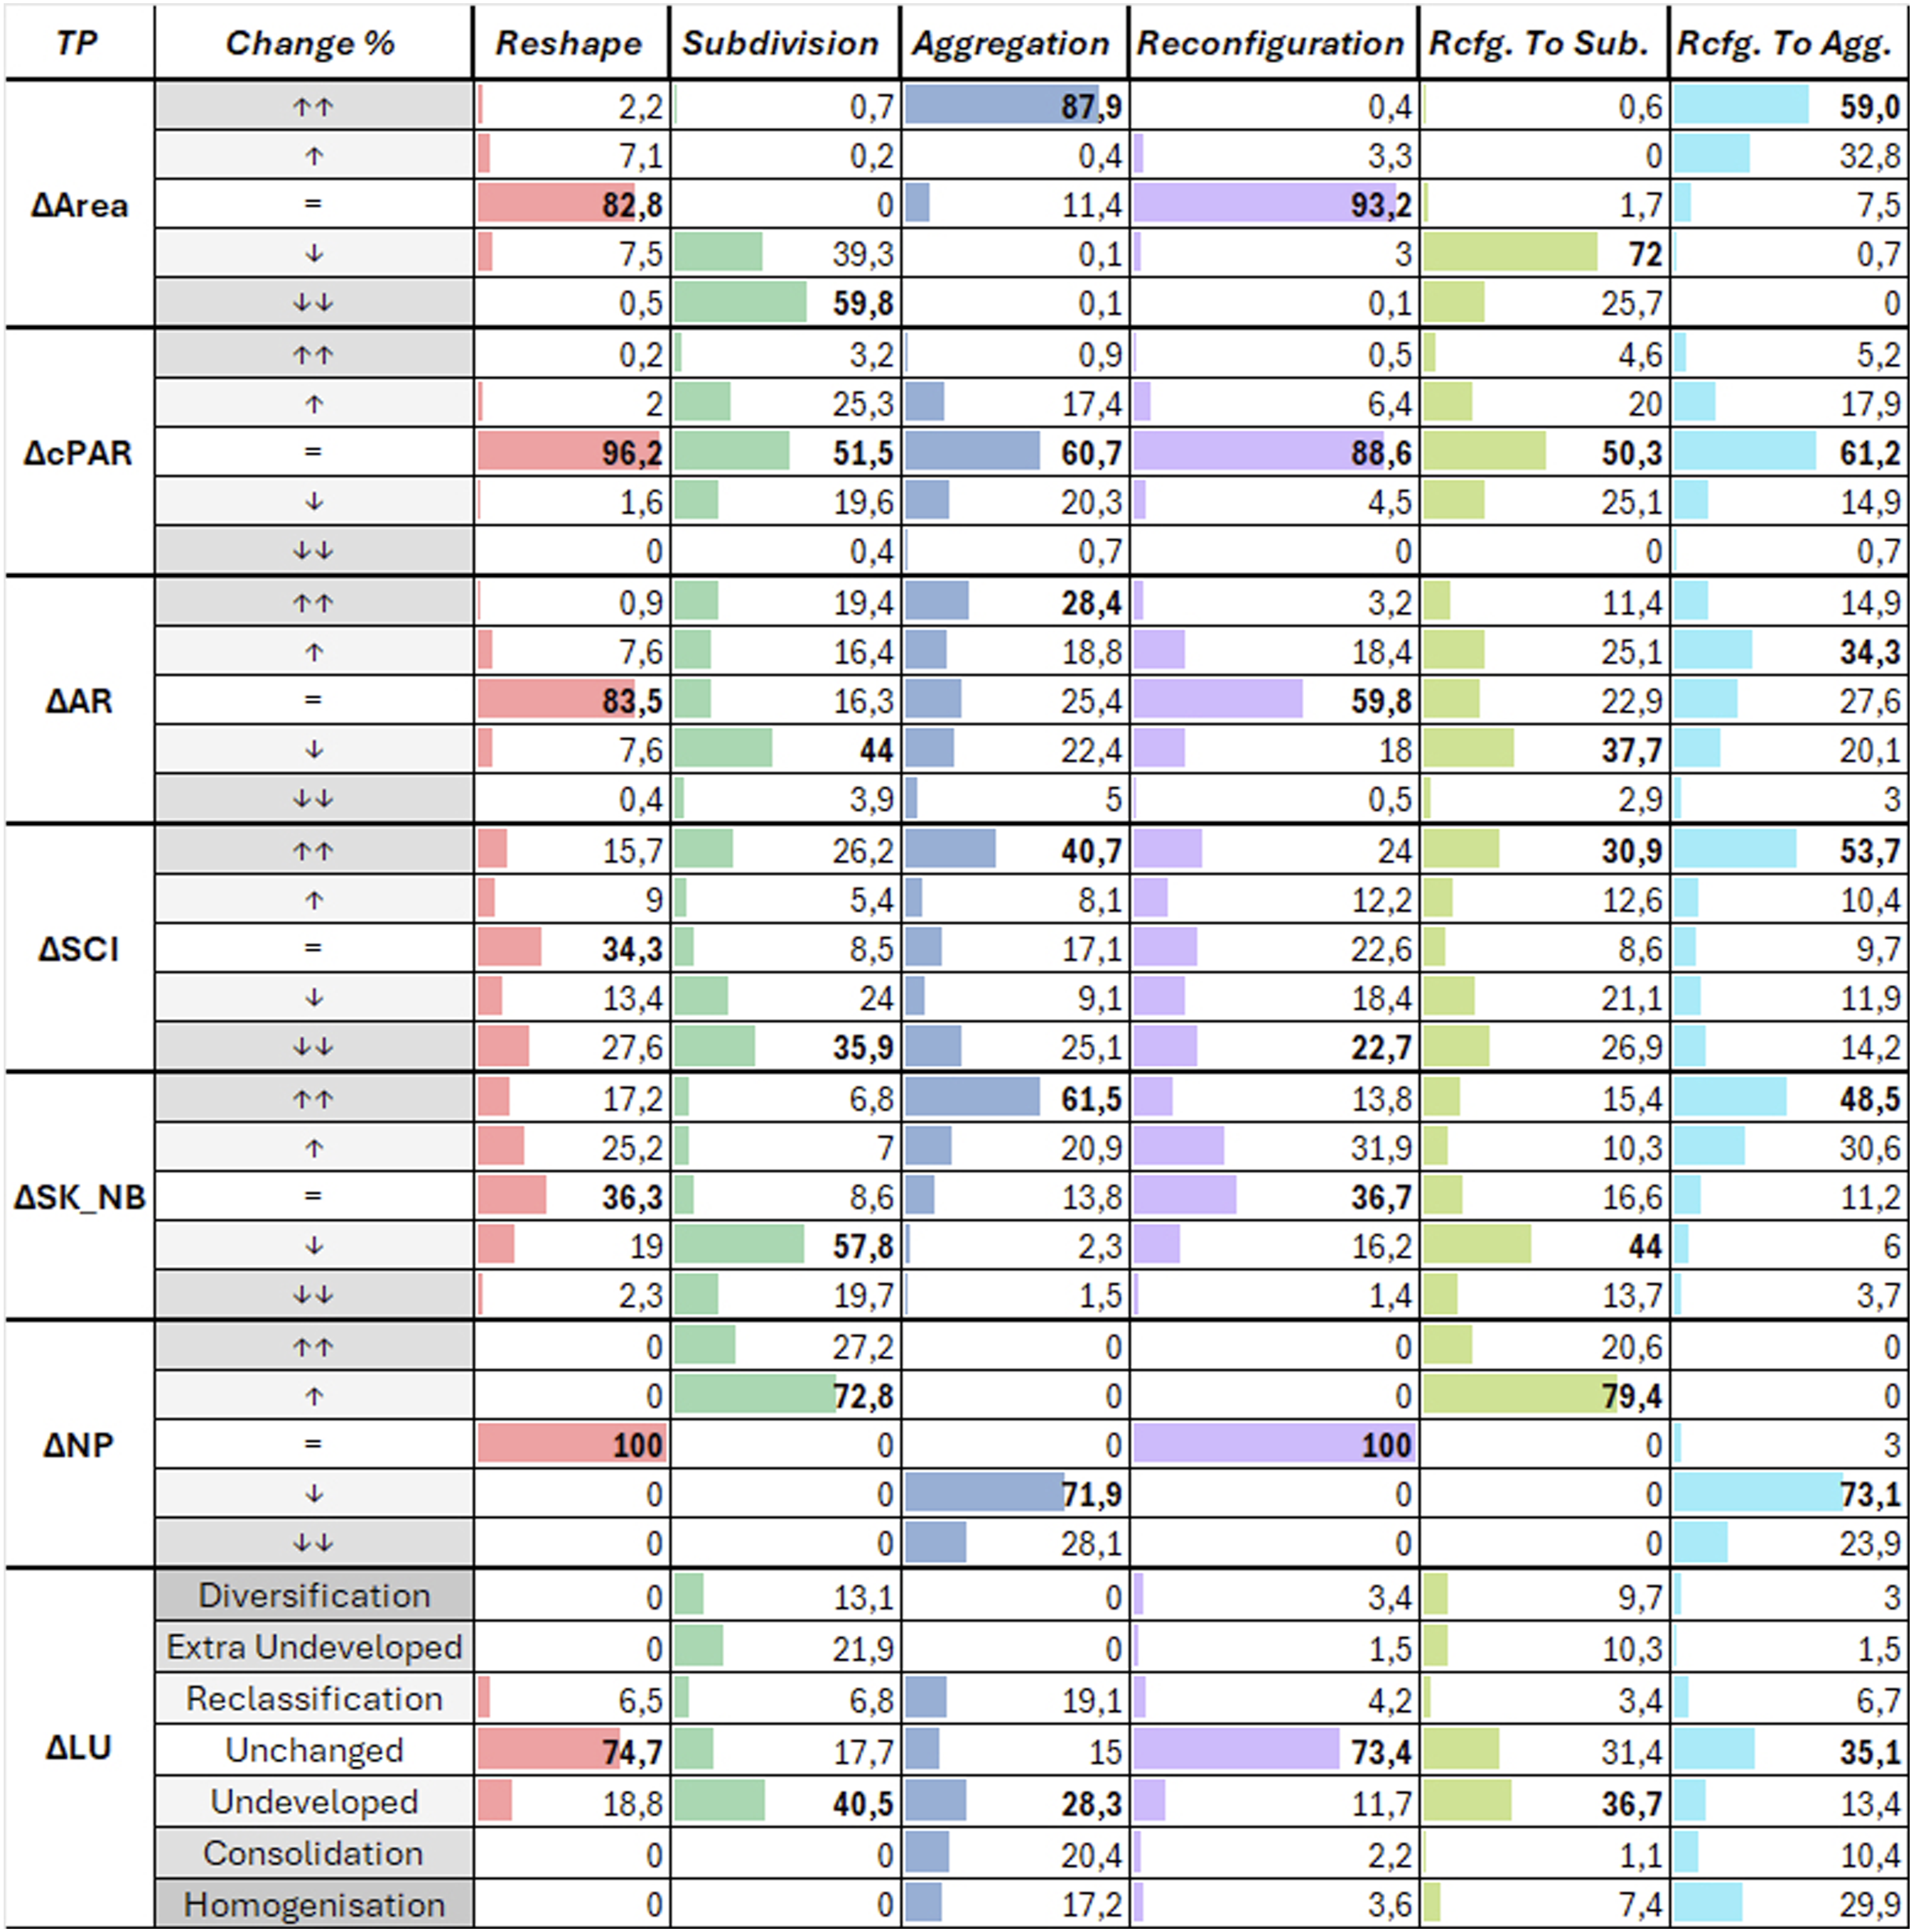
The Reshape and Reconfiguration TPs show a high level of stability in most metrics. Although, several changes can be observed in terms of the complexity of parcels. In particular, these TPs tend to increase SK_NB without clear SCI increase, which indicates that these TPs involve an increase of the number of vertices and thus the internal complexity, without making the geometries more complex in terms of shape.
Aggregation and Reconfiguration towards aggregation present very noticeable similarities. Both processes involve a merging of geometries that result in larger parcels that also entails an increase in the complexity from an internal (increase of SK_NB by more than 50% in most cases, which implies more vertices) and shape perspective (increase of SCI by more than 50% in most cases). This is accompanied by a relative tendency to increase AR (with cases showing an increase between 10 and 50%).
Subdivision and Reconfiguration towards subdivision also showed a level of similarity. Although the latter had a lower impact than the former (i.e. Subdivision reduced parcel size by more than 50% in most cases, whereas the reconfiguration counterpart reduced size by between 10 and 50%). Unlike Aggregation, these TPs result in a reduction in the complexity of parcel geometries, both in internal structure of their skeletons (decreases of more than 50% SK_NB in most cases) and the shape (which showed greater variability, with reductions of between 10 and 50% being the most frequent), also tending to lower the AR (in most cases, a decrease of between 10 and 50%) thereby increasing the elongation of new parcels.
Finally, regarding LU changes produced by these TPs, several findings were obtained. Reshape and Reconfiguration very rarely resulted in changes to LU (less than 10% involved any change to the original LU). On the other hand, Subdivision and Reconfiguration towards subdivision primarily targeted ‘Undeveloped’ parcels (∼40% and ∼36%, respectively), while also bringing with it a minor overall urban diversification, with the appearance of some new undeveloped (∼22% and 10%, respectively) or new use (∼13% and ∼10%, respectively) parcels. Lastly, Aggregation and Reconfiguration towards aggregation had varied effects on LU, leaning towards a consolidation process.
Characteristics of the parcels targeted by and resulting from the transformation processes
This section completes the results with the characteristics of the parcels targeted by (input) and resulting from (output) each of the TPs, comparing them with the unchanged parcels. Rather than evaluating the changes produced by each TP on the parcels involved, independent groups of parcels (i.e. Aggregation input parcels, Subdivision output parcels, etc.) are analysed and compared between them and with unchanged parcels.
These results are illustrated in the Figure 5, where the distributions of the metrics for each group of parcels are shown through a set of boxplots. The statistical comparison results are summarised using labels that combine colour, to indicate the existence of a significant statistical differences (Kruskal–Wallis and Dunn post-hoc tests) and arrows to indicate the magnitude and direction of such differences (Cliff’s Delta). Proportion of LU of each group and for unchanged parcels is also provided for further analysis of impact of the TPs on LU change. More detailed information of these statistical comparisons can be found in the supplementary material (Figures S6 to S10). Summary of TPs metric distribution and statistically significant difference, with median values shown above each corresponding boxplot.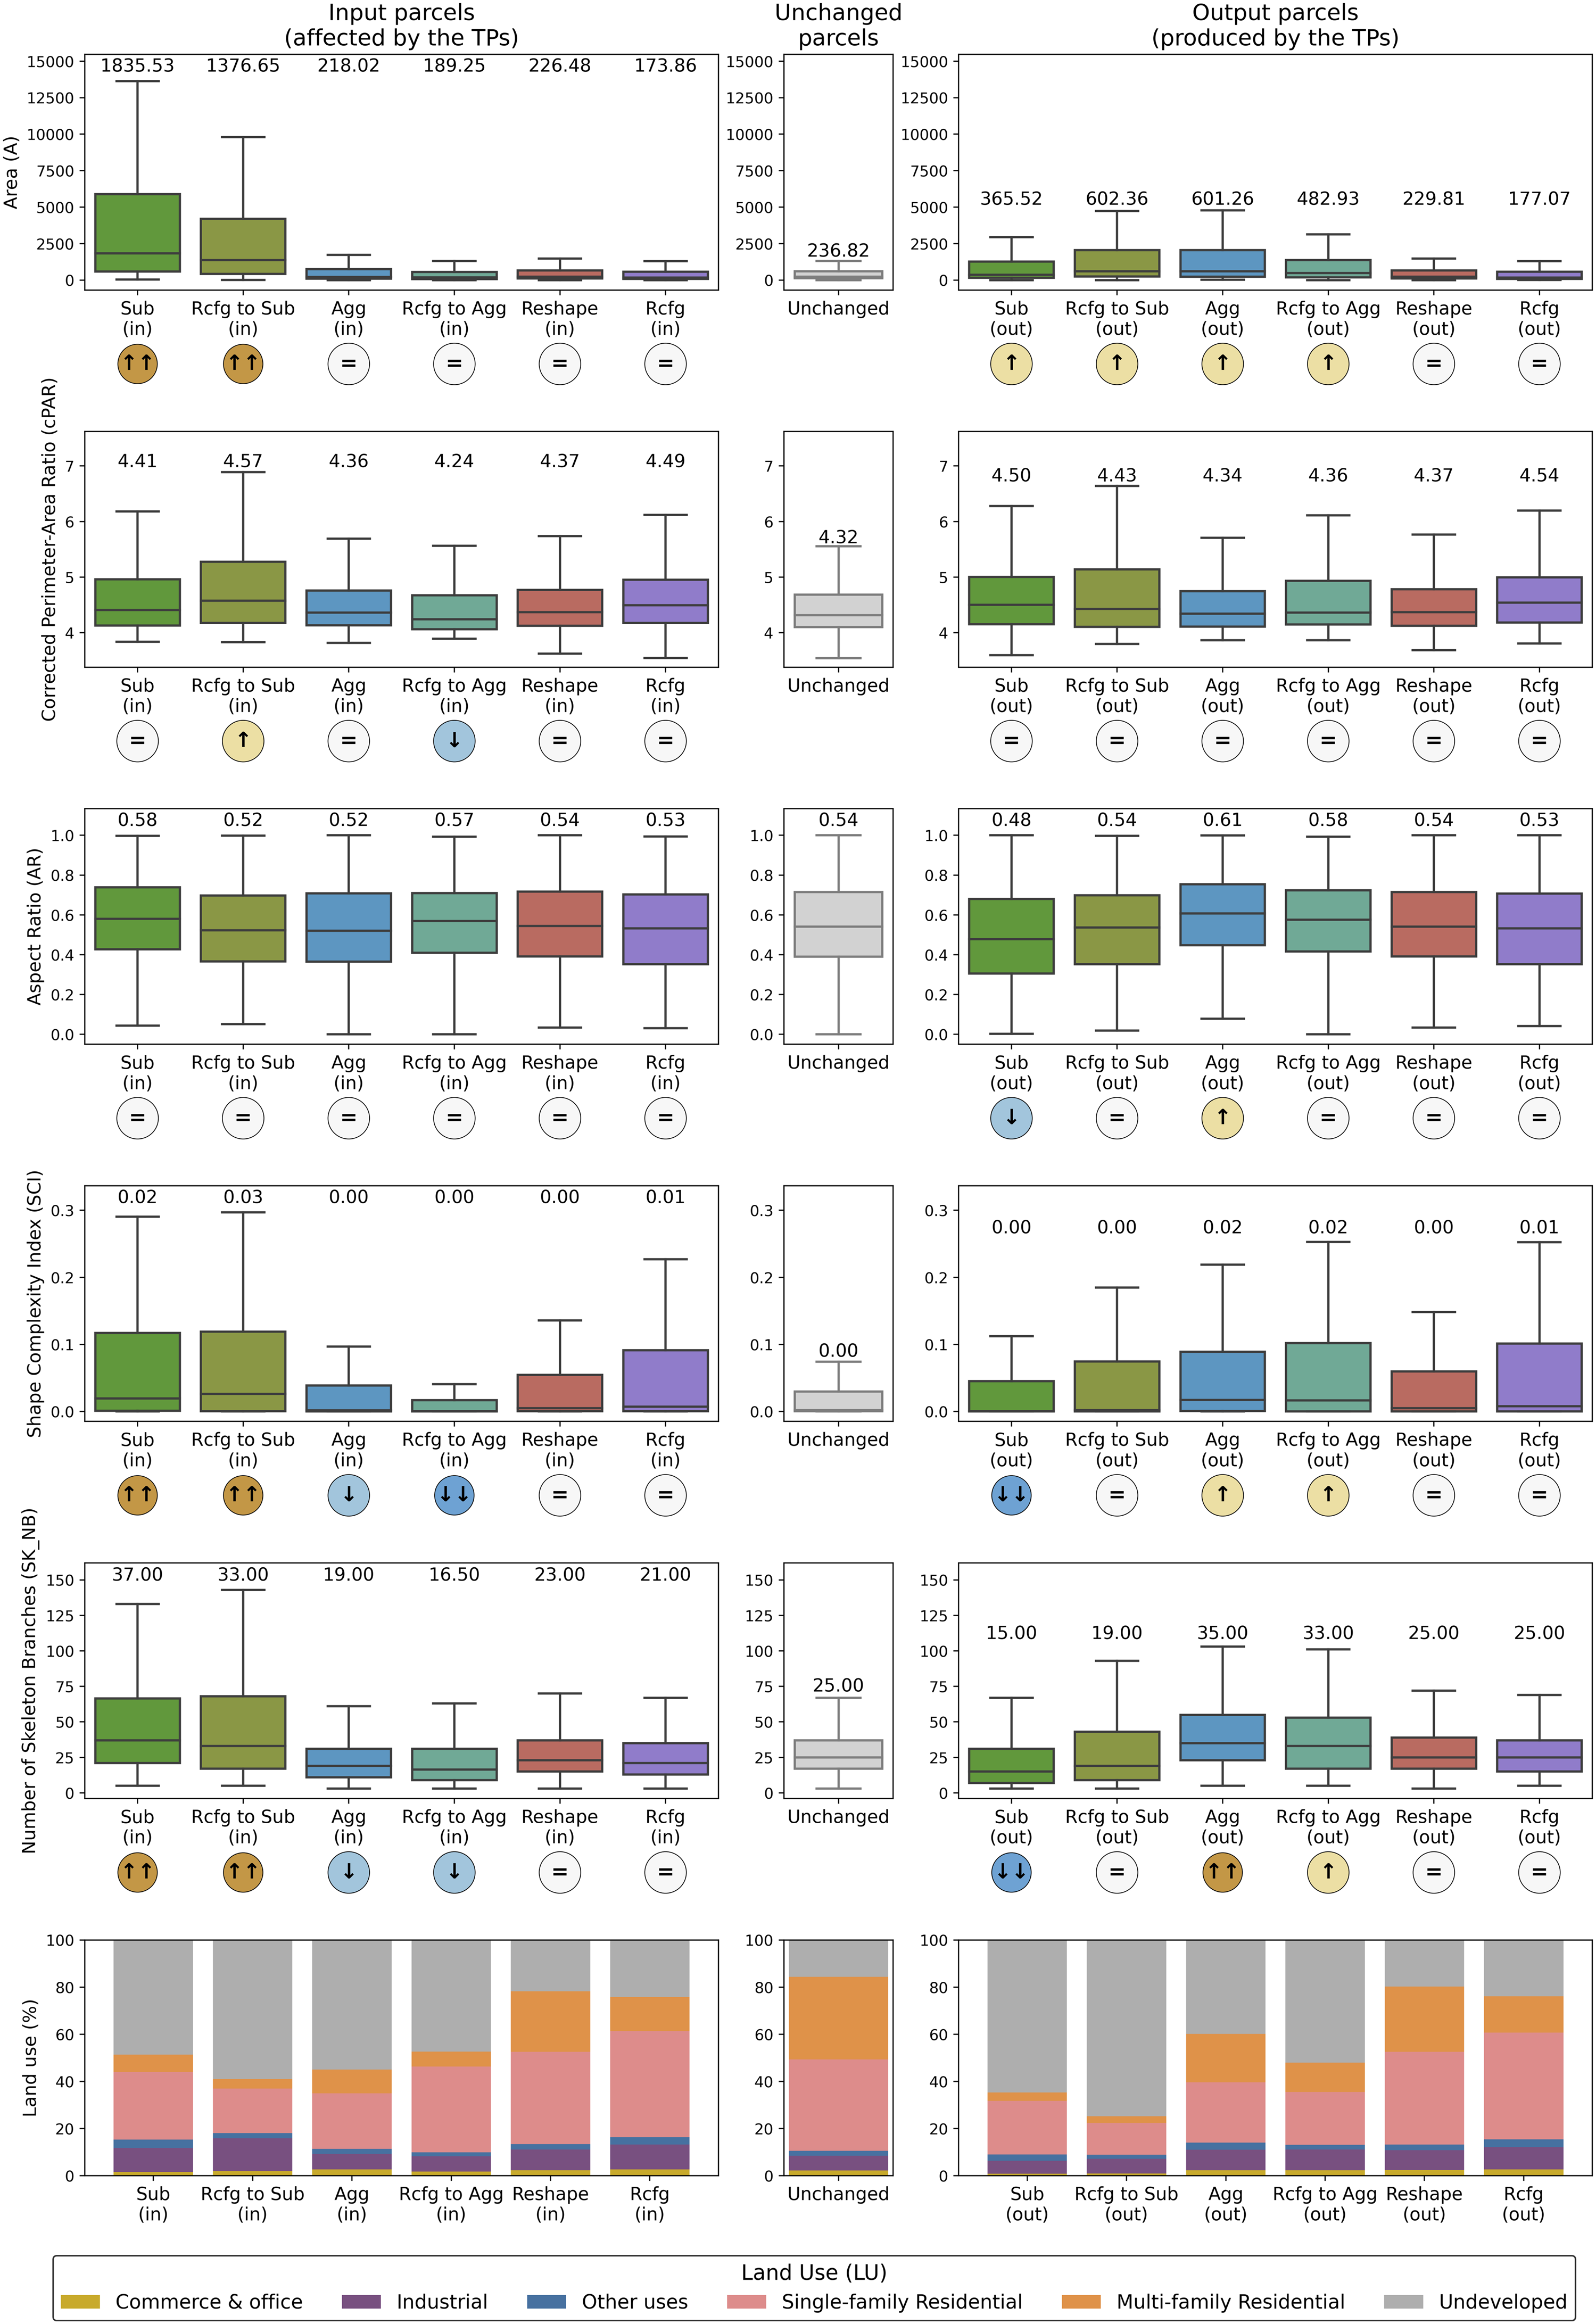
Looking at these findings, from the TP perspective, Reshape and Reconfiguration didn’t show remarkable differences between the spatial characteristics of either targeted or resulting parcels with unchanged parcels. Moreover, LU distribution was also very similar to Unchanged parcels, so both processes didn’t seem to either target or produce parcels with a specific pattern.
On the other hand, the remaining TPs show significant differences in either spatial metrics or land use distribution, some of them reinforcing the results from previous sections. First, important similarities are observed between Subdivision and Reconfiguration towards subdivision, which target parcels that are much larger (1853 m2 and 1376 m2 vs 263 m2) and more complex (comparing medians of SK_NB, 37 and 33 vs 25) than the rest and produce parcels that are still larger (365 m2 and 603 m2 vs 263 m2) but with a complexity that is reduced to the point of being simpler than any other (comparing medians of SK_NB, 15 and 19 vs 25) and shape is more elongated (0.48 AR for parcels resulting from Subdivision vs 0.54 for unchanged). The reverse pattern is observed for Aggregation and Aggregation towards aggregation TPs, which target parcels with low complexity (19 and 16.5 vs 25 median SK_NB) and average size (218 m2 and 189 m2 vs 237 m2) and produce parcels that are larger (601 m2 and 483 m2 vs 237 m2), more complex (comparing medians of SK_NB, 35 and 32 vs 25) and less elongated (0.61 median AR for parcels resulting from Aggregation vs 0.54 for unchanged).
Regarding the LU distribution of the input and output parcels, ‘Undeveloped’ are the most frequently targeted parcels by most of the TP, with some having a higher incidence (i.e. Subdivision and Reconfiguration towards subdivision). Moreover, Subdivision and Reconfiguration towards subdivision appear to reduce the total developed land, since ‘Undeveloped’ proportion experiment a noticeable increase from input to output parcels for these processes. Additionally, ‘Single-family residential’, which is the most common developed LU, is strongly represented in targeted parcels of Reconfiguration and Reshape processes.
Discussion
Transformation processes patterns
Drawing on the results, the total number of parcels increased between 2022 and 2024 (higher number of resulting parcels than targeted) due to large areas being redistributed through the dominance of Subdivision and Reconfiguration towards subdivision. However, this increase does not unequivocally indicate the development of new urban functions, since it mainly affects undeveloped land in terms of both target and resulting parcels. In terms of geometric alterations, the effect of these two TPs is clear: large parcels are split to greatly reduce their size and produce parcels with simple, elongated geometries. Together with the observed LU changes, these TPs often facilitate new developments, which may be more diverse within already developed zones. These patterns highlight the structural role of the aforementioned TPs in urban dynamics, as they are directly associated with the intensification of urban land, and, consequently, the adaptation of the urban fabric to finer-grained urban configurations that are often accompanied by infill growth and the re-parcelling of previously underutilised land that needs to be prepared for future development.
By contrast, Aggregation and Reconfiguration towards aggregation produced opposite but more varied effects: integration of small simple-shaped geometries into large and more complex geometries. In some cases, these changes were accompanied by the consolidation of urban spaces through the agglomeration of LU and the reduction of heterogeneity. In other cases, they appeared to prepare large areas for future large-scale projects. This could suggest that these processes are part of a more complex land redistribution process involving different sequential TPs stages, with aggregation TP preceding subsequent subdivision TP.
A third group of Reshape and Reconfiguration TPs produced different results and are best interpreted as non-impactful in terms of urban changes. They minimally alter LU and do not substantially alter the parcel geometry and thus the urban system. Although different thresholds have been implemented, significant proportion of these processes seem to be linked to cadastral adjustments and geometric corrections (boundary refinements, alignment fixes, and precision updates). As these are the most frequent group of identified processes, it suggests that cadastral updates mainly focus on correcting data with no meaningful land development changes.
Taken together, the results support a straightforward synthesis of three TP families, each with a distinct urban meaning:
We believe that the proposed conceptual framework enables the following: (i) a rigorous definition of TPs based on spatial analysis tools and their mapping across a large proportion of Spanish cities; (ii) the spatial characterisation of changes in parcel geometries; and (iii) the identification of target parcels undergoing transformation processes.
Moreover, the identification, mapping, and description of these TPs could contribute to urban studies in several ways. Firstly, examining the location of these transformation processes within urban areas (e.g. centre vs periphery) may contribute to understanding their relationship with spatial growth patterns such as infilling, edge expansion, and outlying development (Liu et al., 2010), both internationally and within the Spanish context. In this regard, analysing TPs in connection with specific urban expansion and planning policies may be particularly relevant, including the Urban Action Plans (PAUs) in Madrid (Martinez Perez and Walker, 2018), large residential development projects such as the Madrid Nuevo Norte project (Metaxas et al., 2021), current rehabilitation, regeneration, and renewal agendas in Spain (Rodríguez-Suárez et al., 2023), and the long-term European objective of achieving ‘no net land take’ by 2050 (Evers, 2026).
Secondly, the definition of TPs may also be useful in the field of urban simulation using vector-based cellular automata (VCA) models (Molinero-Parejo et al., 2023). These models, which can incorporate parcel transformation algorithms, could simulate both urban growth/change and parcel transformations (Colomb et al., 2022; Dahal and Chow, 2014; Wickramasuriya et al., 2011) more accurately by identifying parcels subject to transformation processes and applying appropriate subdivision or aggregation algorithms to reproduce the spatial characteristics of such TPs.
Finally, the proposed framework could also support policy impact assessment and studies of urban densification or urban sprawl at a fine spatial scale when monitoring future urban processes. As observed, ‘undeveloped’ parcels undergo most TPs as a preliminary step prior to urban development. This may be highly valuable for detecting potential urban expansion before it occurs and before it can be captured by satellite imagery. Such capability would facilitate the control of outlying growth and the early identification of potential infill development.
Limitations and future research
Two limitations of this study should be highlighted: errors in cadastral data and time period considered in the analysis. Regarding the first one, cadastral data is not free of errors. Parcels with duplicate or erroneously designated CRs were found. This was solved with simple assignation of new unique CRs, which might result in overestimating new and extinguished parcels. Other errors were related to the geometry of parcels that lead to ‘translation phenomena’. This refers to a fictitious change in geometry caused by errors in the geometric cadastral definition of parcels. To avoid misclassification of these adjustments, different thresholds were tested, and the ones that yielded the best results were selected. Nevertheless, some fictitious processes are still present, overestimating the total amount of Non-Impactful processes, as previously discussed.
Regarding the second limitation, although the proposed methodology enables an exhaustive comparison between two cadastral parcel maps, the period considered is relatively short. Alternatively, historical cadastral data could have been used to analyse a longer temporal span; however, this would have limited the working scale and would not have allowed the inclusion of information on parcels’ land use. Nevertheless, since the main objective of this study was to establish a methodological framework for analysing TPs and their implications for cadastral parcels, the time period examined has been sufficient to define the main characteristics of the transformation processes.
Future studies may therefore explore longer temporal horizons and their relationship with urban expansion processes, urban planning policies, and the spatial location of urban processes (e.g. centre-periphery dynamics). We consider that making the results of this study publicly available through the interactive viewer will facilitate the development of these and other lines of research in this field.
Likewise, the richness of cadastral data enables new approaches to be explored when defining cadastral parcel TPs. Information on buildings within parcels could be used to derive detailed variables, such as building footprints or volumes. This could support fine-grained analyses of urban densification processes and their potential relationship with the proposed TPs.
Conclusions
In this study, we introduced an analytical framework to compare two highly detailed cadastral datasets for 48 Spanish cities. Its application highlighted a series of transformation processes in urban parcels from a geometric perspective, revealing three main types of processes: subdividing processes, aggregating processes, and non-impactful processes. While non-impactful processes were the most frequent, they accounted for a small proportion of total urban land and had very limited effects on parcel geometries. Subdividing processes, however, were the most impactful, both in terms of the total area of urban land affected and the number of parcels generated. In these cases, very large parcels with complex shapes were targeted, resulting in larger-than-average parcels with simpler geometries and a tendency toward high elongation, a common feature of residential parcels. Aggregating processes, by contrast, affected small and simple-shaped parcels, producing highly compact and geometrically complex parcels. Taken together, these processes predominantly concentrated on undeveloped land and in most cases the resulting parcels were not assigned a new LU. This finding indicates that geometric changes and LU changes do not necessarily occur together and may respond to partly different urban mechanisms. Recognising this decoupling is analytically important, because it positions cadastral geometric change as an autonomous component of urban transformation and not simply as an expression of LU change.
Supplemental material
Supplemental Material - Identifying and characterising urban land use transformation processes using cadastral parcel geometries: A case study of Spanish cities
Supplemental Material for Identifying and characterising urban land use transformation processes using cadastral parcel geometries: A case study of Spanish cities by Nikolai Shurupov and Francisco Aguilera-Benavente in Environment and Planning B: Urban Analytics and City Science
Footnotes
Acknowledgements
This paper has been developed in the context of ‘SIM4PLAN: Desarrollo de un prototipo multiusuario de ayuda a la planificación’ project, funded by the Spanish Government under National R + D Plan (2021-2023). Grant Agreement no. PDC2021-121568-C22 and the research program ‘Estímulo a la Excelencia para Profesores Universitarios Permanentes’ funded by University of Alcalá and the Community of Madrid (EPU-INV/2020/009). First author has been supported by the Spanish Ministry of Science, Innovation and Universities (MICIU), through a FPU doctoral fellowship (grant no. FPU21/06590). The authors would like to thank Linguaservice for English language revision. The authors would also like to thank the reviewers for their careful reading of the manuscript and their constructive comments and suggestions, which helped improve the paper’s quality and clarity.
Author contributions
Funding
The authors disclosed receipt of the following financial support for the research, authorship, and/or publication of this article: FPU doctoral fellowship (grant no. FPU21/06590), ‘SIM4PLAN: Desarrollo de un prototipo multiusuario de ayuda a la planificación’ Project (grant no. PDC2021-121568-C22) and ‘Estímulo a la Excelencia para Profesores Universitarios Permanentes’ research program (grant no. EPU-INV/2020/009).
Declaration of conflicting interests
The authors declared no potential conflicts of interest with respect to the research, authorship, and/or publication of this article.
Data Availability Statement
The data used in this study are publicly available from the by the Directorate General for Cadastre through its official data dissemination portal: https://www.sedecatastro.gob.es/. The entire methodology was implemented using the Python programming language, with the main support of Geopandas, scikit-learn, NetworkX and Matplotlib libraries. The source code, as well as the visualisation of the generated datasets, can be accessed via the following link to the paper repository: ![]() .
.
Supplemental material
Supplemental material for this article is available online.
Author biographies
References
Supplementary Material
Please find the following supplemental material available below.
For Open Access articles published under a Creative Commons License, all supplemental material carries the same license as the article it is associated with.
For non-Open Access articles published, all supplemental material carries a non-exclusive license, and permission requests for re-use of supplemental material or any part of supplemental material shall be sent directly to the copyright owner as specified in the copyright notice associated with the article.