
Abstract
We introduce a methodology and open-source code to construct a longitudinal dataset using georeferenced business data from Mexico’s National Statistical Directory of Economic Units (DENUE). The data includes the business’ coordinates and other geographic characteristics, but imprecision in the coordinates across years, lack of business IDs before 2015, and concerns with these recently introduced IDs make longitudinal analysis of business continuity difficult. Focusing on food businesses in Mexico City, we analyze data from 2010 (n = 416,898) and 2020 (n = 470,363) to build a longitudinal dataset that allows us to track businesses over time. We address key issues, including imprecise geographic coordinates, missing or incorrect values in critical variables, and discrepancies in business names across years. Our approach combines spatial and string-matching techniques to track businesses over time, achieving an 84% F1 score (a measure that balances precision and recall) when validated against official identifiers. Although our case study centers on food businesses, the methodology can be adapted to other industries, geographies, and similar snapshot-based datasets lacking unique identifiers, serving as a replicable tool for broader urban analytics. The dataset and code are publicly available on GitHub, providing researchers and practitioners with valuable resources to analyze economic and spatial dynamics in cities.
Introduction
Understanding the spatial patterns of retail has been a long endeavor among economists and geographers (Christaller, 1966; Isard, 1956). These patterns reflect broader trends in urban structure (Berry, 1967) and competition over space (Alonso, 1960), consumer behavior (Glaeser et al., 2001; Thurstain-Goodwin and Unwin, 2000), urban vitality (Jacobs, 1961; Montgomery, 1998), economic growth (Birch, 1987; Neumark et al., 2011), business resilience (Credit et al., 2023; Singleton et al., 2016; Wrigley and Dolega, 2011), and social inequalities (Deener, 2007; Zukin et al., 2009). In the last three decades, the field of retail geography has evolved through advancements in spatial modeling techniques (Birkin et al., 2003; Fotheringham et al., 2000), computational methods (Comber et al., 2020; Pavlis et al., 2018), and new data sources (Lansley and Longley, 2017). Consequently, retail business spatial data has become an essential tool for interdisciplinary urban research and practical applications. In this context, we propose a methodology to construct a longitudinal dataset from a public spatial database containing retail information for all of Mexico.
The National Statistical Directory of Economic Units (DENUE, Directorio Estadístico Nacional de Unidades Económicas) is a public dataset in Mexico maintained by the National Institute of Statistics and Geography (INEGI, Instituto Nacional de Estadística y Geografía) since 2010 (INEGI, 2020). It offers data on the identification, location, economic activity, and size of over five million businesses across the country. DENUE is updated regularly to remain relevant. Microbusinesses are updated every 6 months, while large businesses and key economic sectors are updated annually using administrative records and national surveys. A full update occurs every 5 years with the Economic Census being conducted in years ending in four and nine with data being updated and published the following year, ensuring that DENUE provides a reliable snapshot of Mexico’s evolving economic dynamics. Similar datasets exist in other countries, such as the U.S. National Establishment Time Series (NETS), Data Axle, or the UK Business Structure Database, but these are either proprietary or lack precise georeferencing. By contrast, DENUE’s public, spatially detailed data make it uniquely valuable for replicable urban research in the Global South.
Despite ongoing data collection, the snapshots were largely independent across different years until recently, making it difficult to track individual businesses over time. To address this limitation, we outline how to construct a longitudinal dataset from the 2010 and 2020 snapshots. We highlight challenges in data cleaning and tracking businesses over time. We validate our methodology using 2015 and 2025 data where official identifiers are available, demonstrating strong matching performance (see Appendix). Finally, we examine food retail establishments to characterize the “birth,” “death,” or “survival” of establishments to understand business demographics, as shown in previous studies (Anselin and Farah, 2023; Carroll and Hannan, 2000; Van Wissen, 2002).
We create this methodology and code as a guide for researchers to replicate the process, enabling them to construct their own longitudinal dataset using Mexican business data. Specifically, we provide a starting point for DENUE users, highlighting data cleaning challenges and methods for creating a longitudinal dataset, which can improve dataset quality and open new research possibilities for future analyses (Arribas-Bel et al., 2021). Our method provides an alternative, flexible, and longitudinal approach to defining business continuity that does not rely on official identifiers. This is crucial for longitudinal analysis before 2015 and because of notable differences in the locations and names of some businesses with the same official identifier across years in recent DENUE datasets. To support reproducibility and verification, we share the original 2010, 2015, 2020, and 2025 datasets 1 from INEGI along with our R code 2 and final longitudinal data product 3 in a public GitHub repository 4 . Researchers in geography and related fields can use this dataset to compare business survival models, analyze retail distribution over time, and integrate it with other datasets at various geographical scales, further expanding research opportunities.
Challenges of building a longitudinal dataset with DENUE
The DENUE dataset faces several data collection and consistency challenges. Enumerators walk through the city to gather information and record latitude and longitude coordinates for businesses, but these coordinates vary between years, even for the same store, which makes it difficult to match businesses over time. Additionally, key variables such as postal codes and phone numbers are often missing or contain incorrect values, complicating consistent analysis. For example, both the 2010 and 2020 datasets include a variable called “edificio” (building), which indicates if a business is located inside a public market, but the content within this variable is largely missing in the 2010 dataset, making some analyses much more difficult.
Moreover, identifying the same business across years is challenging due to name inconsistencies, in addition to geographic inconsistencies. Similar difficulties have been previously documented through reliance on manual matching of DENUE records, underscoring the need for automated and replicable methods (Reyes and Suárez, 2022). In densely populated areas like Mexico City, where many businesses are located on the same block, it becomes difficult to identify and track the existence of a business over time, since there might be several stores of the same type within one block. Additionally, the same business is often coded with different names in different years. For instance, as shown in Figure 1, an establishment selling chicken appears as “Pollería Lupita” in the 2010 dataset, while in the 2020 dataset it is listed simply as “Bachoco.” These variations in geographic coordinates and business names require nuanced matching methods to accurately track businesses across different years. Example of name inconsistencies across the years.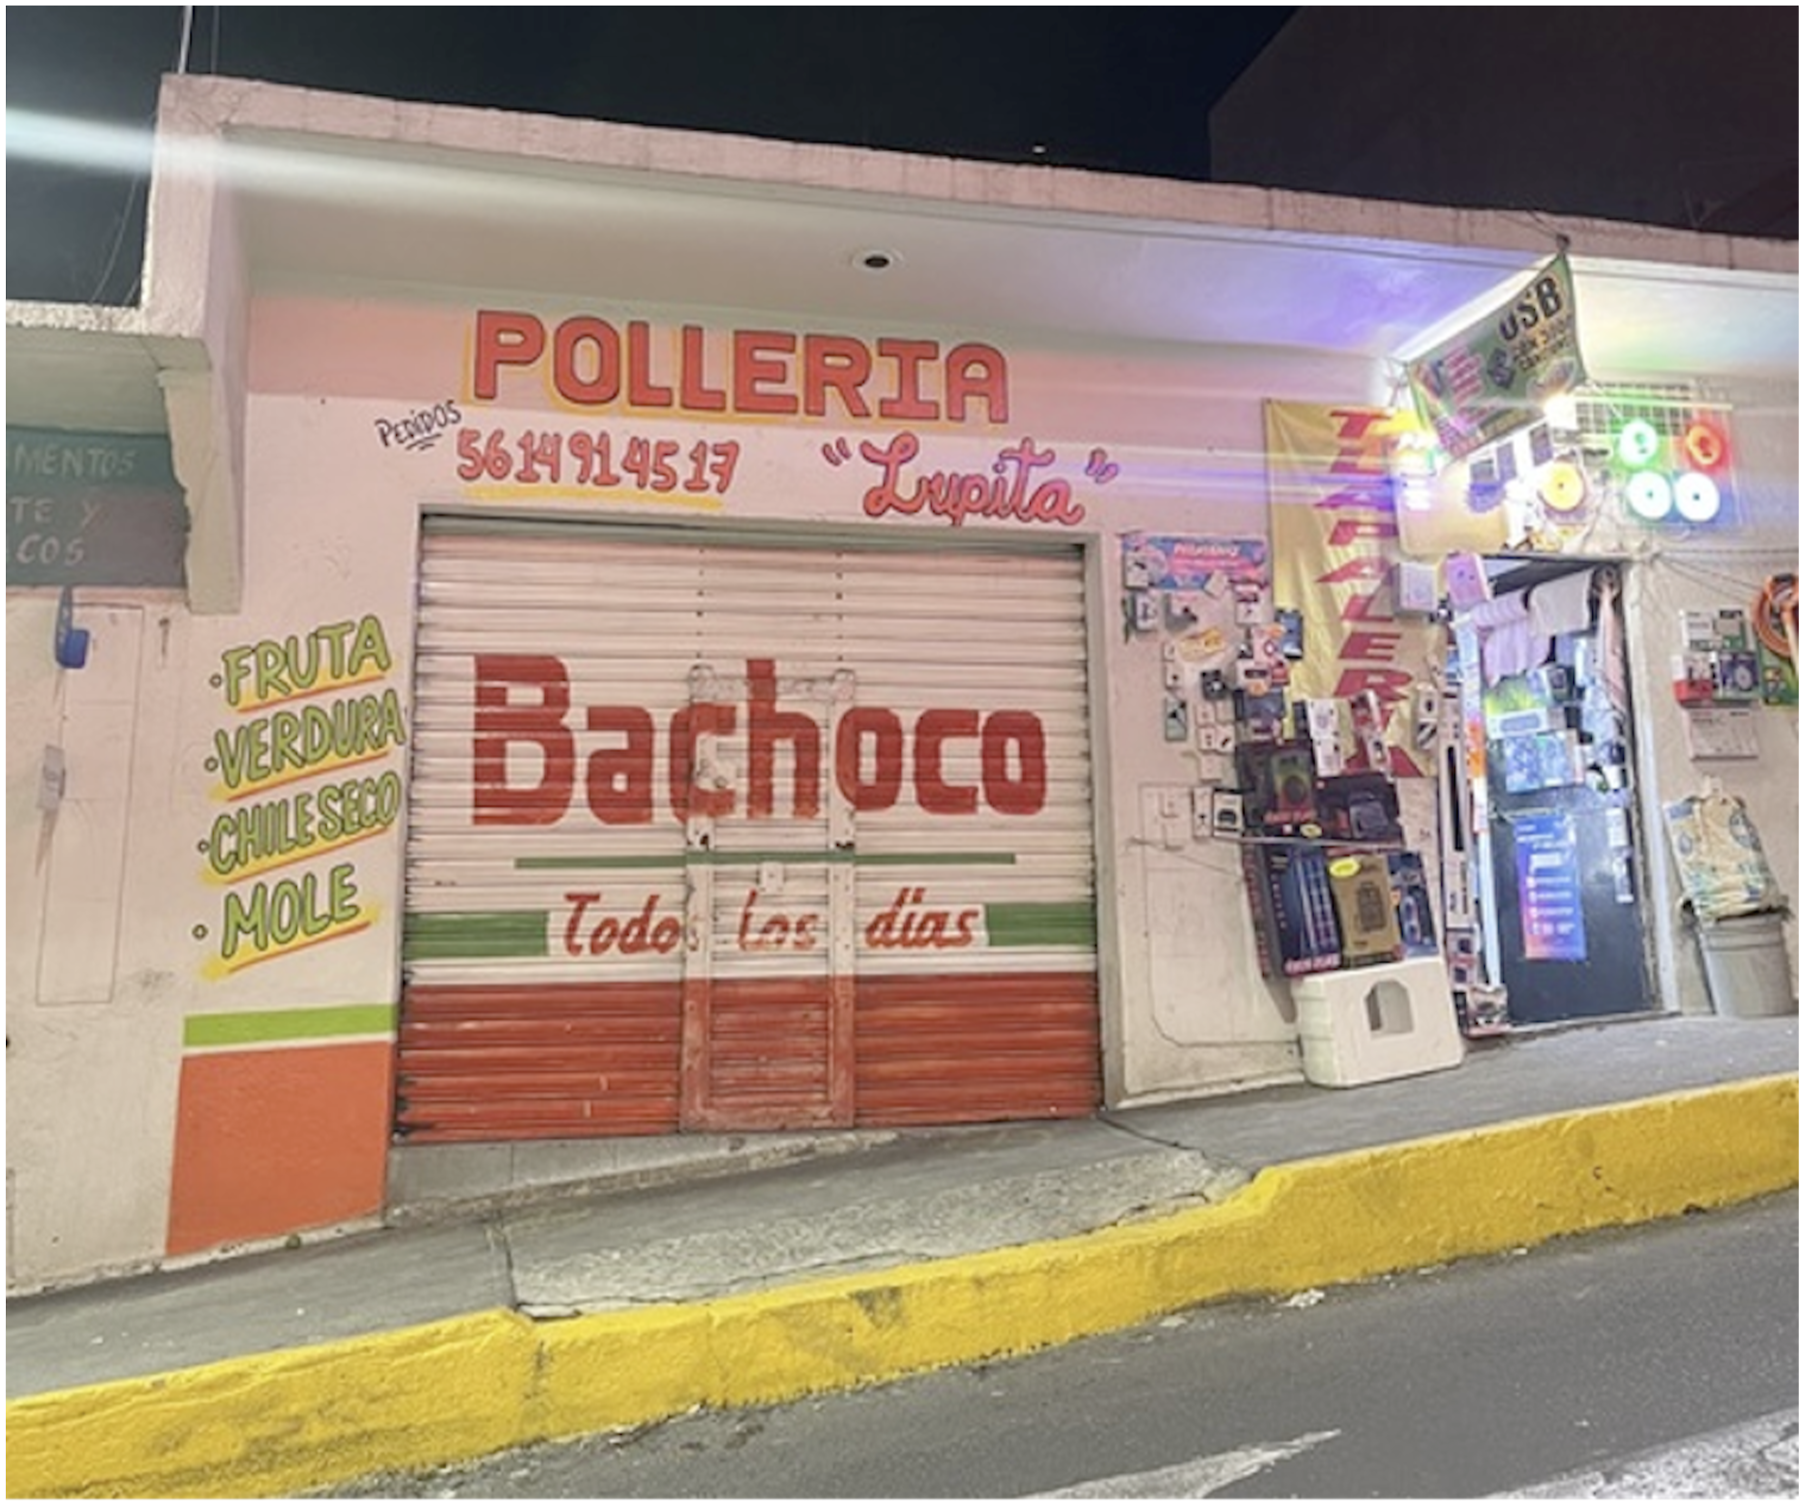
Building the longitudinal dataset
This section outlines the process of constructing a longitudinal dataset using the 2010 and 2020 DENUE data for Mexico City, with a focus on food businesses. We carry out multiple steps to clean and prepare the data, including handling inconsistencies in business classifications and geographic coordinates.
General data cleaning
We begin by importing the 2010 and 2020 datasets, standardizing variable names, normalizing textual data (e.g., converting entries to lowercase and removing accents), and adding unique identifiers to rows in the dataset. By looking at the NAICS (North American Industry Classification System) codes relevant to food businesses 5 , we then perform an initial descriptive analysis to understand the distribution of businesses across different categories in 2010 and 2020. Through analyzing establishment names, we also reclassify NAICS codes when appropriate; this applies most often to initially misclassified convenience and dairy stores.
Inconsistent establishment names
As we have previously mentioned, the names of the establishments are particularly messy and we found that the names that are modified the most across years are for small neighborhood stores, usually called “abarrotes,” “abarroterías,” or “misceláneas.” These establishments are small grocery stores that cater to locations ranging from residential neighborhoods to busy commercial streets, offering convenient access to everyday essentials. They typically sell a variety of basic goods, including packaged foods, beverages, cleaning supplies, personal care products, and sometimes fresh produce or household items. Despite their small size, these establishments are crucial to study, as they account for the largest share of food and beverage purchases among all types of establishments in Mexico (Farah et al., 2022).
The first challenge we face when cleaning data on small neighborhood stores are the typos that enumerators introduce when registering the stores, not only of the names of the stores, but by misspelling “abarroterías,” or “misceláneas.” Since there is little consistency across years, we homogenize store names by re-coding all possible spellings and versions of “abarrotes.” We also homogenize the names of all fruit and vegetable stores and their alternative names (e.g., recaudería), as well as other common stores where we identify alternate names. To include other stores that might have misclassified NAICS codes, we reclassify stores that contain “abarrotes” as NAICS code 461110 (small neighborhood stores), but we then filter out wholesale stores (431110), restaurants with abarrotes (722511), or pharmacies explicitly without minisupers (464111). After we extensively clean the names of the establishments, we subset the data within our NAICS categories of interest relevant to food businesses.
Deduplicating and handling public markets
We analyze duplicate coordinates corresponding to stores in the exact same location or very similar locations due to being located inside public markets. Within exact coordinate duplicates, we first find chain stores (such as convenience stores), and we deduplicate that data, retaining only one representation of each establishment.
Public markets in Mexico City contain many establishments that are of interest, yet stores in these markets operate under different business dynamics compared to standalone businesses outside the markets. So next, we eliminate establishments that are part of public markets by excluding stores (103 in 2010 and 20,242 in 2020) whose names or building contain specific keywords (e.g., plaza, hallway, market) that indicate their location within markets, or those that have an entry in the “number of stalls” for that business. It is important to note again that these variables on the building type and the number of stalls have high missingness for the 2010 dataset. Then, we use open data on public markets from the city’s open portal 6 to identify establishments within a strict 100-m buffer around each public market and remove them (17,688 in 2010 and 5532 in 2020). This initial distance approximates the core footprint of most public markets in Mexico City, including both the main structure and immediately adjacent stalls. Then, we expand the buffer to 300 m, eliminating all establishments that have exact coordinate duplicates within that catchment area (2,273 in 2010 and 579 in 2020). The expanded buffer captures the influence of larger markets that physically extend beyond 100 m from their center, and it helps remove persistent duplicates that were still present after the first round of removal. This second buffer distance was determined through visual inspection of maps around known markets where duplicates persisted. Lastly, we remove remaining duplicates by checking for redundancy across geographic (coordinates, census tract, block) and business characteristics (name, industry code), removing 1,274 stores in 2010 and 101 in 2020.
Building a longitudinal dataset using fuzzy matching
At this point in the data cleaning process, there are no duplicate establishments within a given year’s data according to coordinates and the names of the establishments are reasonably clean, so we join the data first using exact matches of geographic variables—municipality, census tract (AGEB), and block—as well as the NAICS codes. However, this process results in a many-to-one match, as some establishments within a block in one year may initially correspond to multiple establishments in another year. We resolve the many-to-one matches by employing a fuzzy matching technique. We calculate the string distance between establishment names and the Haversine geographic distance between coordinates. Before performing these calculations, we further clean the establishment names by removing the word “abarrotes,” which improves matching accuracy.
Sensitivity analysis
As mentioned, the determination of survival is based partially on matching of the location (coordinates) and name of an establishment across the two datasets from 2010 to 2020. These are matched based on joint cutoffs for the Haversine distance between two locations (in meters) and the string distance between the names of the establishments (calculated using the Jaro–Winkler method which outperform other methods, as we show in the Appendix). We test the sensitivity of our results to these cutoff values, as shown in Figure 2. We vary both the cutoff for string distance and for Haversine distance jointly, and we find that after a certain point (approximately 200 m), geographic distance has little additional impact on match rates. However, the string distance is much more impactful across the range of values tested (0.015, 0.45). In Figure 2, the point representing the combination of Haversine distance and string distance for our initial matched dataset is shown in black (at 0.3 string distance, 150 m Haversine distance). Since we also find that some establishments have a larger footprint (e.g., supermarkets), we accept matches from another cutoff combination that is stricter in terms of string distance (0.2), but less strict in terms of geographic distance (350 m). Additionally, there are some businesses that have more moderate but acceptable differences in names (string distance less than 0.5) due to the nature of the data collection across years, but are located less than 15 m from a potential match. We also include these businesses as additional matches. We choose this combination of additional cutoffs in our analysis due to the validation with official IDs shown in the Appendix, where these cutoffs show to produce optimal match-recovery performance. We include the string and Haversine distances as variables in our matched dataset, so users can change these cutoffs based on desired precision. These thresholds can have important implications depending on the research question. For example, stricter thresholds may be appropriate for studies of firm-level behavior, while more relaxed thresholds may be suitable for broader spatial trends. Sensitivity analysis for defining string and geographic distance cutoffs.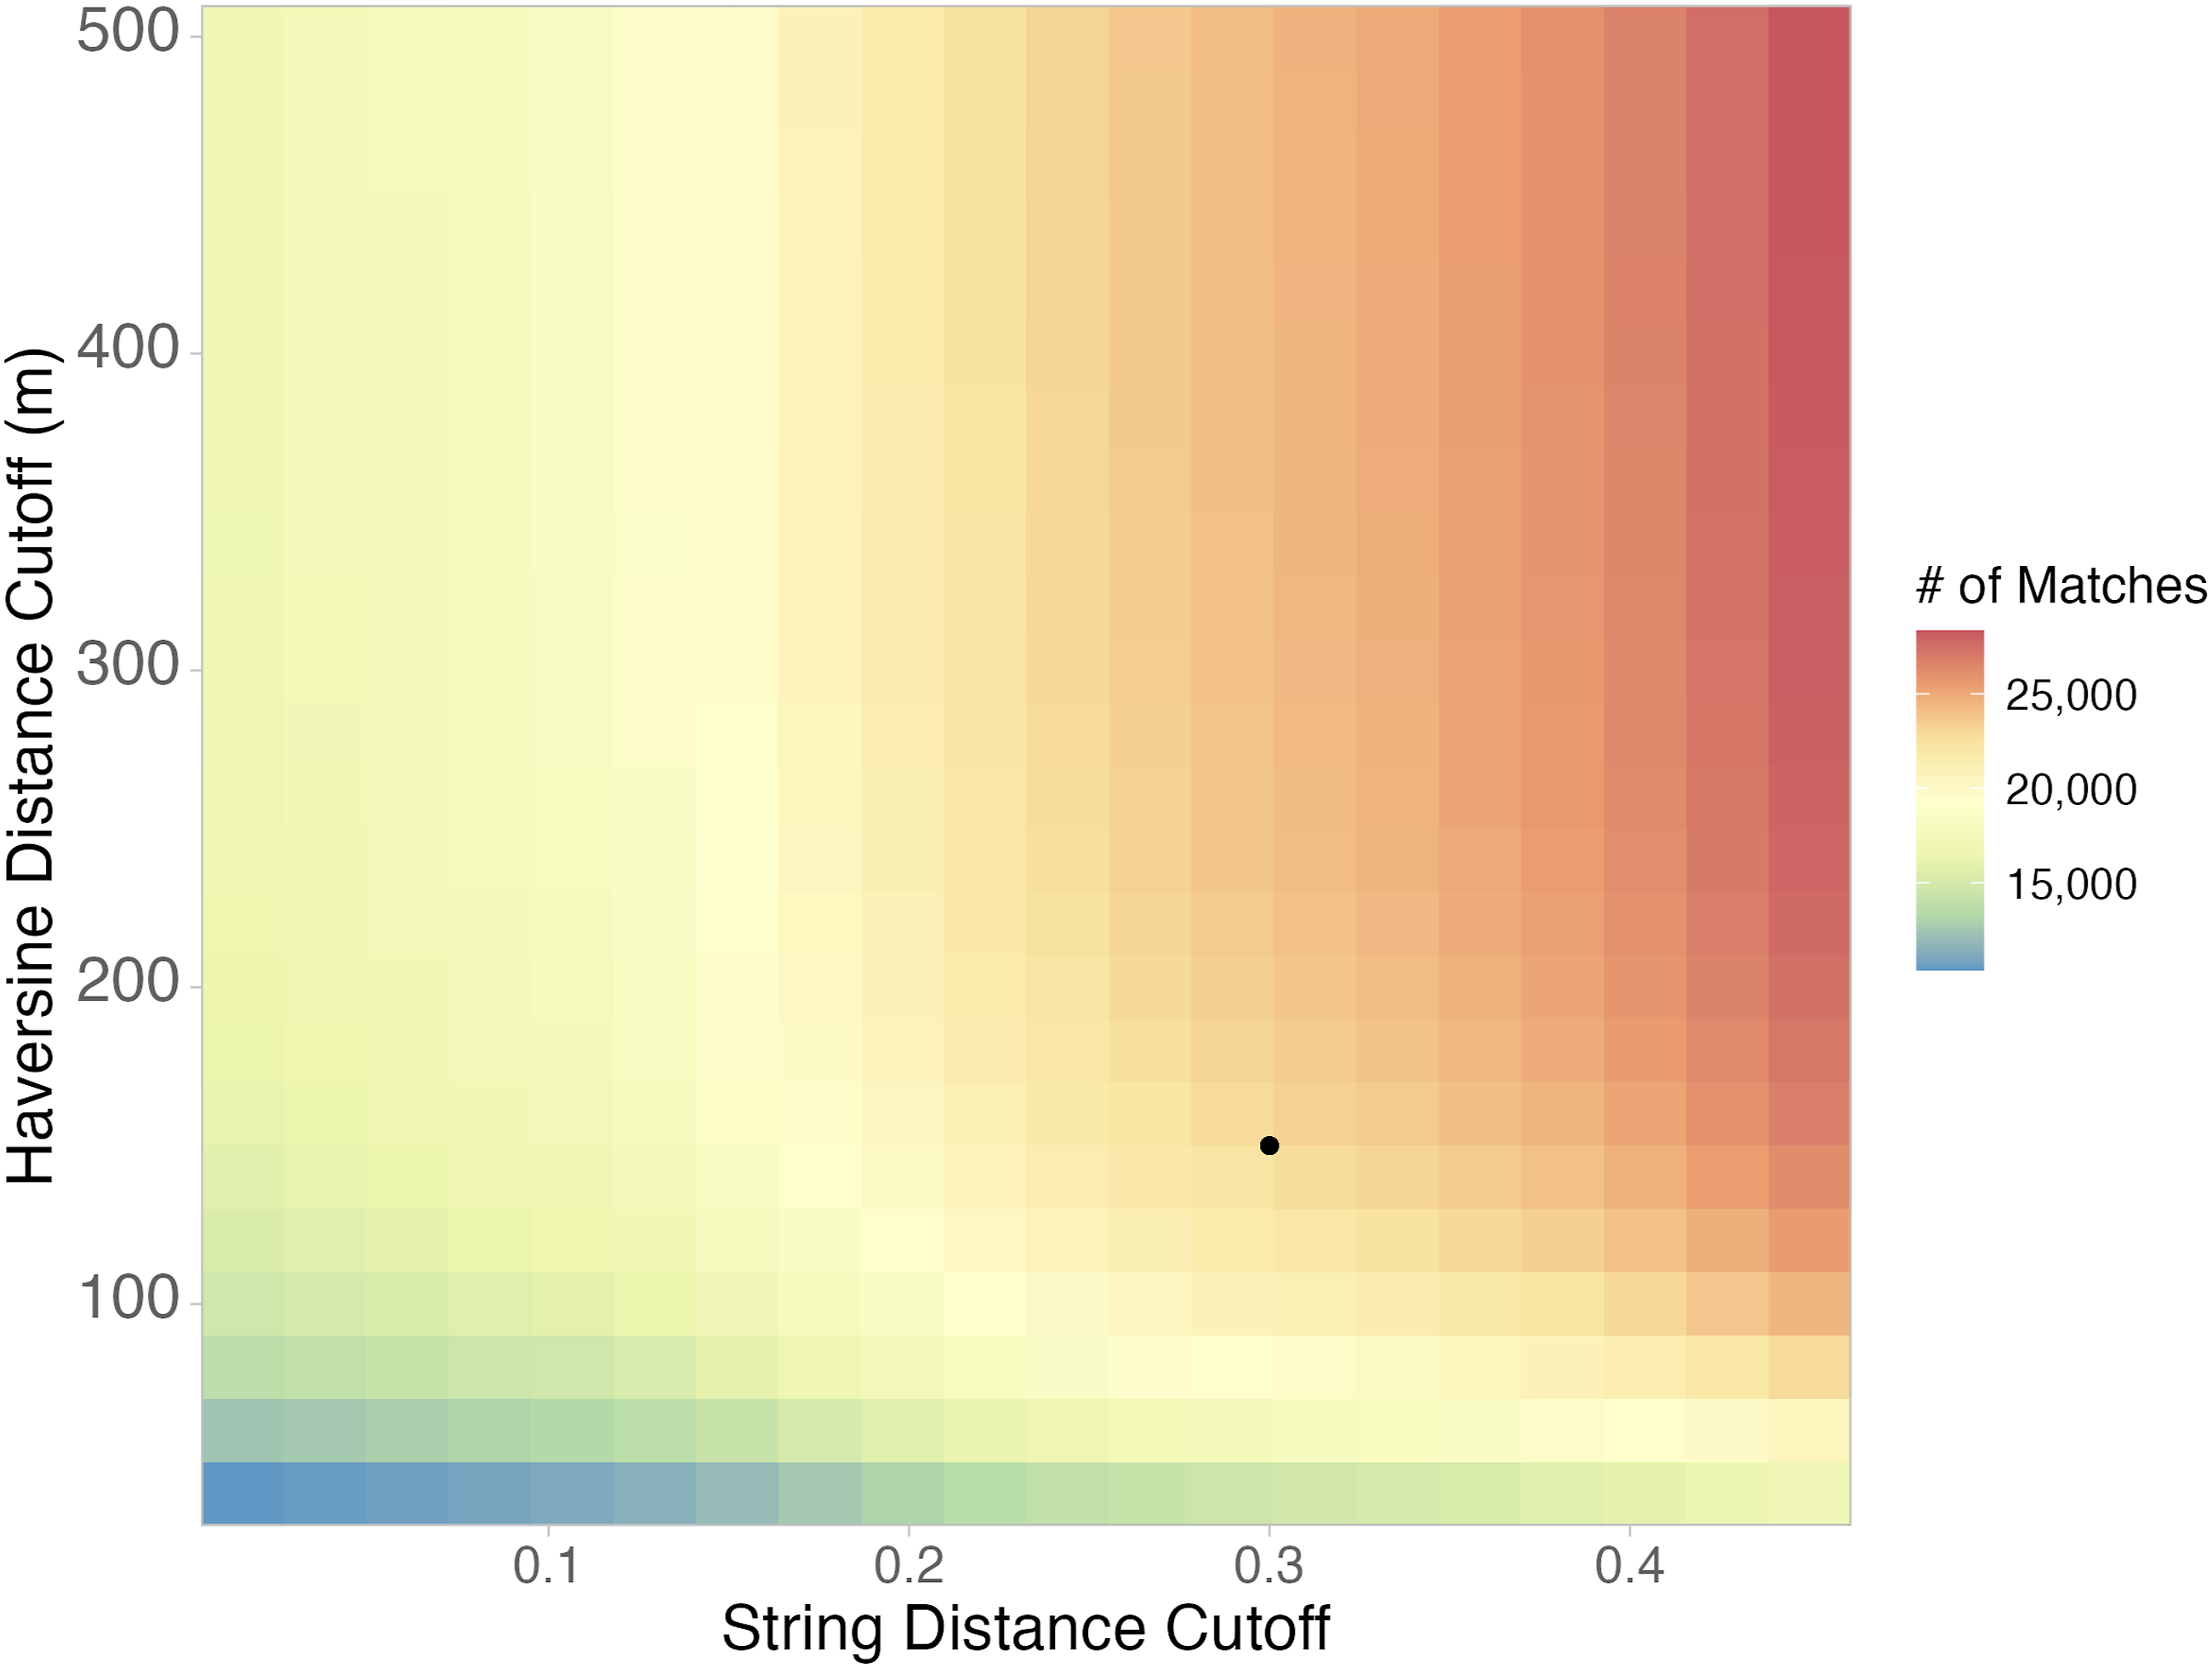
Final business continuity analysis
Once we identify the matches, we create a final dataset that determines businesses that “died” (ceased to exist), those that were “born” (newly established), and those that “survived” (continued to exist in a similar location and with a similar name) during the study period. This classification helps to understand the dynamics of business turnover. For the analysis of survival, we assign a unique reference number to each establishment after cleaning and we identify 25,261 surviving establishments, 45,216 that ceased to exist, and 44,862 new establishments. Our overall survival rate for food businesses from 2010 to 2020 is estimated to be approximately 36%. As shown in the Appendix, our method estimates the survival rate to improve between 2015 and 2025 to 44%. These results align with our expectations and extend findings from prior studies on patterns in small-retail turnover that consider shorter time periods than ours (Anselin and Farah, 2023; Coad, 2018).
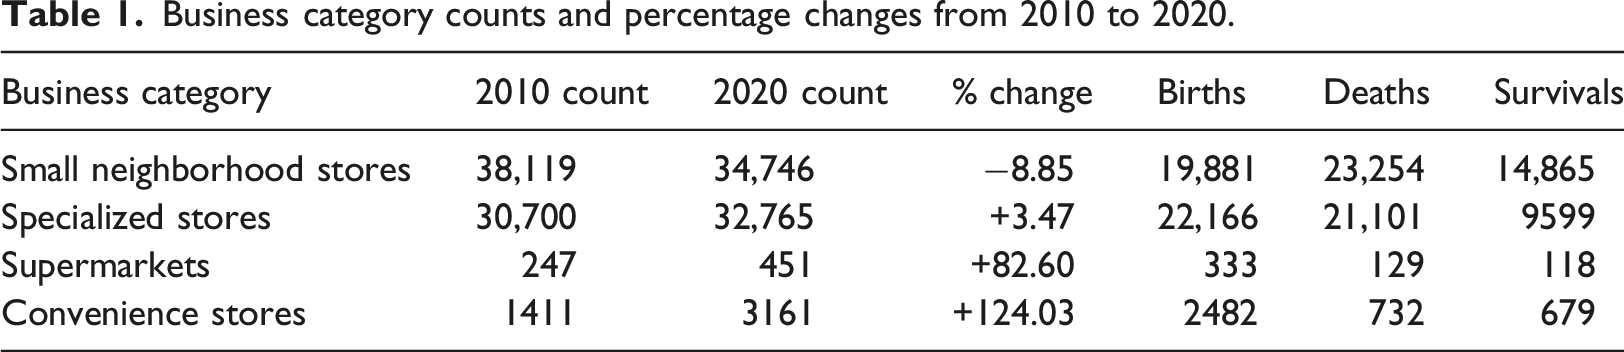
Business category counts and percentage changes from 2010 to 2020.
Conclusion
This article describes and builds upon the publicly available business data product which INEGI maintains. Our code matches food businesses across 2010 and 2020 and highlights the challenges of constructing longitudinal datasets from the DENUE database, particularly in terms of geographic inconsistencies and business name changes. Our method can be extended to any two time periods to aid researchers in longitudinal analysis of business trends; it is especially useful in keeping consistent definitions of business continuity before and after the introduction of official IDs. This process is important because longitudinal business data can deepen understanding of consumer behavior, economic vitality, business resilience, and social inequalities.
Beyond Mexico, our methodology offers a replicable framework for constructing longitudinal datasets from snapshot-based business registries common in many countries. Similar challenges exist in business datasets worldwide, from Points of Interest data to local business registries in Global South cities, where independent temporal snapshots lack persistent identifiers. Our string and spatial matching approach can be adapted to different languages, business naming conventions, and geographic contexts.
To improve the usability of DENUE for longitudinal research, we recommend evaluating the current business identifier system based on our analysis. DENUE introduced official IDs in 2015, which allowed matching across releases but did not provide consistent or guaranteed longitudinal continuity. It was only in 2021 that INEGI introduced the Statistical Business Key (CLEE, Clave Estadística Empresarial), a more comprehensive and permanent identifier system intended to follow businesses over time. Using 2015 IDs in our initial analysis of these official IDs, our validation in the Appendix reveals limitations: 34% of matched businesses through official IDs show coordinate shifts exceeding 10 m between the 2015 and 2025 censuses, and some businesses receive new IDs despite relative spatial and name continuity. Similar issues persist even after the introduction of the CLEE between 2021 and 2025: 4% of establishments matched through CLEE and coded in the ID as not experiencing a geographic relocation are more than 100 m apart, raising questions about how continuity is operationalized within the system. Although the CLEE encodes information on changes to location, NAICS, and establishment size, details about these changes remain confidential and unclear for research purposes (INEGI, 2025). Thus, a robust approach to analysis of business survival would incorporate the new CLEE system alongside thorough analysis of additional researcher-defined business survivals/deaths. Our methodology encourages careful examination of businesses that have changed location or name and is especially crucial when considering a longitudinal analysis that includes time periods before the introduction of CLEE identifiers.
Importantly, our validation shows that relying uncritically on official IDs can lead to misleading definitions of business survival, especially in spatial or firm demographic analyses. Our method recognizes that apparent shifts in location or name may reflect data inconsistencies rather than actual relocations or changes, but defines business continuity as maintaining relatively similar location and name. We encourage users to approach the dataset critically and consider these nuances when conducting longitudinal analyses. Our validation exercise demonstrates both the value of the current ID system and areas for improvement. Incorporating our method would enhance the reliability of longitudinal studies and expand their temporal scope, allowing for more precise analysis of business dynamics and supporting deeper insights into urban and economic development in Mexico City and beyond.
Footnotes
Acknowledgments
The authors thank the editor and anonymous reviewers for their constructive feedback, which improved the manuscript.
Ethical considerations
This study is compliant with ethical standards as this study was conducted using open access data from Mexico.
Funding
The authors disclosed receipt of the following financial support for the research, authorship, and/or publication of this article: This material is based upon work supported by the National Science Foundation under Award Number 2316857.
Declaration of conflicting interests
The authors declared no potential conflicts of interest with respect to the research, authorship, and/or publication of this article.
Data Availability Statement
The DENUE data product is available to download on the INEGI website here: https://www.inegi.org.mx/app/descarga/default.html. All data and codes used to create the dataset can be found on GitHub at this repository: ![]() .
.
Yihan Zhao is now at the School of Operations Research and Information Engineering, Cornell University, Ithaca, NY, USA, but was at Carleton College when the research was conducted. Xinyi Leng is now at the School of Data Science, University of Virginia, Charlottesville, VA, USA, but was also at Carleton College when the research was conducted.