
Abstract
Metropolitan regions frequently exhibit hierarchical imbalances between central cores and peripheral subcentres, resulting in uneven accessibility, and service concentration. This paper presents Fractalopolis as a multi-scale scenario-modelling framework that encodes metropolitan hierarchy through the integration of fractal geometry, central-place logic, demographic allocation, and accessibility-based satisfaction indicators within a GIS environment. Applied to the Metropolitan City of Cagliari (Italy), a coastal-insular system characterised by strong edge effects and statutory environmental constraints, the model reproduces existing hierarchical gradients and evaluates alternative development scenarios through controlled amenity redistribution and residential additions. Results show that service-led reinforcement of peripheral nodes produces disproportionate improvements in suitability, whereas densification without proportional service upgrading yields limited gains. By embedding regulatory and ecological masking within hierarchical modelling, the study advances Fractalopolis toward a regulation-aware, transferable decision-support methodology for environmentally constrained metropolitan contexts.
Keywords
Introduction
One of the most striking features of contemporary metropolitan development in Western countries is urban sprawl driven by increasing car use, which enables households to locate in quieter, low-density areas often close to natural leisure environments but far from jobs and essential services. However, negative impacts of this evolution are well-known, including land consumption and fragmentation of natural areas, biodiversity loss, increased pollution and energy consumption, and the resulting deterioration of environmental quality. This has sparked a long-standing debate on sprawl, compactness, and proximity-based planning (C40 Cities, 2021; Deprêtre et al., 2024; Torlini, 2025). A return to more compact forms has been proposed (Krier, 1998). However, it is not evident that car use and energy consumption are systematically reduced through densification alone (Bouwman, 2000; Simmonds and Coombe, 2000). Moreover, densification has been identified as a medium-term risk potentially triggering relocation to less dense areas and renewed suburbanisation (Schwanen et al., 2004), and it may also intensify environmental stress, including urban heat island effects (Kuttler 2011; Mutzu Martis, 2024). Overall, these debates suggest that metropolitan performance depends not solely on density, but on the structured distribution of functions and accessibility across hierarchical levels. Metropolitan systems are increasingly understood as multi-scalar, hierarchical, and adaptive socio-ecological structures (Meerow et al., 2016; Živanović, 2019), in which intra-urban and inter-urban flows of people and goods generate spatial patterns that often exceed the capacity of existing transport networks (Batty, 2020). This growing complexity calls for analytical frameworks capable of integrating environmental, spatial, and social dimensions within a unified modelling structure (Emekci, 2022), especially in the context of rapid 21st-century urbanisation and the progressive reconsideration of car-dependent urban forms (Jiang, 2024). Across planning theory, multiple traditions have sought to interpret the structural organisation of urban systems (Manson and O’Sullivan, 2006; Healey, 2006; Batty, 2020; Keith et al., 2023) to classical central-place theory and fractal geometry (Christaller, 1933/1980; Batty, 2020; Wang et al., 2023). These perspectives converge on a shared insight: urban systems exhibit nested hierarchical structures that cannot be reduced to density gradients alone.
Among recent models, the proximity or x-minute city concept (Moreno et al., 2021; Logan et al., 2022, Sepehri and Sharifi, 2025) proposes reducing car dependency by locating essential services and social activities within short distances or travel times. While conceptually powerful, these approaches are predominantly implemented at the intra-urban scale and rarely address the structural organisation of metropolitan systems composed of multiple interdependent centres. At the metropolitan scale, it is useful to distinguish hierarchy from polycentricity. Polycentricity refers to the coexistence of multiple centres within the same urban system, whereas hierarchy concerns their differentiated functional rank, service intensity, and accessibility reach. A metropolitan region may therefore be polycentric yet strongly hierarchical (with centres differentiated by level), or polycentric in a more weakly hierarchical configuration (with centres playing comparable roles). Moreover, morphological polycentricity (multiple density peaks) may occur without functional differentiation (Garau et al. 2026). In this paper, polycentricity is interpreted in a hierarchical sense: multiple centres coexist, but they differ in service level and accessibility across nested spatial scales. Fractalopolis models this hierarchical polycentricity by coupling a central-place logic with a multifractal geometry that preserves multi-scale coherence.
Fractalopolis is a multi-scale metropolitan planning framework originally developed within several research projects. It integrates a hierarchical spatial model grounded in fractal geometry (Frankhauser, 2008), an accessibility-based evaluation of resident satisfaction, and a population distribution model linking housing density to amenity provision (Czerkauer-Yamu, 2012; Frankhauser, 2012; Frankhauser et al., 2018; Yamu, 2015). Fractalopolis was first operationalised in 2012, through the doctoral work that formalised the hierarchical coding principle, accessibility rules, and satisfaction evaluation within an implementable planning model alongside a research paper (Czerkauer-Yamu, 2012; Frankhauser, 2012). The framework was subsequently consolidated within quantitative planning-support literature and multi-scale urban modelling in an award-winning contribution to Environment and Planning B (Yamu, 2015), recognised with the Michael Breheny Prize. Subsequent developments incorporated constraint-based masking, surface conservation, and a GIS-based scenario workflow, enabling direct modifications of amenities and housing while preserving the hierarchical zoning logic. More recently the concept was applied to the Greater Paris Region (Frankhauser, 2021; Frankhauser and Bonin, 2024; Frankhauser et al., 2018). In order to apply and adapt the concept to real-world situations, a GIS-based software package was developed by Gilles Vuidel at the THEMA Institute (University Marie et Louis Pasteur, Besançon, France) using GIS data. It allows adapting a chosen fractal model to a given metropolitan area and analysing the potential satisfaction of residents in the different zones. The most recent versions provide the possibility not only to evaluate a given situation, but to conceive and evaluate new planning scenarios at the scale of Master plans. The software, in free access, is currently actualised and can be downloaded (Vuidel et al., 2012). Rather than reiterating its foundational theory, this paper extends the framework to a coastal-insular metropolitan system characterised by strong boundary conditions and within a regulation-aware modelling environment. In doing so, it tests the robustness of hierarchical polycentric modelling under asymmetric spatial conditions and advances Fractalopolis toward a statutory-embedded, scenario-comparison methodology applicable to coastal metropolitan contexts with comparable spatial constraints.
The spatial backbone of Fractalopolis is a hierarchically organised structure of centres articulated along major transport corridors and embedded within a multifractal zoning system. Development areas are generated through iterative subdivision, while the ‘lacunae’ of the fractal correspond to preserved or a very low-density zones which form nested ecological corridors ensuring spatial continuity and access to green systems (Frankhauser, 2008). In this sense, the model combines hierarchical centrality with environmental structuring, embedding accessibility and ecological coherence within the same geometric logic, such as the Copenhagen finger plan (Frey, 2000) or the concept of Transit Oriented Development (TOD) (Calthorpe, 1993).
Unlike approaches limited to one or two spatial scales, the fractal geometry underlying Fractalopolis enables the development of planning scenarios linking housing-block scale to metropolitan scale in a coherent manner. This is due to the inherent hierarchical properties of fractal geometry which allow the introduction of a coherent zoning system referring to central-place theory, following Christallers’ logic (Christaller, 1933/1980). Hence different amenity levels are distinguished which are identified by a coding system. They correspond to their frequency of use. Hence to accede to shops satisfying daily needs a short distance will be required and greater distances are accepted for more rarely frequented amenities. This logic holds for commercial offer and public services as well as for recreational amenities. Synthetic measures allow evaluating the potential satisfaction of residents. Recently the model has been linked to the theory of needs (Max-Neef, 1991) and the evaluation formalism has been simplified (Frankhauser and Bonin, 2024).
Building on these principles, this study addresses a central metropolitan planning challenge: how can a hierarchically structured, multi-scale urban system be formally modelled and critically examined when its spatial geometry is shaped by coastal boundaries and regulatory constraints, in order to compare alternative service- and densification-led scenarios? Rather than assuming isotropic spatial expansion, the analysis considers a metropolitan system whose geometry is structurally conditioned by shoreline limits and environmental regulation. The investigation therefore focuses on two interrelated dimensions: first, the formal modelling of hierarchical polycentric organisation in a coastal-insular context across nested spatial scales, through the integration of population allocation, differentiated amenity levels, and accessibility-based evaluation; second, the operational extension of the framework to empirically grounded scenario construction under statutory and coastal constraints. Through the case of the Metropolitan City of Cagliari (MCC), this study provides the first full-scale implementation of Fractalopolis in a coastal-insular metropolitan system. Relative to earlier applications (e.g. Vienna and the Greater Paris Region), the MCC implementation places stronger emphasis on empirically grounded spatial modifications, integrating real building additions (rather than relying only on abstract density adjustments) together with multi-scenario amenity redistribution and statutory planning instruments within a unified modelling environment. In this setting, the application does not merely extend the model to a new geography, but examines how hierarchical organisation can be comparatively evaluated when metropolitan structure is territorially constrained and subject to explicit regulatory conditions.
The paper is organised as follows: Section 2 describes the Fractalopolis model and its theoretical and mathematical foundations. Section 3 describes its implementation in the MCC and reports the empirical results. Section 4 discusses implications and future scenarios, and Section 5 concludes by outlining the contribution of Fractalopolis as a transferable decision-support framework and directions for future research.
Method and data: The fractalopolis model
Conceptual framework
Fractalopolis is implemented as a metropolitan planning model that combines a hierarchical organisation of centres with an explicit evaluation of population distribution and amenity accessibility across functional levels (Czerkauer-Yamu, 2012; Frankhauser, 2012; Frankhauser et al., 2018; Yamu, 2015; Frankhauser, 2021). This section introduces the conceptual structure of the model and presents the iterative hierarchical coding principle that underpins the multi-scale zoning system (Supplemental Figure 1). This conceptual basis is subsequently translated into a formal population distribution model (Section 2.2), complemented by the amenities and satisfaction formulation (Section 2.3) and the GIS-based implementation workflow used for scenario evaluation (Section 2.4).
Supplemental Figure 1 shows the principle of the model and it illustrates the iterative generation of a multifractal pattern according to multifractal logic: starting from a defined study area, successive iterations subdivide the territory into centres and subcentres, creating a nested metropolitan hierarchy. In the theoretical model there are four subcentres, but for real applications more or less subcentres can be defined. Each element is encoded according to its position within this hierarchy (Czerkauer-Yamu, 2012; Frankhauser, 2012; Frankhauser & Bonin, 2024; Yamu, 2015). For applied metropolitan settings, the number of subcentres and iteration depth are calibrated to settlement structure and planning scale, while the hierarchical coding principle remains unchanged.
As shown in ‘Supplemental Figure 1’, Fractalopolis generates centres that may share similar sizes but differ in function and hierarchical code. This reflects a key empirical regularity: settlements located closer to the main centre tend to exhibit greater size and functional intensity, whereas smaller towns in the hinterland often assume complementary yet significant roles within the metropolitan system. This functional differentiation within a similar geometric structure distinguishes the model from classical central-place theory, which assumes uniform relationships between size and hierarchy. The model’s nested logic ensures accessibility to both daily-use services and green leisure areas across all spatial scales. Each residential area is located near at least one level of amenity, while green corridors interspersed within the urban fabric compensate for any reduced accessibility to the main centre. This spatial configuration enhances overall performance by maximising residents’ access to diverse amenities and ecosystem services (Frankhauser and Bonin 2024).
For real-world applications (Supplemental Figure 2), the position of centres can be adjusted to reflect existing settlement patterns while maintaining the constraints imposed by the multifractal logic. For example, the development zones must not overlap and consistent in size across iterations, and existing protected areas cannot be converted into new development zones. However, it is possible to deform the squares into polygons if they have the same area. It should be emphasised that, according to the logic of the concept, development areas should be positioned by respecting the existing settlement structure and favouring proximity to public transport axes. In the version actually used, accessibility to public transport stops was included for the first time in the assessment of potential resident satisfaction.
This conceptual framework is translated mathematically in the population model, through the Fractalopolis software developed by Gilles Vuidel and is freely available (Vuidel et al., 2012). It works on the basis of GIS data, which have to be processed. It distributes residents across the fractal hierarchy to explore how density, accessibility, and satisfaction interact across scales.
Mathematical Formulation Through the Population Model
The Fractalopolis model also contains a population distribution model (Czerkauer-Yamu, 2012; Frankhauser, 2012; Czerkauer-Yamu et al., 2013) which refers to the iteration steps. Hence for the first step the population is dispatched between the development zones and the preserved zones:

Here α is the part of the population affected to the development zones dev whereas
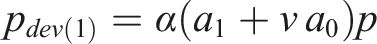
The computer program estimates these parameters from the real world, providing average population values of all the centres belonging to the same level, for example, ‘010’. This enables analysing the existing disparities in population distribution between centres belonging to the same level and supports the adjustment of total number of people or dwellings in the study area in order to assess the impact on population distribution. Scenarios may be adjusted by users to modify the parameter values (e.g. strengthening the subcentres to obtain a more hierarchical polycentric urban system) and to evaluate future development options. The newest Fractalopolis version, first used in the frame of this article, also permits direct modification of basic data by adding new buildings or shops and services while preserving the predefined zoning logic. This functionality enables the simulation of how additional services or housing influence overall satisfaction and accessibility, a feature applied for the first time in the MCC case study. By combining high- and low-density areas within the same hierarchical framework, the model reproduces realistic settlement patterns by considering the population distribution model. After establishing how population distribution follows the fractal hierarchy, the next section explains how the model quantifies satisfaction by linking accessibility to residents’ perceived fulfilment of needs.
Amenities and satisfaction
The classification of services and amenities in Fractalopolis (Czerkauer-Yamu 2012; Czerkauer-Yamu et al., 2013; Frankhauser 2012) can be linked to Max-Neef’s theory of human needs (1991), which identifies universal needs and differentiates satisfiers (Frankhauser and Bonin 2024). Max-Neef identifies three key principles that establish a connection between needs and the requirement to obtain them. Fractalopolis translates this into four hierarchical functional levels and ‘Supplemental Table 1’ summarised these concepts, by considering the assessment of the accessibility of the amenities of development centres. The levels have been established considering many factors like use frequency, proximity demand, and architectural or natural limitations in urban environments. The four hierarchical levels called also functional levels consider the preferences of the residents due to many surveys conducted in France but also valid for other international contexts.
Four levels of amenities are distinguished. Level 4 includes amenities that rank highest in terms of proximity demand. Their use frequency is almost every day. Hence, they should be present in all development zones whatever their rank. The journeys undertaken by users are not always of significant duration, but rather frequent and regular. Level 3 considers all of the amenities belonging to next higher ranked city level, related to proximity issues but specifically concentrates on amenities that operate throughout a wider geographic area. They should be present in the areas that follow in the hierarchical order of the centres. Level 2 comprises amenities that are either of sporadic or frequent use, but their infrastructural scale does not permit for local placement. Lastly, level 1 comprises equipment that is used least often and covers the most extensive geographical region. Despite people may scarcely visit them, their presence might stimulate long-distance travel.
Hence, if the information is available on the geo-location of shops and services in the study area, as well as on leisure areas, the Fractalopolis software allows to calculate the potential satisfaction of the inhabitants with regard to the accessibility of these amenities. This synthetic measure is based on empirical data on the distances that residents are ready to travel to reach the various urban amenities and leisure facilities.
Satisfaction also considers the proportion of the population that has access to each amenity. This data is available not only for France, but also for other European countries. The software calculates this level of satisfaction for each dwelling
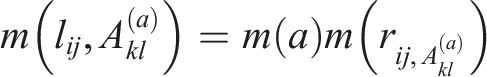
Here


Finally, the mean satisfaction is calculated for both the development zones and the preserved zones which it is possible to refer as ‘suitability’. The calculation of satisfaction indicators provides the empirical foundation for model implementation. The following section outlines how Fractalopolis operationalises these computations through its GIS-based workflow.
Implementation and workflow
The analytical workflow of the Fractalopolis model is implemented through a Java software (Vuidel et al., 2012) that operationalises the conceptual and mathematical framework described above. The system enables users to iteratively test and evaluate the spatial impacts of alternative planning strategies through a modular sequence of analytical steps. (a) Project Setup and Data Input: the first step involves the creation of a new project environment and the import of the fundamental datasets. The simulator requires a comprehensive building file covering the entire study area, where each building is characterised by its height attribute. A complementary dataset provides the population or household distribution, typically aggregated at the level of statistical zones. A standard algorithm proportionally redistributes the population among buildings according to their height, yielding a realistic three-dimensional population density model. (b) Integration of Amenities and Mobility Data: subsequently, datasets on geo-referenced amenities, (including shops, services, public transport stops, and leisure entry points) are loaded into the system. For each amenity type (c) Fractal Zoning and Simulation: zoning is then performing according to the fractal iteration logic. Usually for medium-sized agglomerations three or four iteration steps are sufficient to reach the level of housing blocks or town sections. The initially square-shaped development areas can be transformed into polygonal forms, allowing each zone to be more accurately adapted to the real territorial configuration. The software nevertheless conserves the surface area of each zone, which is essential from the standpoint of fractal geometry. For each zone the satisfaction level is calculated and represented by a colour code on a map. It is possible to simulate scenarios where the population concentration is modified, for example, by reinforcing peripheric secondary centres. Moreover, the total population of the study area can be modified what allows exploring scenarios for future development. Methodologically, the model is based on a grid representation of the metropolitan territory, in which each cell is assigned quantitative values for population density, accessibility, and the presence of amenities. From these variables, two key indicators are derived. The first measures the potential (d) Scenario Management and Evaluation: the most recent version of the Fractalopolis software enables users to store defined zoning configurations and modify the input databases. Consequently, additional buildings can be added in the development zones as well as new shops and services, by considering also the needs and the legislative rules of the urban planning tools. Each scenario can then be re-evaluated through recalculated suitability and satisfaction indices. This constitutes a methodological shift from ex-post spatial evaluation toward regulation-aware scenario construction, where geometric hierarchy, demographic allocation, amenity distribution, and statutory constraints are operationalised within a single modelling environment. The software thus operates as a strategic decision-support tool for prospective metropolitan planning, allowing planners to test the implications of design hypotheses and policy options before their implementation. In institutional practice, this decision-support logic can be articulated as a sequential workflow: (i) diagnosing spatial imbalances and under-served nodes across functional levels; (ii) defining and simulating alternative scenario levers (e.g. service redistribution, controlled densification, or constraint reinforcement); (iii) comparing outputs through measurable indicators of accessibility, suitability, and satisfaction to make trade-offs explicit; and (iv) aligning the selected scenario with statutory and strategic planning instruments to support coordinated implementation. Accordingly, the model supports prospective scenario comparison rather than endogenous forecasting: the outputs represent the system response to explicit design/policy inputs, not an autonomous prediction of future urbanisation trajectories. In this sense, Fractalopolis operates as a structured evaluation engine, not as an endogenous simulation of spontaneous metropolitan growth.
Application Context: the Fractopolis concept is applied in the Metropolitan City of Cagliari (hereafter referred to as MCC), located on the southern coast of Sardinia (Italy). The analysis is based on the previous configuration of 17 municipalities, as the new administrative structure comprising 71 municipalities was established only in June 2025, after the completion of the current assessments. In contrast to inland metropolitan systems, the coastal-insular morphology of the MCC introduces non-isotropic boundary truncations that distort radial catchments and constrain hierarchical expansion. This condition transforms the application from a contextual extension into a structural test of the model’s geometric assumptions. These peculiarities, as well as their implications for metropolitan resilience, are discussed in the following section, by considering how different development scenarios influence subcentre performance in terms of suitability and satisfaction.
Case study and results
Structure of the Metropolitan City of Cagliari (MCC) in Sardinia (Italy)
The analysis refers to the pre-2025 configuration of 17 municipalities, which formed the official delimitation at the time of data collection. The MCC comprises Cagliari, the regional capital, and 16 smaller municipalities (Supplemental Figure 3), extending across the southern coastal plain and into the Campidano valley. The MCC combines dense coastal settlements with sparsely inhabited hinterlands: the 17 municipalities host 420,364 residents (about one quarter of Sardinia’s total population) within 1248 km2 (ISTAT, 2022). Population concentrates along the central coastal axis. The MCC presents a polycentric urban structure in which compact centres coexist with dispersed settlements embedded in the rural landscape. Spatial patterns are shaped by radial transport axes and environmental constraints, including geological, hydrological and ecological factors. These interactions generate a complex mosaic of land uses where settlement morphology, mobility flows and natural features co-evolve.
Following the workflow defined in Section 2.4, the model setup required the construction of a GIS-based project containing the cartographic representation of the MCC represented through a series of shapefiles integrating diverse spatial and statistical information layers. The input datasets included: buildings (represented as polygons and attributed with height values); population and household distribution (aggregated by census section); geo-localised amenities (including shops, services, and leisure access points [as point data]); public transport infrastructure (including stops and major routes [as line data]); and non-buildable areas (such as water bodies, parks, and protected zones [as polygons]).
Due to the limited granularity of Italian census data compared to French datasets, population was interpolated using 2021 ISTAT Census variables, enabling an estimate of housing units for each cell of the multifractal grid. The database combined multiple sources: the last published ISTAT Census data, the Urban Atlas, the Sardinia Regional Territorial Information System, and open-source platforms (Google Maps, OSM, Geofabrik). The integration of these layers produced a harmonised geodatabase used to populate the Fractalopolis simulation environment.
In the second stage, the model integrated geo-referenced amenities and mobility datasets to define accessibility conditions. Amenities were categorised into four functional levels (F1–F4), corresponding to the frequency (1-4) of use and the spatial scale of service provision, as derived from the hierarchy introduced in Section 2.3. Urban amenities and green amenities are listed in ‘Supplemental Tables 2’ and ‘Supplemental Tables 3’, with associated critical distances and usage frequencies calibrated for the MCC. Non-buildable areas, defined by the Regional Landscape Plan (RLP) and the Corine Land Cover dataset, were excluded from the simulation domain to preserve ecological continuity and avoid artificial overestimation of accessibility.
The integration of these datasets provided the necessary parameters for computing suitability (coherence between population and service distribution) and satisfaction (residents’ accessibility to amenities), preparing the model for the simulation stage.
Evaluation of subcentres (current scenario)
The simulation followed the fractal iteration logic implemented through the Fractalopolis software, as described previously. ‘Supplemental Figure 4’ illustrates the subsequent phases, namely the delineation of the research area, which is framed as a square corresponding to the defined initiator region of interest. ‘Supplemental Figure 4.a’ shows the entire MCC (this phase is called by Fractalopolis tool as step 0). Then, the MCC was subdivided into hierarchical zones reflecting the central-place structure of Cagliari: the main centre (Cagliari city) and four peripheral subcentres (numbers 1, 2, 3, and 4 in ‘Supplemental Figure 4.b’), corresponding to existing urban poles within the MCC (step 1). This first step is crucial, because the generator of centres and sub centres determines the manner in which the original square is replicated into several scaled-down versions, organised in a certain configuration relative to each other. This is because the zoning structure is generated through a finite sequence of iterations calibrated to the metropolitan scale and data resolution, ensuring consistent multi-level hierarchy for scenario testing. The primary shape of a square is altered in this instance due to the coastal setting of an island, where the sea creates a natural barrier, and an area absent of human settlement.
Each of these subcenters is surrounded by their lower ranked sub-subcentres. Each iteration (Figure 4.c and 4.d) subdivided these elements into progressively smaller units, generating a nested, multi-scale pattern consistent with the fractal geometry of urban systems.
Evaluation of subcentres (current and future scenarios)
Within this structure, each grid cell was assigned quantitative values for population density, accessibility, and amenities. As pointed out the software computed two key indicators: (1) Suitability, expressing the degree of spatial coherence between population and services; (2) Satisfaction, quantifying accessibility to different classes of amenities based on distance-decay functions and functional attractiveness.
The baseline simulation (Scenario a) revealed a hierarchical equilibrium: subcentres (1–3) displayed medium-to-high suitability (0.36–0.49), while subcentre 4 exhibited low suitability (0.0471), indicating structural under-servicing rather than geometric imbalance (Supplemental Figures 5 and 6). This value corresponds to the baseline configuration (Scenario a), against which the subsequent simulated interventions are comparatively assessed. These spatial patterns were mapped as continuous performance surfaces, showing areas of high and low accessibility across the metropolitan grid.
Spatial visualisation of suitability values (Supplemental Figure 6) reveals a distinct pattern: central areas and major corridors maintain high satisfaction levels, while peripheral sectors, especially those bordering fragmented green zones, show lower performance. These peripheral weaknesses correspond to discontinuities in service accessibility and limited public transport coverage. Overall, the resulting spatial gradients confirm the multifractal nature of metropolitan systems, where accessibility and density organise through nested hierarchies rather than uniform distributions.
Under the current configuration, the central-place hierarchy confirms the dominance of Cagliari as the main hub and a clear metropolitan gradient across the 17 municipalities (Supplemental Table 4), with coastal poles denser and peripheral belts more discontinuous.
The hierarchical layers visualised in ‘Supplemental Figure 7’ reflect a coherent multi-scale structure, characterised by increased travel distances and diminished service accessibility, particularly situated within the coastal–periurban system encompassing the municipalities of Pula, Villa San Pietro, and Sarroch to the southwest, and those of Quartu Sant’Elena, Maracalagonis, and Sinnai to the east and northeast of the MCC.
Supplemental Figure 8 shows a population pattern radiating from the core, consistent with the fractal logic of nested centres and corridors. Within the central city zone highlighted in red and constituted mainly by the municipality of Cagliari, the peripheral zones in the North are less populated contrarily to both the zones close to the seaside. By showcasing how population centres tend to radiate from the main centre represented by Cagliari, Figure 6 reinforces the theoretical framework of fractal urbanism, which posits that dense, centralised areas can lead to more sustainable urban living conditions.
Using the population model embedded in Fractalopolis, the empirical population numbers for each functional level were estimated through the concentration parameters a 1 = 0.811, b 1 = 0.908, and c 1 = 0.653. These values describe a well-hierarchised urban system, where population declines regularly from core to periphery (Supplemental Table 5).
Quantitatively (Supplemental Table 6), at the first hierarchical level (011), subcentre (1) records a deficit of +5429 (mean–empirical) with suitability 0.3614; Subcentre (2) a surplus of −730 with 0.4322; Subcentre (3) a surplus of −13,714 with 0.4922; and Subcentre (4) a deficit of +9015 with 0.1461. These results confirm structural stability in Subcentres (1–3) and the under-servicing of Subcentre (4), motivating targeted, service-led interventions in peripheral nodes before densification.
The results suggest that the population of subcentre (1) should nearly double to align with the mean expected for its functional level, while subcentre (3) appears overpopulated. Subcentre (4), conversely, remains underpopulated and under-serviced even after the addition of amenities. This pattern supports the need for territorial rebalancing through targeted investments in peripheral nodes.
A complementary simulation tested the robustness of accessibility and satisfaction under population increase. A hypothetical scenario with 450,000 inhabitants was modelled, maintaining the same spatial logic and distribution rules. Results showed no significant variation in satisfaction indices, indicating that the system scales proportionally and that accessibility parameters remain stable. Population growth therefore acts as a rescaling effect, rather than producing structural changes in spatial performance. This phase also exposed the main operational challenge of the study: data acquisition and harmonisation.
The heterogeneity of sources (from ISTAT census statistics to regional spatial datasets) required a manual reconstruction of demographic and amenity layers for each municipality. In several cases, amenities had to be geolocated and classified individually, making data collection the most time-consuming and complex step in implementing the Fractalopolis model.
Following the model workflow, four development scenarios were simulated to test the system’s response to changes in amenity provision and population density: (a) current configuration; (b) +60 amenities; (c) +80 amenities; and (d) +80 amenities combined with new residential buildings.
For each scenario, suitability and satisfaction indices were recalculated. The comparison (Supplemental Table 7 and Supplemental Figure 9) highlights that while subcentres (1–3)remain relatively stable, subcentre 4 shows a marked improvement: suitability increases from 0.0471 in the baseline configuration to 0.1461 under Scenario (c) and remains stable under Scenario (d), indicating that amenity reinforcement (rather than additional residential buildings) drives the primary performance gain in Subcentre 4. Satisfaction for daily amenities (F4) from 0.044 to 0.287. These gains demonstrate the sensitivity of peripheral nodes to small, strategically distributed interventions.
Scenario (d), which combines amenity increase and controlled densification, yields the most balanced outcome, confirming that moderate compaction, when aligned with the fractal logic of accessibility, enhances both spatial efficiency and residents’ satisfaction.
The model integrated the Regional Landscape Plan (RLP), defining ecological protection zones and landscape restrictions; the Municipal Urban Plans (MUP), Hydrogeological Asset Plan (HAP), Coastal Use Plan (CUP), and Municipal Beach Plan (MBP) of Quartu Sant’Elena and adjacent municipalities, governing local land use and coastal management; and the Strategic Metropolitan Plan of the MCC, which establishes long-term objectives for infrastructure, mobility, and spatial cohesion.
This alignment between Fractalopolis and the planning tools ensured that all simulated interventions were excluded from environmentally sensitive or high-risk areas, maintaining coherence with both ecological preservation and planning regulations. Embedding these institutional frameworks into the model transforms Fractalopolis from a theoretical construct into a fully operational decision-support system that is compatible with the governance and regulatory architecture of the MCC.
Overall, this implementation confirms that the Fractalopolis model functions as a decision-support geometry for complex urban systems. It reveals which subcentres are structurally stable and which require strategic intervention.
Discussion
The simulation results show that the MCC exhibits a measurable hierarchical structure in which suitability and satisfaction respond systematically to service redistribution and controlled densification across functional levels. Relative to earlier applications of Fractalopolis in inland metropolitan contexts (e.g. Vienna and Greater Paris), the MCC case provides a stringent ‘stress test’ of the framework in a coastal-insular setting where spatial degrees of freedom are structurally reduced and legally enforced coastal protection frameworks significantly constrain the expansion of buildable land along shoreline zones. Unlike inland regions, the MCC is bounded by the sea: an anthropic void that truncates the metropolitan field, disrupts radial service catchments, and forces accessibility gradients to develop asymmetrically. This coastal boundary condition, combined with fragmented buildable land and protected ecological systems, amplifies the consequences of small planning moves: low-intensity service reinforcement or limited housing additions can generate disproportionate gains (or losses) in peripheral suitability because alternative routing and relocation options are constrained. The MCC application therefore extends the cumulative evidence base in three complementary ways. First, it shows that hierarchical polycentric organisation can be operationalised and evaluated under strong edge effects and discontinuous developable surfaces, where ‘centrality’ is not geometrically isotropic but conditioned by coastline geometry and corridor continuity. Second, it demonstrates that the model remains informative when scenario feasibility is dominated by regulatory and or ecological masking (e.g. non-buildable coastal systems and protected corridors), clarifying how much performance improvement is achievable without violating environmental integrity. Third, the MCC results highlight the governance relevance of explicitly coupling service redistribution with controlled densification: in tightly constrained coastal-insular territories, densification without concurrent service upgrading can inflate apparent accessibility while increasing pressure on scarce open-space systems, whereas balanced interventions improve suitability while preserving continuity. In this setting, Fractalopolis’ main contribution is not to mimic endogenous growth, but to provide an analytically consistent basis for comparing constrained ‘what-if’ configurations and for revealing which leverage points (service levels, subcentre reinforcement, limited residential additions) are most effective under coastal boundary conditions.
Across the four simulated scenarios (Table 7), the model identifies strong hierarchical stability in subcentres 1–3 and a pronounced imbalance in subcentre 4 (Quartu Sant’Elena). Indeed, the coastal belt (from Capitana and Salmagi to Terra Mala, Sinnai [Solanas], Maracalagonis [Torre delle Stelle], and Villasimius [Capo Boi]) emerges as the most critical sector, where urban sprawl, infrastructural fragility, and fragmented service provision intersect with high environmental sensitivity.
Introducing 60–80 new amenities increased suitability from 0.0471 to 0.1461, while satisfaction (F4) nearly tripled, confirming that service-led interventions produce non-linear improvements in peripheral accessibility. This elasticity validates one of Fractalopolis’s main assumptions: metropolitan performance can improve significantly without large-scale transformations, provided that interventions are spatially coherent with the underlying fractal logic.
However, the process also exposed several structural and methodological challenges. First, the data preparation phase proved to be the most critical: many datasets required manual harmonisation and individual verification for each municipality. This constraint underscores how the application of advanced spatial models remains heavily dependent on the availability, granularity, and consistency of urban data.
Second, the model’s internal coherence may conceal persistent territorial inequalities. While subcentres 1–3 demonstrate resilience, the peripheral systems of Quartu, Maracalagonis, and Sinnai remain dependent on external inputs to achieve functional equilibrium. Fractalopolis does not resolve these disparities automatically but makes them spatially explicit, identifying where interventions are most needed and which types (service enhancement, transit reinforcement, or ecological restoration) have the highest leverage. By quantifying suitability and satisfaction at multiple scales, the model functions as a diagnostic and decision-support system that helps prioritise investments in underperforming nodes while preventing over-saturation in central ones. In practical terms, Fractalopolis can support planning institutions through a sequential workflow: diagnosing hierarchical deficits, simulating targeted interventions, comparing scenario outcomes, and aligning proposed configurations with statutory planning instruments. It thus functions as a scenario-comparison tool embedded within existing regulatory frameworks rather than as an autonomous planning doctrine. By operationalising amenity redistribution and controlled densification within the same regulation-aware environment, the model produces outputs that are directly usable by planners (maps of suitability, ranked centre-deficit lists, and scenario summaries) that can feed into masterplan revisions, impact assessments, and public consultation processes.
Overall, the study confirms that fractal coherence provides a diagnostic framework for sustainable planning. The results demonstrate that Fractalopolis can function as a governing geometry by translating hierarchical structure into actionable planning intelligence. It enables planners to test alternative strategies within existing regulatory frameworks and to anticipate how changes in amenity provision or density will affect accessibility and environmental balance. The model thus bridges the analytical precision of urban analytics with the normative depth of strategic planning, transforming emergent spatial logic from a descriptive principle into a tool for governance.
Conclusions
This study applied the Fractalopolis model to the MCC, demonstrating how fractal geometry, central-place theory, and strategic spatial planning can be combined into a prospective, scenario-based multi-scale tool for guiding metropolitan futures. By integrating demographic, morphological, and ecological data, the model formalises metropolitan hierarchy into measurable indicators that support systematic comparison of alternative governance choices under explicit constraints.
Across the four simulations, clear differences emerge. The current configuration (scenario a) confirms Cagliari’s dominance within the metropolitan hierarchy, revealing the dependency of peripheral nodes (particularly Quartu Sant’Elena, Maracalagonis, and Sinnai) on the main centre. This configuration, while hierarchically stable, remains spatially unbalanced. Scenario (b), which introduces 60 new amenities, already produces measurable improvements in suitability and satisfaction; particularly in Quartu Sant’Elena, where peripheral accessibility reacts elastically to the new facilities. Suitability increases from 0.0471 to 0.1125, demonstrating that targeted interventions in daily-use amenities can produce significant benefits even without substantial morphological change. The effect becomes more evident in scenario (c), where 80 new amenities are distributed across the subcentres. The higher service density further enhances overall performance, raising suitability to 0.1461 and nearly tripling satisfaction indices for level 4 amenities. Beyond this point, however, returns begin to stabilise, suggesting that service concentration must remain consistent with demand and mobility capacity to avoid functional redundancy and inefficiency. Finally, scenario (d), which combines the addition of 80 amenities with new residential buildings, achieves the most balanced configuration. While preserving ecological corridors, this scenario offers the most balanced configuration, showing that controlled densification can be environmentally neutral when supported by adequate amenity distribution and green connectivity.
Overall, these results indicate that service-driven rebalancing of peripheral nodes is more effective than unregulated expansion. Fractalopolis identifies where such interventions have the greatest leverage and quantifies how small-scale actions reduce large-scale inequalities. At the same time, the findings reveal structural limits: improvements are strongest where the existing morphological network supports efficient connectivity, while isolated or fragmented areas benefit less. Long-term resilience therefore depends not only on redistributing amenities but also on reinforcing the transport and ecological networks that integrate subcentres with the metropolitan core. Moreover, the reliability of scenario outputs depends on the quality and harmonisation of spatial data, a process that, in this study, required extensive manual compilation and verification across 17 municipalities, one of the most challenging phase of the entire workflow. Although applied to a single metropolitan case, Fractalopolis separates transferable structural components (hierarchical subdivision rules, surface conservation, constraint-based masking) from context-calibrated inputs (amenity classification, distance thresholds, demographic weights). This supports transferability across comparable coastal metropolitan spatial contexts. The demographic stress test conducted at 450,000 inhabitants confirmed the stability of satisfaction indices and concentration parameters (a1, b1, c1), indicating proportional scaling behaviour. Robustness therefore concerns the persistence of comparative centre rankings and deficit identification under plausible parameter variation, rather than deterministic forecasting. Against this background, the following scenario-based results can be interpreted as consistent, transferable evidence of how alternative governance choices systematically reshape multi-scale accessibility and service balance.
Stable scaling parameters (a1 = 0.811; b1 = 0.908; c1 = 0.653) and the systematic improvement patterns across scenarios show that the MCC system follows a quantifiable hierarchical logic, which can guide adaptive interventions. When geometric coherence is preserved (through surface conservation, realistic polygonal adaptation, and continuity of ecological corridors) systemic improvement occurs without compromising environmental quality. The persistence of hierarchical scaling under coastal boundary truncation demonstrates that fractal-based metropolitan modelling is not dependent on isotropic spatial assumptions but can accommodate structurally asymmetric territories without losing diagnostic consistency.
Importantly, the results reaffirm that the governing geometry of metropolitan systems lies not in density alone but in the co-evolution of form, function, and ecological structure. Densification without adequate service provision inflates apparent accessibility, while fragmentation of green areas reduces climate resilience. Fractalopolis helps reveal and operationalise this equilibrium, allowing planners to translate complex spatial dynamics into actionable metropolitan governance.
Furthermore, although the current implementation incorporates regulatory and ecological constraints (MUP, RLP, CUP), future development of the model should integrate behavioural and temporal dynamics. Including variables such as commuting patterns, seasonal tourism, and demographic volatility would transform Fractalopolis from a static representation of spatial balance into an adaptive model of metropolitan metabolism. Linking accessibility metrics to real-time mobility or temporal activity data would significantly strengthen its anticipatory scenario-based capacity, enabling anticipation rather than mere description of spatial transformations.
This approach is replicable and particularly relevant for other coastal and insular metropolitan regions facing environmental fragility, demographic pressure, and uneven service distribution. Future research will extend the model to the enlarged MCC (71 municipalities as of June 2025), test its scalability in other Mediterranean contexts and integrate new categories of coastal amenities (such as beaches, coastal trails, marine recreational infrastructures, and waterfront public spaces) into the Fractalopolis database to better assess satisfaction and sustainability in coastal landscapes.
Ultimately, the study suggests that the metropolitan development cannot rely solely on density targets but requires coordination between form, services, and ecological continuity. Fractalopolis supports planning institutions by identifying hierarchical deficits, comparing alternative configurations, and aligning interventions with statutory instruments.
Supplemental material
Supplemental material - Fractalopolis: A multi-scale scenario-modelling approach for evaluating master plans and rebalancing metropolitan hierarchy
Supplemental material for Fractalopolis: A multi-scale scenario-modelling approach for evaluating master plans and rebalancing metropolitan hierarchy by Chiara Garau, Pierre Frankhauser in Environment and Planning B: Urban Analytics
Footnotes
Authors contributions
This paper is the result of the joint work of the authors. ‘Abstract’ and ‘Case study and Results’ (with its subparagraphs) were written jointly by the authors. CG wrote ‘Implementation and workflow’, ‘Discussion’ and ‘Conclusions’. PF wrote ‘Introduction’, ‘Conceptual Framework‘, ‘Mathematical Formulation Through the Population Model’ and ‘Amenities and Satisfaction’.
Funding
The authors disclosed receipt of the following financial support for the research, authorship, and/or publication of this article: This study was partially supported by the project ‘The implementation of a multifractal development plan for urban adaptation for the ecological transition. Comparisons between the Metropolitan Cities of Cagliari, Italy and Besançon, France’, founded by the programme ‘Bando 2023 MGR’, financed by the Autonomous Region of Sardinia (under the Regional Law of 7 August 2007, n. 7 ‘Promotion of Scientific Research and Technological Innovation in Sardinia’). This study was partially supported by the MUR through the project SMART3R-FLITS: SMART Transport for Travelers and Freight Logistics Integration Towards Sustainability (Project protocol: 2022J38SR9; CUP Code: F53D23005630006), financed by the PRIN 2022 (Research Projects of National Relevance) program.
Declaration of conflicting interests
The authors declared no potential conflicts of interest with respect to the research, authorship, and/or publication of this article.
Data Availability Statement
Data sharing not applicable to this article as no datasets were generated or analysed during the current study.
Supplemental material
Supplemental material for this article is available online.
Author biographies
References
Supplementary Material
Please find the following supplemental material available below.
For Open Access articles published under a Creative Commons License, all supplemental material carries the same license as the article it is associated with.
For non-Open Access articles published, all supplemental material carries a non-exclusive license, and permission requests for re-use of supplemental material or any part of supplemental material shall be sent directly to the copyright owner as specified in the copyright notice associated with the article.