
Abstract
Urban housing markets exhibit pronounced spatial heterogeneity shaped by multiple spatial factors, resulting in scaling characteristics and hierarchical structures typical of complex systems. These properties provide an alternative perspective for delineating housing market areas and interpreting inter-market linkages. This study introduces the concept of natural submarkets, defined as spatially contiguous housing clusters exhibiting both hierarchical scaling in price patterns and consistent hedonic price determinants. We implement this concept through a bottom-up segmentation framework that combines an improved head/tail breaks with hedonic model fit, enabling data-driven delineation of market boundaries and comparative regional analysis. Applied to 26 cities in the Yangtze River Delta (YRD), China, the proposed method yields a more objective and interpretable representation of price differentiation and scaling properties than conventional classifications. The results indicate that economically advanced cities may exhibit either multi-level submarket structures with well-defined hedonic relationships or more complex hierarchical structures with weakly defined pricing mechanisms. Further submarkets clustering by shared pricing mechanism reveals two dominant spatial patterns, comprising interconnected development corridors and isolated market structures. These morphologies are generally driven by network centrality and accessibility to amenities. As a result, the YRD housing price distribution is characterized by a polycentric structure and ongoing cross-boundary integration. The proposed framework complements traditional regional analyses by revealing structural patterns of mechanical similarity and supporting differentiated policy interventions aligned with housing market dynamics.
Introduction
Urban housing markets reflect not only a city’s stage of development but also the spatial integration and segregation shaped by complex socio-economic processes (Muth, 1961; Wei and Ewing, 2018). Such processes give rise to pronounced spatial heterogeneity and structural complexity. In the context of regional integration, cities exhibit substantial variation in housing prices and supply-demand structures, contributing to the diversification of regional housing systems (Ashworth and Parker, 1997). Accurately identifying this spatial structure is essential for the formulation of targeted housing policies at the regional scale, yet it remains a methodological challenge.
Housing prices, reflecting market conditions and spatial determinants, often display highly uneven distributions characterized by scaling laws where central prices vastly exceed peripheral ones (Laziou et al., 2025; Sayın et al., 2022). These properties reveal spatial regularities essential for exploring hierarchical housing market organization. Building on these insights, we introduce the concept of Natural (housing) Submarkets (NSs), defined as spatial clusters featuring both hierarchical price patterns and consistent price determinants. This is operationalized via a bottom-up framework integrating an improved head/tail breaks algorithm with hedonic modelling. Applied to 26 cities in the Yangtze River Delta, we analyse the structural characteristics of natural submarkets and investigate intercity linkages and spatial differentiation at the regional level. These findings deepen our understanding of housing market configuration and supports the development of place-sensitive housing policies aligned with regional development objectives.
Research background
Housing submarkets definition
Urban housing markets are complex and heterogeneous, defying explanation by a single equilibrium model (Whitehead, 1999). Submarket theory addresses this by partitioning markets into homogeneous units (Goodman, 1981; Goodman and Thibodeau, 1998). According to hedonic price theory, housing values reflect the combined influence of multiple attributes (Rosen, 1974). Differences in the relative importance of these attributes lead to variations in perceived utility, offering a theoretical basis for market segmentation (Watkins, 2001). Identifying groups of dwellings with similar utility profiles enhances the predictive performance of hedonic models and helps uncover underlying pricing structures, informing targeted policy and development decisions (Jones et al., 2005).
Despite the broad acceptance of the submarket concept, a clear consensus on delineation methods remains elusive. Approaches range from administrative and census boundaries (Goodman and Thibodeau, 2003), expert-defined zones (Keskin and Watkins, 2017), physical attributes such as room count (Schnare and Struyk, 1976) or dwelling size (Goodman and Thibodeau, 2007), and various data-driven techniques (Bourassa et al., 1999). In response, some scholars emphasize shared criteria – such as substitutability, similarity, and spatial contiguity – to guide empirical applications (Wu and Sharma, 2012).
House price distribution, spatial heterogeneity, and fractals
Although many studies have examined the spatial segmentation of housing markets, the hierarchical structure of prices and its connection to submarket formation remains underexplored. Driven by multiple spatial forces, housing prices exhibit pronounced heterogeneity and scaling patterns typical of fractal systems (Lengyel et al., 2022). Housing price distributions often follow a nested hierarchy, with high-end housing concentrated in urban cores and lower-priced units dispersed toward the periphery. Such spatial gradients offer a conceptual entry point for analysing housing markets through the lens of fractal theory (D’Acci, 2023).
Traditionally, fractals capture the complexity of irregular urban forms through geometric dimensions (Batty et al., 1989; Mandelbrot, 1982), informing studies on urban morphology and growth (Batty and Longley, 1987; Jiang and Miao, 2015; Long et al., 2018; Shen, 2002). However, socio-economic systems like housing markets manifest their complexity predominantly through statistical distributions rather than pure physical geometry. Recognizing this distinction is crucial. In these contexts, fractals function as statistical constructs rather than physical geometry. This shift enables the analysis of urban complexity through macro-level scaling laws, most notably Zipf’s law, which describes the robust inverse relationship between a city’s rank and its size (Zipf, 1949). Consequently, the hierarchical organization of urban systems has long been recognized through such scaling phenomena.
While these scaling properties and power-law distributions extend to intra-urban socio-economic phenomena, effectively capturing the underlying hierarchy of these complex systems requires specific methodological approaches. One example is the head/tail breaks (Jiang, 2013), which recursively partitions a dataset into ‘head’ and ‘tail’ segments to capture the recurring pattern of ‘far more small values than large ones’. This process provides an objective, bottom-up approach to reveal the dataset’s inherent hierarchical structure, which can be quantified by the ht-index (Jiang and Yin, 2014). Since its introduction, head/tail breaks and ht-index have evolved beyond urban morphology to cartography (Jiang and De Rijke, 2021), identification of urban centres (Ren et al., 2024a), and quantification of living structure (De Rijke et al., 2020; Ren et al., 2025; Ren et al., 2024b). These applications demonstrate a capacity to reveal hierarchical organization, providing a data-driven means to detect self-similar structures that, in the context of housing markets, can correspond to recursive price tiers and natural submarkets.
Spatial structure informed by house price patterns
As urbanization accelerates, intercity boundaries have grown increasingly porous, with stronger functional linkages (Krugman, 1991). Unlike spatial connections that are easily observed, functional relationships require fine-grained data (Batty and Cheshire, 2011), such as commuting flows and migration patterns (Farmer and Fotheringham, 2011; Shen and Batty, 2019), interregional cooperation (Scherngell and Barber, 2009), or mobile phone interactions (Ratti et al., 2010), all of which collectively enable a flow-based understanding of regional interaction. Yet few studies address regional structural change from the perspective of housing price patterns. As outcomes of population mobility and resource allocation, price patterns respond with temporal lag, offering a more stable lens on long-term regional configurations (Cook, 2005; Jones et al., 2003).
Housing-based regional analysis, however, remains limited, due to difficulties in defining functional linkages and suitable analytical areas. While recent work highlights spatial heterogeneity in price distributions (Lengyel et al., 2022), most research emphasises spatial patterns rather than underlying price formation or implications for urban structure. Others examine determinants of housing prices (Diao and Ferreira, 2010). Law et al. demonstrated that spatial accessibility is valued differently across city types, suggesting that cities can be classified according to how specific housing attributes are capitalized (Law et al., 2017). Yet such approaches are confined to city scale, lacking finer resolution to capture regional continuity. Therefore, although these studies identify commonalities in the variables influencing house price variation for particular groups of cities, they fall short of explaining how these mechanisms drive urban development and contribute to the formation of regional systems structured around housing markets. This explanatory gap stems both from the heterogeneity of pricing determinants and from the challenges involved in defining urban morphology (Burger and Meijers, 2012). To address this, we propose an inherent spatial unit as an alternative to pre-defined ones. By linking areas according to similarities in housing price formation, we aim to enable multi-scalar analyses of urban and regional structures.
Methodology
This study proposes a data-driven, automatic housing market identification framework that integrates fractal characteristics with internal consistency in price formation dynamics reflected in hedonic house price models. As shown in Figure 1, the approach consists of three main stages. First, we apply an improved version of the head/tail breaks (HT) method, referred to as natural head/tail breaks (NHT), to segment the housing price distributions. Second, the hedonic pricing model is used to quantify the consistency of price determinants across areas captured by NHT, selectively merging adjacent areas that result in higher model fit (Adjusted R2). This results in a refined delineation of natural submarkets (NS). Using the detected natural submarkets as samples, we finally construct price-determinant vectors and perform hierarchical clustering to identify cross-city structural groupings with shared housing pattern determinisms at the regional scale. Research workflow.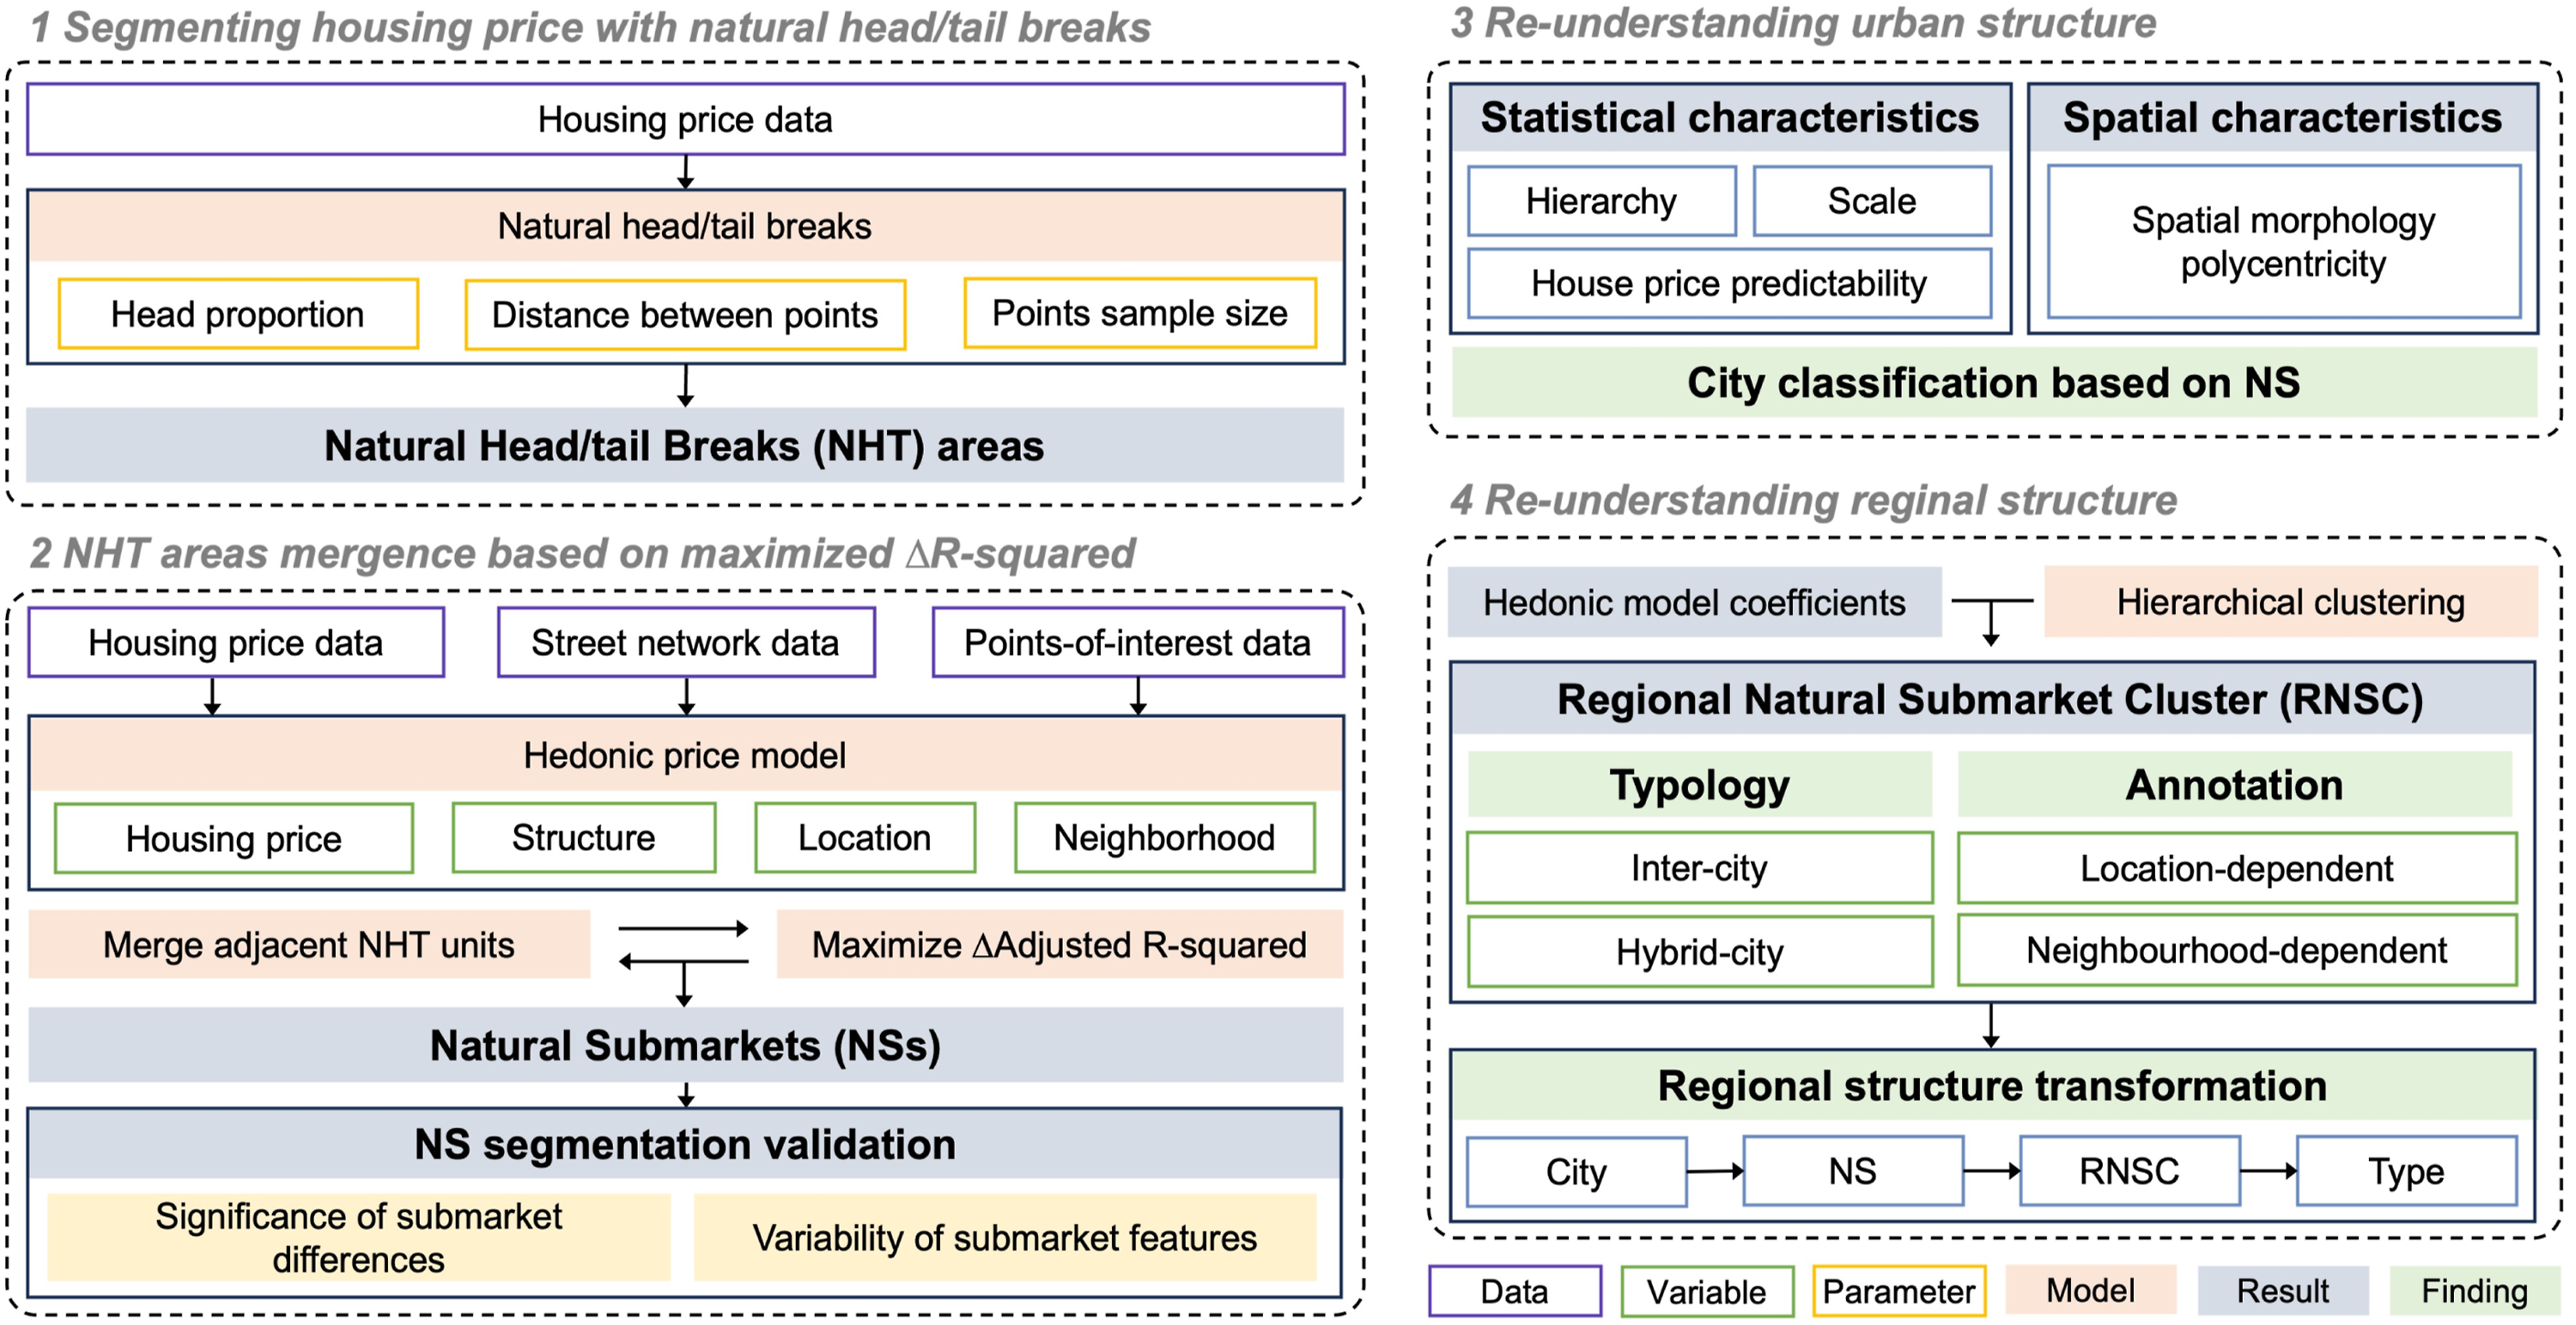
Definition and segmentation of natural submarkets
Natural HT breaks: Conditional HT-break method with spatial network
The HT method is a recursive classification approach designed for heavy-tailed data, where observations above the mean form the head and the remainder the tail, with the process repeated until a stopping condition is met (Jiang, 2015). In this study, HT is adopted as a baseline to capture the hierarchical structure in housing price distributions. As demonstrated in our preliminary experiment (Figure S1), HT effectively aligns with the heavy-tailed nature of housing prices, revealing a clear scaling relationship between subdivision depth and sample size. Given that housing prices are influenced by multiple interacting socioeconomic factors, these scaling properties may offer valuable insights into the underlying mechanisms of price differentiation (Tan et al., 2021).
However, the standard HT method does not account for spatial continuity or minimum market scale, which are essential for housing submarket delineation. To address this, we extend the HT by incorporating spatial contiguity and scale constraints, termed natural head/tail breaks (NHT). As shown in Figure 2(left), the method involves three key parameters: p, which controls the maximum proportion of the head; r, which constrains spatial connectivity by limiting edge length; and s, which ensures a minimum sample size for statistical validity. Schematic illustration of natural submarkets segmentation.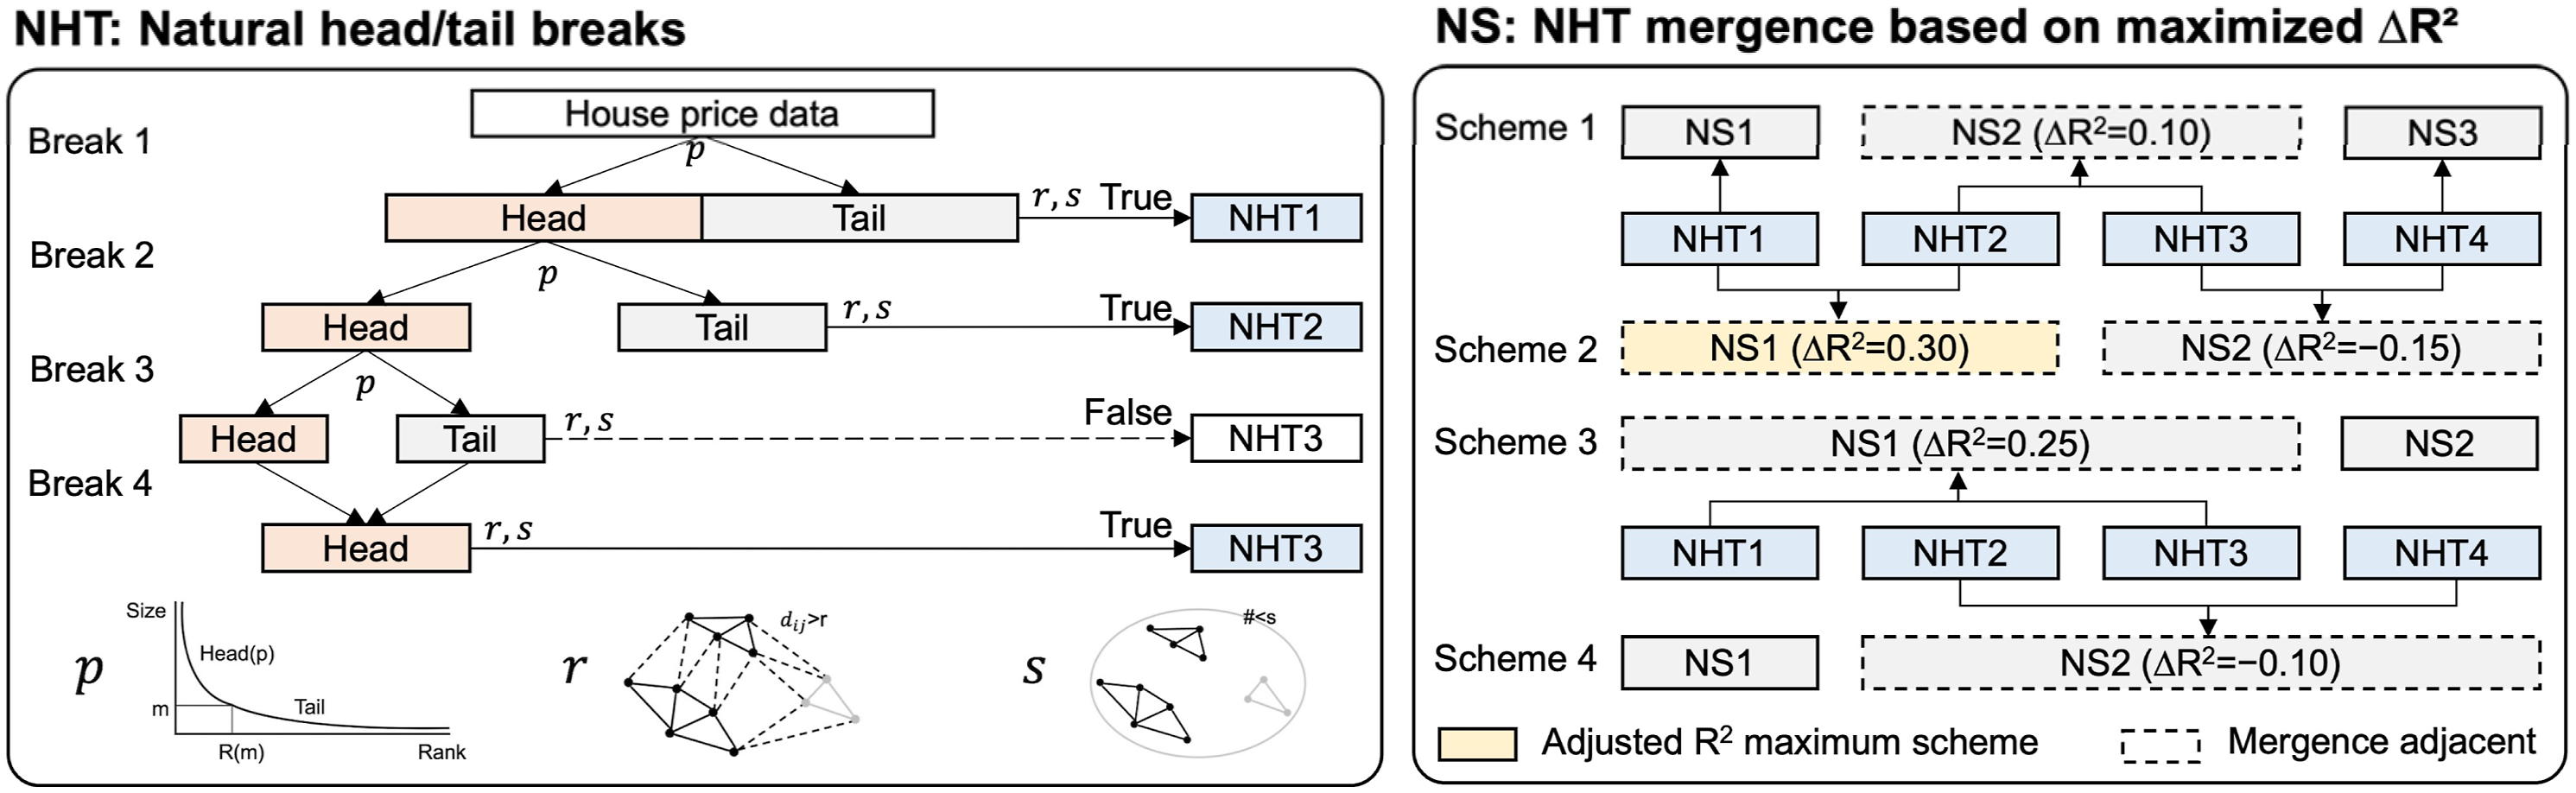
The procedure proceeds recursively by iteratively partitioning the data into head and tail subsets using HT. If the head accounts for less than p = 55% of the total sample, the tail subset is converted into a spatial network using Delaunay triangulation, where edges longer than r = 800 m are removed to enforce spatial continuity. Network components with fewer than 3 nodes are discarded, and only subsets with more than s = 200 samples are retained as valid NHT areas. Tail subsets that do not meet these criteria are merged back with the head at the previous level and re-evaluated as a new candidate subset, whereas valid tail subsets are recorded as NHT areas, and the head subset is further partitioned in subsequent iterations. The process continues until no further valid subdivisions can be identified. The resulting NHT subsets are spatially coherent and of reasonable scale, serving as the foundational areas for subsequent submarket merging.
The initial parameters were theoretically and empirically informed, then validated via sensitivity analysis. Specifically, p = 55% serves as a standard minority threshold for the head in heavy-tailed distributions; r = 800 m aligns with the typical spatial scale of a 10- to 15-min walkable neighbourhood, ensuring meaningful socio-economic interactions; and s = 200 is set to guarantee sufficient degrees of freedom for reliable coefficient estimation in hedonic regressions. Detailed results of the sensitivity analysis confirming the robustness of these selections are reported in the Supplemental Material.
Natural submarkets: Merging NHT areas for maximizing hedonic model fit
Effective housing market segmentation should reflect not only price variation but also similarity in attribute-based price formation. Within the hedonic pricing framework, submarkets that share similar relationships between housing attributes and prices can be expected to yield improved model fit when combined. Based on this principle, we evaluate the merging of adjacent NHT areas by examining changes in Adjusted R2.
For each NHT area, a hedonic pricing model is first estimated and its Adjusted R2 recorded (see Supplemental Material Method 5 for model specification). We then evaluate all pairwise combinations of adjacent NHT areas by estimating merged models and computing the corresponding Adjusted R2. The gain from each merge is defined as the difference between the merged model’s fit and the highest Adjusted R2 among the original areas. These gains are further aggregated across possible merging configurations, and the combination that maximises the total improvement is selected to delineate natural submarkets.
Taking the city shown in the right panel of Figure 2 as an example, where the initial segmentation yields four NHT areas, four possible merging strategies exist. Strategies 1 and 2 involve pairwise merges, while Strategies 3 and 4 merge three areas simultaneously. Strategy 2 is particularly flexible, as it permits selective merging, such as NHT1 with NHT2 or NHT3 with NHT4, depending on which combination yields a larger R2 gain. In this example, merging NHT1 and NHT2 produces a larger gain than alternative multi-area combinations, while other potential merges contribute little. The optimal configuration therefore retains this pairwise merge and preserves the remaining areas as separate submarkets, resulting in three final NS units: NS1 (from NHT1 and NHT2), NS2 (from NHT3), and NS3 (from NHT4).
City classification based on natural submarkets statistical characteristics
Based on the delineation of natural submarkets, cities are further classified at the regional scale across multiple essential dimensions captured by the delivered approach, including hierarchical structure, size distribution, explanatory capacity, and spatial structure centrality. The former two dimensions demonstrate the complexity of natural submarkets, and the latter two reflect the structural features, captured by the regressors and network analysis. Specifically, hierarchical structure describes the number of market segmentation; size distribution captures the heterogeneity of submarket scales; explanatory capacity reflects the consistency and strength of model fit; and spatial structure centrality characterises the degree of spatial differentiation within the urban system. Detailed definitions, computational procedures, and formulas are provided in the Supplemental Materials.
Hierarchical clustering structure of regional natural submarkets
To capture structural similarities in price formation across regional NS, we construct feature vectors for each NS and apply hierarchical clustering to identify region-scale groupings. For each NS, separate hedonic regressions are estimated, and standardized attribute coefficients are extracted. Principal component analysis (PCA) is then used to reduce dimensionality and mitigate multicollinearity. Euclidean distances in the PCA space measure dissimilarities, and agglomerative clustering merges submarkets with similar pricing structures by minimizing within-group variance. By applying a threshold to the resulting dendrogram, we identify clusters of submarkets that exhibit high internal consistency in pricing determinants, defined as regional natural submarket clusters (RNSCs). Unlike boundary-based delineations, this approach reveals structural convergence in market behaviour, providing a basis for classifying regional submarket types and tracing the spatial evolution of housing structures.
Study area and data
This study focuses on 26 cities in the core area of the Yangtze River Delta (YRD) region in China as the empirical case. As one of the most economically advanced regions in mainland China, the YRD features a highly clustered pattern of urban (Figure S3).
As the access to the real house transaction data is very limited, we followed the emerging but well-established studies using the listing house price as a proxy for housing value or trends (Rey-Blanco et al., 2024; Shen and Karimi, 2017). The listing housing price data were collected from open-access online real estate transaction platforms widely used in China. Duplicate listings across platforms were removed, resulting in a final dataset of 474,457 valid records. The spatial distribution of the data covers most of the built-up areas, reflecting the high degree of urbanization across the region.
Housing prices are widely regarded as the outcome of multiple factors related to structural features, location situations and the neighbourhood effects. The spatial configuration has been demonstrated in housing studies due to its role in capturing centrality across scales delivered by the order of public space that is of the cores for urban planning (Shen and Karimi, 2016). Thus, this study also used street network data (from https://openstreetmap.org) to calculate two types of centrality metrics (Integration and Choice) at multiple spatial scales, following space syntax theory (Hillier et al., 2012; Shen and Karimi, 2017), to describe the locational accessibility of housing units. In addition, neighbourhood-level service amenities were measured using the network distance to the points-of-interest (POIs), including metro and bus stations, kindergartens, and other public facilities. To quantify the contribution of different housing characteristics, we employ a hedonic pricing model to estimate their implicit values, providing an empirical basis for analysing the underlying mechanisms of price formation. The model specification and all variables used are detailed in the Supplemental Material.
Results
Validation of natural submarket segmentation
Sensitivity analysis of the key parameters (p, r, and s) indicates that the segmentation results are stable across reasonable parameter ranges (see Table S2 and Table S3). To further validate the submarket delineation, we examine whether segmentation produces significant differences in price levels and formation structures using three complementary strategies (see Supplemental Material). First, the Chow test is used to assess whether segmentation leads to statistically significant differences in price structures. Second, heterogeneity in the effects of housing attributes is examined by testing the significance of interaction terms between submarket dummies and housing attributes in the hedonic model. Third, we report the RMSE of the hedonic models for each segmentation scheme.
Across the examined cities, the three segmentation methods show clear performance differences (Table S4). The traditional HT approach performs worst across all metrics, with low mean values for the significance of submarket differences (0.320) and attribute variability (0.080), as well as the highest RMSE (0.454), indicating limited capacity to capture underlying housing structures. NHT substantially improves structural differentiation (1.000 and 0.509) and moderately reduces RMSE (0.449), though some segmentations remain ambiguous. In contrast, the proposed NS method achieves the best performance, with strong structural indicators (1.000 and 0.545) and the lowest RMSE (0.375), demonstrating its superior capacity to capture market structures by jointly reflecting price distributions and pricing relationships.
To further assess potential overfitting introduced by the merging procedure, we conduct out-of-sample validation (see Figure S2). The results show that the NS-based segmentation maintains consistent explanatory power in the test set without systematic inflation relative to the training results, suggesting that the observed improvement reflects a more generalizable representation of underlying housing market structures rather than overfitting.
Figure 3 compares the spatial segmentations and scaling fits of the three methods. While HT captures price hierarchies, it produces fragmented areas with limited coherence. NHT improves this by yielding contiguous divisions that better align with urban morphology. NS further integrates these hierarchies with consistent pricing determinants, producing stronger spatial clustering and clearer boundaries. This highlights that NS does not merely reduce hierarchical levels, but delineates statistically robust and economically interpretable submarkets. Spatial segmentation, rank–size fitting, and size distribution of HT, NHT, and NS in Shanghai.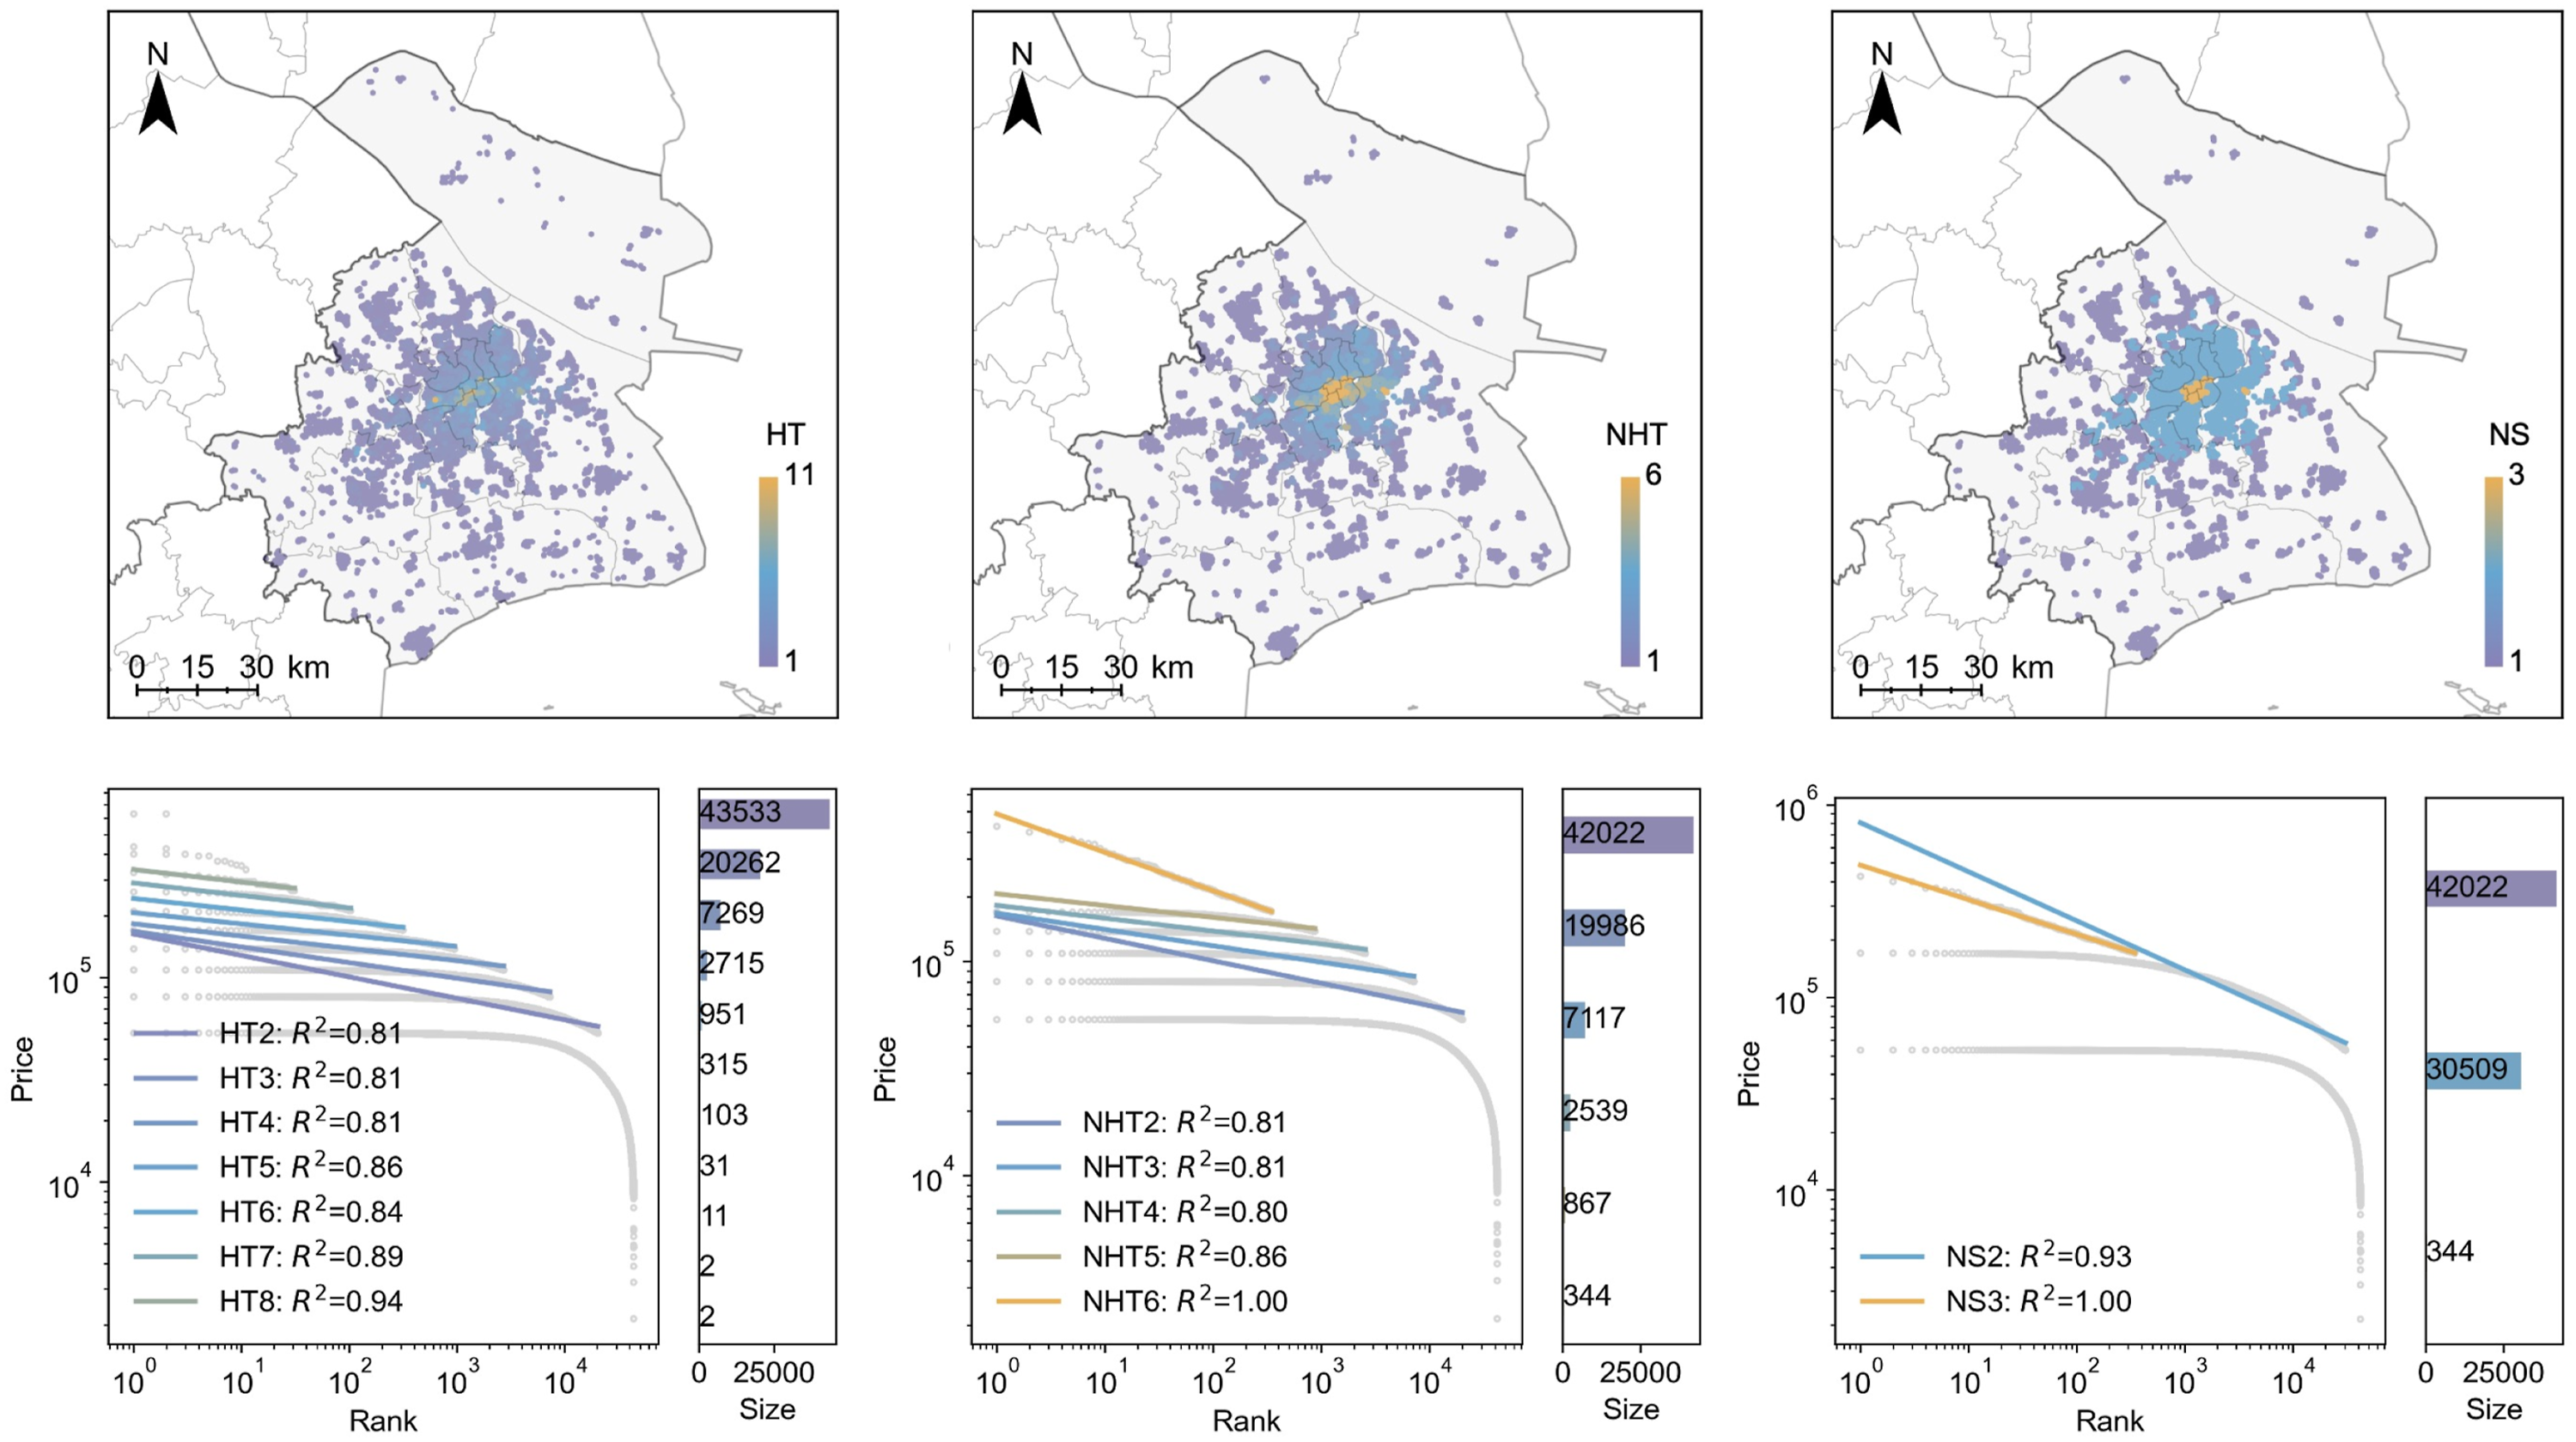
Size distributions further illustrate these contrasts. HT and NHT leave numerous minor, fragmented divisions, whereas NS achieves clearer consolidation (e.g. merging NHT2 and NHT5 into NS2). Importantly, housing prices within NS areas continue to follow the scaling law with improved fit quality – most notably in NS2 relative to its pre-merged counterparts. This demonstrates that the merging process preserves the intrinsic scaling properties (see Figure S4 for other cities).
Re-understanding urban structure through natural submarkets
Hierarchical, structural, and explanatory features of city-level natural submarkets
HT method segments most cities in the YRD into 9 to 11 price levels, with developed cities like Nanjing, Wuxi, and Hangzhou exhibit up to 12 levels, suggesting a higher degree of structural differentiation (Table S4). However, because HT relies solely on price rules, the number of tiers does not necessarily reflect distinct or stable markets. In contrast, NHT method significantly reduces the number of levels and narrows inter-city variation, indicating that many HT-derived segments lack meaningful economic differentiation. For instance, under HT, cities like Yangzhou, Yancheng, and Zhenjiang exhibit a comparable number of levels to Shanghai, yet under NHT their hierarchies are substantially simplified. Only Shanghai retains a relatively complex structure, suggesting that while similar price gradients may exist elsewhere, Shanghai uniquely contains multiple mature and spatially coherent submarkets. This raises a critical question: Does higher economic development imply more market tiers?
To answer this question, the segmentation outcomes of all three methods are evaluated against key macroeconomic indicators (Figure S5). NHT-based hierarchies exhibit strong correlations with cities’ socioeconomic development (R2
Shannon entropy was used to assess the balance of housing unit distribution across natural submarkets (Figure 4(a)), revealing two distinct structural patterns. The first, a dominant structure, features one large submarket, typically comprising low-priced units, accompanied by several smaller ones, as seen in Shaoxing, Hangzhou, and Suzhou. The second is a balanced structure, where submarkets are of relatively equal size, evident in cities such as Chizhou, Zhoushan, and Huzhou. Structural balance, however, does not imply high explanatory power in the hedonic model; it may simply indicate weak differentiation or limited segmentation, underscoring the need to interpret scale in relation to pricing determinants. Structural characteristics of natural submarkets in YRD cities. (a) Submarket scale distribution and Shannon entropy measuring scale balance. (b) Market explanatory power based on hedonic Adjusted R2. (c) Integrated classification of cities into four structural types combining hierarchy, scale, and explanatory strength.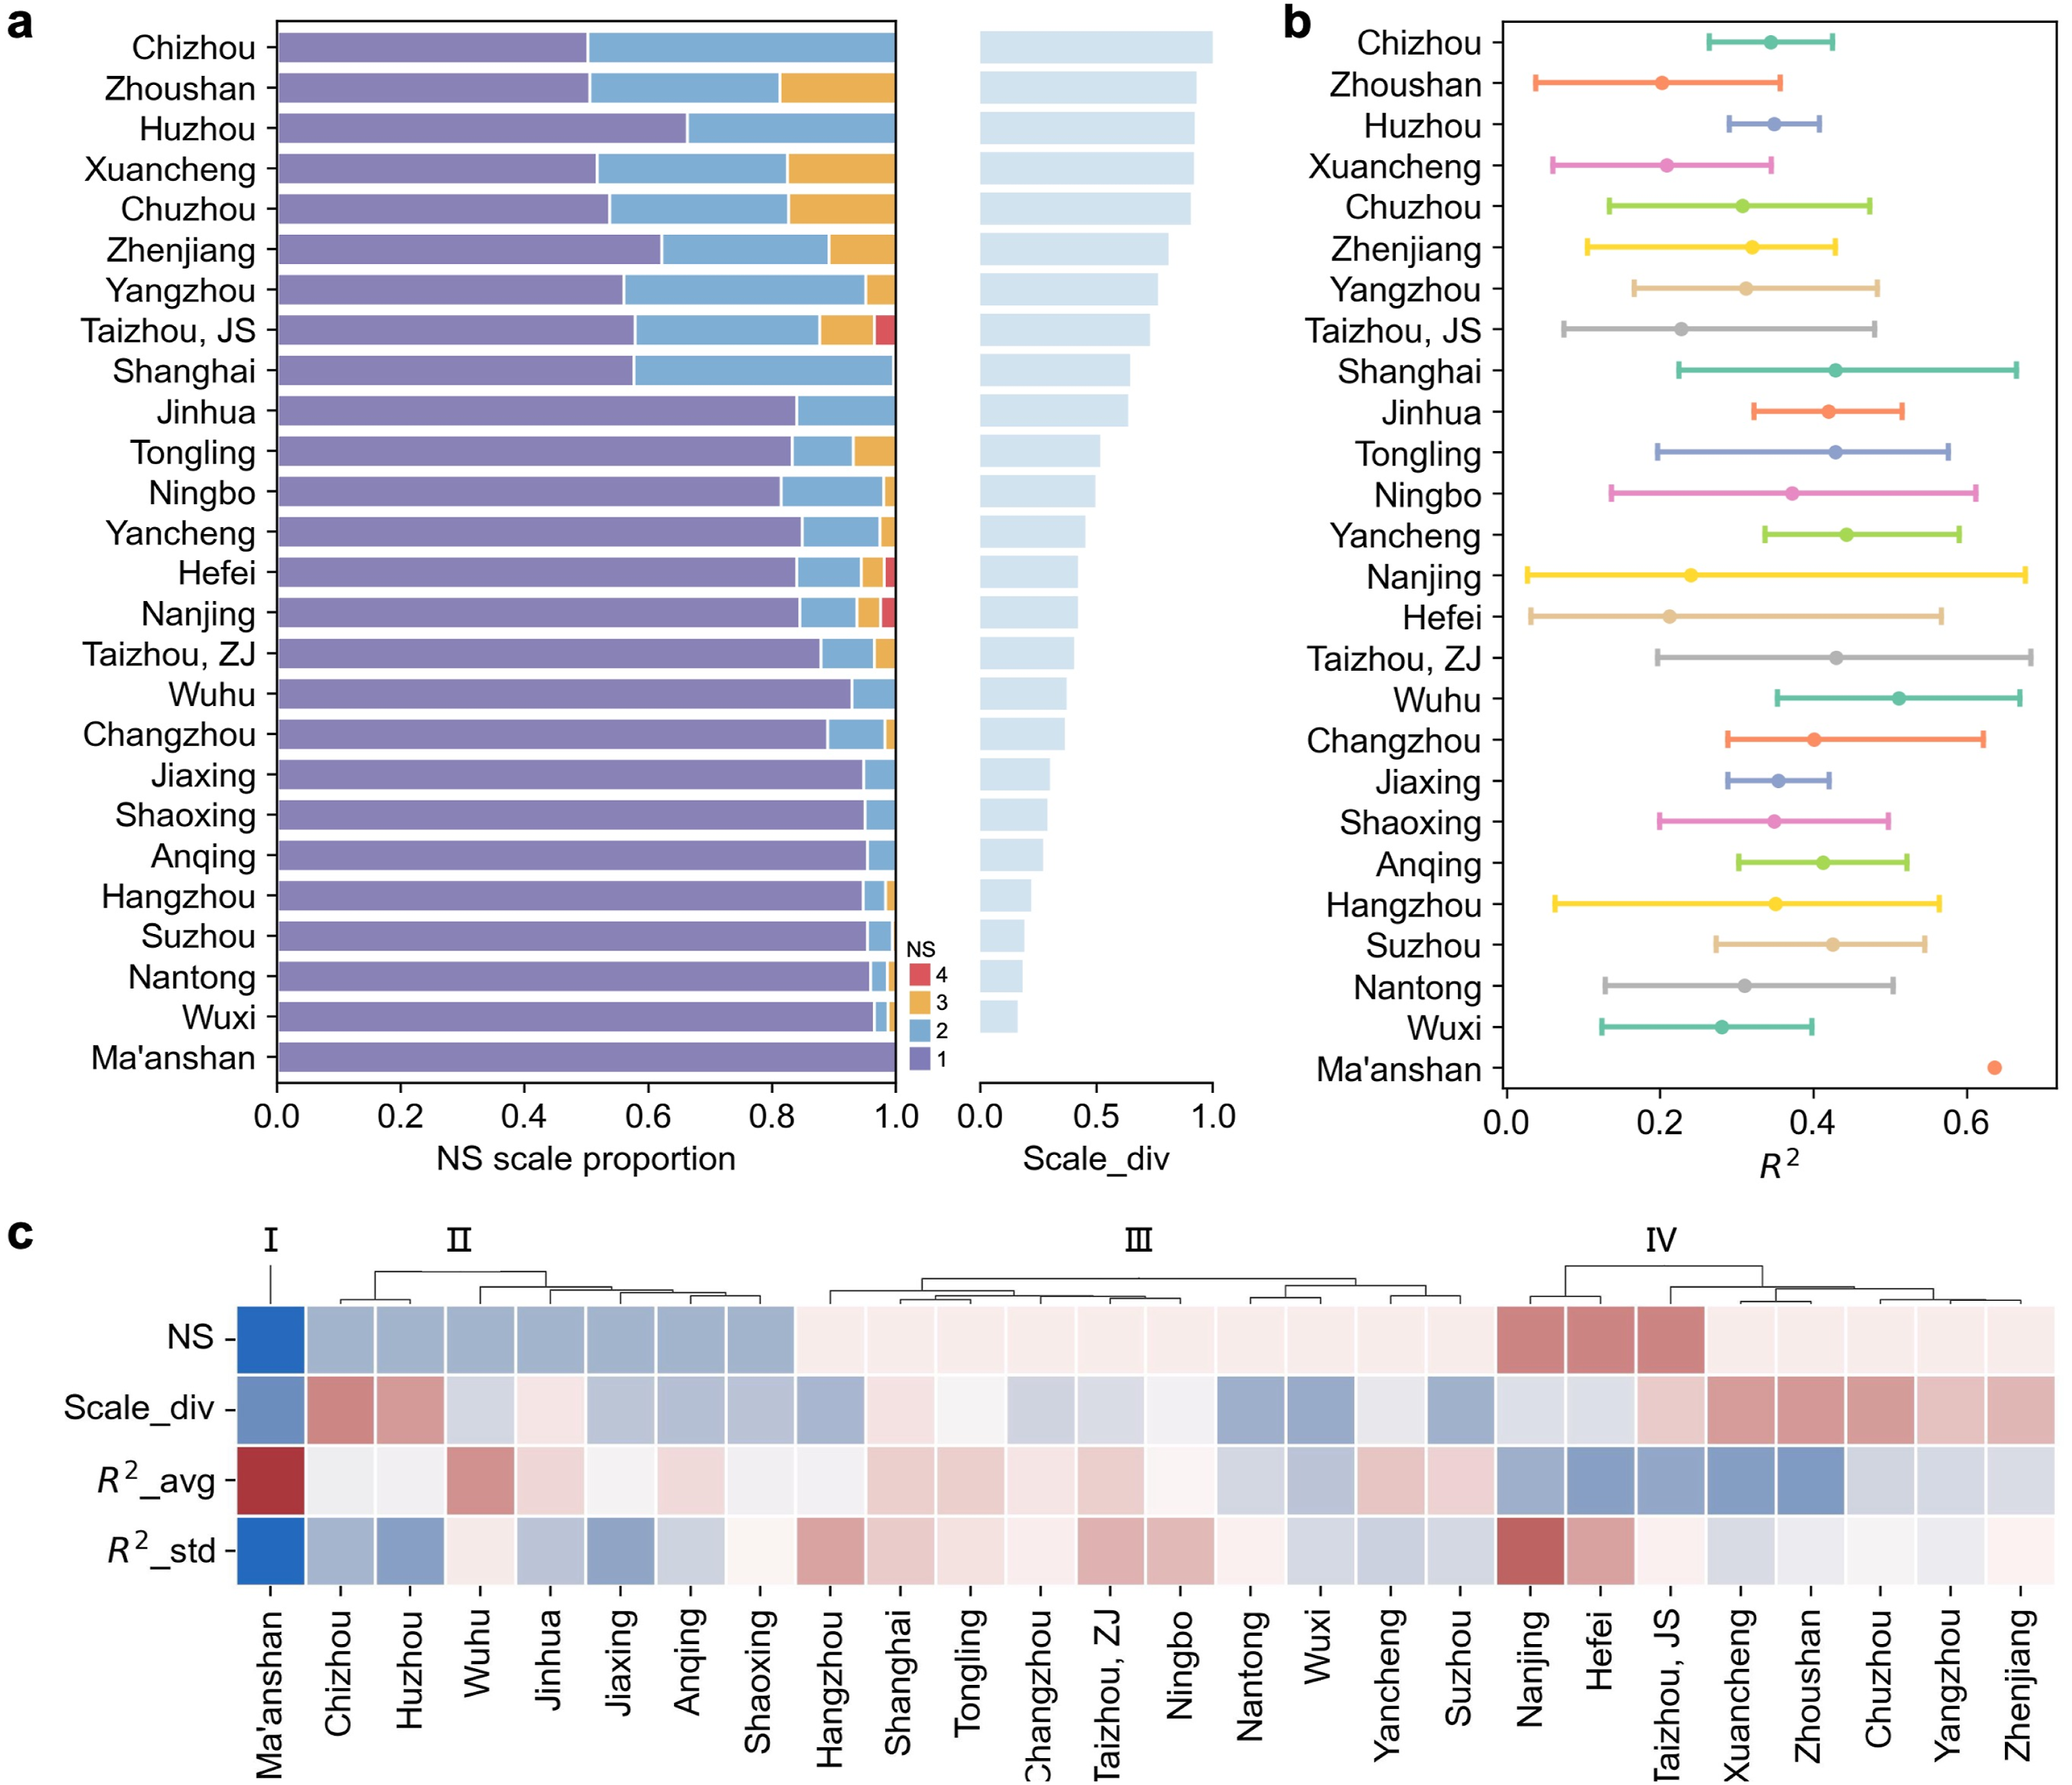
Regarding explanatory power, cities exhibit distinct combinations of average model fit and internal variability (Figure 4(b)), indicating that explanatory strength and stability do not necessarily co-evolve. Some cities such as Ningbo and Hangzhou show relatively high average R2 values but also elevated standard deviations, suggesting both high explanatory strength and internal heterogeneity. In contrast, cities such as Nanjing and Hefei display moderate or lower R2 values with comparable or even higher variability, implying weaker and less stable pricing structures. Only a limited number of cities, including Jinhua, Anqing, and Yancheng, combine high R2 values with low standard deviations, representing more consistent and well-aligned market mechanisms. This comparison underscores that a higher number of hierarchical levels, as observed in Nanjing and Hefei, does not necessarily imply a more interpretable market structure.
Most cities can be grouped into two main categories (Figure 4(c)). The first comprises Types II and III, exhibiting multi-level structures with well-defined hedonic mechanisms, differing mainly in submarket size distribution (balanced in Type II, uneven in Type III). The second, Type IV, shows higher structural complexity and scale differentiation, but lower explanatory power and greater internal variability. In contrast, Type I includes only Ma’anshan, characterised by a single undifferentiated level with highly consistent pricing mechanisms, reflecting a strongly homogeneous housing structure.
Spatial structure of natural submarkets within each city
Under NS segmentation, housing markets display clearer boundaries and stronger internal coherence (Figure 5(a)). In the eastern YRD, a cohesive low-price system (mainly NS1) forms around Shanghai, with cities like Shanghai and Suzhou showing monocentric patterns. In contrast, northern and southwestern cities (e.g. Nantong, Chizhou, Xuancheng) exhibit more balanced multi-tiered structures, where NS2 or NS3, rather than NS1, serve as spatial cores. Natural submarkets and city types in the YRD. (a) Spatial distribution of NSs for each city. (b) Classification of YRD cities by intra-city submarket structure.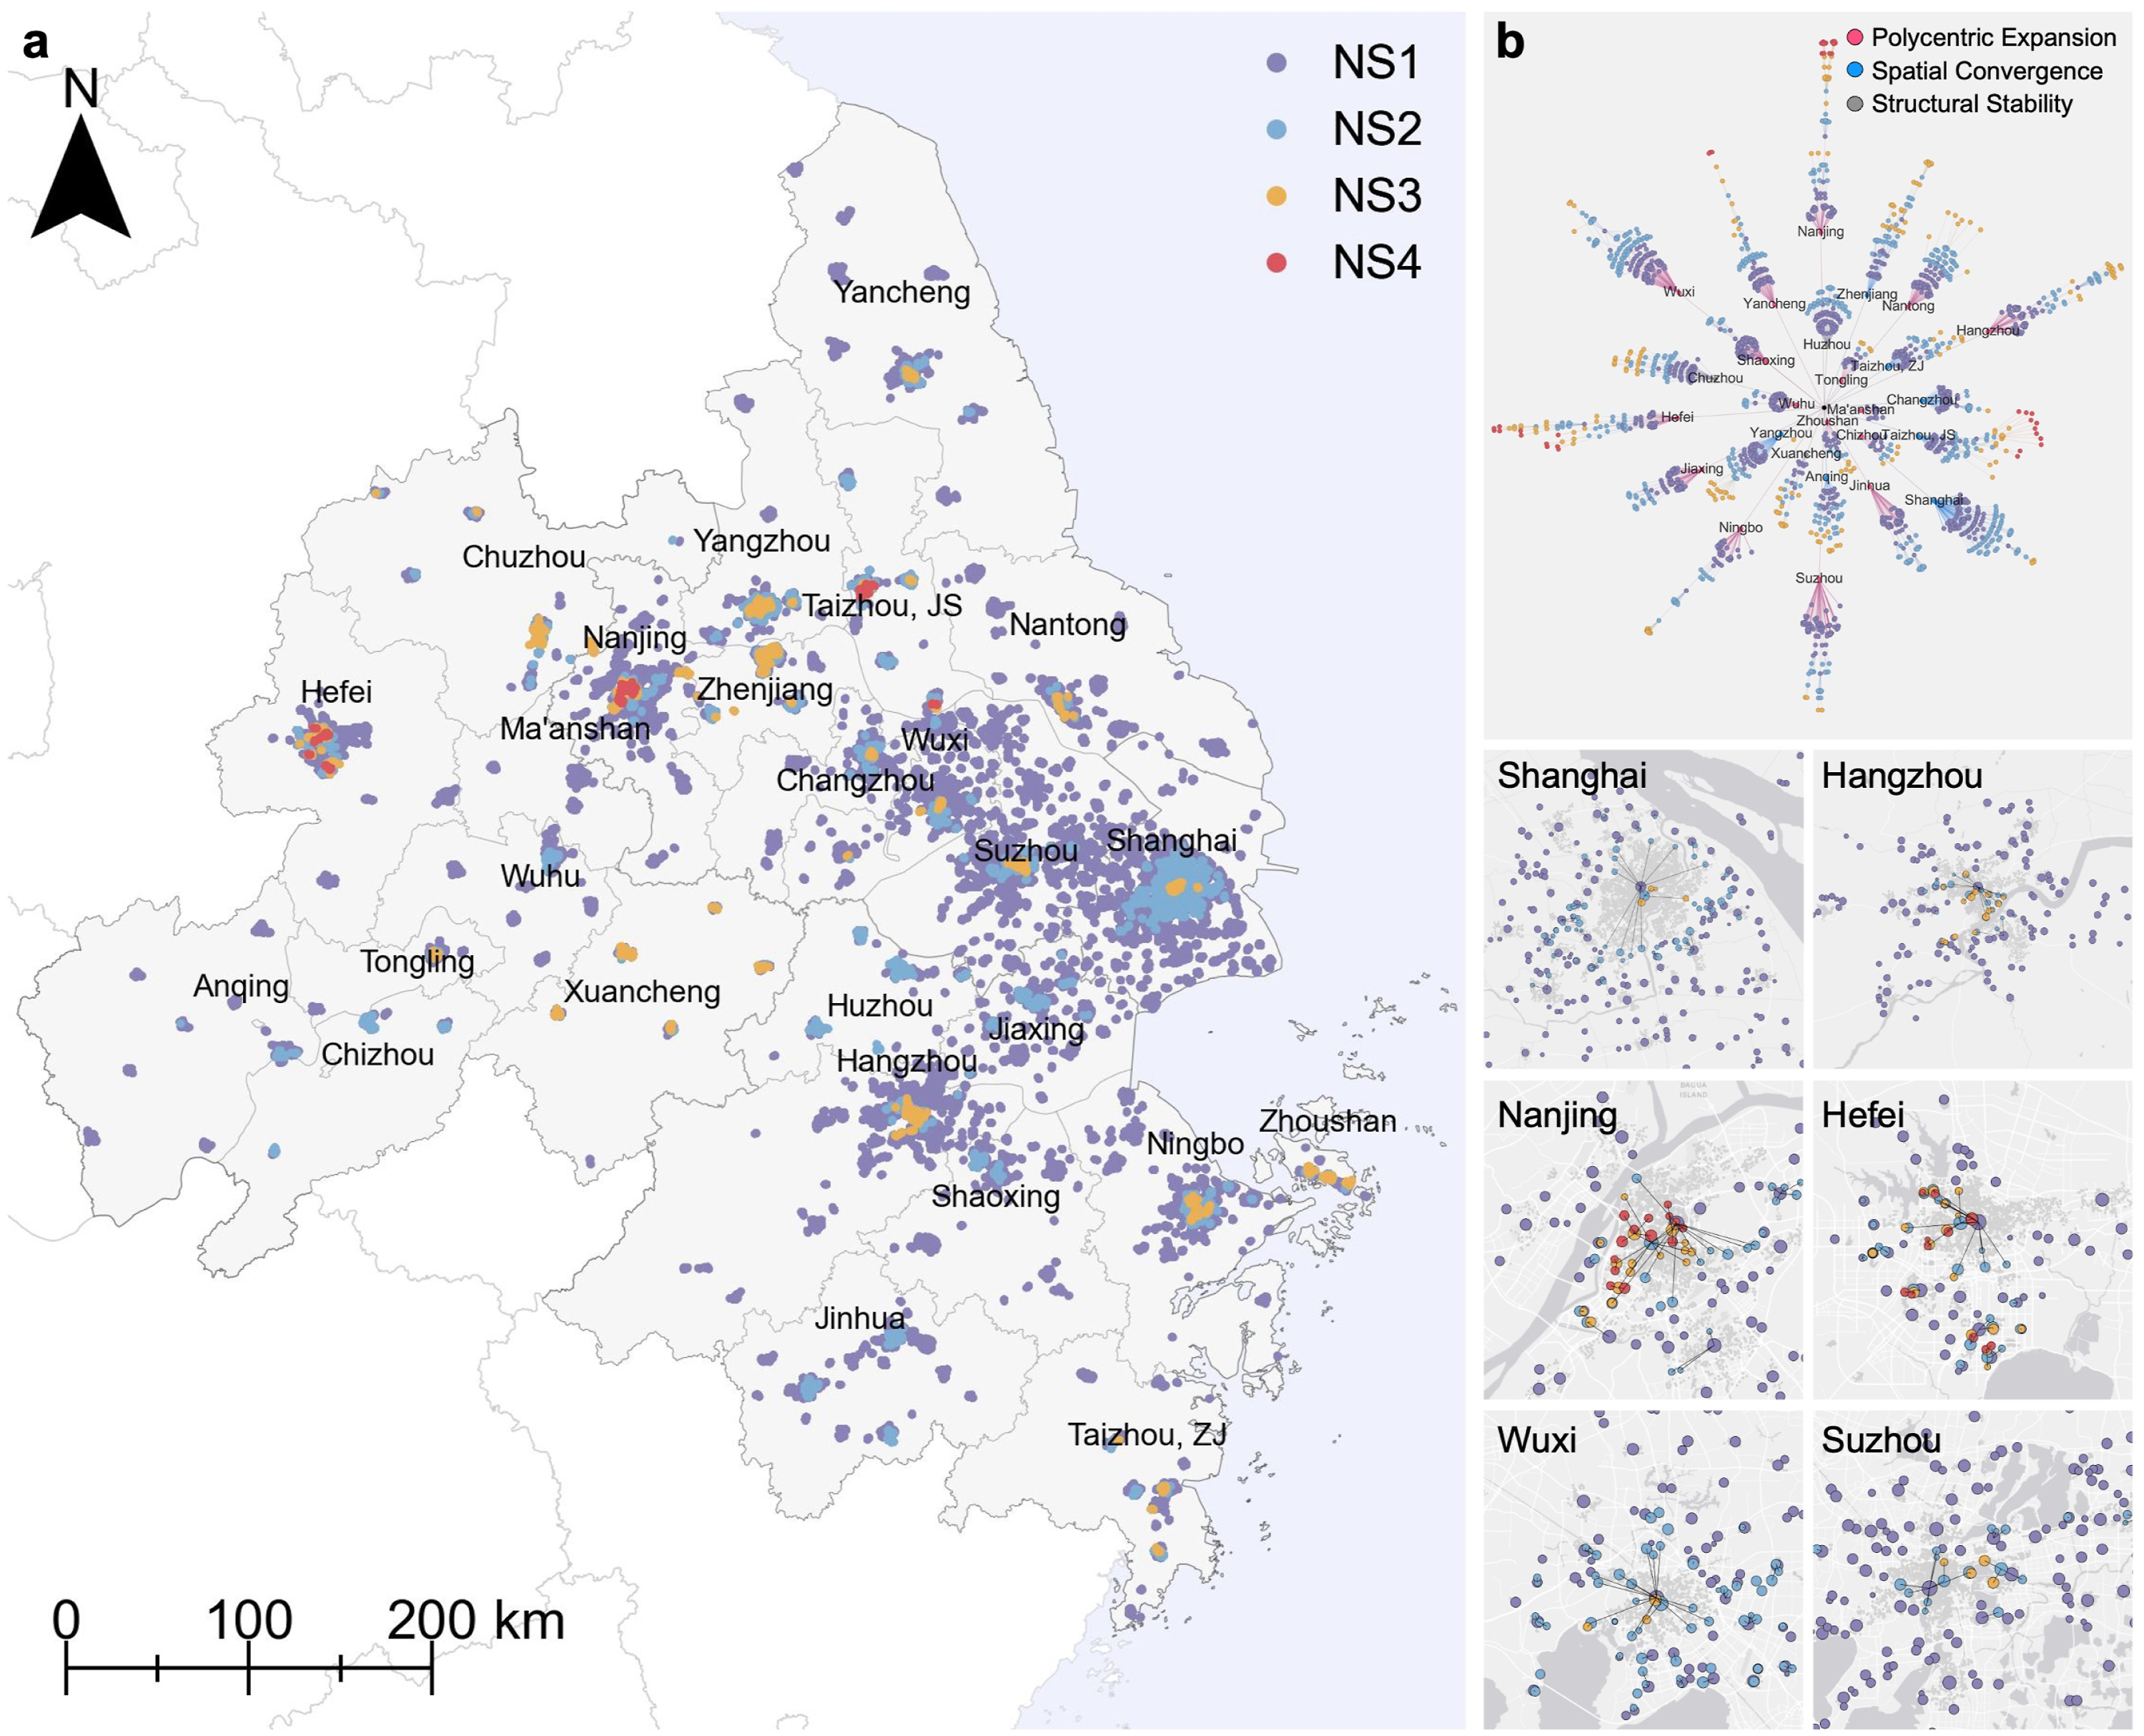
Further spatial characteristics are captured by the topological maps in Figure 5(b). Here, each housing-price cluster is abstracted as a network node based on predefined spatial parameters, enabling us to trace the splits that give rise to natural submarkets (see Supplemental Material for more details). Node origins and sizes then indicate market dispersion: high-price markets in Nanjing and Hefei appear fragmented, whereas those in Shanghai, Wuxi, and Suzhou remain concentrated in central areas. Notably, in Shanghai and Ningbo, all NS3 nodes originate from a single NS2 node, highlighting an even more pronounced monocentric structure.
To move from qualitative topology to a comparable metric of centrality, we quantified spatial form with the Spatial Polycentricity Index (SPI) for each city under both NHT and NS delineations, with its definition and calculation provided in the Supplemental Material. We then focused on relative SPI changes (Table S5) between the two methods to capture the effects of mechanism-driven restructuring, independent of geographic form or development constraints. The changes identify three spatial patterns among cities in the YRD: • Polycentric Expansion. Cities such as Tongling, Nanjing and Hangzhou show substantially higher SPI values under NS segmentation. This suggests that merging submarkets with similar hedonic pricing mechanisms reveals more decentralized spatial structures. • Spatial Convergence. In contrast, cities like Shanghai and Changzhou exhibit notable SPI declines after NS merging, indicating increased spatial centralization. The consolidation process reinforces dominant monocentric patterns, reflecting stronger concentration in the mechanisms underlying price formation than in price distributions alone. • Structural Stability. In cities such as Huzhou, Xuancheng, and Chuzhou, SPI remains largely unchanged, suggesting stable spatial forms across segmentation schemes.
Re-understanding regional structure by the NSs between cities
Regional natural submarket structure
Under the NS approach, regional spatial structure emerges from similarities in within-city submarkets and across-city linkages. We apply hierarchical clustering to group submarkets with convergent hedonic pricing formation into regional clusters. As shown in Figure 6(a) and Table S6, the analysis yields seven distinct clusters (RNSC1—RNSC7). The largest cluster includes 16 NSs across 15 cities, accounting for 70% of the sample. It extends from Shanghai across major core cities and their surrounding areas, exhibiting strong cross-city agglomeration and forming the dominant structural pattern. The remaining six clusters are considerably smaller, although some still span multiple cities. For instance, clusters 3, 5, and 7 each include NSs from at least 10 cities. Despite lacking spatial contiguity, these submarkets display highly consistent pricing mechanisms, forming a dispersed yet coherent regional structure. All other clusters are limited in scale, typically comprising only a few submarkets. Regional structure of natural submarkets in the YRD. (a) Hierarchical clustering of natural submarkets. (b) Coefficients of hedonic price model variables. (c) Typology of inter-city natural submarkets. (d) Transformation among different definitions of housing markets.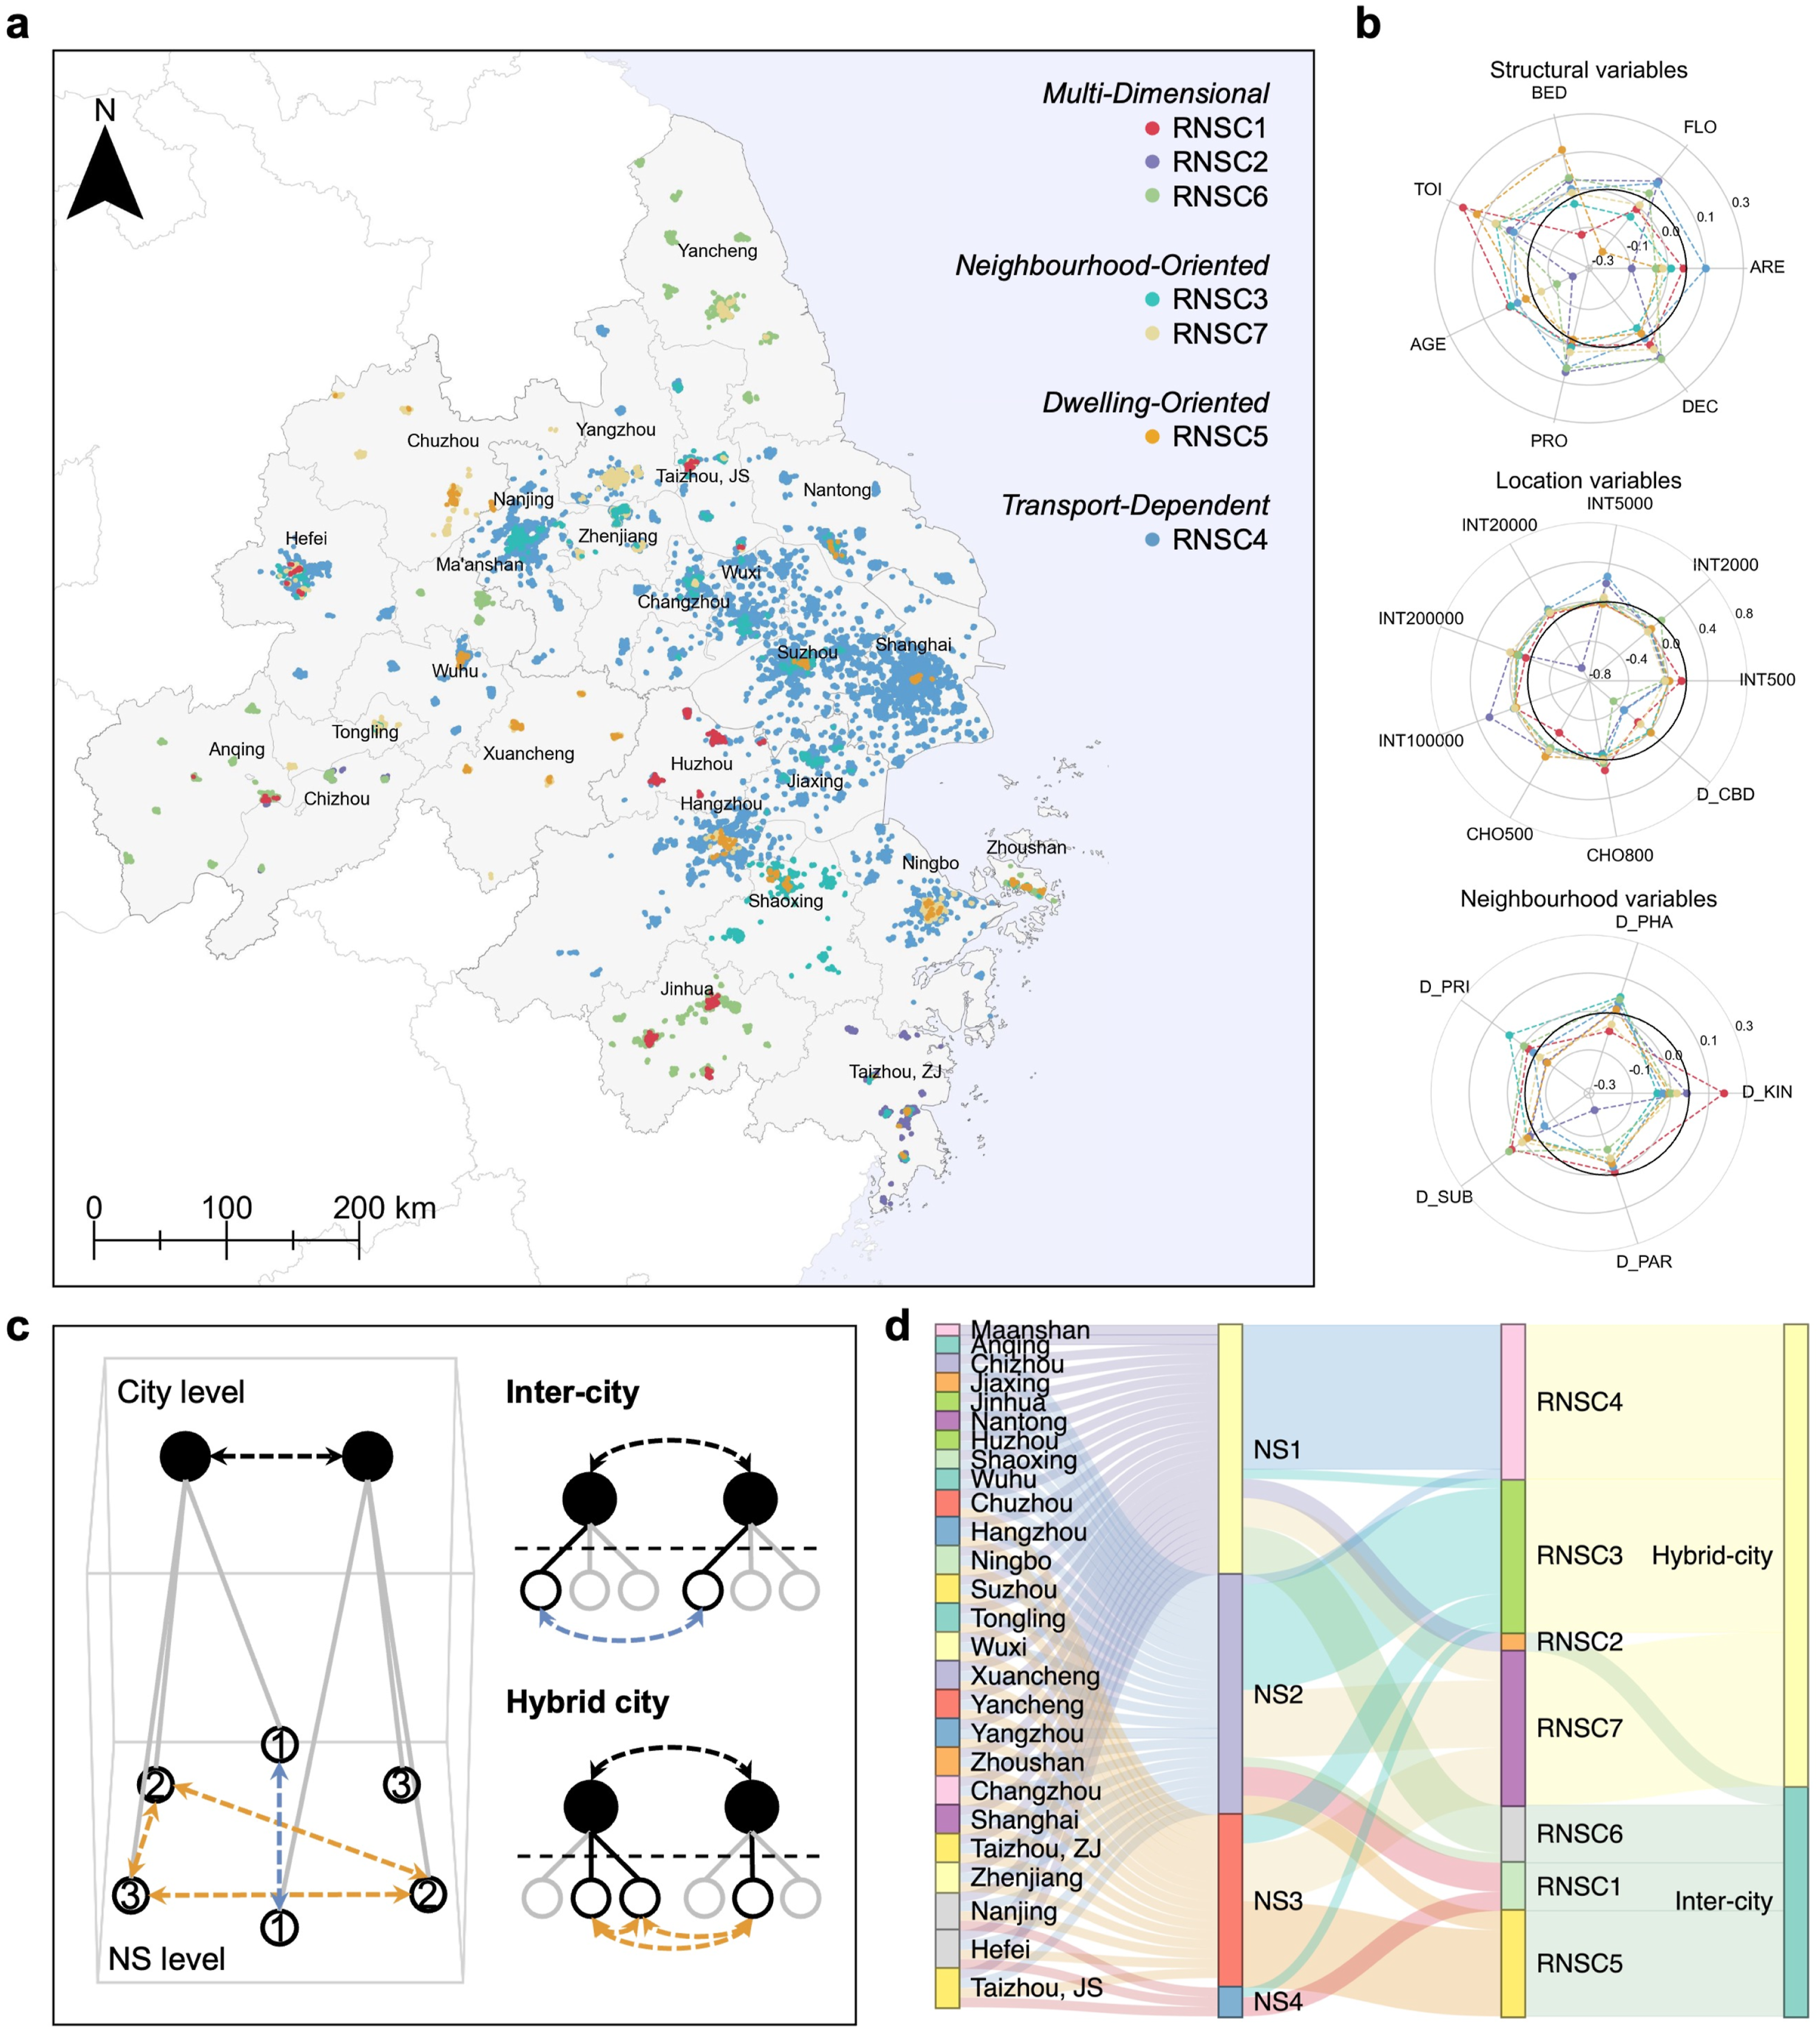
Typology and interpretation of regional natural submarket clusters
From a price formation perspective, regional market structures display notable heterogeneity in their sensitivity to housing attributes, though concentrated in a limited set of variables (Figure 6(b)). The largest cluster (RNSC4) responds strongly to transport accessibility, including neighbourhood-scale integration (INT5000), proximity to the city centre, and subway access, and is thus defined as a Transport-Dependent Cluster, reflecting the dominant role of accessibility across the region. In contrast, RNSC5 is primarily shaped by internal dwelling characteristics, such as the number of bedrooms, toilets, and floor level, forming a Dwelling-Oriented Cluster. RNSC3 and RNSC7 are more closely associated with neighbourhood amenities, particularly educational facilities and daily services, and are grouped as a Neighbourhood-Oriented Cluster. The remaining clusters (RNSC1, RNSC2, and RNSC6) respond simultaneously to structural, locational, and neighbourhood factors, and are therefore classified as a Multi-Dimensional Cluster, which are smaller in size and more spatially fragmented, mainly distributed in peripheral areas.
Overall, the results indicate that housing markets in the Yangtze River Delta remain largely driven by accessibility and infrastructure, while also exhibiting spatial differentiation shaped by multiple hedonic factors.
Regional structural types and evolution under different definitions
The aggregation of natural submarkets often transcends administrative boundaries, producing distinct forms of spatial coordination. Figure 6(c) presents a typology of these regional structures by mapping linkages between cities and submarkets. Two types can be identified: (1) Inter-city structures, where submarkets from multiple cities share similar hedonic mechanisms, reflecting cross-boundary convergence; and (2) Hybrid structures, which combine local diversity with regional alignment, integrating intra-city nesting and cross-city coherence to indicate deeper regional integration.
Under different segmentation frameworks, the YRD housing structure reorganizes in distinct ways. This regional integration is driven by shared price formation shaping cross-city reconfiguration rather than administrative boundaries. This integration is driven not by administrative boundaries or absolute price levels, but by shared price formation shaping cross-city reconfiguration. Figure 6(d) illustrates a four-tier mapping linking cities, NSs, regional clusters, and structural forms, outlining a progression from local differentiation to regional integration. Initially, most cities are partitioned into two or three NS layers, reflecting internal pricing heterogeneity and forming the basis for regional clustering. These markets are then regrouped into regional clusters according to structural similarity, irrespective of their city or tier of origin. For example, RNSC2 is composed exclusively of low-price areas, while others incorporate diverse submarkets from multiple cities and hierarchical levels. Ultimately, these regional clusters align into two structural types, illustrating how shared hedonic mechanisms drive regional housing integration. In particular, hybrid regional areas establish connections among a wide range of core cities in the YRD including Shanghai, Nanjing, Hangzhou, and Suzhou, thereby marking a decisive shift from city-specific differentiation toward mechanism-based restructuring.
Discussion
This study proposes a scaling-based framework for segmenting housing price, defining natural markets as contiguous housing clusters with similar characteristics in both price and its formation. This approach improves boundary clarity while capturing internal heterogeneity, offering a bottom-up lens on urban spatial structure. The primary methodological contribution, therefore, lies in translating these conceptual scaling properties into an operational framework for submarket delineation.
Robustly operationalizing this framework requires balancing data-driven partitioning with model generalization. While driven by data hierarchy, explicit thresholds ground mathematical scaling in urban reality, ensuring submarkets capture meaningful socio-economic interactions while maintaining statistical validity. Crucially, the merging mechanism prevents overfitting by aggregating spatial units to reduce model complexity rather than fitting noise. As confirmed by out-of-sample robustness tests, the improvements in Adjusted R-squared reflect a genuine enhancement in the bias-variance tradeoff. Consequently, although the identification of natural markets shows moderate parameter sensitivity, the underlying spatial structures remain highly stable, proving that the framework reliably captures intrinsic urban patterns.
Analysis of 26 cities in the YRD shows that most contain multi-level NS structures, indicating diverse hedonic pricing mechanisms. Interestingly, these hierarchies do not align neatly with urban development levels. While some developed cities display complex yet unstable market structures with weak explanatory power, certain smaller cities exhibit homogeneous, stable single-market patterns. By clustering NS areas with similar price determinants, the study uncovers regional structures that cross administrative borders and defy traditional price-based classifications. Their key distinctions lie in locational and amenity preferences, particularly in accessibility and neighbourhood context, which are central to spatial differentiation in the YRD. The YRD housing markets fall into cross-city and hybrid forms. Among them, hybrid structures dominate, underscoring a trend toward coordinated price mechanisms amid regional integration.
The study has some limitations that highlight areas for future research. First, its reliance on cross-sectional price data calls for further validation in data-scarce or varied socioeconomic settings. Incorporating longitudinal data and broader urban indicators would help track how these submarkets evolve over time. Second, while the proposed NS method effectively segments the market hierarchy, future work could introduce explicit measures of scaling behaviour to examine their consistency across cities. Finally, integrating machine learning or other non-parametric approaches would help capture the non-linear market processes that traditional hedonic models might oversimplify.
Supplemental material
Supplemental material - Scaling-informed natural submarkets: A bottom-up approach to segment housing markets in the Yangtze River Delta
Supplemental material for Scaling-informed natural submarkets: A bottom-up approach to segment housing markets in the Yangtze River Delta by Zihan Xu, Yunjie Feng, Qi Song, and Yao Shen in Environment and Planning B: Urban Analytics and City Science
Footnotes
Funding
The authors disclosed receipt of the following financial support for the research, authorship, and/or publication of this article: This work is supported by the National Science Foundation of China (General Program) (Grant No. 52278074 and 51908413), the Shanghai Rising-Star Program (Grant No. 22QB1404800) and the Fundamental Research Funds for the Central Universities (Grant No. 2025-1-YB-02).
Declaration of conflicting interests
The authors declared no potential conflicts of interest with respect to the research, authorship, and/or publication of this article.
Data Availability Statement
Data sharing is not applicable to this article as no datasets were generated or analysed during the current study.
Supplemental material
Supplemental material for this article is available online.
Author biographies
References
Supplementary Material
Please find the following supplemental material available below.
For Open Access articles published under a Creative Commons License, all supplemental material carries the same license as the article it is associated with.
For non-Open Access articles published, all supplemental material carries a non-exclusive license, and permission requests for re-use of supplemental material or any part of supplemental material shall be sent directly to the copyright owner as specified in the copyright notice associated with the article.