
Abstract
Income-based unequal access to schooling threatens inclusive urban growth and fair education in the rapidly urbanizing Global South, but measuring it remains difficult due to limited data. This study addresses the issue by using a new multi-source data method, analyzing the residence-school relationship of over one million students through mobile phone population mobility data in Chinese megacities. We reveal a complex pattern of inequality: students at top schools travel long distances, while lower-quality schools cluster low-income students in isolated groups. Top schools, although showing greater income diversity within their student bodies, are still predominantly attended by high-income students. Segregation decreases from primary to high-school levels, driven by the shift from proximity-based school districting to merit-based admission. However, urban expansion, despite the increase in school provisioning, reproduces these inequalities and segregation instead of solving them. This paper validates the Effectively Maintained Inequality theory in the Global South context and provides empirical evidence on unequal access to schooling in urban China.
Introduction
Educational inequality is a fundamental dimension of social inequality, as unequal access to educational resources among children perpetuates disparities in life chances (Burgess et al., 2005; Iannelli and Paterson, 2007). Wealthy families secure their socioeconomic advantage by providing superior educational opportunities for their children, thereby reinforcing intergenerational transmission of wealth and status (McLafferty and Preston, 2019). Conversely, poverty becomes entrenched within disadvantaged groups through the unequal distribution of educational resources, a process known as education-driven intergenerational class reproduction (Dustan and Ngo, 2018; Khabazi and Nilsson, 2021). Rapid urbanization, particularly in the Global South, often exacerbates these inequalities. The concentration of populations in megacities is frequently accompanied by limited educational infrastructure, with low-income groups marginalized to peripheral areas lacking adequate schools and public services, further deepening educational inequities (Chudgar et al., 2023; Mutisya et al., 2021; Zhang and Chen, 2018).
Many theories support this perspective. For instance, Maximally Maintained Inequality (MMI) posits that during educational expansion, higher-income groups continue to dominate newly added educational resources, securing priority access to education (Raftery and Hout, 1993). Similarly, Effectively Maintained Inequality (EMI) highlights that while educational expansion enables low-income groups to access basic resources, privileged families retain exclusive access to the highest-quality education, thereby exacerbating inequality (Lucas, 2001). Though these theories have been extensively validated in Western contexts, their applicability to the urbanization and spatial expansion patterns of the Global South remains underexplored. This is largely due to data limitations in Global South cities, where weak governance and low transparency hinder the availability of detailed school-level data (e.g., location, quality, student composition) and individual-level enrollment data (e.g., family location, school attended). For instance, Western countries have advanced research on school and residential income-based school segregation across multiple dimensions (Boterman, 2013; Breen et al., 2010; Perry et al., 2024), while in China, sensitive data such as household-level resident income and school quality are neither officially compiled nor publicly released, and data capturing individual residence-school relationship are scarce. Furthermore, existing qualitative research, primarily relying on interviews and surveys (Mendoza, 2018; Yang et al., 2014; Yang and Qiu, 2016), suffers from restricted spatio-temporal coverage and difficulties in cross-city comparisons.
Such gaps complicate the assessment of educational inequality and whether spatial-educational expansion has alleviated or worsened it. To address data limitations, this study integrates mobile phone urban mobility data, Area of Interest (AOI) data, and multi-source big data to construct a highly representative individual-level database of residence-school relationship. This approach matches family locations, income levels, and schools attended for approximately 30% of school-age children across four major Chinese megacities. With a data of 2 million students, the study reveals how inequality in access to educational resources emerges during urban expansion, framed as a multi-dimensional issue. This process is understood to originate at the household level as disparities in access to high-quality educational resources based on family socioeconomic status. These individual disparities then aggregate at the school level, leading to income-based segregation. Ultimately, this meso-level segregation culminates in a macro-level pattern across the urban space, represented by the geographical distribution of educational resources.
This study investigates the educational inequality from three aspects. First, it analyzes school commuting inequality among students from different socioeconomic statuses and between schools of varying quality, examining differences in time and distance costs and whether privileged families are better positioned to overcome spatial (e.g., purchasing school district housing) and time (e.g., reducing commuting time) barriers. Second, this study explores income-based income segregation segregation in schools, assessing whether high-quality schools are dominated by privileged groups, whether low-income families are concentrated in lower-quality schools, or whether students from varying income levels are more evenly distributed, reducing segregation. Third, schools are classified based on school quality, student composition, and levels of social segregation, and their geographic distribution is mapped. This study examines the gaps in educational resources access and student enrollment patterns between established urban centers and newly expanded suburbs, providing insights into whether urban spatial-educational expansion alleviates or exacerbates inequalities in access to quality education.
These three interrelated analyses provide a spatial perspective on unequal access to schooling, considering household-level ability to overcome barriers, school-level student composition and segregation, and urban-level uneven distribution of educational resources. In particular, the city-level analysis examines gaps in educational resource access and student enrollment patterns between established urban centers and newly expanded suburbs, clarifying whether urban spatial-educational expansion alleviates or exacerbates inequalities in access to quality education. This study thus makes two key contributions. First, it introduces a big data methodology that overcomes pervasive data limitations in the Global South, enabling more precise analyses of educational equity. Second, it provides empirical evidence on school commuting disparities, educational segregation, and unequal access to educational resources in China’s metropolitan areas, thus validating the theory of Effectively Maintained Inequality in the context of rapidly urbanizing Global South cities.
Literature review
Numerous studies have examined educational inequality across multiple dimensions, from the micro-level of the household to the meso-level of the school and the macro-level of urban space. At the household level, the most tangible manifestation of this inequality—school commuting inequality—remains largely overlooked. This phenomenon refers to disparities in commuting burdens that families of varying socioeconomic statuses experience due to their school choices (Khabazi and Nilsson, 2021). Despite extensive research on work-related commuting equity (McLafferty and Preston, 2019), school commuting is conspicuously underexplored. Studies on school spatial equity often employ static metrics like school spatial accessibility (Lotfata et al., 2023; Moreno-Monroy et al., 2018), relying on simulated assignments and optimized layouts to minimize travel distance or maximize coverage (Pizzol et al., 2021). Other research explores the transportation network’s impact on students’ active school travel (Schön et al., 2024). Some studies proxy socioeconomic groups through housing types (Xu et al., 2018), but they share a core limitation: commuting distances are predominantly modeled, making it difficult to acquire large-scale data on real-world residence-school relationship. Few studies have considered transport costs using surveys or statistics, but they lack large-scale data (Dustan and Ngo, 2018). To summarize, while commuting distance modeling is well-developed, data limitations constitute the central issue in examining student commuting inequality.
Thus, existing studies have not sufficiently examined disparities in school commuting patterns across socioeconomic groups. This omission can obscure deeper structural problems: income-based school segregation due to unequal ability to choose schools. Segregation refers to the concentration of similar income groups within particular schools, whereby high-income students cluster in prestigious institutions, while low-income and minority students are relegated to lower-quality schools, constraining social mobility (Poupeau et al., 2007; Schmidt et al., 2015). Through market mechanisms such as purchasing “school district homes,” affluent families secure privileged access to high-quality schools and displace poorer households, producing “school district gentrification” that converts economic inequality into spatial and educational inequality and entrenches social segregation (Pearman and Swain, 2017; Perry et al., 2024). In Western contexts, income-based school segregation has been extensively examined using detailed student census microdata, school catchment information, and socioeconomic proxies (Hochschild, 2003; Owens et al., 2016). For example, Bernelius and Vaattovaara (2016) show how middle-class school choice intensifies segregation in Helsinki. However, existing datasets often lack consistent indicators of educational stage and school quality, and most analyses remain at the city or neighborhood scale. In China, segregation is further shaped by specific institutions. The former “key school” system (refers to a government-recognized and historically privileged set of public schools that received preferential resources and admissions advantages) hindered intergenerational mobility (Wu, 2012), while contemporary educational marketization and rapid urbanization have widened income gaps (Yao and Jiang, 2021; Zhang, 2023, 2024b). Moreover, household income indirectly affects the opportunity to enter high-quality schools by influencing the eligibility for access to high-quality school districts in the proximity-based enrollment system (mainly reflected in the ability to purchase school district housing), thereby exacerbating educational inequality. Migrant children face dual exclusion from the hukou system and school district housing, which confines them to inferior schools (Xu and Wu, 2022; Zhang and Chen, 2018). (Hukou: China’s official household registration system tying public school admission to legal domicile, not actual residence.) Although prior work has emphasized the importance of migrant children’s social integration (Ma et al., 2018; Mendoza, 2018), the degree of income-based segregation across school types and cities, and the lack of comparable metrics, remain critical research gaps.
Theoretical and empirical studies suggest that the spatial imbalance in the distribution of educational resources at the urban level is the root cause of both commuting inequality and income-based school segregation. The Maximally Maintained Inequality (MMI) theory posits that educational expansion benefits lower strata only after privileged classes are saturated; increased educational quantity does not guarantee equal educational opportunities (Custers et al., 2023; Manzano et al., 2024). The Effectively Maintained Inequality (EMI) theory adds that inequality persists through quality. Even as overall educational opportunities equalize, privileged classes use their resources to access higher-quality education, maintaining their advantage (Iannelli and Paterson, 2007; Kim and Kim, 2024). However, current socioeconomic research often lacks a spatial perspective. While studies analyze the impacts of enrollment policies, educational marketization, and educational tracking (Van de Werfhorst, 2021; Wen et al., 2018; Wu, 2010), they frequently fail to map the uneven geographical distribution that underpins these inequalities. Thus, policies designed to address educational inequality often fail (Liu, 2021; Wu, 2020), as privileged classes are able to continuously leverage resources and exploit policy loopholes as long as fundamental disparities in school quality and access persist. This highlights an urgent need for a comprehensive, large-scale dataset detailing actual residence-school relationship and integrating crucial attributes of family income and school quality.
Data and methods
Study area
This study focuses on four Chinese megacities: Beijing, Shanghai, Guangzhou, and Tianjin, chosen for their representativeness in addressing educational inequality (Figure 1). These cities collectively serve over 6.8 million students and face significant imbalances between the supply and demand of school places, making them ideal for investigating educational inequity in China. Map of study area.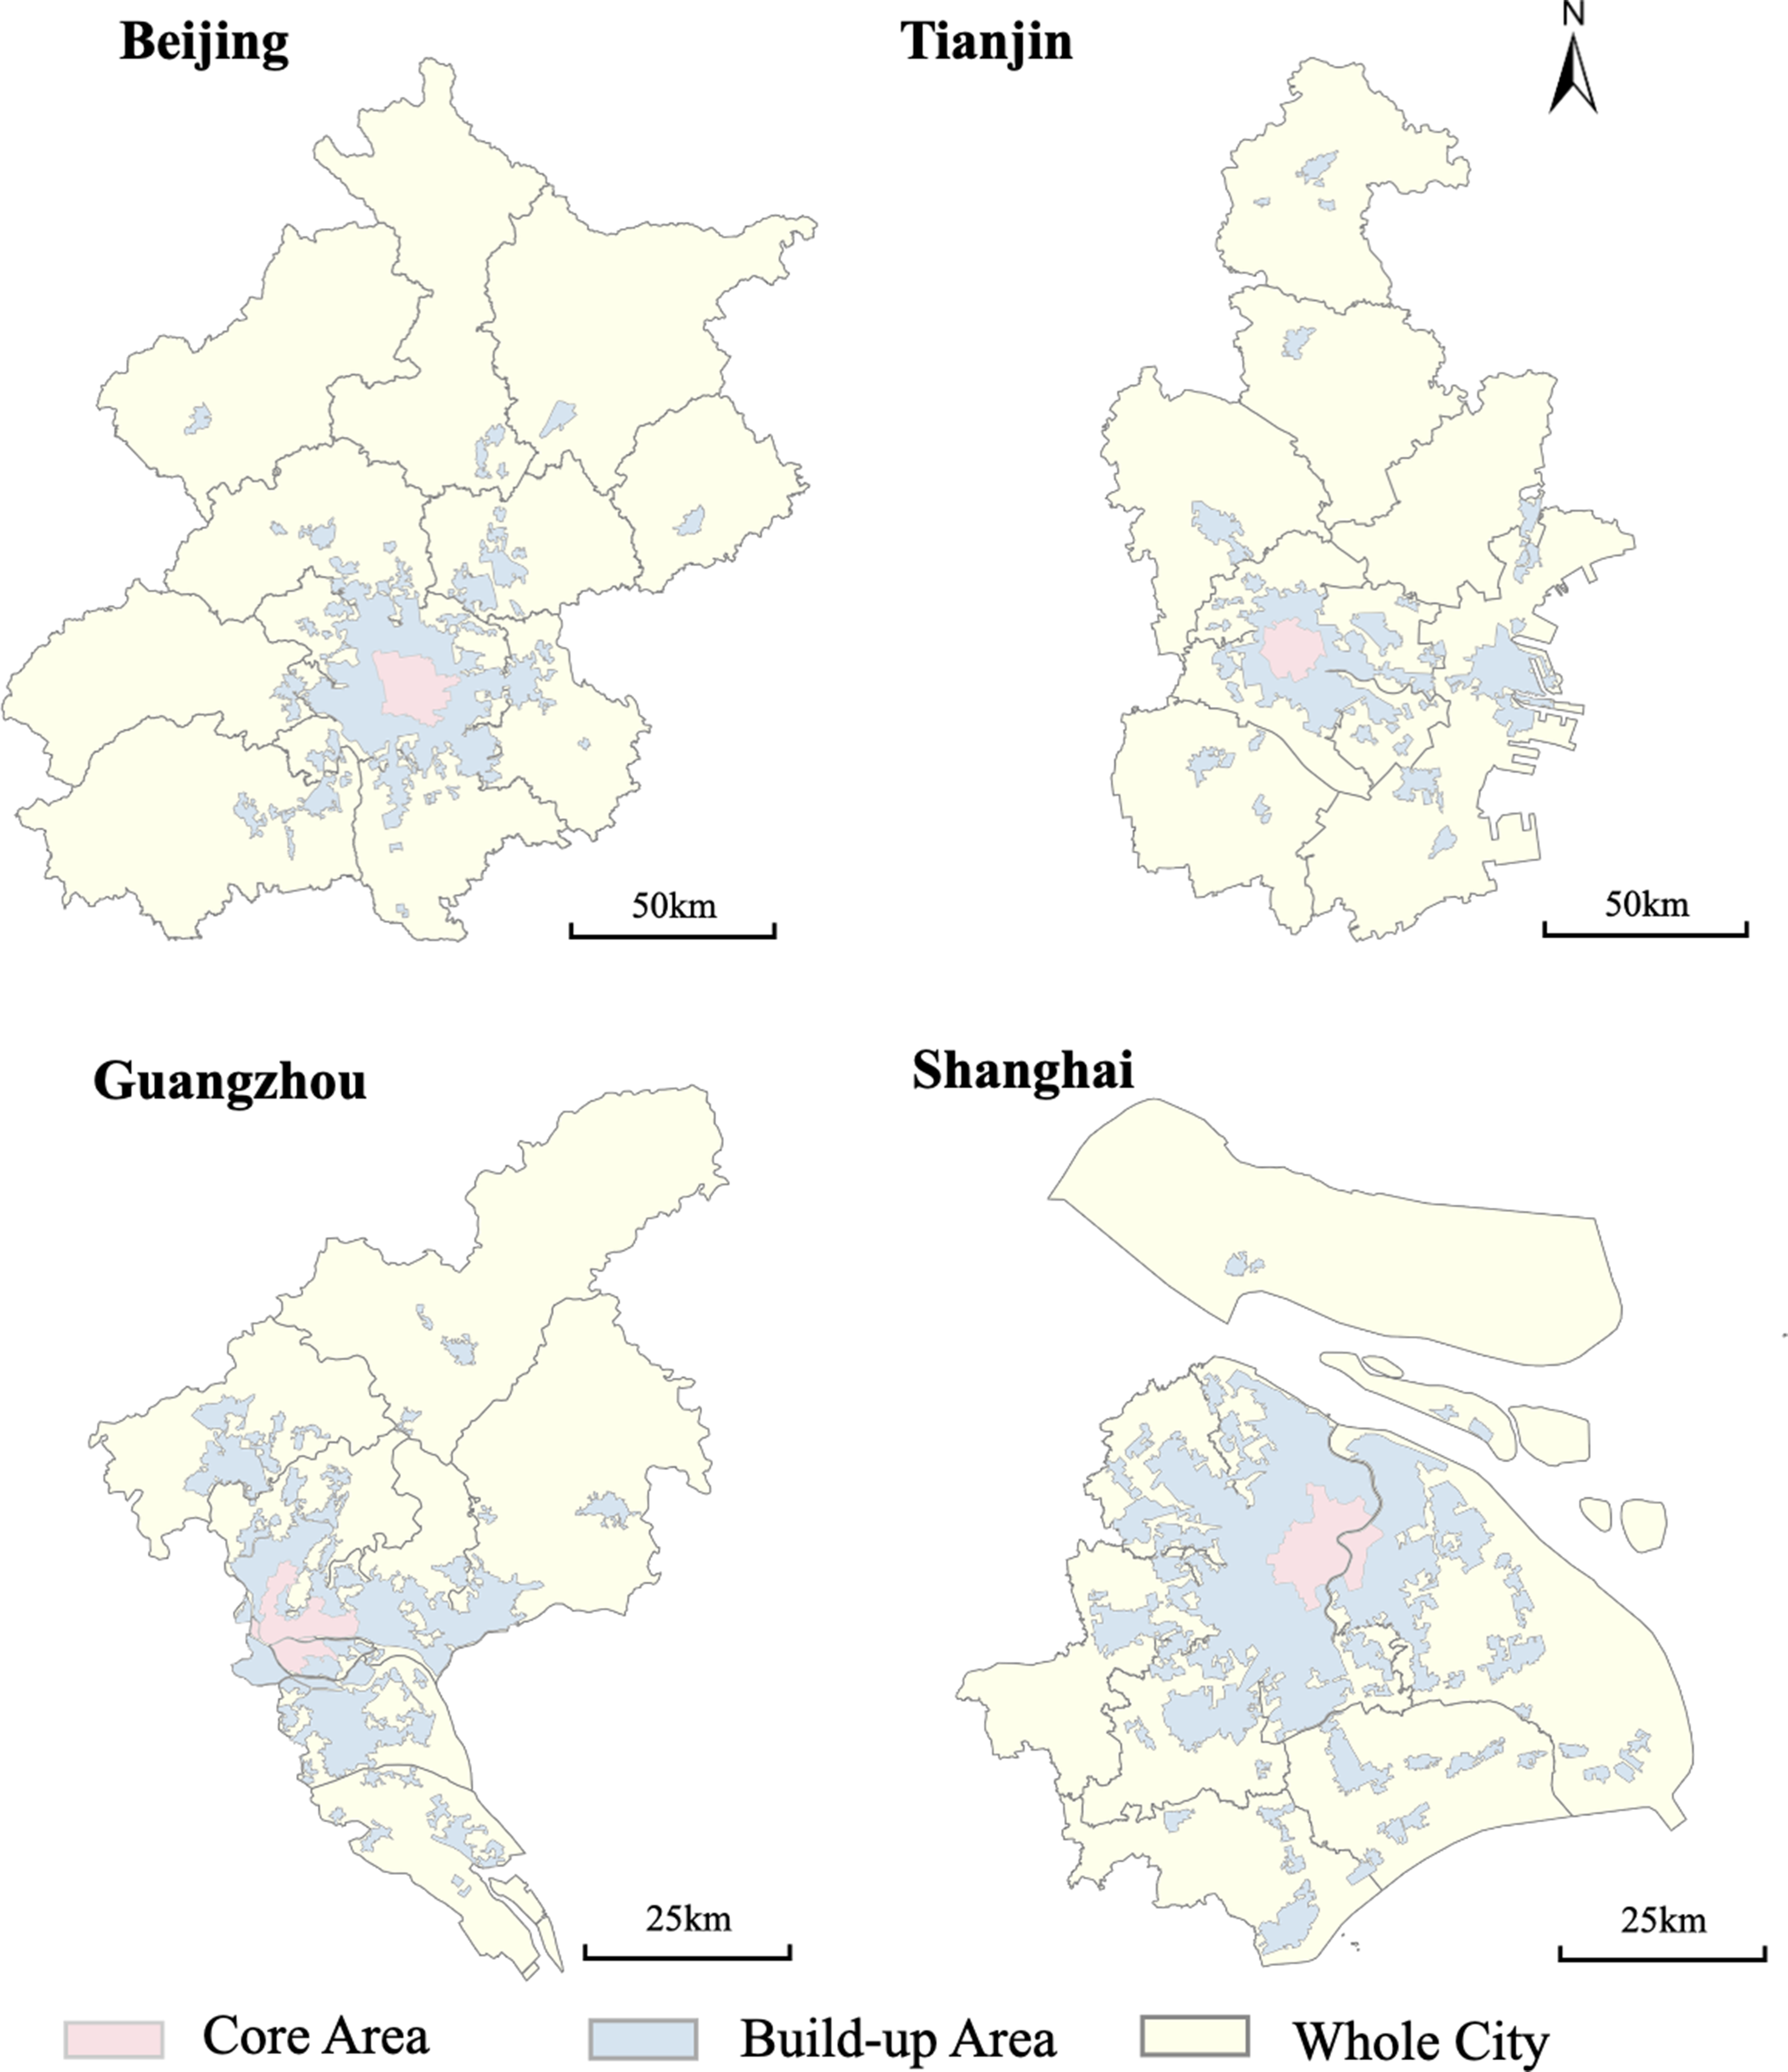
Rapid urbanization in the past decade has increased migrant populations (e.g., Guangzhou’s migrant population constitutes 43.4%), exacerbating income disparities and fostering income-based school segregation. Additionally, these cities employ distinct education policies, with basic education primarily based on “proximity-based enrollment” linking household income to access, while senior high school admissions rely on academic merit, mitigating income’s influence. All four cities impose restrictions on migrant children’s educational access, placing them at a disadvantage.
Data sources
Mobile phone signaling data
Mobile phone signaling data from Beijing, Shanghai, Guangzhou, and Tianjin, collected from November 1 to 30, 2019, were provided by China Unicom Smart Footprint. As one of the three major telecommunications operators in China, the latest public operating data of China Unicom shows that it has 356 million mobile users, ranking third among the three national operators in terms of user scale. The data have a spatial resolution of 250 × 250 m grids, including anonymized daily and monthly stay records, with durations and locations identified by user IDs for privacy protection.
School quality and classification attribute data
School quality and classification data were collected from government and official school websites, supplemented by parent reputation rankings. After rigorous validation, the dataset achieved over 95% accuracy (details on the validation are available in the Supplemental Materials). Schools in this study are categorized into four quality levels: top, good, general, and low. The specific criteria for this classification vary by educational stage: primary schools are classified based on parent reputation rankings; junior high schools are categorized by their admission rates to top senior high schools; and senior high schools are classified according to their admission scores from the senior high school entrance examination.
House price data-used as a proxy variable for socioeconomic status
Given the difficulty of directly acquiring income data, regional housing prices were used as a proxy for socioeconomic status (Cui et al., 2019; Nilforoshan et al., 2023). We scraped 1,096,342 transaction records from a major housing platform (https://hrb.lianjia.com/) in 2019 and used average price per unit area (housing price per square meter) as a proxy variable for socioeconomic status. Then we applied Kriging interpolation to spatialize the data. Residential housing prices were used to categorize family income into high (H), middle-high (MH), middle-low (ML), and low income (L) quartiles.
Identifying students and the residence-school relationship
This study employed an innovative scheme using mobile phone signaling data to map student enrollment to their family residences. Since raw mobile phone data do not directly reveal user identity or travel purpose, our method integrated user attributes, stay patterns (start times and durations), and school Area of Interest (AOI) vector boundaries to differentiate school visitors. The detailed workflow is outlined in the Supplemental Material Figure S1.
First, AOI boundaries for 6770 schools across Beijing, Shanghai, Guangzhou, and Tianjin were obtained from Gaode Maps (Amap), a high-resolution digital mapping platform. To accommodate variations in school sizes and improve detection precision, we applied an adaptive buffering method, ensuring each school’s buffered area covered at least 62,500 m2 (250 m × 250 m grid).
Next, we identified 3,165,513 mobile phone users as potential school visitors, defined as those visiting school areas over 8 days per month for more than 8 h between 08:00 and 18:00 on weekdays. This filter excluded transient individuals (e.g., delivery or maintenance personnel). To distinguish students from teachers, we used mobile app data from China Unicom to exclude users of teacher-specific applications (e.g., “Classroom Optimization Master,” “Teacher Training,” “Teacher Recruitment”).
For each identified student, their “school grids” was defined by the grid containing the centroid of their assigned school’s AOI. We then distinguished between boarding and day students. Boarding students, typically residing in school dormitories on weekdays, were identified by examining whether their longest-staying grid during weekday nights (0:00–8:00) fell within the school’s buffer boundaries. Their “home address grids” was then assigned based on their longest-staying grid during weekend nights. Conversely, day students, characterized by daily commutes, had their home address grid identified as their longest-staying grid during weekday nights.
This process generated a dataset containing student home address grids, school grids, and visitor type labels, successfully identifying 2,259,097 students, representing 32.94% of the total student population across the four cities.
After identifying the residential locations and school locations of students, this study mapped the residence-school OD (Origin-Destination) network, with students’ residential addresses as origins and school addresses as destinations, to clearly visualize the actual spatial pairing relationships between the two. Based on the school grid IDs and home address grid IDs, we aggregated all commuting paths with identical origins and destinations into a single path, and the thickness of the lines was used to represent the number of students traveling along each path.
Measuring school segregation using multiple indexes
This study employs three indices to assess income-based school segregation: the Theil index, the Exposure index, and the Gini coefficient. The calculation methods of the indices are provided in the Supplementary materials. The Theil index measures overall segregation both between and within schools, based on information entropy. A higher Theil’s H value indicates greater segregation, and its decomposition allows for the analysis of between-school (
Mapping school types and their uneven geographies using cluster analysis
To map school types and their uneven geographies, this study conducted cluster analysis using three key school attributes: income-based segregation, school quality, and the proportion of student families at each income level.
The clustering indicators are derived from the calculation results in Sections 3.3 and 3.4, aiming to classify schools typologically and reflect the inequality in the spatial distribution of educational resources.
Given the mixed data types, we applied the K-prototypes clustering algorithm, an extension of K-means, designed for clustering both numerical and categorical variables simultaneously (Ahmad and Dey, 2007). The algorithm measures numerical data with Euclidean distance and categorical data with a matching dissimilarity metric during clustering.

After clustering, Kernel Density Estimation (KDE) was used to convert discrete school data into continuous density surfaces, helping identify hotspot areas for each school type. The optimal bandwidth (h = 2.5 km) for the KDE was determined via leave-one-out cross-validation (LOOCV), maximizing the log-likelihood function within a range of 0.1–10 km.
Results
School commuting inequality
Analysis of student residence-school Origin-Destination (OD) flow maps reveals a strong relationship between school quality and commuting patterns (Figure 2). Analysis of student commute origin-destination (OD) Flows. a–d. The actual student commutes OD flows for four different school qualities in Beijing, Shanghai, Guangzhou, and Tianjin. The thickness of the OD flow lines represents the traffic volume.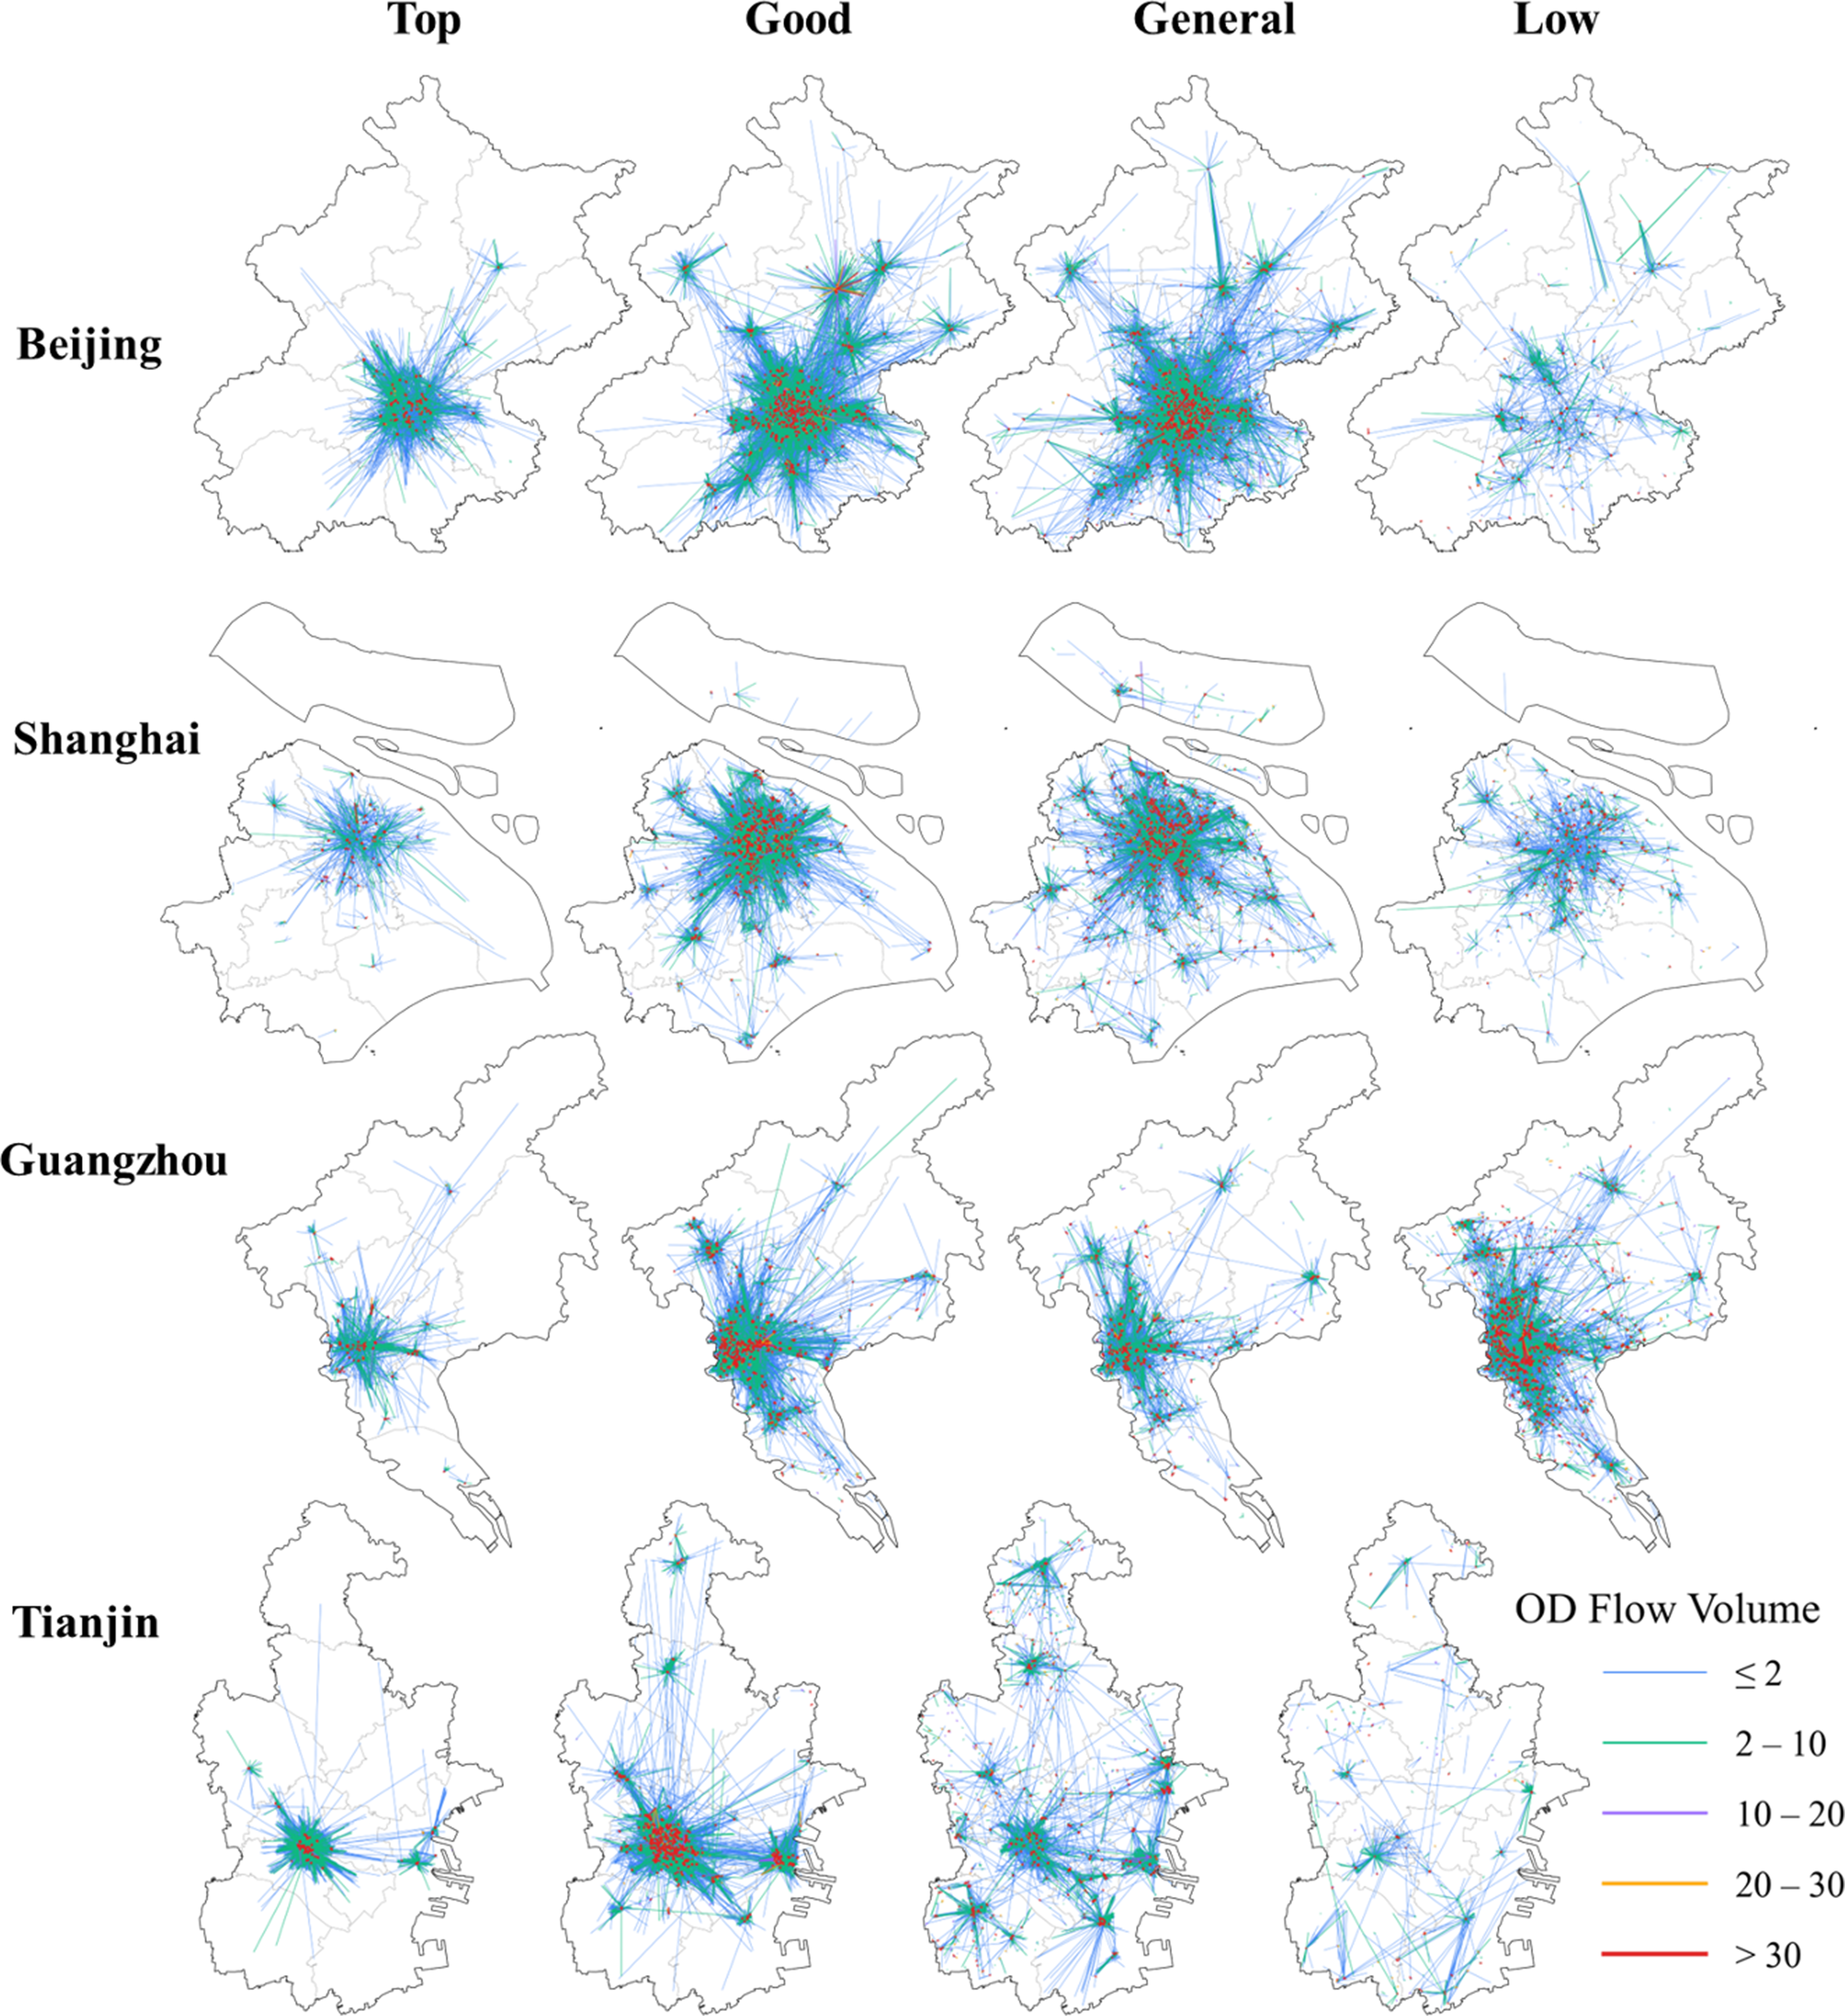
Analyses of the actual student residence–school OD flows (Figure 2) reveal clear disparities in catchment areas across school quality tiers and cities. In Beijing, for example, Top and Good quality schools show dense, centralized OD flow clusters concentrated in the urban core, with lines extending across multiple districts, indicating broader catchment areas that draw students from a wide urban range. In contrast, Low quality schools exhibit sparser, more localized flows, with commuting centers largely confined to individual districts.
Across all four cities, the volume of OD flows (represented by line thickness) aligns with proximity-based enrollment patterns: shorter commutes correspond to thicker, more concentrated lines, while longer-distance trips are fewer and more dispersed. The four cities follow a similar logic, with higher-quality schools (e.g., Top/Good tiers) displaying stronger central aggregation and wider spatial reach, whereas lower-quality schools (General/Low tiers) serve more geographically constrained student populations. These patterns highlight how school quality shapes the geography of student commuting, with high-quality institutions acting as regional commuting hubs and low-quality schools operating as local service providers.
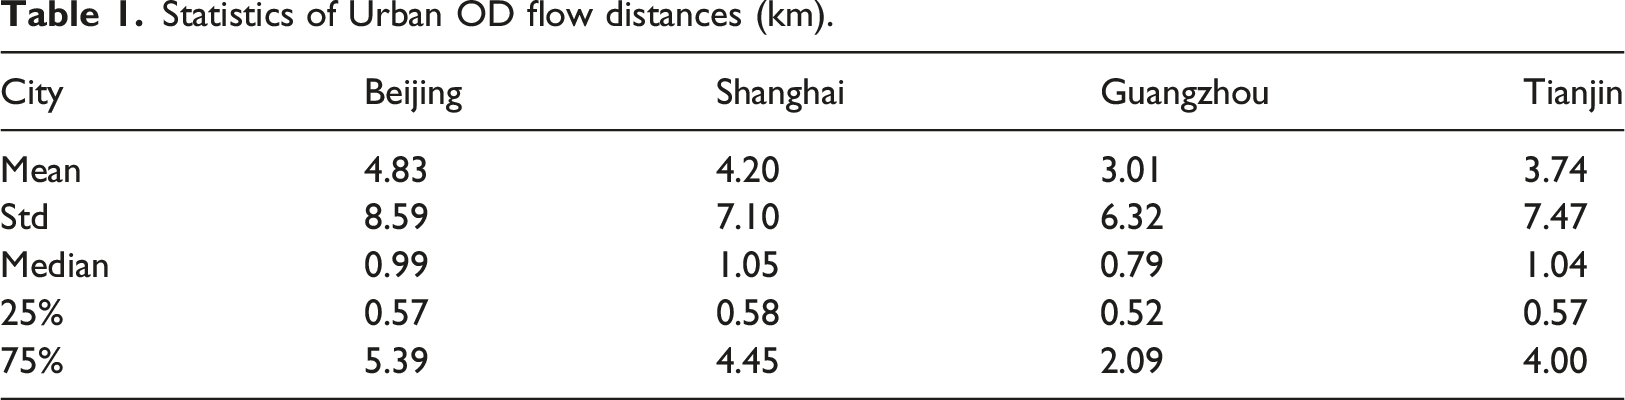
A significant positive correlation (p < 0.001) was found between students’ actual commute distances and both school quality and educational stage. Inter-group difference tests further revealed significant variations in commute distances (p < 0.05). In Beijing, median commute distances increased with school quality, with students at top-tier schools traveling farther than those at low-quality schools (1.12 km vs 0.93 km) (Figure 3(a)). Commute distances also increased with educational stage, from primary schools (0.96 km) to senior high schools (1.03 km) (Figure 3(b)). While high-quality educational resources attract students from across the socioeconomic spectrum, families’ capacity to overcome spatio-temporal barriers to access these resources varied significantly by income level. Low-income students faced longer commutes (median 1.99 km) than high-income students (median 0.76 km) (Figure 3(d)), suggesting that affluent families use economic advantages, such as purchasing “school district housing,” to live closer to desirable schools, while lower-income families endure longer commutes for better educational opportunities. Commuting inequality also varied across megacities, with Beijing having the longest average commute distance (4.83 km) and Guangzhou the shortest (3.01 km) (Table 1). Moreover, when considering extreme commutes exceeding a 3 km threshold, Beijing had the highest proportion (32.39%), compared with Guangzhou’s lowest proportion (20.86%) (Figure 3(c)). Analysis of student commute distances. (a) & (b) present box plots of commuting distances under different school qualities and educational stages. (c) Shows the proportion of extreme commutes at various distance thresholds across the four cities. (d) is a box plot of commuting distances for different income groups. Statistics of Urban OD flow distances (km).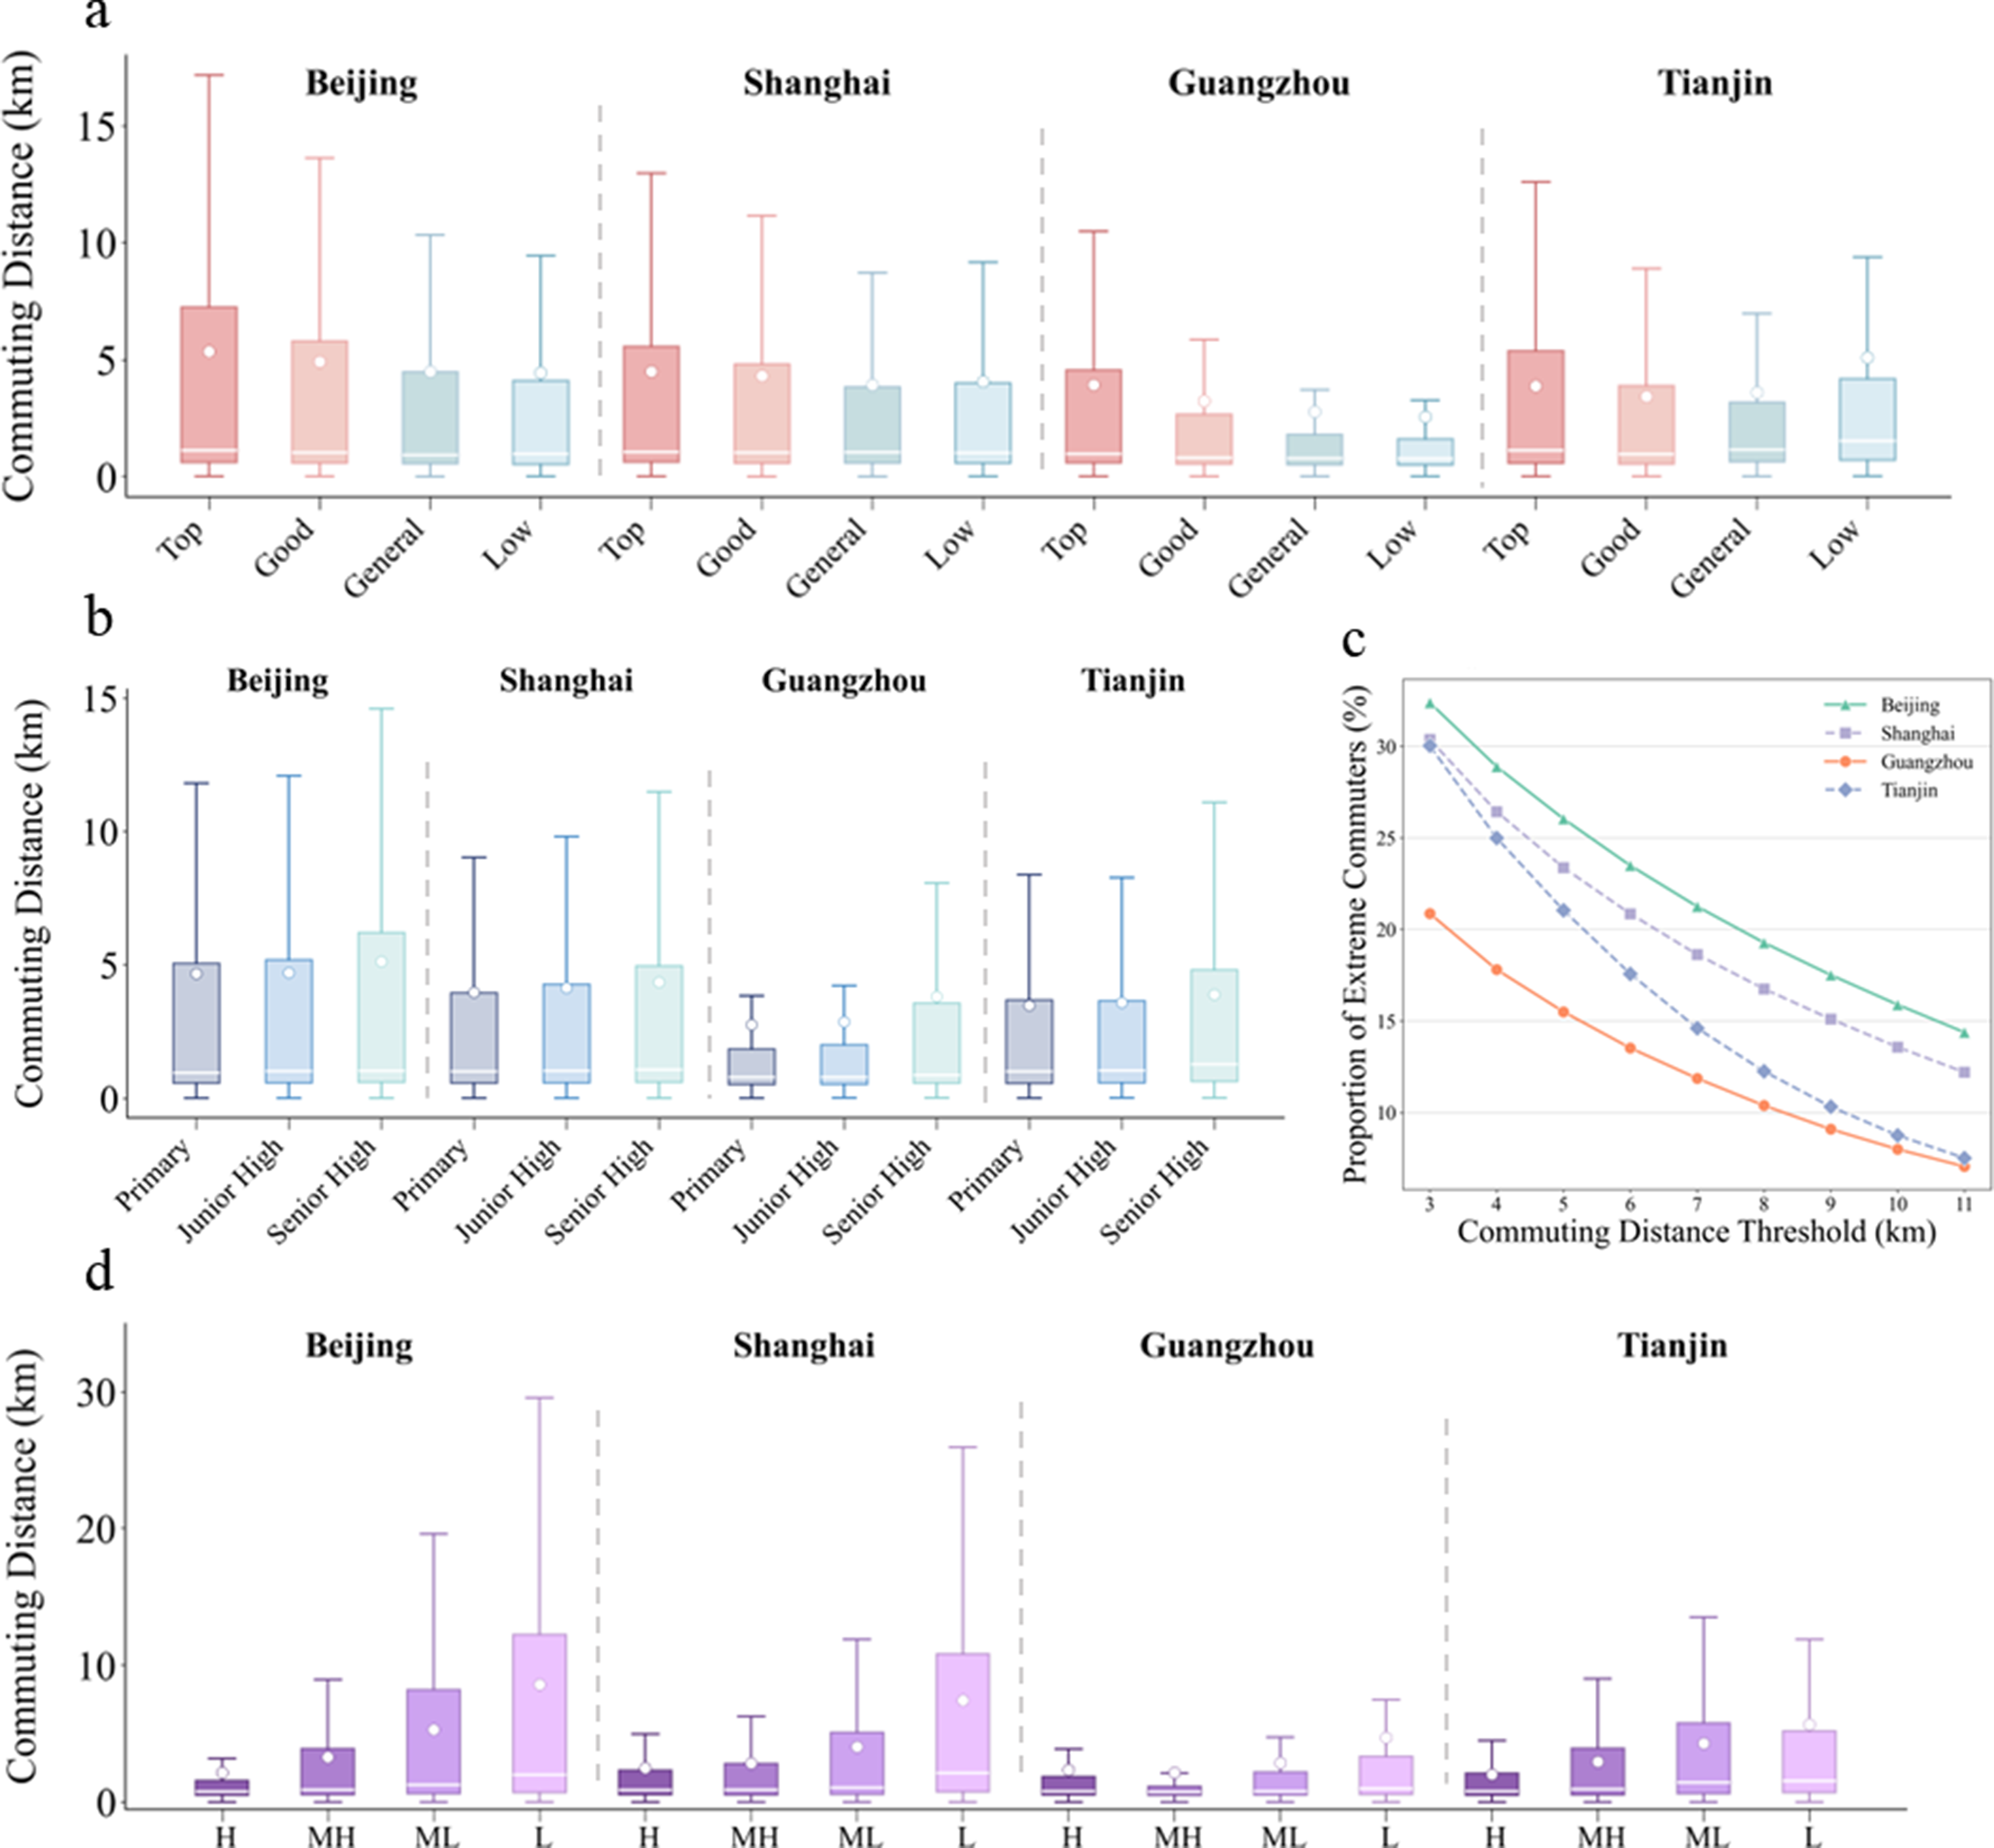
Income-based school segregation
The four megacities show significant variations in income-based school segregation, with Theil’s H index ranking as follows: Guangzhou (0.571) > Tianjin (0.526) > Beijing (0.515) > Shanghai (0.469). The integration of low-income students ( Income-based Social Segregation in Four Cities. (a) School segregation by educational stage group. (b) School segregation by school quality group. The left x-axis represents the exposure index of low-income students to high-income students, and the right x-axis represents the decomposed form of the Theil’s H index.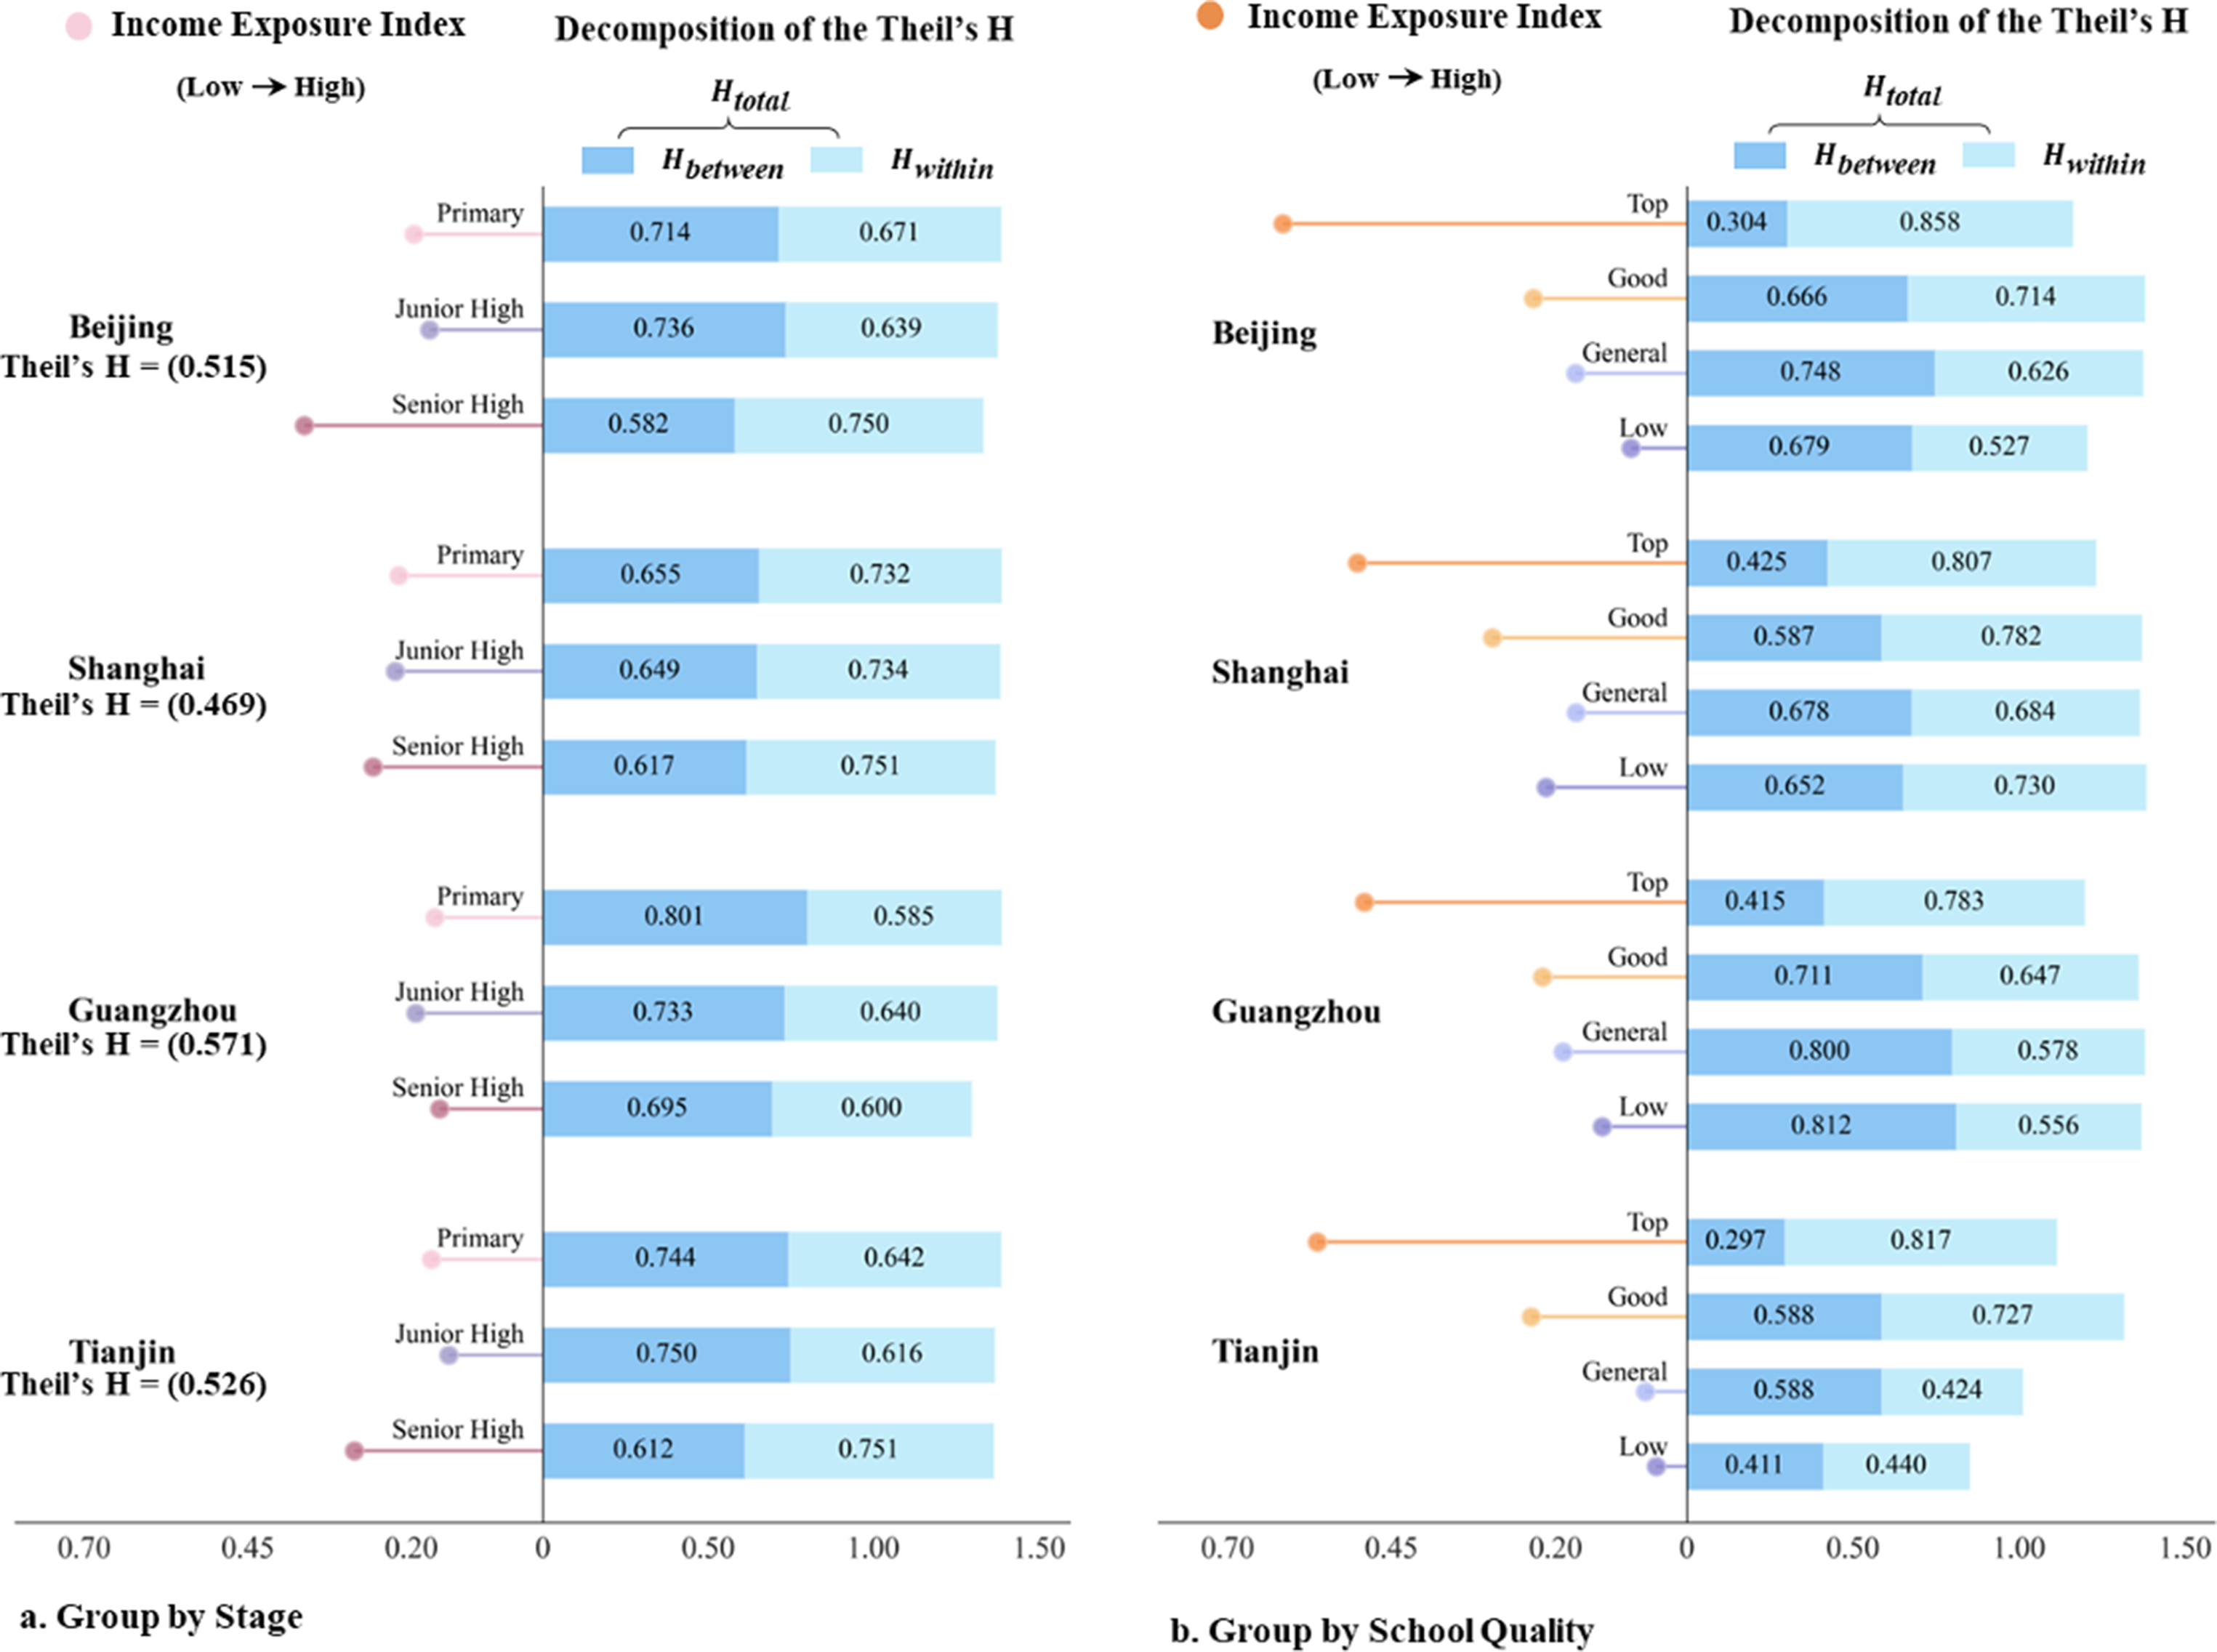
Higher segregation is observed in lower-quality schools, with top schools consistently having lower Theil’s H index and higher
Income-based school segregation solidifies early in education and decreases with advancing stages, with the transition from junior to senior high as a key inflection point. Primary schools show the highest Theil’s H index, similar to junior high, indicating greater income homogeneity in compulsory education, with limited impact from the primary-to-junior-high transition (Figure 4(a)). The relationship between segregation and educational equity requires further exploration.
5(a–d): Pri, JH, and SH are abbreviations for Primary, Junior High, and Senior High, respectively, representing the mean Gini coefficient for each school type. “All Qty” and “All stg” denote the mean values for all school quality and all educational stage indicators, respectively. 5(e): Depicts the histogram and kernel density distribution of intra-school Gini coefficients across different cities.
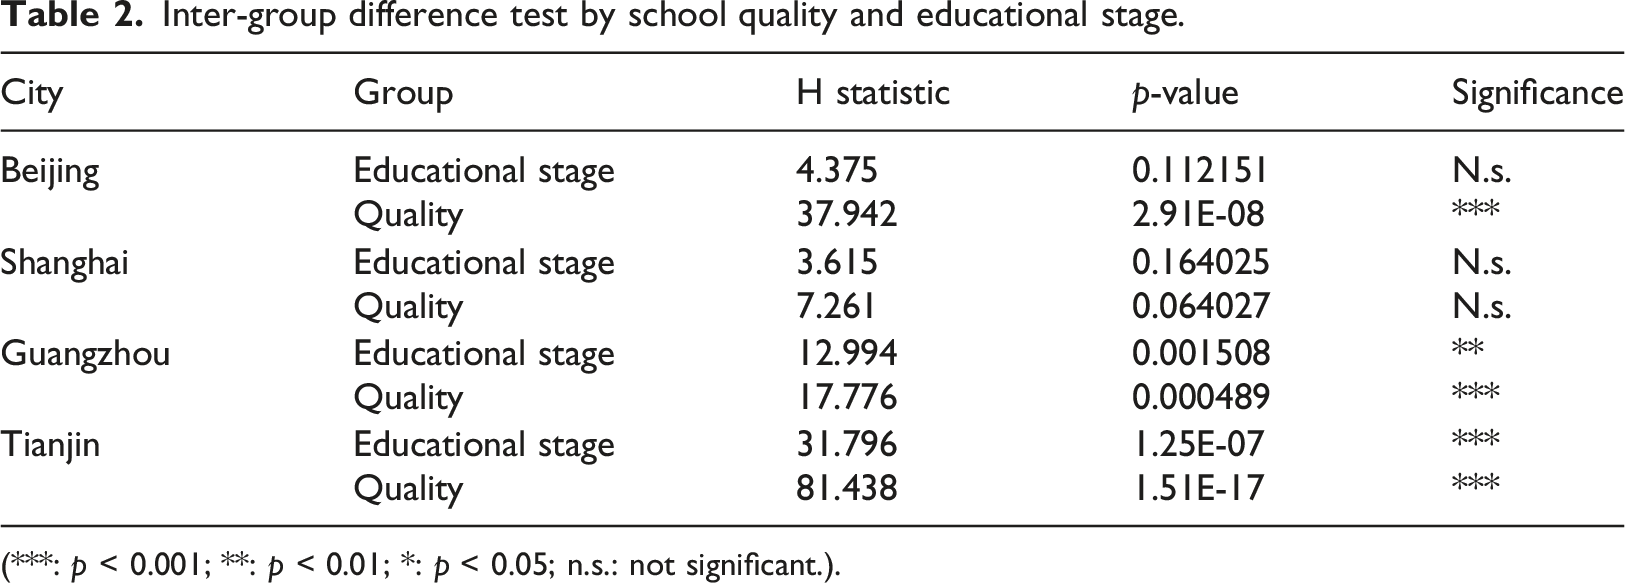
To explore income stratification within schools, we calculated the income Gini coefficient for each school, building on the analysis of school segregation by educational stage and quality (Figure 5). Heat maps reveal that intra-school income stratification increases with educational stage and school quality across the four cities (Figure 5(a)–(d)). Top-quality senior high schools show the highest income stratification, while low-quality primary schools show the least. This indicates that while top-quality and senior high schools may have lower inter-school segregation and higher-income mixing, income inequality and polarization within these institutions are particularly pronounced. Shanghai has the most equitable intra-school income distribution, with lower Gini coefficients and a narrow peak around 0.080 (Figure 5(e)). Tests confirm that school quality has a greater impact on intra-school income stratification than educational stage (Table 2). Intra-school income stratification across four cities by educational stage-school quality combinations. Inter-group difference test by school quality and educational stage. (***: p < 0.001; **: p < 0.01; *: p < 0.05; n.s.: not significant.).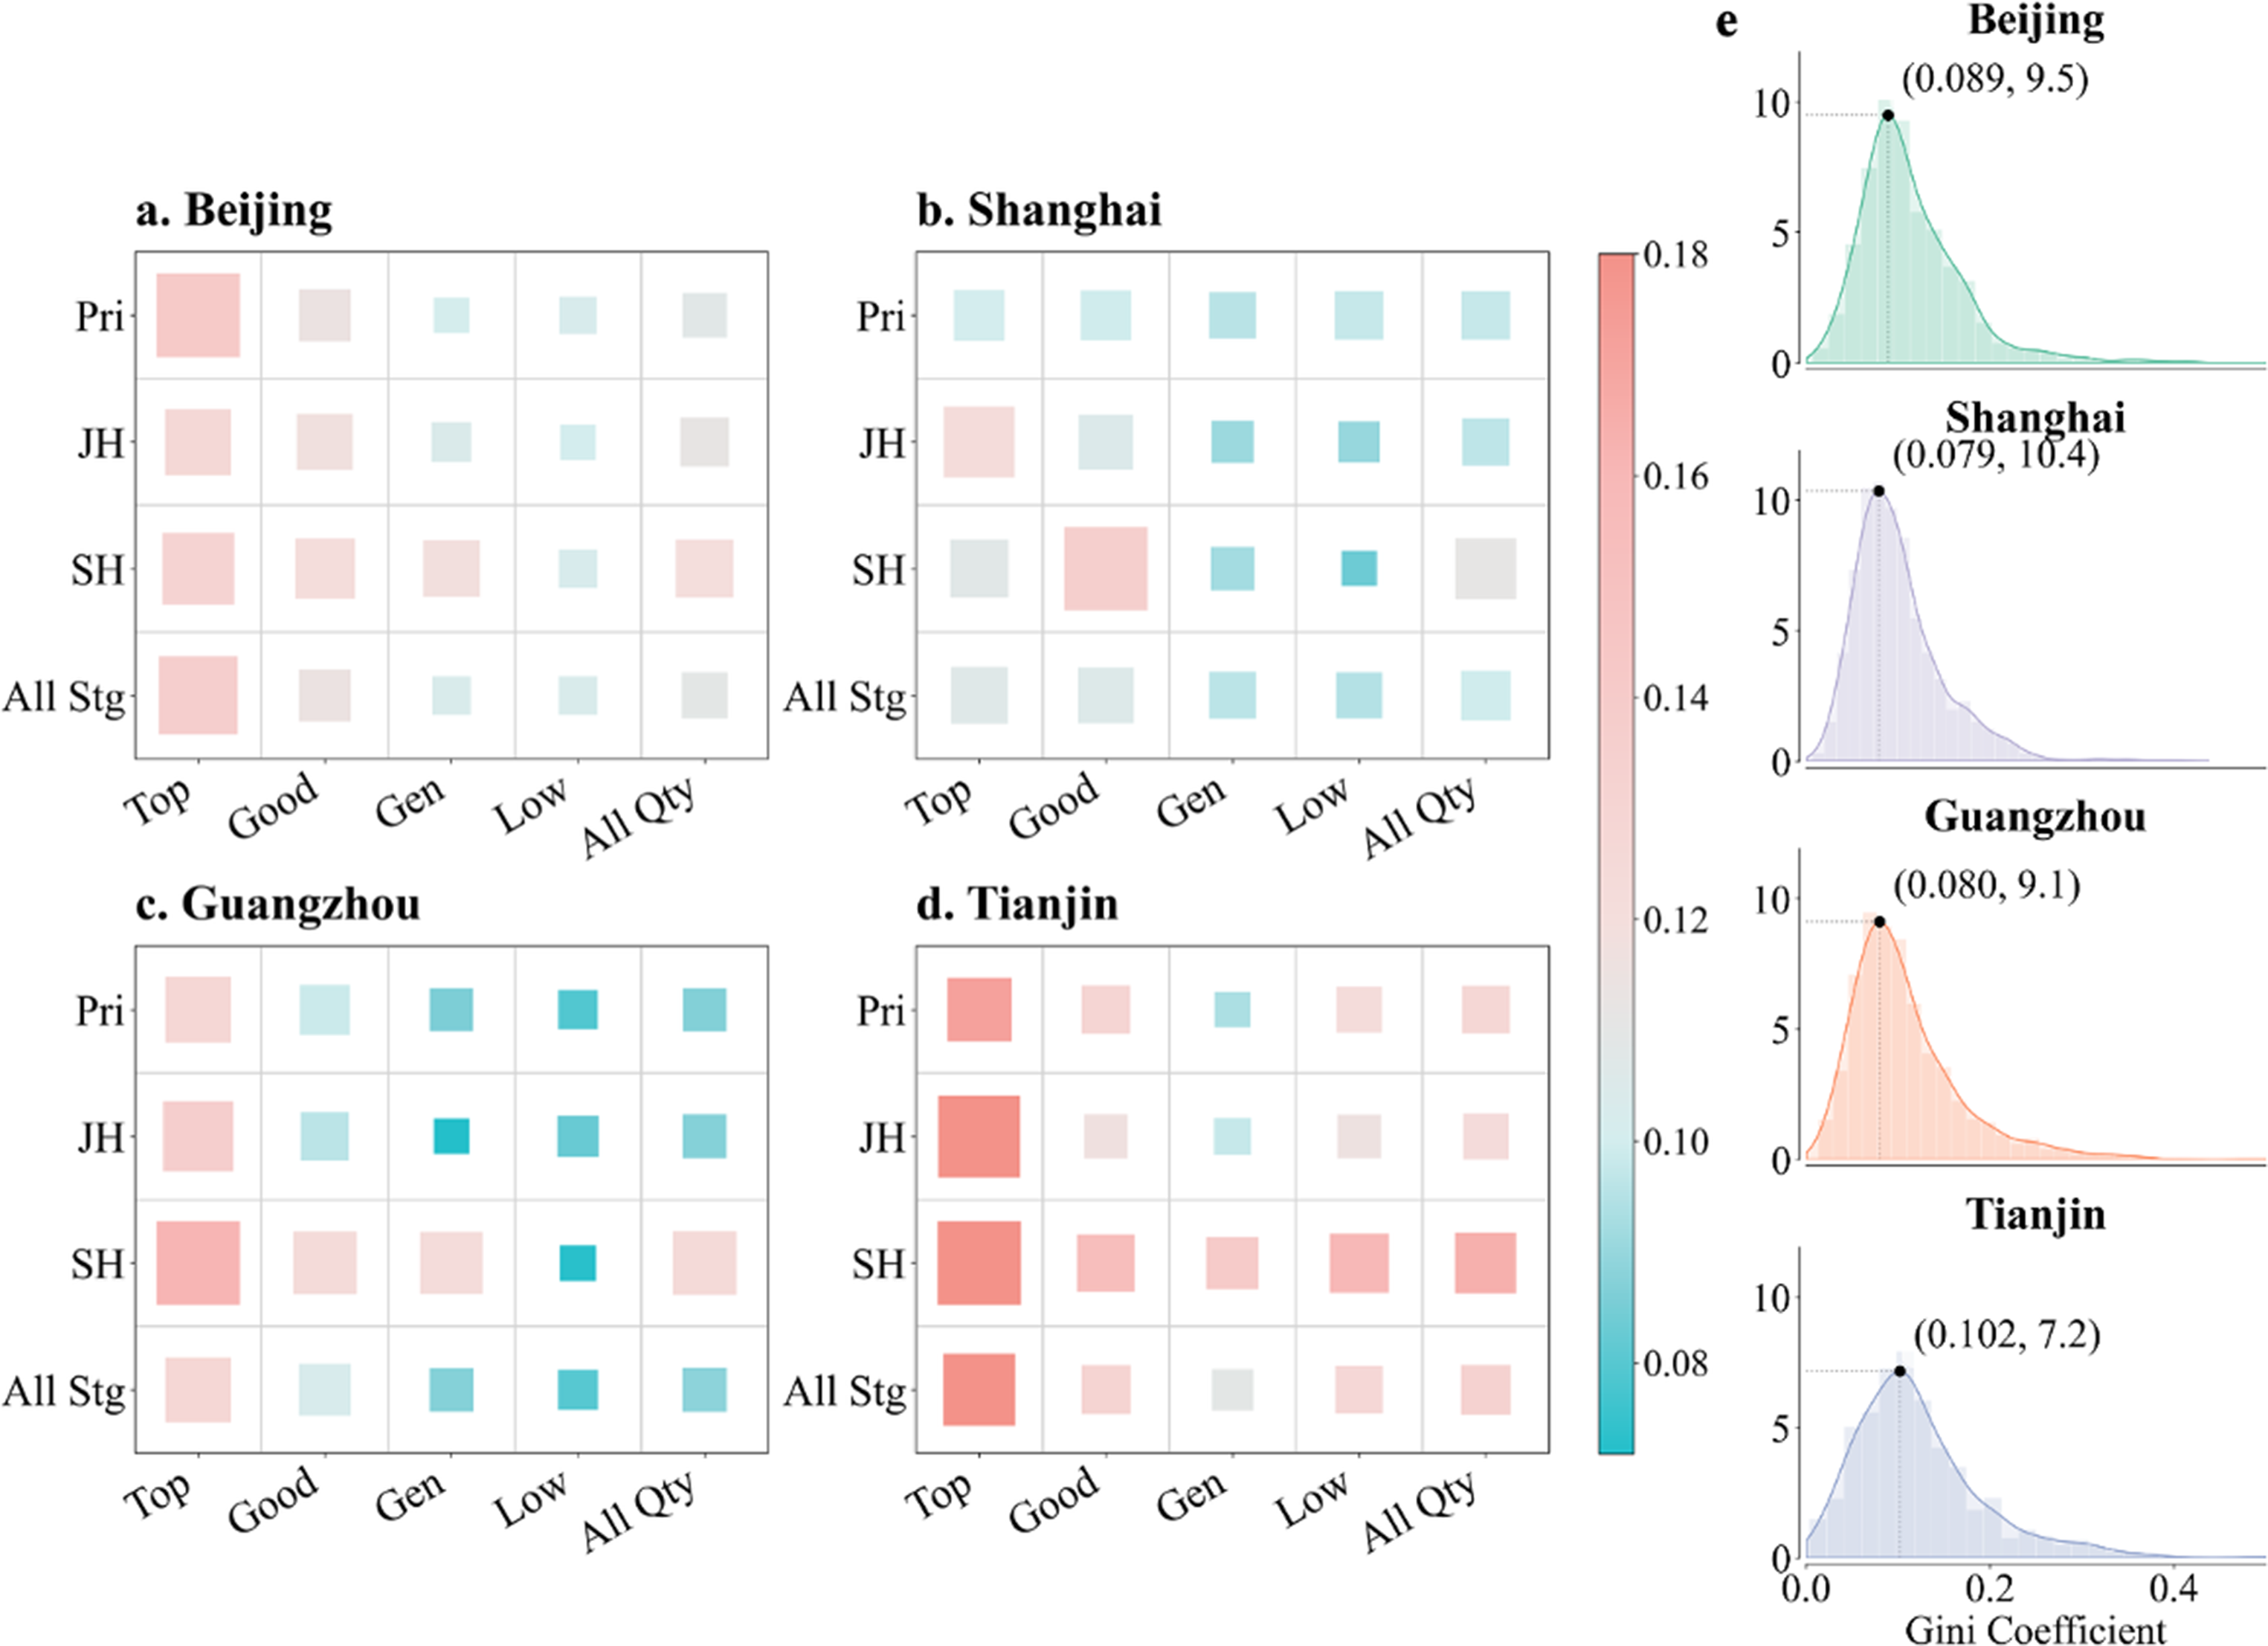
School types and their uneven geographies
Based on the statistical characteristics of the clustering results (detailed in Supplemental material Figure S3 & S4, Table S5), schools were categorized into four types: TL schools (high quality, low segregation, predominantly high-income families), MH schools (medium-to-high quality, moderate segregation, medium-to-high income families), ML schools (medium-to-low quality, moderate segregation, medium-to-low income families), and TL schools (low quality, high segregation, predominantly low-income families).
TH, MH, ML, and TL are four school typologies from cluster analysis based on multiple school-related indicators. The legend in each subplot is the kernel density estimate (KDE) value, which quantifies the spatial density of the corresponding school type and indicates that higher values mean a more concentrated distribution.
The bars show the aggregated segregation and exposure indices for schools within each spatial zone. The bars for the Central areas represent schools located within the central urban area; the bars for the Inner suburbs represent schools located within the central urban area and adjacent inner suburban areas; and the bars for the Outer suburbs represent all schools across the entire city, including the central areas, inner suburbs, and outer suburban areas. The lines indicate the spatial trend of each index from the urban core to the periphery.
The spatial distribution of these distinct educational resource types exhibits clear polarization, forming a pronounced core–periphery pattern. TH schools are concentrated in central urban areas, while MH and ML schools extend outward from the core but remain predominantly populated by medium- to high-income families. TL schools have increased significantly with urban development, covering over 50% of the city and clustering particularly in peripheral areas (Figure 6). Spatial distribution patterns of different school types.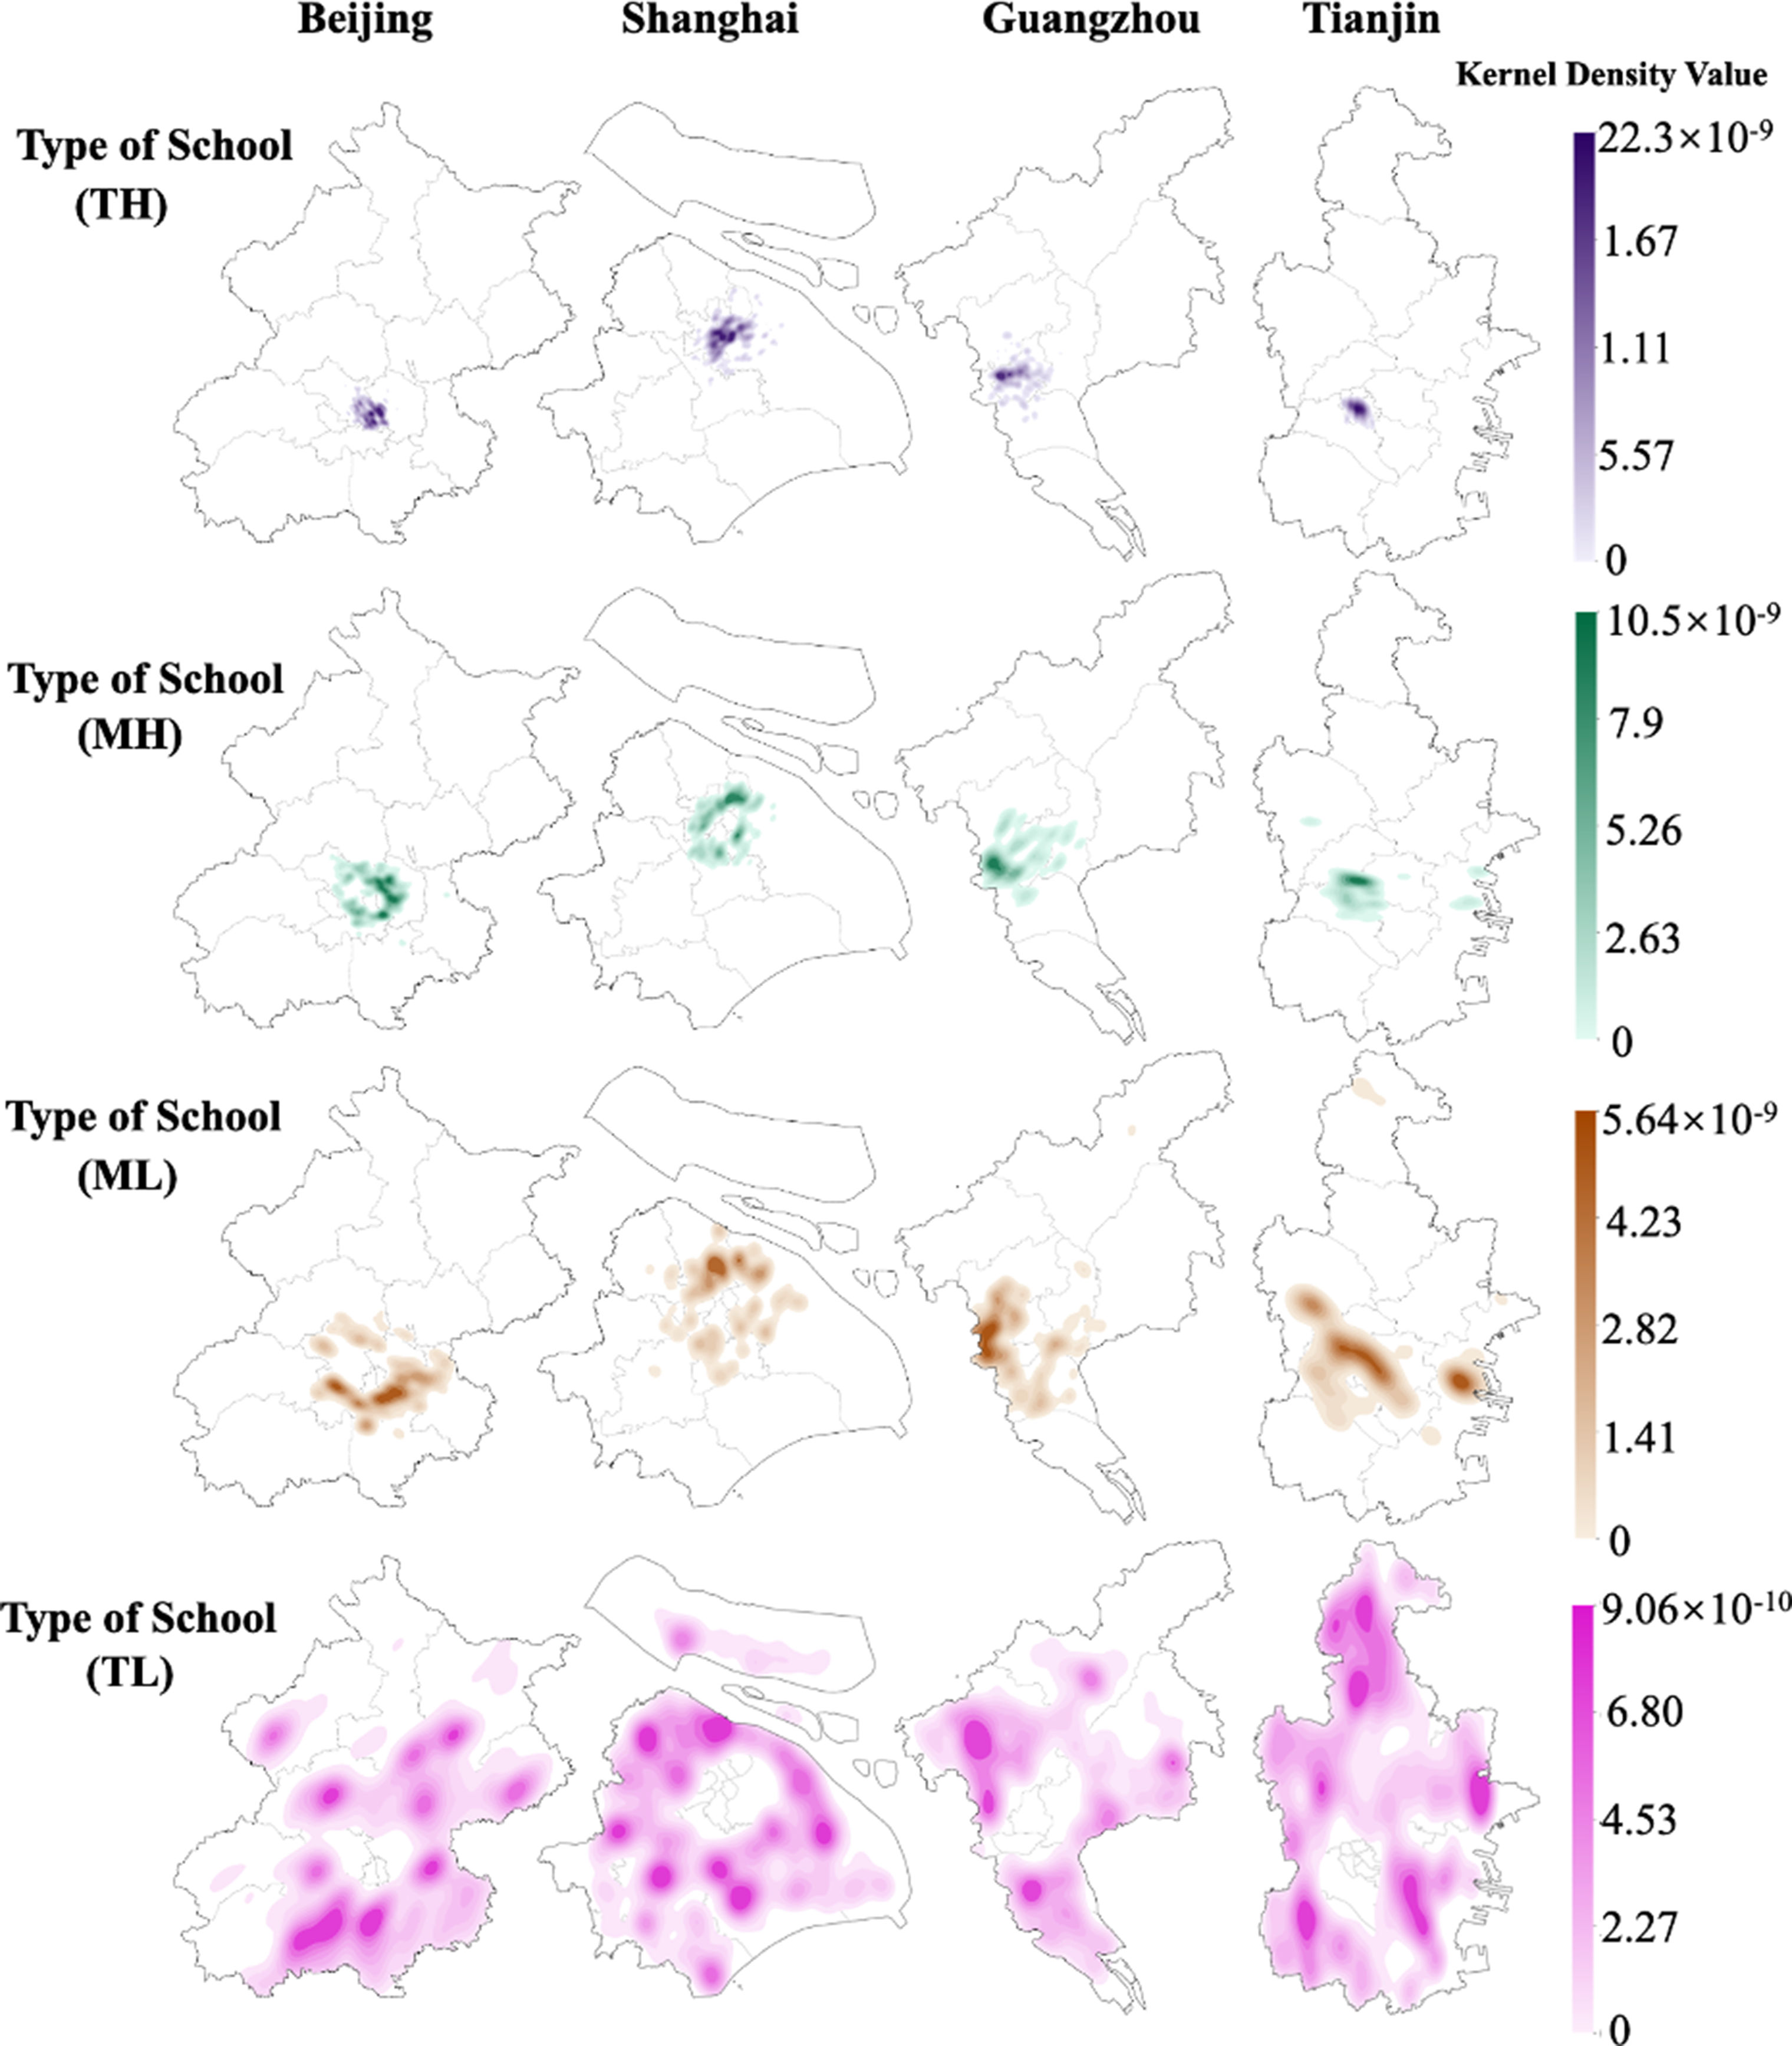
A pronounced core–periphery pattern of educational inequality is evident across the four megacities. As urban areas expand outward and the number of schools increases, this geographical configuration does not appear to improve. From the perspective of segregation indices within each geographical layer amid urban expansion (Figure 7), the Theil’s H index in the central areas of the four cities is generally below 0.3 (Beijing: 0.275, Shanghai: 0.316, Guangzhou: 0.451, Tianjin: 0.267), while the index for the outer suburbs scope all exceeds 0.46. Specifically, the gap in Theil’s H between the central areas and the outer suburbs reaches 0.120 in Guangzhou and 0.153 in Shanghai, indicating that school segregation increases significantly as cities expand progressively from the core to the periphery. School segregation and exposure indices across urban spatial zones.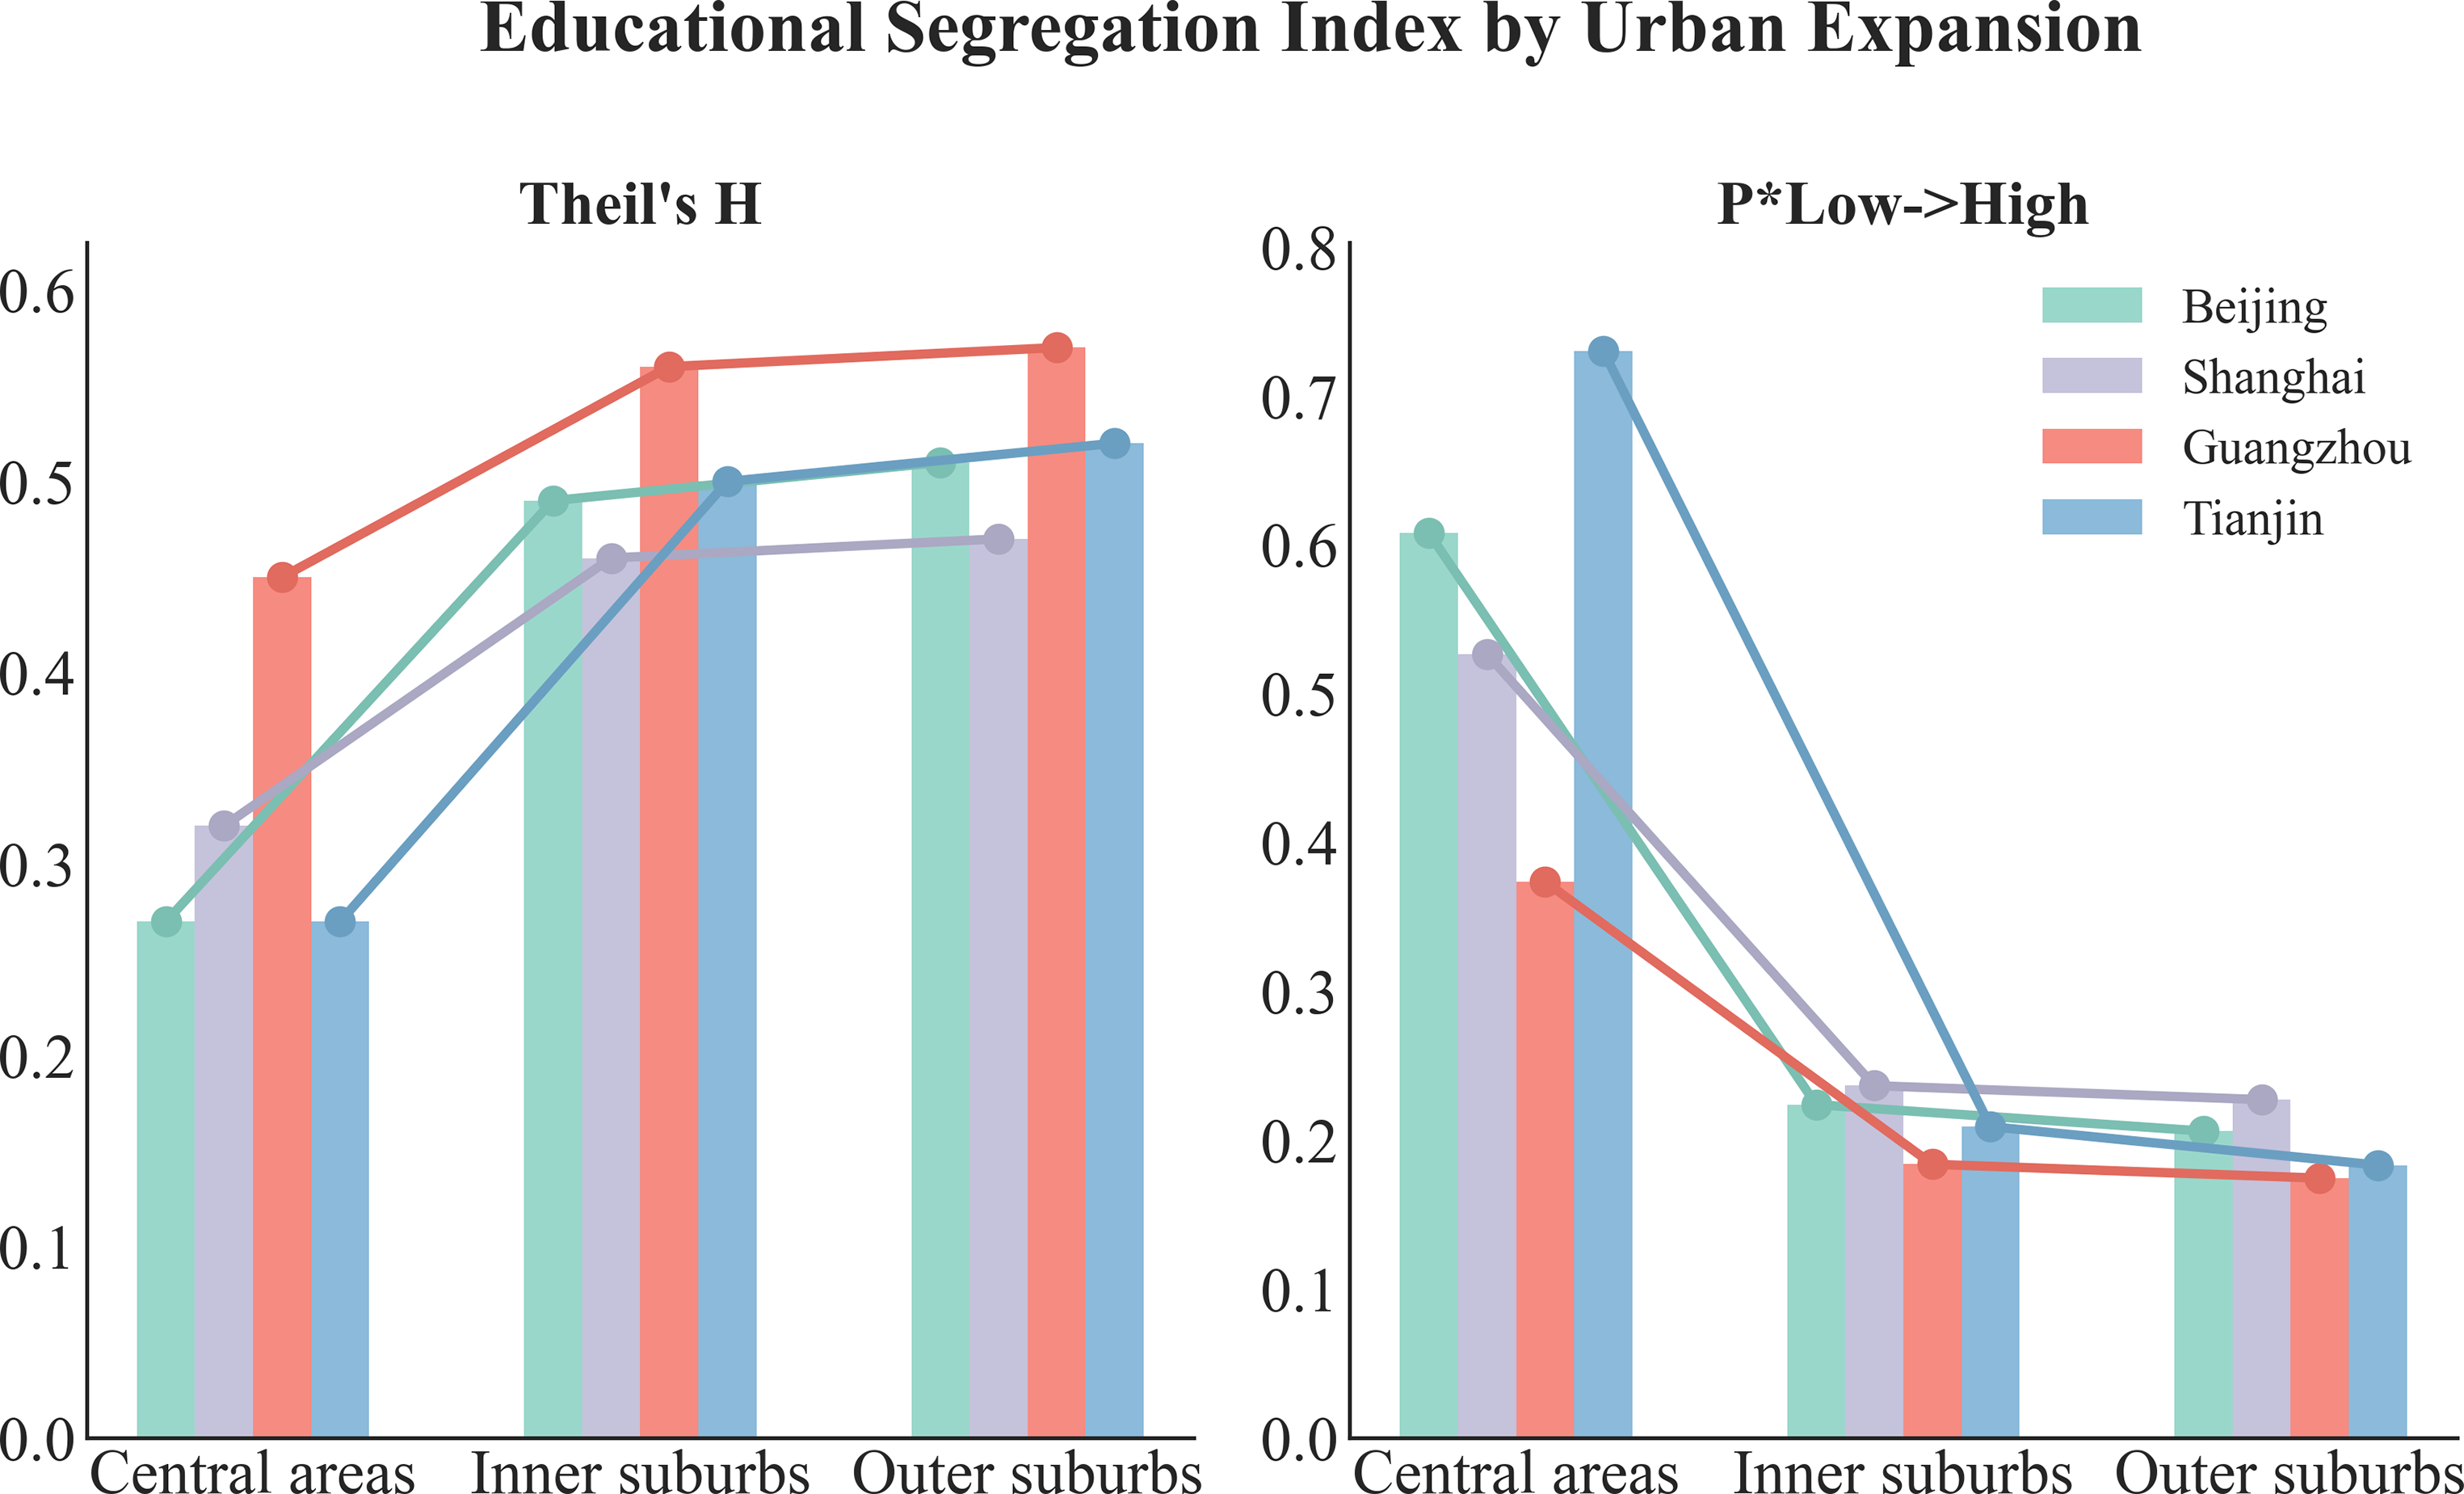
This characteristic is prevalent across all four study cities: the exposure index of low-income students to high-income students (
Even when educational resources are quantitatively sufficient, high-income groups are preferentially served in terms of school quality. High-quality educational resources and high-income groups are highly spatially coupled and exhibit distinct clustering, whereas low-income groups have extremely limited access to high-quality schools. Furthermore, urban spatial structure affects school segregation, with polycentric urban layouts facilitating more equitable educational distribution. For instance, Beijing’s ring-road transportation network leads to a concentric expansion pattern, influencing the distribution of these school types.
Discussion
This study utilizes big data analysis to offer novel insights into commuting inequality, income-based school segregation, and the imbalanced geographical distribution of educational resources in Chinese megacities.
This study shows that socioeconomic status and school quality exert greater influence on educational opportunity than spatial accessibility, thereby challenging conventional understandings of school access. High-quality schools exhibit a much wider realized catchment, enrolling students from more diverse socioeconomic backgrounds and over longer distances (the median commuting distance for top schools in Beijing is 1.120 km), whereas low-quality schools draw primarily from adjacent neighborhoods (median 0.926 km). Existing research stresses that centrally located high-quality schools enjoy high spatial accessibility due to superior infrastructure (Wen et al., 2018), but our analysis of observed residence-school relationship demonstrates that such accessibility is strongly stratified by income. High-income families can absorb higher spatio-temporal costs and, crucially, purchase housing in elite school districts, thereby reducing children’s average commuting distance (Dai et al., 2019; Zhang, 2024a). Moreover, theoretical spatial accessibility does not necessarily translate into equitable opportunity: affluent households strategically bypass nearby low-quality schools to access more distant high-quality institutions (Burgess and Briggs, 2010), while low-income families, even in central areas, are constrained by restrictive enrollment rules to lower-quality schools. This dynamic mechanism generates new forms of educational inequality and provides empirical support for the claim that socioeconomic factors can override spatial accessibility in shaping educational opportunities (Zhang et al., 2025).
With respect to income-based school segregation, this study finds that the apparent decline in segregation in high-quality schools (e.g., Theil index of 1.206 for low schools vs 1.162 for top schools in Beijing) does not signal greater equity, but rather reflects the high selectivity and path dependence of elite educational tracks. As school quality and level increase, overall segregation falls and exposure of low-income to high-income students rises (
Finally, the study identifies a core-periphery pattern that structures family income, school segregation, and school quality, highlighting the role of urban expansion and educational provision in reinforcing inequality. High-quality schools (TH and MH) are concentrated in the urban core, tightly linked to high-income residential areas, while lower-tier schools (ML and TL) are distributed along peripheral expansion corridors. This spatial configuration reflects the logic of Effectively Maintained Inequality (EMI) (Lucas, 2001). Although low-quality, open-access schools cover over 60% of the urban area, they mainly serve low-income households on the urban fringe. High-income families continue to use economic and cultural capital to secure places in core TH schools, which comprise less than 10% of all schools, thereby maintaining educational advantage (Byun and Park, 2017). Neighborhood-based enrollment policies, intended to promote equity, can unintentionally increase class stratification (Cai et al., 2025), locking low-income groups into peripheral, lower-quality schools and limiting social mobility (Guo and Chen, 2023; Zahl-Thanem and Rye, 2024). By comparison, Shanghai exhibits greater educational equity, attributable to moderately decentralized urban functions, a more balanced inter-district distribution of quality schools, and strong regulatory measures such as the “one enrollment quota per family within 5 years” rule, which dampens the “school district premium” and weakens the capacity of privileged groups to monopolize elite educational resources (Dai and Tan, 2023; Qian and Walker, 2015; Wang and Li, 2022).
This study has limitations. First, defining school quality posed challenges because policies promoting balanced educational development in China restrict the public release of official school rankings. This made precise, data-driven quantification and classification of school quality difficult. Second, although mobile phone signaling data provide unparalleled large-scale information on student mobility, their 250 m × 250 m spatial resolution limits the locational precision of both origins and destinations. This may introduce minor measurement errors in identifying home and school grids, particularly for short-distance commutes or schools smaller than a single grid cell. Additionally, the anonymized nature of mobile phone signaling data, which is essential for privacy protection, prevents us from obtaining individual identity or detailed occupation information and therefore precludes direct matching with external statistical data. Finally, this study uses residential housing prices as a proxy for residents’ socioeconomic status, which also has limitations. For example, it is difficult to distinguish between homeownership and renting, and high-income households may own multiple properties, which may introduce biases into income estimation based on housing prices.
Conclusions
By integrating multi-source big data, including mobile phone signaling data, this study overcomes critical data limitations in acquiring large-scale socioeconomic information. We provide an in-depth exploration of educational inequality across four Chinese megacities, offering novel insights into educational equity challenges in Global South cities amidst rapid urbanization.
The core finding is that educational inequality persists across family socioeconomic status and school quality, and that the educational expansion accompanying urban expansion does not effectively alleviate this inequality. Student commuting distances correlate positively with school quality and educational stage, but negatively with household income. Affluent families leverage their economic and cultural capital to overcome spatio-temporal barriers for superior educational access, while low-income families’ choices are constrained. Within schools, although the degree of school-level segregation superficially decreases with improvements in school quality and advancements in schooling stages, this income mixing does not equate to equitable educational opportunities. This mixing is often a consequence of competitive examination systems, demonstrating the path-dependency of high-quality educational resources for affluent families and the pressure on low-income families to access them. Shanghai’s school segregation performance suggests that strategies to mitigate the “school district premium” effect, like the “one household, one enrollment quota” rule, are crucial for enhancing educational equity.
Most importantly, the urban core–periphery pattern of school types, defined by school quality, student composition, and levels of social segregation, suggests that urban expansion and the increased provision of educational resources have not been accompanied by a more even spatial distribution of high-quality educational resources. Rather, existing educational inequalities remain structured along the urban core–periphery pattern. Top-tier educational resources (Type TH schools) are concentrated in urban centers, primarily serving high-income populations. While recent peripheral expansions have introduced new educational resources (Type TL schools), increasing the number of facilities in urban fringe areas, these newly added schools remain of lower quality and predominantly cater to low-income groups. This spatial monopolization of quality educational resources by affluent strata demonstrates the reproduction of inequality through urban development, emphasizing the need for targeted urban educational planning and equity policies.
Supplemental material
Supplemental material - Uncovering income-based unequal access to schooling using multi-source big data approach
Supplemental material for Uncovering income-based unequal access to schooling using multi-source big data approach by Yuqi Wang, Xuan Luo, Mengzhu Zhang and Pengjun Zhao in Environment and Planning B: Urban Analytics and City Science
Footnotes
Author contributions
Yuqi Wang: Writing original draft, Visualization, Conceptualization, Methodology, Investigation. Xuan Luo: Writing—review and editing. Mengzhu Zhang: Writing—review and editing, Supervision, Data curation, Project administration, Funding acquisition. Pengjun Zhao: Funding acquisition.
Funding
The authors disclosed receipt of the following financial support for the research, authorship, and/or publication of this article: The research project is funded by the National Natural Science Foundation of China [Grant Number: 42301220; 42571249], Humanities and Social Sciences Fund of the Ministry of Education of China [Grant Number: 23YJC840037], Young Elite Scientist Sponsorship Program of China [Grant Number: YESS20240322], Shenzhen Science and Technology Innovation Commission [Grant Number: KQTD20221101093604016; JCYJ20250604175824033].
Declaration of conflicting interests
The authors declared no potential conflicts of interest with respect to the research, authorship, and/or publication of this article.
Data Availability Statement
The authors do not have permission to share data.
Supplemental material
Supplemental material is available online.
Author biographies
References
Supplementary Material
Please find the following supplemental material available below.
For Open Access articles published under a Creative Commons License, all supplemental material carries the same license as the article it is associated with.
For non-Open Access articles published, all supplemental material carries a non-exclusive license, and permission requests for re-use of supplemental material or any part of supplemental material shall be sent directly to the copyright owner as specified in the copyright notice associated with the article.