






Abstract
Sanborn Fire Insurance maps are some of the most complete records of the historical built environment that researchers have access to, with building-level data for over 12,000 cities contained in hundred-year-old atlases. A challenge facing the historical urban planning research community is ensuring the preservation of these atlases’ information through scanning, but further digitization through vectorization has been largely contained to time-consuming hand-tracing methodologies that are prone to human error. While there is existing research to extract Sanborn footprints through machine learning, the methodology is costly in time and processing power. This paper contributes a scalable, open-sourced computational workflow for extracting building footprints from Sanborn maps to create vector polygons. We demonstrate this model’s scalability, speed, and accuracy by using a case from our Chicago Urban Heritage Project to map Chicago’s Hyde Park neighborhood in the mid-1920s. This case provides an example for how these automatically extracted footprints can open the door for spatial analysis of new eras of the historical built environment when combined with traditional datamining techniques.
Introduction
American cities have experienced dramatic changes throughout their histories. Processes such as industrialization, redlining, and highway construction reshaped the built environment and, with it, the everyday lives of urban residents (Jacobs, 1992). One of the most systematic of these changes was that of urban renewal following World War II, which saw the reshaping of areas deemed “blighted,” a designation shaped by deeply racialized policy that disproportionately targeted Black and low-income neighborhoods (Rapkin, 1980). Scholars have long recognized these changes to the built environment as instruments of displacement and segregation inflicting harm far beyond physical change. The results of urban renewal are still felt today and continue to influence contemporary urban injustices in the environment (Lane et al., 2022), health (Nardone et al., 2020), and housing (Rey and Knaap, 2024). Examining changes to the urban built environment over time offers a lens for understanding these legacies and the forces that have shaped inequalities in the social and spatial fabrics of American cities.
Sanborn Fire Insurance maps have been recognized as an important source of data for documenting historical changes in the urban built environment. Originally created to evaluate fire insurance liability, these maps provide complete and detailed records of building footprints, use, height, and more for over 12,000 cities and towns, primarily in the United States but also including Canada, Mexico, and Cuba (Craine et al., 2023). While the full collection spans 1867 to 1999, the most comprehensive holdings, such as the Library of Congress collection, concentrate between 1880 and 1960, suggesting that coverage outside this window is sparser and more variable across cities and regions. They are housed physically and digitally across public and private collections such as the Library of Congress, Free Library of Philadelphia, Fire Insurance Maps Online, and Chicago History Museum. Despite this, working with Sanborn maps has traditionally been challenging. Digitizing them into vector data has relied on manually tracing building shapes, which is time-consuming and difficult to scale (Hoesen and Letendre, 2013; Kennedy, 2020; Nelson, 2024; Talen, 2023). Recent efforts have sought to automate digitization using machine learning, but these methods rely on large amounts of labeled training data, remain computationally slow and resource-intensive, and are difficult to generalize outside of the regions or sources the original models are trained on (Lin et al., 2023; Tollefson et al., 2021).
This study develops an open, efficient, and scalable workflow for digitizing building footprints from high-resolution Sanborn map scans for spatial analysis of the historical built environment. Using open-source Python libraries, the workflow detects building footprints and the “stencils” separating adjacent structures, subtracts these layers to ensure accurate building delineation, and post-processes the results to produce tidy, vector polygons ready for GIS all while maintaining computational efficiency, even for high-resolution scans. The workflow has been applied through the Chicago Urban Heritage Project, an initiative to digitize Sanborn maps across Chicago and produce historically accurate, downloadable building data layers. This paper highlights the results from Hyde Park, a Chicago neighborhood whose history parallels that of many American cities, marked by urban renewal and dramatic changes to the built environment. Combining building footprint data derived from the workflow with building use data extracted by a point-in-polygon approach, we examined how Hyde Park’s built environment documented in its 1920s Sanborn maps has changed relative to its current state. To emphasize our method’s competitive edge in performance and accuracy, we compare each metric against recent machine learning-based approaches.
Background
Geohumanities, situated at the intersection of (digital) humanities and geography, draws from and contributes to adjacent fields including urban sociology and historical geography. It has catalyzed a growing body of research examining how places have changed over time and what those changes reveal about power, inequality, and collective memory (Dear et al., 2011). Historical maps have emerged as major archival sources for this scholarship, valued for their spatially explicit records of the built environment, land use, and zoning, which encode histories of race, class, and displacement not always legible in the textual archives such as municipal records and censuses. Recent research has drawn on historical maps across a range of urban contexts, examining topics including retail geographies in 19th-century London (Novak and Gilliland, 2011), the dwelling and social spaces of workers in Victoria, BC (Dunae et al., 2013), and immigrant displacement in mid-20th century Manchester (Brown and Cunningham, 2016).
The Sanborn Fire Insurance Company’s atlases have been an invaluable resource to geohumanities research on American cities and towns, given their time span and broad geographic coverage across the country. These handmade maps, contained in large atlases (21 × 25 inches), consist of multiple volumes of over 100 sheets. Each sheet provides detailed information at the building-scale, typically covering a two-by-two city-block grid, and together they constitute among the most intact records in existence of neighborhood-scale built environments, with information including buildings’ names, materials, uses, locations of windows, ceiling heights, and, most importantly, footprint shape. Sanborn maps are widely cited across urban and historical research in America, serving as primary sources for studies of the historical built environment (Ammon, 2018; Hoesen and Letendre, 2013; Mostafavisabet et al., 2026; Otto and Lin, 2025; Talen, 2023), mobility networks (Kennedy, 2020), land use (Baics and Meisterlin, 2016), as well as their social (Stone et al., 2022), economic (Ray et al., 2025), and epidemiological (Harton et al., 2023; Kennedy et al., 2015) implications.
Much of the research using Sanborn maps has built on traditional historical GIS methods that involve georeferencing scanned maps and manually tracing general building footprints (Hoesen and Letendre, 2013; Talen, 2023) or more specific building types like industrial sites (Nelson, 2024) directly within GIS software (Knowles, 2016). While technically feasible, this process is resource-intensive, time-consuming, and difficult to scale given the vast number of buildings contained in each atlas. To address these gaps, some researchers have proposed using public participatory approaches such as crowdsourcing to reduce the time and labor required, though they have mostly been used for georeferencing and classification of map features rather than building footprint digitization (Cox, 2023; Lafreniere et al., 2019).
Recent work has explored the use of computer vision algorithms and artificial intelligence to automate the extraction of building-level data, aiming to improve efficiency in detecting geographic features such as wetlands (Ståhl and Weimann, 2022), road networks (Uhl et al., 2022), and building footprints (Heitzler and Hurni, 2020; Litvine et al., 2024), and cartographic elements including text labels (Schlegel, 2021) and map projections (Li and Xiao, 2023). For Sanborn maps specifically, studies have applied artificial intelligence methods such as optical character recognition (OCR), support vector machines (SVM), and convolutional neural networks (CNN) to detect building footprints, map attributes (number of stories, building material, and usage) (Lin et al., 2023; Tollefson et al., 2021), and street intersections (Shensky et al., 2024). However, these methods typically have long runtimes when handling high-resolution scans. For example, the SVM-based approach by Lin et al. (2023) reported an average processing time of over 20 minutes per map, even for low-resolution scans (approximately 1160 × 1260 pixels). Applying this method to high-resolution scans at scales involving hundreds of maps poses significant challenges in time and computing power.
This study aims to address gaps in efficiently extracting building footprints from Sanborn maps by proposing an open, scalable workflow. Using open-source programming libraries, the workflow detects building footprint shapes, ensures the separation of attached structures by subtracting solid building outlines, and post-processes the results into vector polygons in only seconds per map. With this approach, we aim to make the wealth of knowledge Sanborn maps contain accessible to a broader, lay audience.
Study area and data
The Chicago Urban Heritage Project digitizes Sanborn maps for neighborhoods in Chicago. Chicago is a city that has experienced many of the changes in urban built environments that parallel other American cities over the past century. The city also harbors a variety of historical map collections and has been a focal point for geohumanities and historical GIS research (Churchill, 2004; Conzen and Dillon, 2007), including the recent Mapping Chicagoland initiative that aggregates and georeferences collections of historical maps (Smith et al., 2025). The Chicago Urban Heritage Project aims to advance this scholarship by using the proposed computational workflow to convert maps into vector data, which is the typical format for GIS and spatial analysis. It focuses on Sanborn maps because they contain detailed building-level information that is widely used for urban and historical studies.
In this study, we present results on Hyde Park, Chicago, from the Chicago Urban Heritage Project. Although the Project has already covered more than 40% of Chicago at the time of writing, we focus on Hyde Park because it provides a well-documented case of urban transformation over the past century through university-led urban renewal. Hyde Park’s urban renewal was led by the University of Chicago in the 1950s and funded through rehabilitation financing available under Section 220 of the Federal Housing Act (Belden, 2017). It was one of the first federally-funded urban renewal projects in the United States and became a prominent example among the many university-led urban renewal projects in the postwar era (e.g., University of South Carolina in Columbia, see Kahler and Harrison, 2020). Like other mid-century renewal projects, it involved widespread demolitions, the displacement of families, and the reshaping of both residential and commercial areas (Alderman et al., 2025; Page and Ross, 2017; Rapkin, 1980; Ryzewski, 2021; Teaford, 2000). In Hyde Park, historically dense, vibrant commercial corridors were demolished and replaced with large-scale developments like condominiums, parks, single-family townhomes, and parking lots (see Figure S1 for before and after photos). We used Sanborn maps that document Hyde Park before these changes to illustrate the proposed computational workflow.
The Library of Congress Sanborn Maps Collection has a digital archive of over 25,000 high-resolution, full-color Sanborn map scans for more than 3000 U.S. cities from the 19th-20th centuries (Library of Congress, 1981). The scans are delivered at a high resolution (8248 × 5706 pixels). This study used 33 Sanborn maps from 1925 to 1926 for Hyde Park, bounded by Hyde Park Boulevard (north), 59th Street (south), Lake Michigan (east), and Cottage Grove Avenue (west), sourced from Chicago Volumes 14 and 16 in this collection. Each of these maps was georeferenced to create a tile layer as shown in Figure S2. This process used QGIS’s Georeferencer tool to overlay each map atop its real-world position. We chose a minimum of six “control points” (CPs) on each map scan that correspond to coordinates on OpenStreetMap. CPs primarily consist of street or alleyway intersections as they are, in this case, unlikely to have changed significantly over the past century.
Methods
In this section, we describe our computational workflow for identifying building footprints from georeferenced Sanborn maps (Figure 2(a)). The process for extracting building footprints contains four steps: (1) stencil creation (identifying the black lines indicating features such as parcel boundaries and building outlines), (2) footprint detection (separating building pixels from the background), (3) subtracting these layers to refine the footprints and split wall-to-wall features, and (4) post-processing to vectorize and clean the results. All steps are fully reproducible in a Python-based computational environment. Figure 1 is a flow chart breaking down each step of this workflow. Figure 2 illustrates multiple key points in our process including input, “stencils,” background detection, cleaned footprints, footprints with stencils subtracted, and final vector output. Flowchart of the computational workflow showcasing all intermediary steps between the input (georeferenced Sanborn map) and output (post-processed GeoJSON of building footprints) color-coded by operation type. Parentheticals (e.g., A, E, and F) reference key step output examples in Figure 2. (a) A georeferenced Hyde Park Sanborn (Chicago Volume 14, Sheet 86), (b) extracted “stencils,” (c) detected background pixels (white), (d) cleaned building footprints, (e) stencils subtracted from cleaned footprints, (f) post-processed vector building footprints (before manual corrections). See Table S1 for specific parameter values used to produce these results.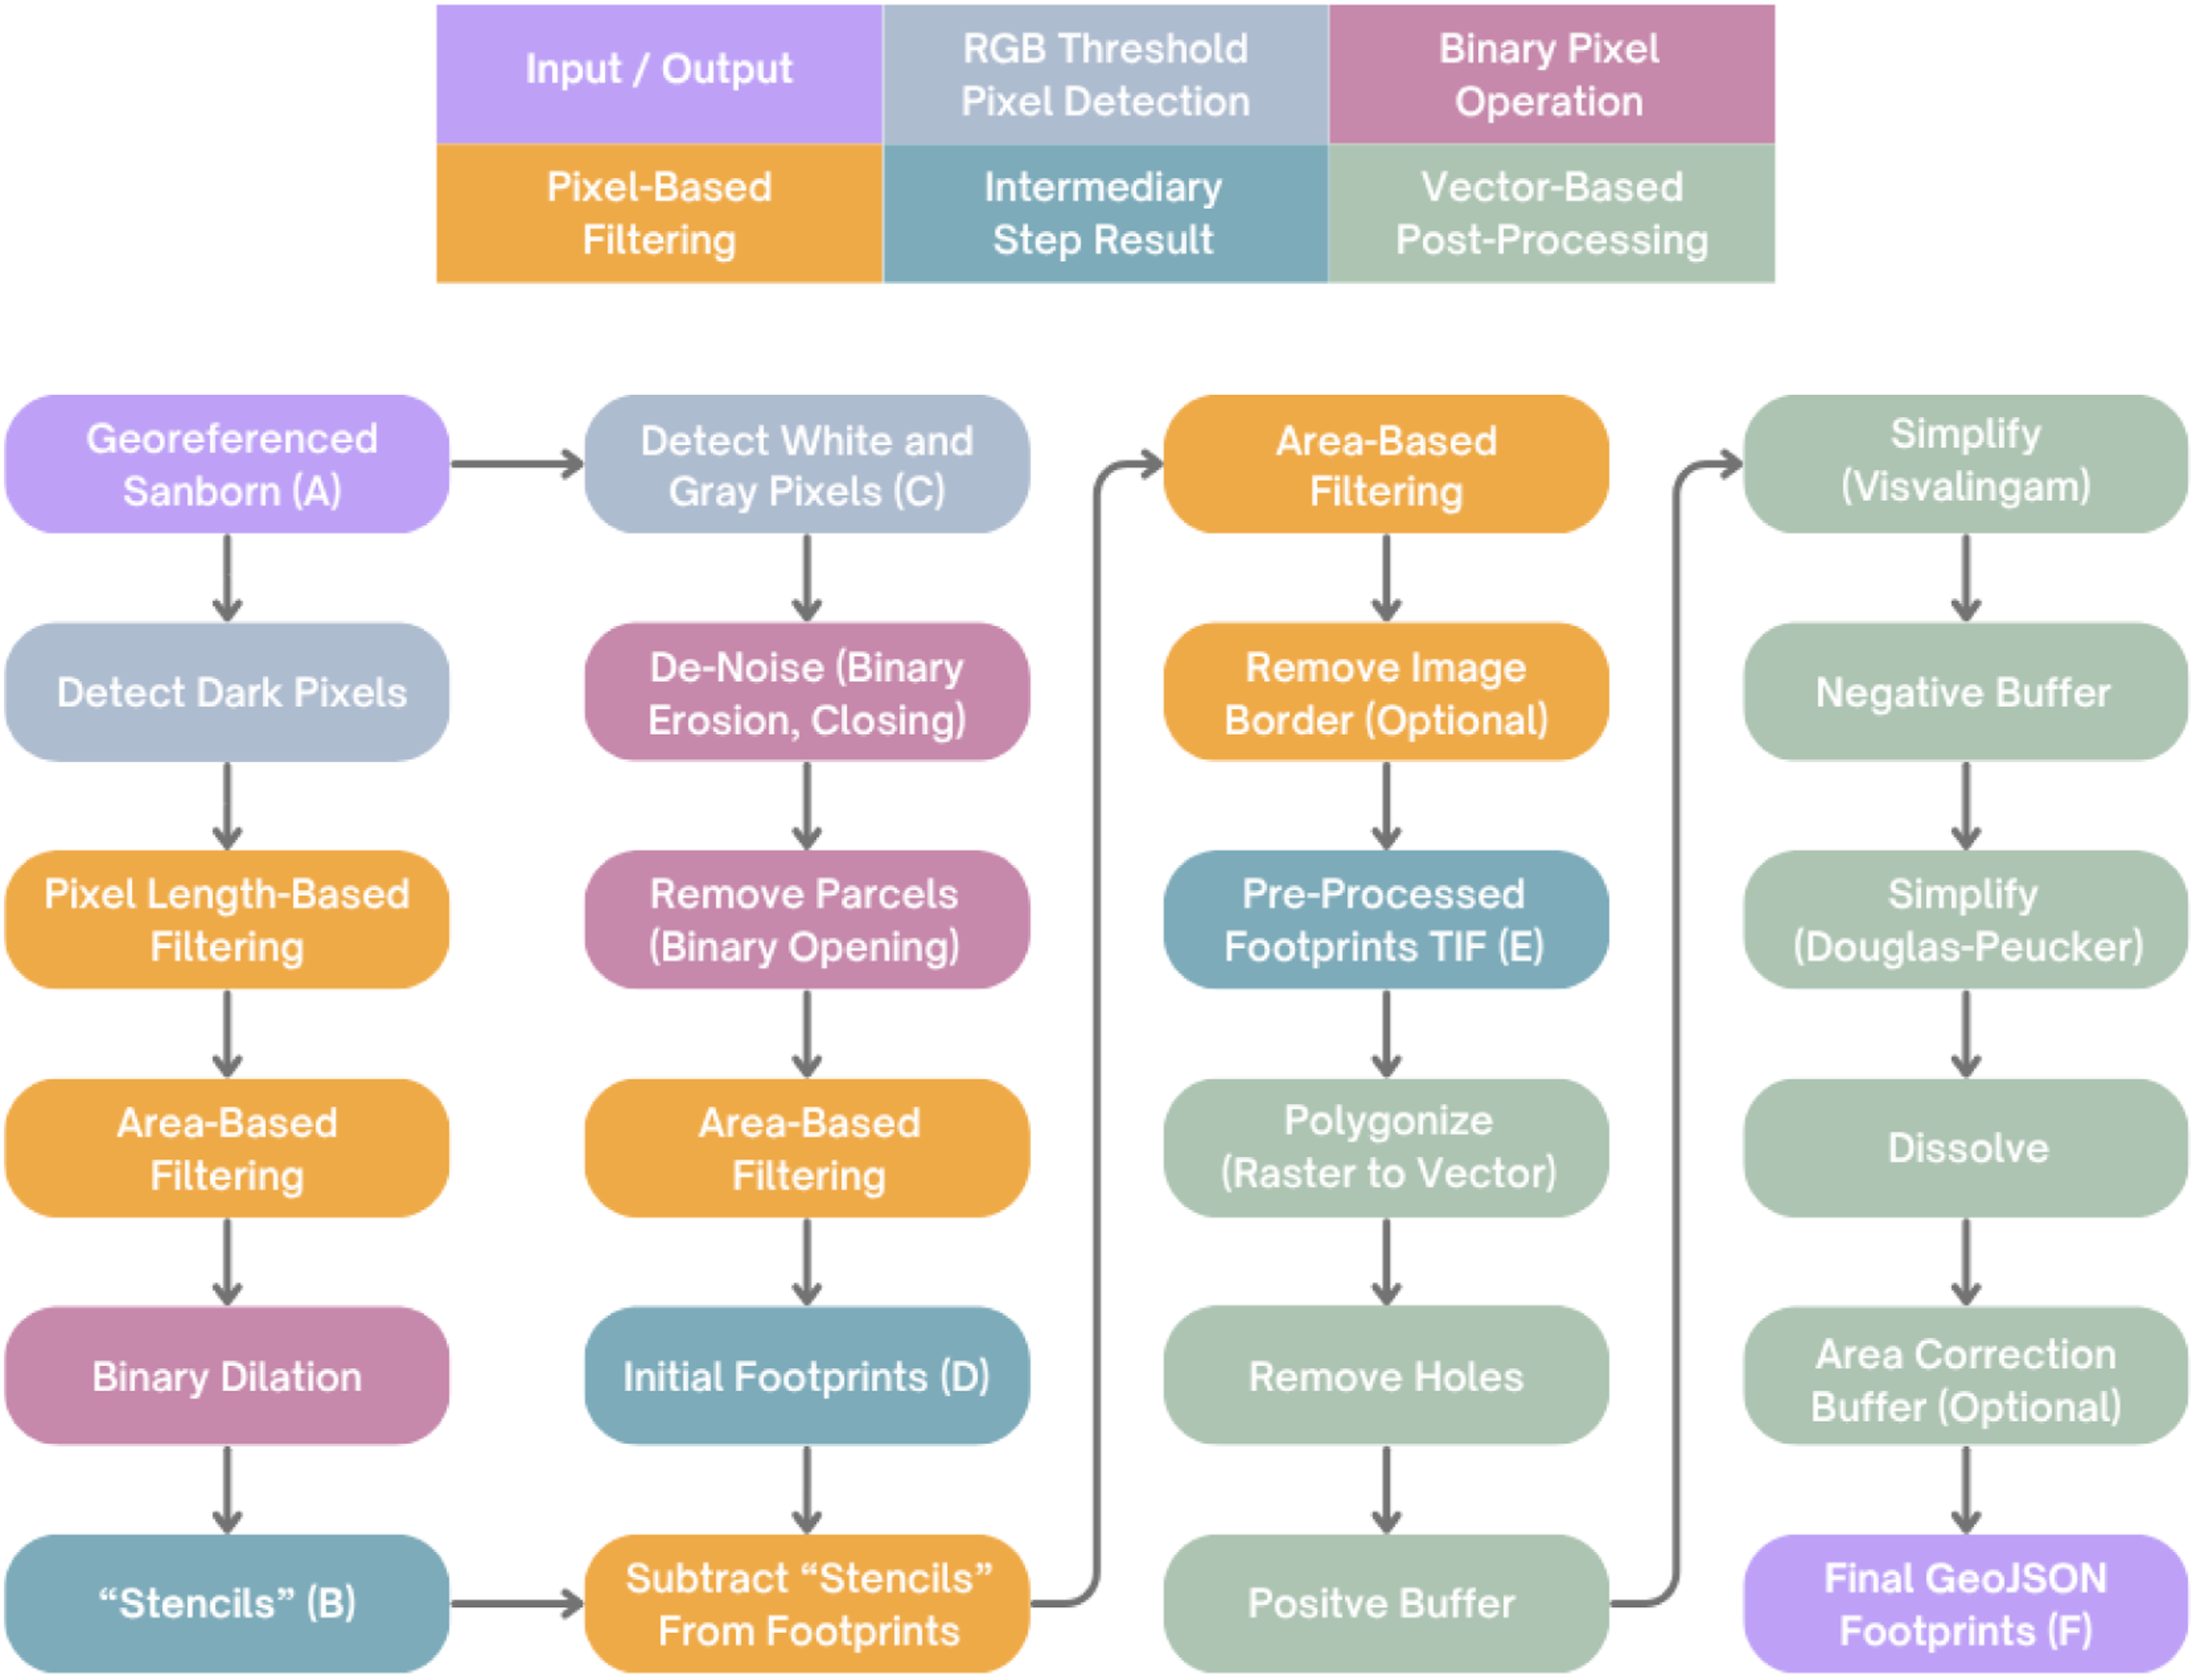
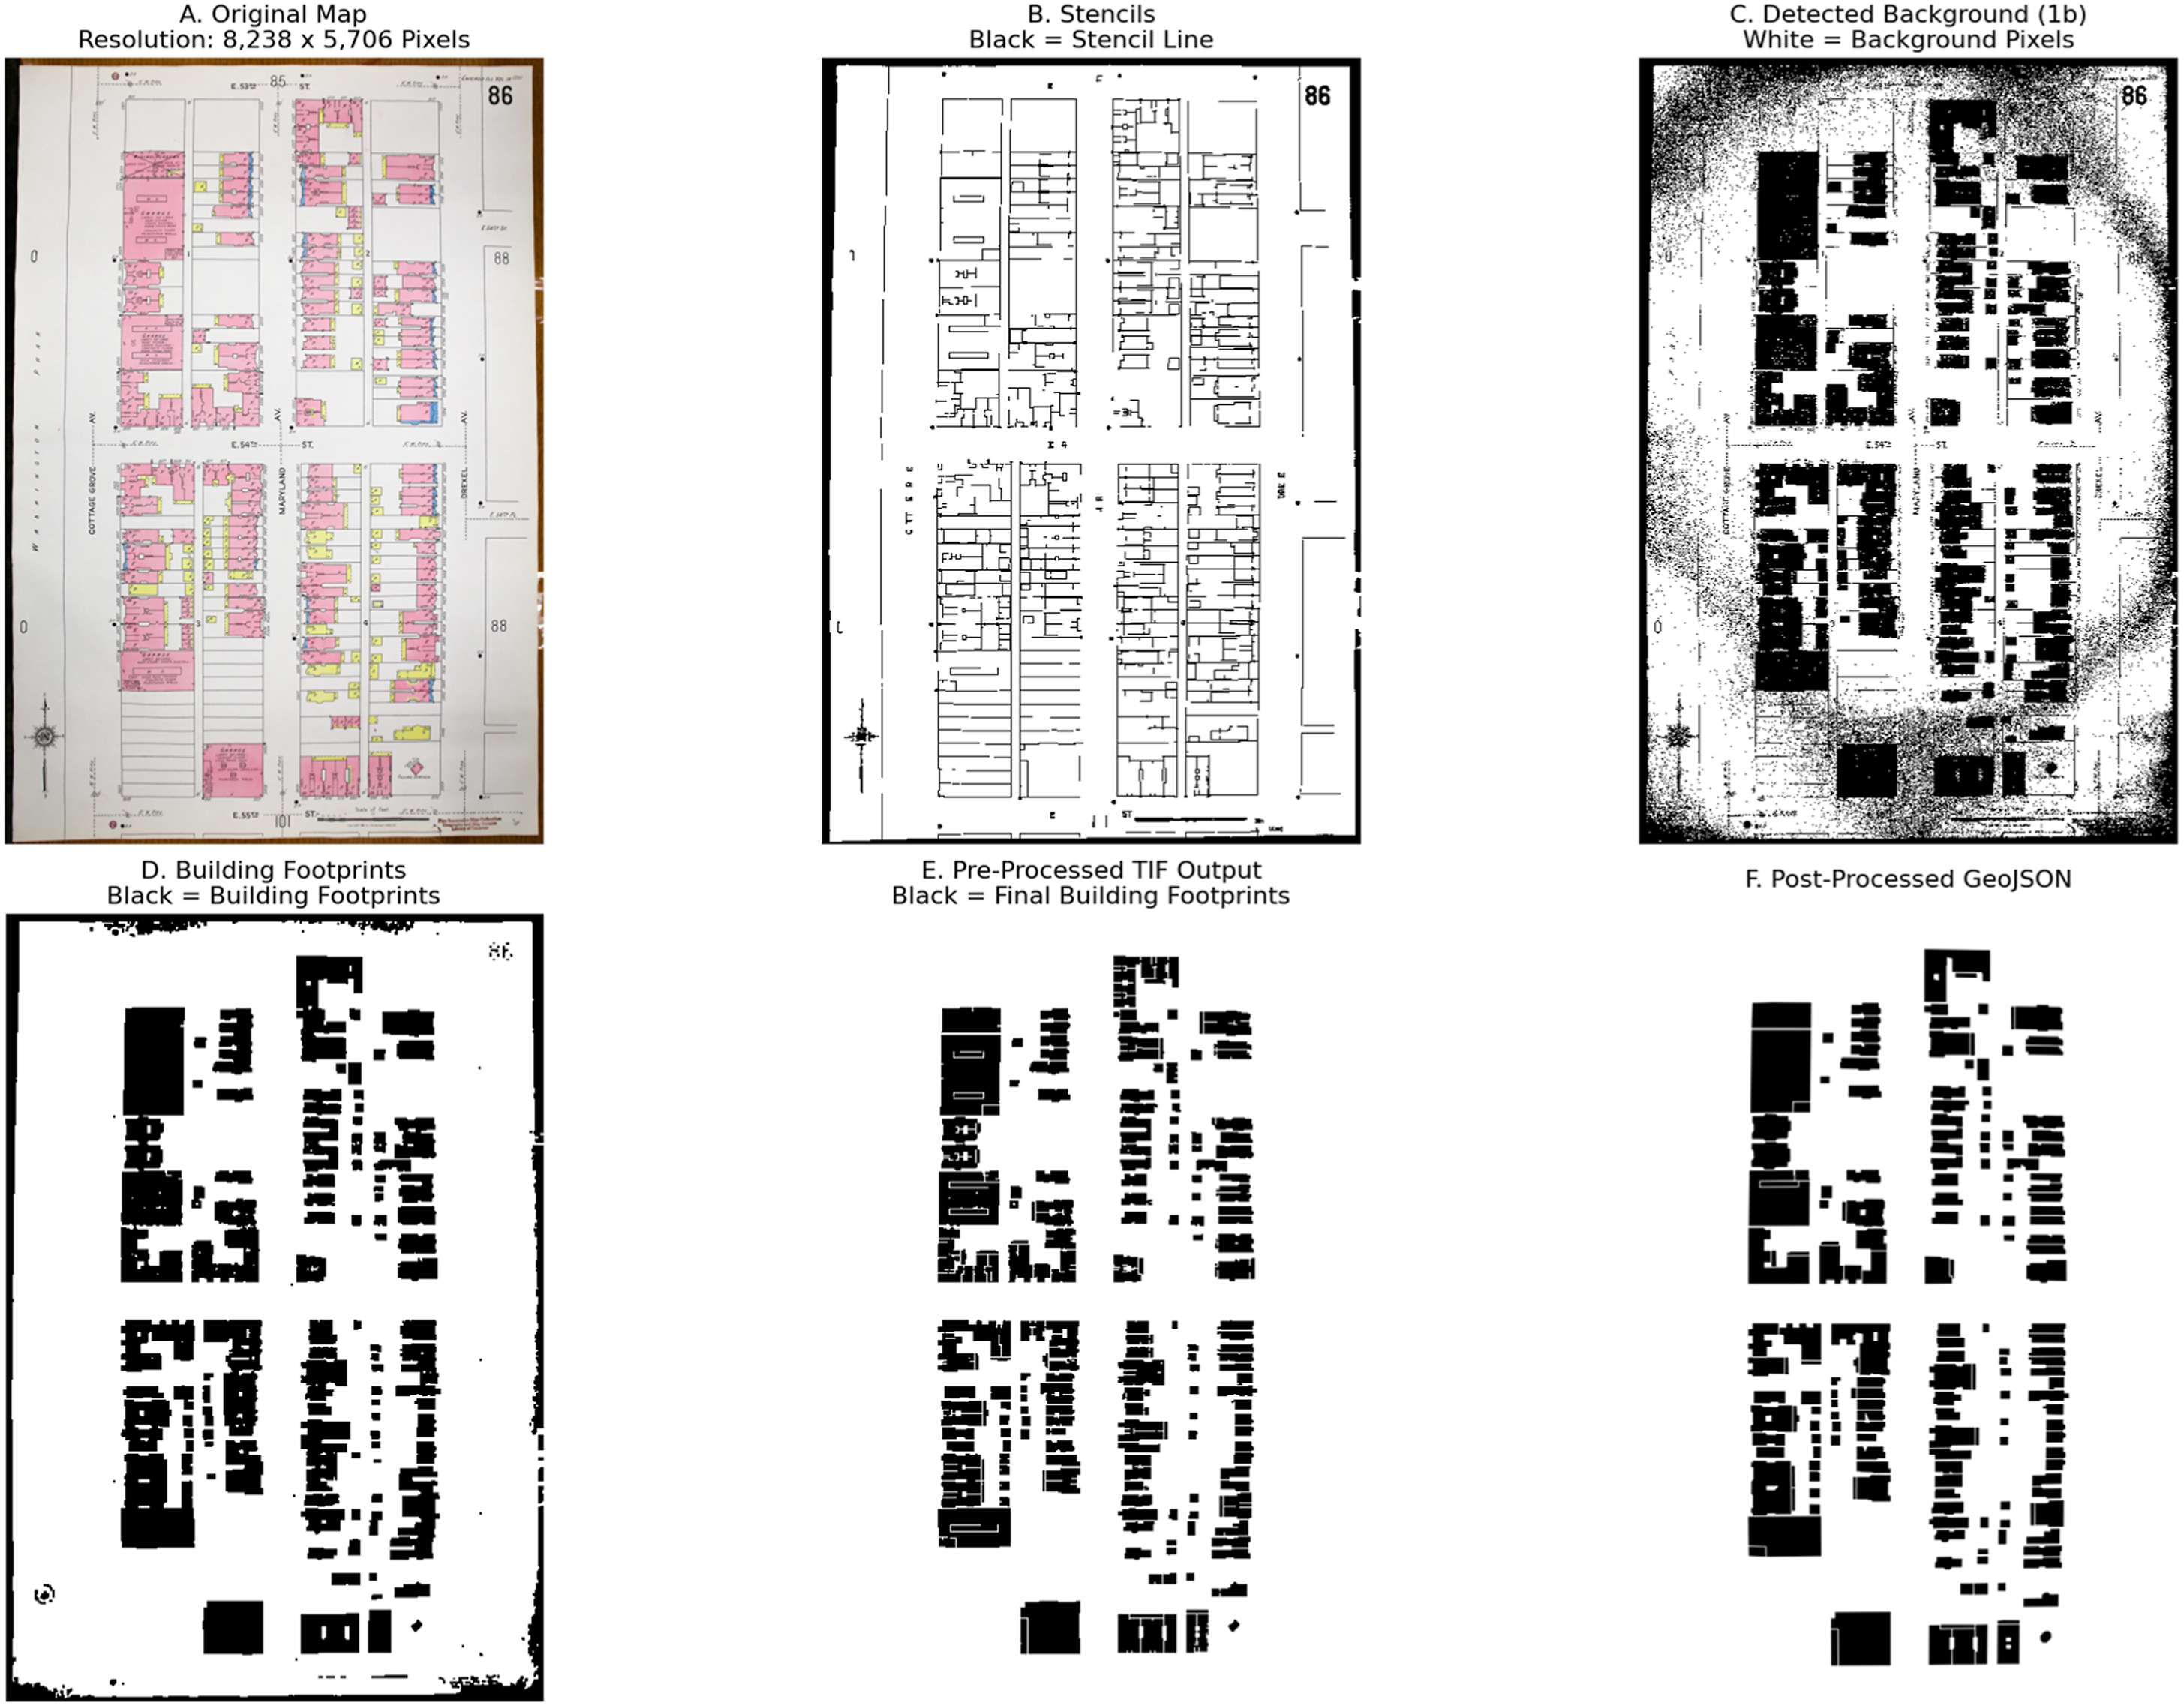
The first step of building footprint extraction is creating “stencils” to ensure the effective separation of wall-to-wall (attached) buildings—a common typology for retail corridors in Chicago. To create the “stencils,” we first read the 3 RGB (red, green, blue) color bands of the georeferenced Sanborn. Next, we check each pixel for sufficient darkness across all three bands. Given that the features of interest for creating “stencils” (e.g., parcel lines and firewall lines) are denoted by dark lines, any pixel in the scanned map constituting these features will have all three RGB values below a certain darkness threshold (which lies between 0, perfectly black, and 255, perfectly white). For example, if the darkness threshold is 50, all three values of R, G, and B in a given pixel must be below 50 to be considered part of the “stencil.”
While this result successfully captures “stencils,” it also captures unwanted features including labels and descriptive text (all of which can produce holes in the building footprints they intersect. To remove this noise, we employ two steps: pixel length-based and area-based filtering. For pixel length-based filtering, we parse through pixels horizontally and vertically, keeping black pixels that are followed in either direction by 20 additional black pixels. After this, we perform area-based filtering by identifying contiguous clusters of pixels and removing those below an adjustable threshold. Finally, we dilate the filtered lines to exaggerate their area and ensure footprints are sufficiently split in a later step. The result is a binary image of “stencils” where outlines of building footprints and parcels are labeled as True and all else False (Figure 2(b)).
The second step of this workflow is footprint detection. This method relies on two adjustable RGB value thresholds for white and gray pixels to detect the background (i.e., paper) of the Sanborn map. After parsing through all pixels in the image, we keep both those that have all three RGB values greater than the white threshold and those that have all three RGB values between the gray threshold and white threshold. The result is a binary image where the detected background pixels are labeled as True and all else False (Figure 2(c)). To further solidify the footprints, we must solve three problems: noise amid background due to false positives, holes in footprints due to false negatives, and removing parcel boundaries. To address these issues, we leverage several binary mathematical morphology operations that grow and/or shrink pixel clusters using an adjustable kernel: erosion, dilation, opening, and closing. Erosion shrinks pixel clusters, dilation grows them, opening sequentially erodes then dilates them, and closing sequentially dilates then erodes them. For both false positives and negatives, we sequentially erode, close, and erode again according to adjustable kernels for each. Erosion removes small clusters of false positives (likely due to film grain or dirt) while closing seals small holes in building footprints caused by inconsistent colors misclassified as background (often due to variability in hand-painted color fills). Next, we use binary opening with an adjustable (but significantly larger than previous steps) kernel to remove parcel lines (opening was found to be superior to erosion in this step in reducing impact on footprints rather than parcel lines due to the relatively large kernel size). Finally, we use an area-based filter (similar to the previous step) to remove any remaining noise. The result is a binary image where contiguous building masses are labeled as True and all else False (Figure 2(d)).
In the third step, we ensure that buildings with distinct walls are separated in the processed image (and therefore also the post-processed polygons) by subtracting the “stencils” from the building footprints. Any noise created during this step is removed through an area-based filter similar to prior steps. An optional parameter during this stage removes any image border by labeling all edge pixels within an adjustable distance as False. Image borders typically result from un-cropped images or pixel-warping from georeferencing. The result of step three is a building footprint raster output with stencils subtracted from cleaned footprints, where all building masses are labeled as True and are split along major lines (parcels and building edges; Figure 2(e)).
In the fourth step, we undertake footprint polygonization and vector-based post-processing using the Rasterio, Geopandas, Shapely, and Simplification Python libraries. We begin by creating georeferenced Shapely geometries combining True labeled pixels from step three (split building masses) with the transformation and CRS data stored within that raster. Once the geometries are correctly defined, we use several measures to ensure cohesive building footprints while preserving as many original features (and separation) as possible. The first measure is to remove all holes (interior rings). Next, we apply a positive buffer to close snaking inroads into each polygon (caused by interior walls, leftover symbology, or noise). The buffers are applied with square caps and mitered joins to avoid rounding out building corners. While the polygons are buffered, we apply the area-based Visvalingam–Whyatt simplification algorithm (Visvalingam and Whyatt, 1993), which progressively eliminates polygon vertices with minimal simplification and caricatural generalization. This method produces building footprints that better resemble the shape of the original building when compared to other algorithms. After this, we apply a negative buffer (to the same specifications of the first) to return buildings to their approximate original size. Next, we apply a final simplification algorithm—this time using the Douglas–Peucker method—with a low tolerance to remove intermediary vertices. The low tolerance enables the removal of extra vertices along relatively straight segments without sacrificing footprint shape. Next, we dissolve intersecting polygons to join any overlapping features. Finally, we apply an adjustable final buffer (again with miter joins and square caps) to minimize any area lost during the pre-processing erosion, stencil subtraction, and filtering steps and to ensure wall-to-wall polygons remain split while minimizing any gaps. The output of step four (and the final output for this workflow) is a GeoJSON file containing post-processed building footprint vector polygons ready to be manually edited, encoded with spatial data, or used for spatial analysis (Figure 2(f)).
Experiments and results
In this section, we present a case study from the Chicago Urban Heritage Project of applying the proposed computational workflow to analyzing changes in the built environment in Hyde Park between the mid-1920s and the present. We also compare our workflow’s runtime and accuracy to the SVM-based machine learning approach described in Lin et al. (2023).
Runtime comparison
In this section, we document the runtime of our computational workflow as shown in Figures 1 and 2 from the georeferenced Sanborn input to the post-processed GeoJSON output. While some manual feature editing occurs prior to digital display for the Chicago Urban Heritage Project (such as correcting oversimplifications, merging unintentionally split features, and removing remaining noise), we exclude these steps from our runtime and accuracy reports as they introduce variability that would confound direct comparison to other methods. We compare our workflow to the SVM-based machine learning approach described in Lin et al. (2023). It is worth noting that, while the comparison is not strictly one-to-one, our runtime estimate is in fact more inclusive than that of Lin et al. (2023) to encompass additional post-processing steps beyond those covered in their reported runtime, which ends prior to any post-processing implemented in GIS software. The runtime advantage reported here therefore represents a conservative estimate of our workflow’s efficiency gains.
The runtime metrics for our computational workflow show significant improvement compared to previously developed methods. Our experiments here were carried out using a free version of Google Colaboratory (Intel(R) Xeon(R) CPU @ 2.20 GHz and 12 GB RAM). Using the SVM-based approach to extract building footprints from our high-resolution Sanborn maps (approximately 8248 × 5706 pixels) resulted in an average processing time of approximately 7400 s (over 2 h) per map, without accounting for post-processing. By contrast, our workflow to derive post-processed building footprint data averages only 7.29 s (with a median and range of 6.78 and 5–13 s, respectively), marking a substantial reduction in processing time. Figure S3 shows a histogram of runtimes for processing 33 Sanborn maps of Hyde Park, Chicago.
Accuracy assessment
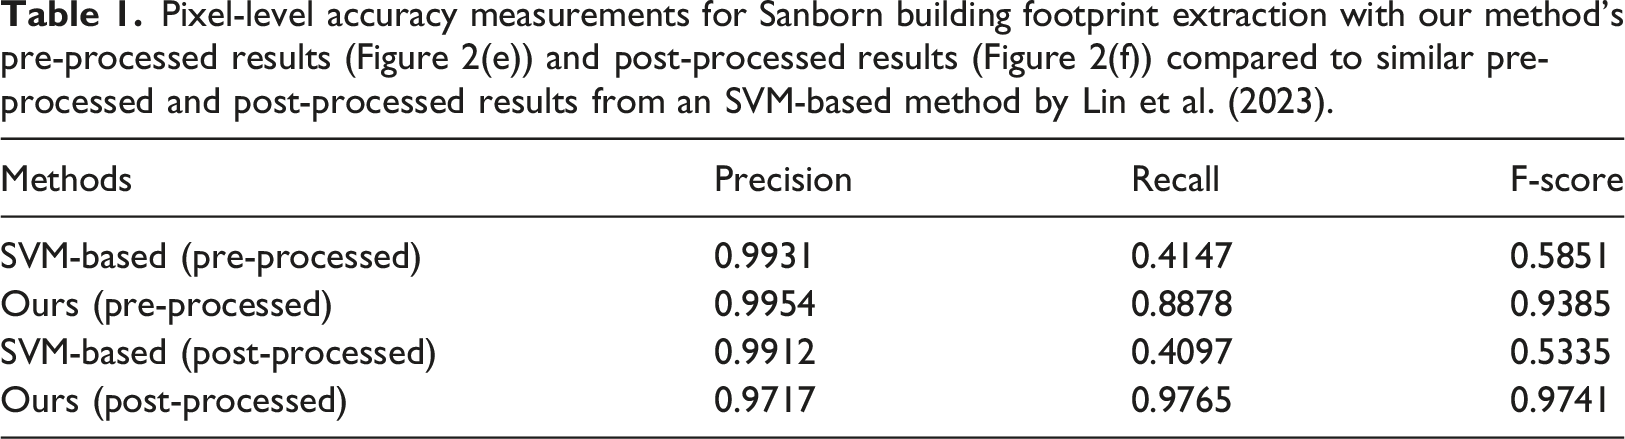
We compare the pre- and post-processed footprints extracted by our method (see examples in Figure 2(e) and (f), respectively) with their pre- and post-processed counterparts from the SVM-based approach by Lin et al. (2023), against ground truth, manually digitized footprints. We assess the accuracy using three standard metrics. Precision measures how reliable the extraction is; specifically, it is the proportion of correctly identified building footprint pixels among all those identified by the model. A high precision means the method produces few false positives, that is, pixels incorrectly labeled as buildings. Recall measures how complete the extraction is; it is the proportion of correctly identified building pixels among all those manually labeled. A high recall means the method captures most of the actual building footprint pixels and produces few false negatives, that is, footprint pixels that are missed. F-score combines both measures into a single metric by taking their harmonic mean, which penalizes methods that perform well on one measure but poorly on the other. Taken together, these three metrics provide a balanced picture of the reliability and completeness of the results.
Pixel-level accuracy measurements for Sanborn building footprint extraction with our method’s pre-processed results (Figure 2(e)) and post-processed results (Figure 2(f)) compared to similar pre-processed and post-processed results from an SVM-based method by Lin et al. (2023).
Examining changes in the built environment of Hyde Park, Chicago
The ability to extract building footprints from Sanborn maps opens new avenues for research in urban history, urban planning, and historic preservation. Here we illustrate one such application, examining changes in the built environment between the 1920s (before massive transformation brought by urban renewal) and the present day. We focus specifically on building uses, which play a central role in many urban renewal projects. In Hyde Park, the conversion of commercial corridors to residential areas fundamentally altered the neighborhood’s physical character and social fabric to promote car-centered, suburban lifestyles. We include this application as an example for how traditional datamining techniques can be used to enhance the automatically extracted polygon features produced by our workflow to enable rich spatial analysis, rather than to create a meaningful contribution to the extensive literature on urban renewal.
In this project, we used a point-in-polygon approach to assign building uses to footprints. Sanborn maps denote building uses with acronyms such as “D” for dwelling and “S” for store. This manual approach has been applied in other work (Lafreniere et al., 2019) and, while we recognize emerging machine-driven approaches such as OCR and CNN-based methods (Lin et al., 2023; Schlegel, 2021), we opt for the reliability of human visual interpretation given the variability in text quality across Sanborn scans. To implement this, a point layer is created for each building use type, with each point plotted within a matching building footprint. After plotting, an attribute column is added to assign a consistent building use label to all points in that layer. Once data has been collected for the entire study area, point layers are joined to the footprint layer using the spatial join functionality in QGIS.
Figure 3 shows several categories of building use types derived from the mid-1920s Sanborn maps. Several patterns become immediately obvious. First, UChicago’s footprint is quite small compared to today’s campus environment. While the University today occupies nearly everything south of 55th Street and west of Woodlawn Avenue, the mid-1920s UChicago appears centered around the Main Quadrangle at 58th Street and Ellis Avenue. Additionally, several clusters of hotels were dispersed across the neighborhood’s east. Today, decades after the fall of apartment hotels due to monetary struggles and purchase by UChicago for use as dormitories, only three hotels remain (Otto and Poag, 2023). Additionally, Lake Park Avenue south of 55th Street appears to once have housed a large ice manufacturing facility which is now a collection of enclosed semi-gated single-family townhomes (Figure 3). Digitized 1920s Sanborn building footprints with building uses in Hyde park.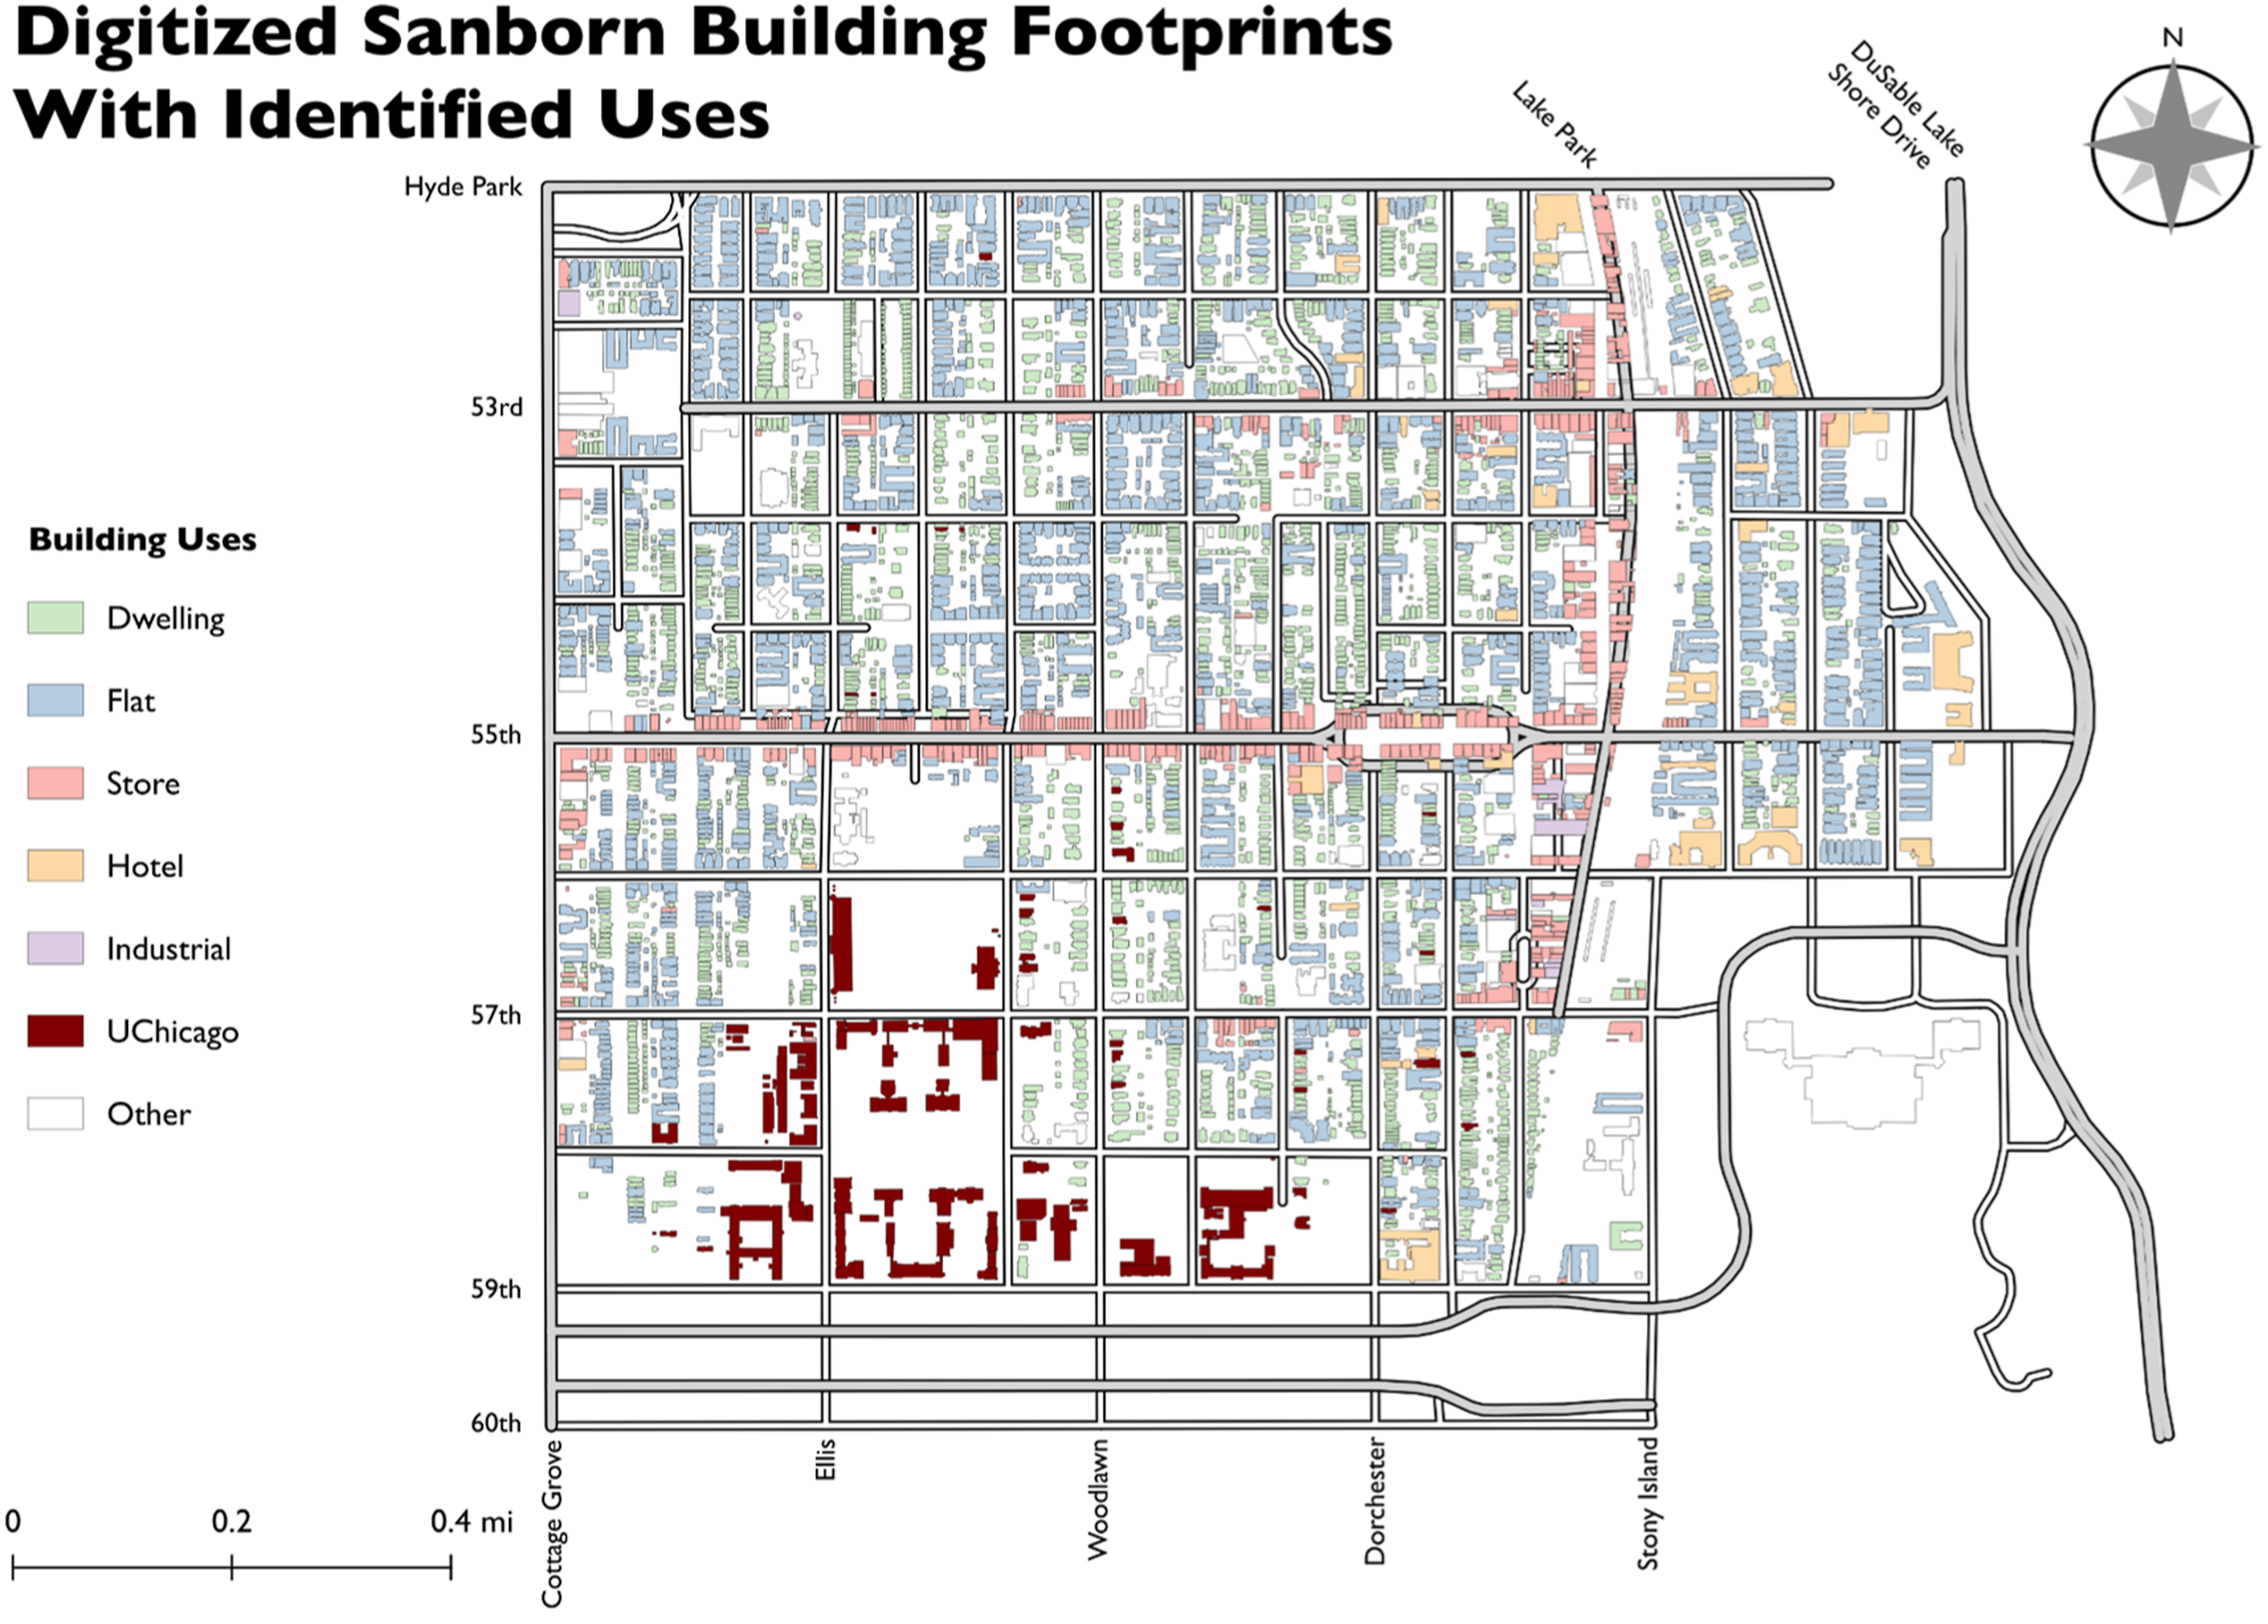
The sheer quantity and extent of Hyde Park’s historical commercial space is also evident from this map, with a robust and uninterrupted corridor of dozens of shops along 55th Street and Lake Park Avenue. During urban renewal, Lake Park Avenue was widened and rerouted to curve along the elevated railroad tracks, demolishing every building in its path. Along 55th Street, all but six buildings were demolished and replaced by parks or single-family townhomes. Both choices, to this day, ensure that the dense, vibrant commercial corridors that once defined Hyde Park can never be rebuilt without immense cost. Accompanying this change in the distribution of commercial activity between historical and modern Hyde Park is a drastic difference in footprint scale. While today much of 55th Street’s commercial space is located within very large buildings (such as Campus North Residential Commons at University Avenue or the Hyde Park Shopping Center at Lake Park Avenue), traditionally the commercial architecture neighborhood-wide resembled wall-to-wall rowhomes with many small (yet distinct) spaces packed together. Almost none of these buildings survived the urban renewal era outside of small clusters along 53rd Street and 57th Street. Figure 4 shows a direct comparison of commercial building footprints from 1925 to 1926 and 2020. The map also shows that there were, notably, no official parks within the neighborhood barring the UChicago Main Quadrangle and small patches of undeveloped land, likely due to the close proximity of two major parks (Washington Park and Jackson Park) on the west and east sides of the neighborhood. Today, several open green spaces can be found throughout Hyde Park which, when compared to the 1920s maps, have replaced dense housing and commercial space. Commercial building footprints from 1925 to 1926 compared to 2020 in Hyde Park, Chicago.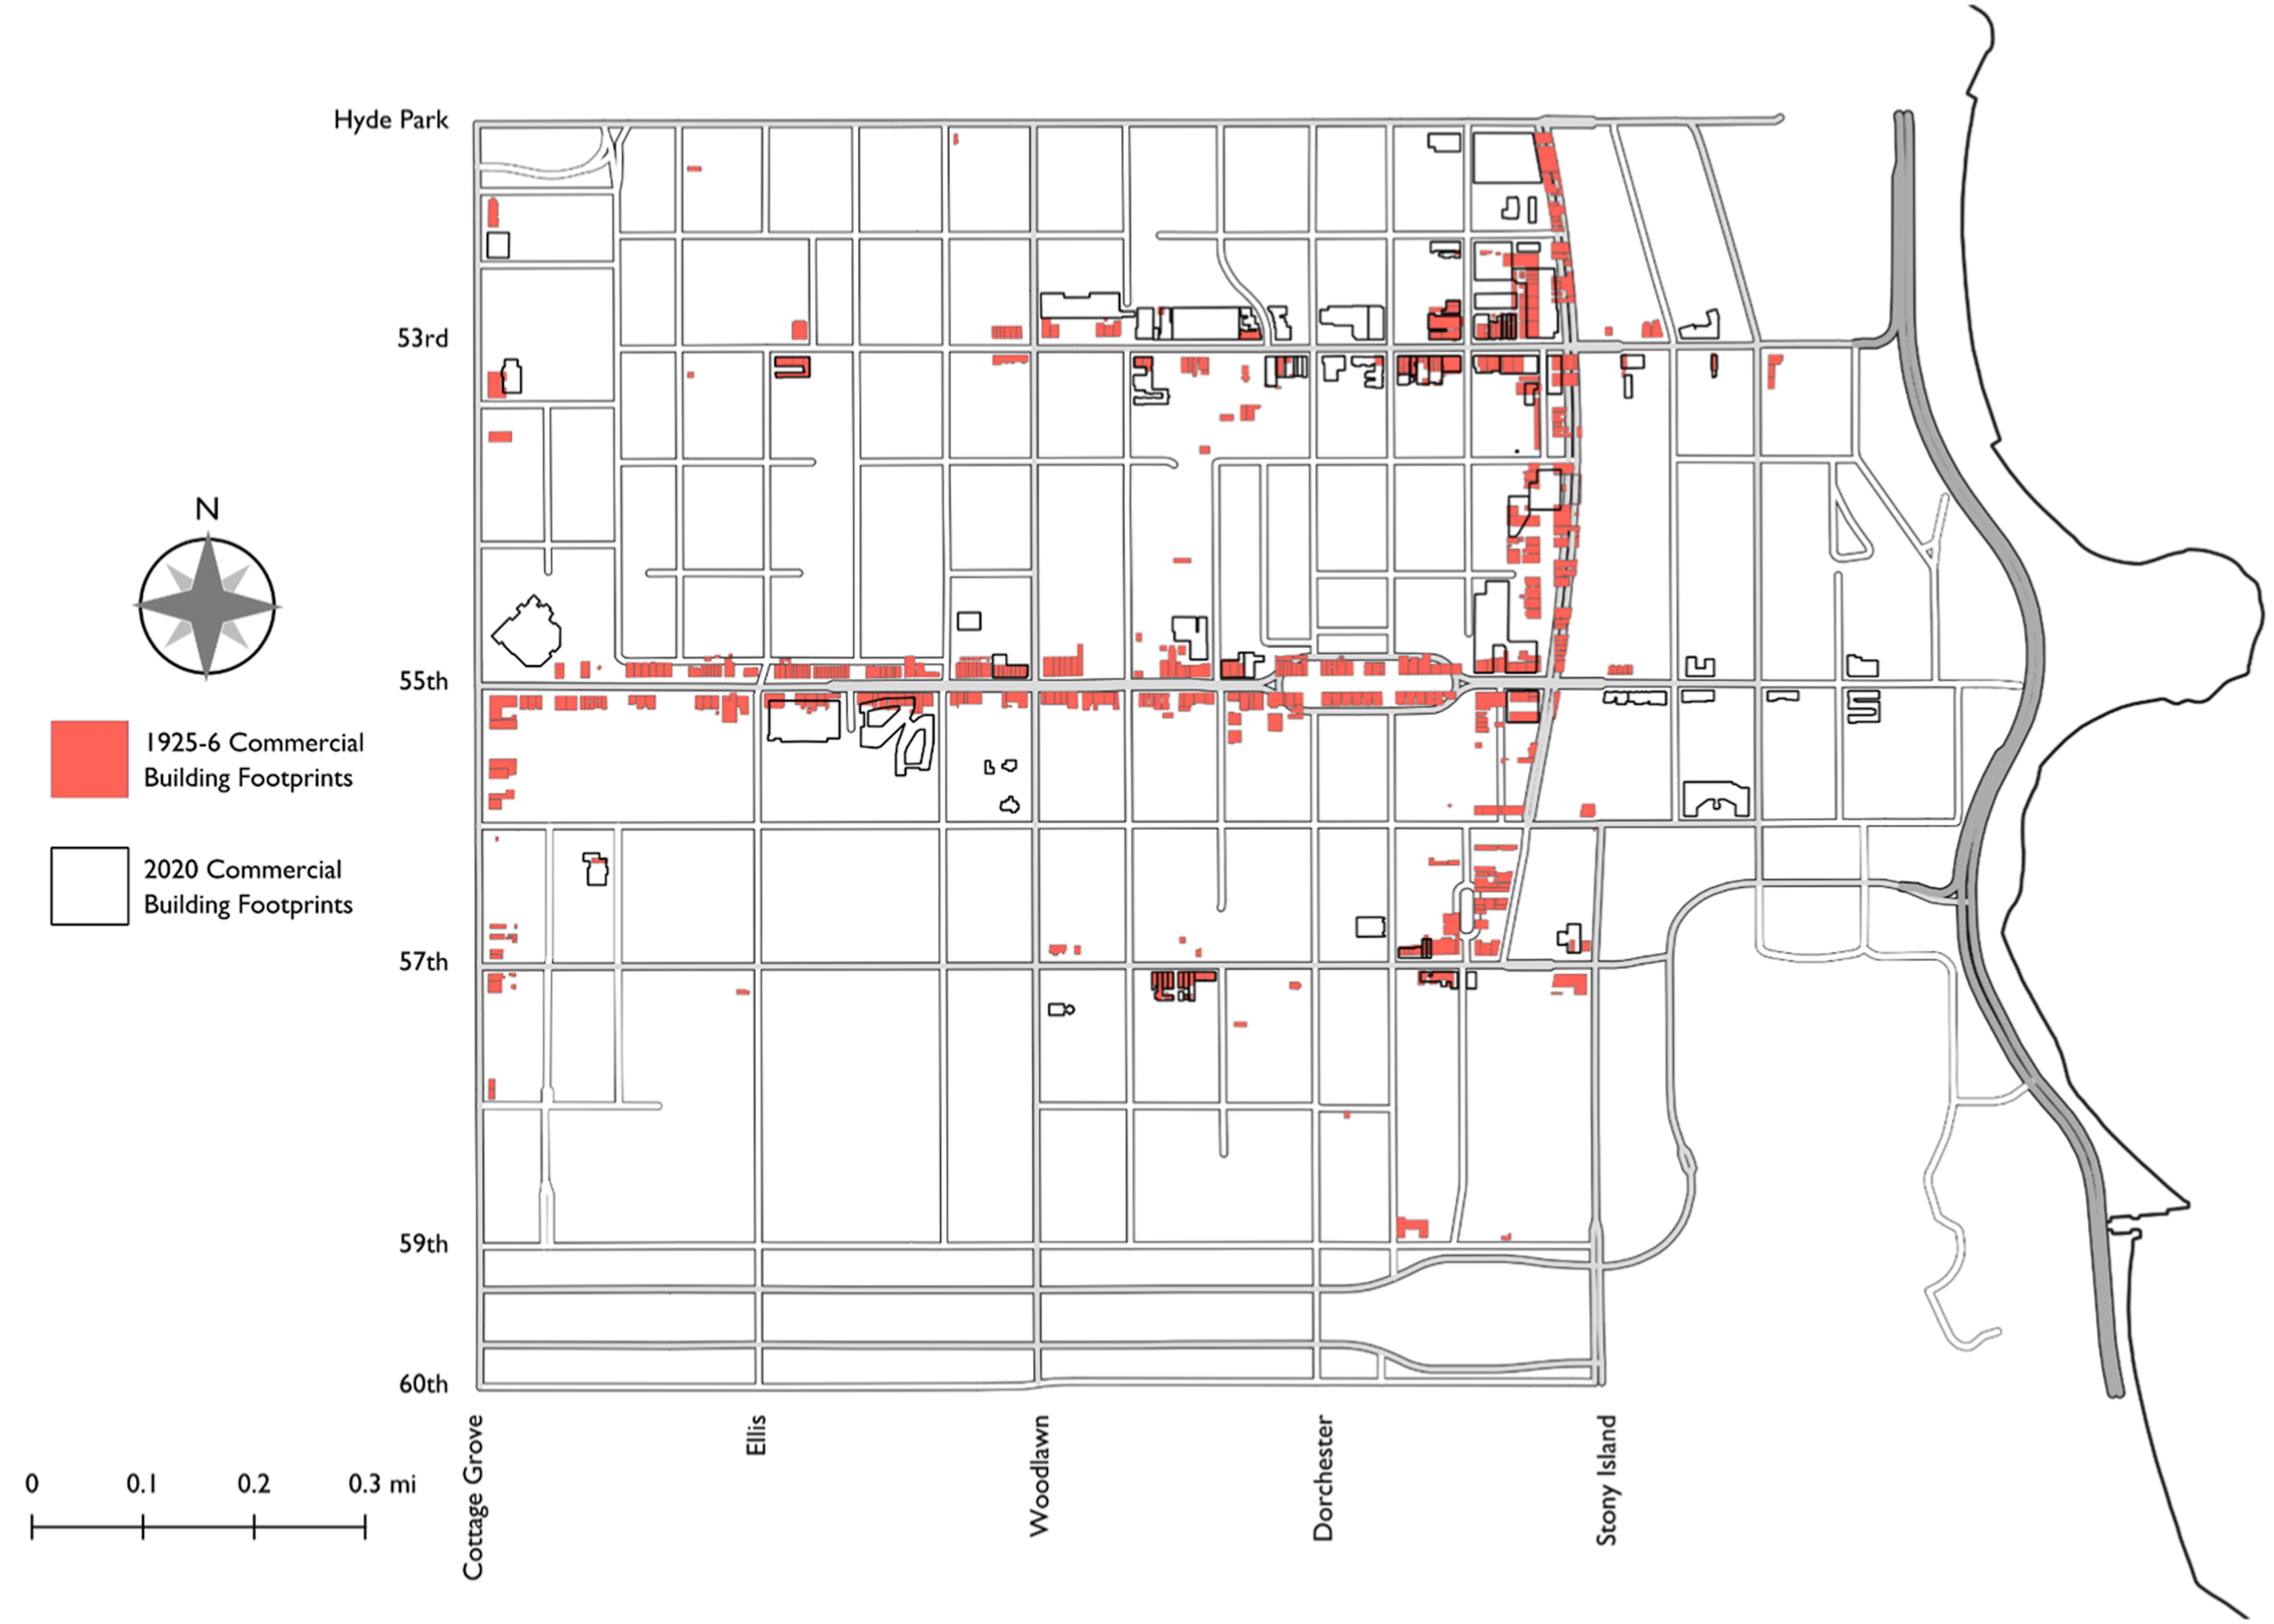
Discussion and conclusions
The proposed computational workflow for digitizing Sanborn Fire insurance maps has several advantages in accuracy and processing efficiency. Unlike machine learning-based approaches, it does not require large training datasets, allows for high-resolution inputs, and achieves a median processing time of around 7 seconds to transform a georeferenced Sanborn map into vectorized building footprints. While some manual corrections may be desired before digital display, this process of quality control is significantly faster when polygons are already 97% correct on average, as opposed to hand-tracing each polygon from scratch. The binary masking and filtration approach also proved robust across varying scan quality. The wide-ranging color differences caused by imperfect Sanborn scans did not warrant much tweaking of workflow parameters to produce acceptable results, with only two moderate parameter adjustments across all 33 Hyde Park maps. Together, these efficiencies mean that the scale of Sanborn digitization can be increased to effectively create historical digital twins of entire neighborhoods, towns, or cities, enabling meaningful comparison with contemporary building-level data. This type of digitization may also be applied to other historical maps (like Rascher Fire Insurance Maps) provided they share comparable visual characteristics such as bright-colored backgrounds, colored building footprints, and black outlines.
Beyond its technical contributions, this research opens broader possibilities for understanding urban change. The building footprint data produced by our workflow extends well beyond classification of building use as demonstrated in our case study. It enables a range of spatial analyses including building size, lot coverage, density measures, building setbacks, and street morphology, which offer a more comprehensive picture of how the built environment has changed over time. These analytical possibilities become particularly powerful when applied at the scale of entire neighborhoods or cities, as our workflow is designed to support. More broadly, by documenting the changes that have occurred across our urban history using Sanborn maps and ensuring that people can reckon with the scale of destruction and displacement embedded in that history, we offer a tool for confronting the systemic injustices that continue to shape our cities today. The methodology pioneered by this research can serve as a model for bringing digitized Sanborn maps and their valuable historical data out of specialized environments and into the hands of those affected by these histories. Providing this education is paramount so that we may never forget the people, infrastructure, and places that were taken from our communities. By remembering, our hope is that we do not make the same mistakes again. The Chicago Urban Heritage Project is rising to this challenge and has already applied this workflow to map many of Chicago’s key neighborhoods (see Figure S4 for Woodlawn, Figure S5 for Greater Grand Crossing, Figure S6 for Kenwood, and Figure S7 for Logan Square).
This study is not without limitations. While the computational workflow performs well at extracting building footprints from Sanborn maps with straight grids and regular building angles, the model struggles on diagonal streets, curved streets, and curved building features (e.g., semi-circular bay windows and building turrets). To preserve these features in cities where they are more common, one could forgo the pixel length filtering step while increasing the minimum area filtering parameters to compensate—although this could lead to lower overall accuracy. More fundamentally, extending the workflow to cities with diagonal or curved street grids would likely require either a more flexible polygon detection approach that does not presuppose orthogonal geometry (Jung et al., 2025) or changing the kernel shapes used throughout our workflow from squares to ellipses. In addition, parsing pixel columns and rows to exclude text and dashed lines, intended to reduce noise, introduces a tradeoff between preserving the rich visual vocabulary of Sanborns (e.g., dashed lines for interior partitions, hash marks for windows, and text for building usages) and extracting building footprints at scale. Future work could explore more advanced filtering approaches, such as selective masking from signal processing (Hosotani et al., 2015; Miller et al., 2026), to better denoise while preserving the fine-grained map symbology.
The workflow also faces limitations in capturing certain visual features in Sanborn maps. Currently, it cannot distinguish facade information encoded through layered colors in Sanborn maps, such as a wood frame structure with an iron facade indicated by overlapping color fields. Distinguishing these layered color combinations would require more sophisticated color segmentation approaches beyond the scope of the current workflow, but represents a promising direction for future research that could enable a richer extraction of building material and construction data from these historical maps. Another limitation concerns the paste-in correction sheets commonly found on Sanborn maps, where the Company used pasted paper to cover buildings that had changed or been removed (Swab, 2023). Our workflow can extract currently visible features, including pasted-over areas, but cannot recover what existed beneath correction sheets without substantial image pre-processing to enhance these features. However, researchers can leverage multiple volumes published across different years to trace features covered by paste-ins in later editions. Future work could explore integrating information across multiple map editions.
The workflow presented here requires some human interventions as part of the quality control process. This includes manual correction following post-processing, and occasionally adjusting pixel detection parameters to account for varying qualities/techniques in scanning (although parameters generally remain consistent for each atlas assuming all sheets are from the same source and date). These interventions, while small, are necessary to ensure data accuracy. Future research and improvements of this workflow may seek to address these limitations. One potential avenue is to combine the time-saving elements of this workflow in extracting footprints with the automated extraction of building use and height information through machine learning (Lin et al., 2023). Moreover, our current workflow relies on maps being georeferenced manually. There is an expanding literature that could be helpful in reducing the time and resources needed for georeferencing, through methods such as crowdsourcing (Cox, 2023) or more automated approaches using object detection (Shensky et al., 2024).
Supplemental material
Supplemental material - Computational mapping of historic built environments in American cities from Sanborn maps: A case from the Chicago Urban Heritage Project
Supplemental material for Computational mapping of historic built environments in American cities from Sanborn maps: A case from the Chicago Urban Heritage Project by Parker Otto and Yue Lin in Environment and Planning B: Urban Analytics and City Science
Footnotes

Funding
The authors received no financial support for the research, authorship, and/or publication of this article.
Declaration of conflicting interests
The authors declared no potential conflicts of interest with respect to the research, authorship, and/or publication of this article.
Data Availability Statement
Supplemental material
Supplemental material for this article is available online.
Author biographies
References
Supplementary Material
Please find the following supplemental material available below.
For Open Access articles published under a Creative Commons License, all supplemental material carries the same license as the article it is associated with.
For non-Open Access articles published, all supplemental material carries a non-exclusive license, and permission requests for re-use of supplemental material or any part of supplemental material shall be sent directly to the copyright owner as specified in the copyright notice associated with the article.
