






Abstract
The development of functions within cities determines the intensity of spatial reorganization. Therefore, the quantitative analysis of urban functions is of importance. However, existing methods for quantifying urban functions remain underexplored. To bridge this gap, we propose a distance gradient-based approach to quantitatively analyze urban functional development. Specifically, we introduce a shift-share model to compute the distance gradients of different urban functions across cities. Then, an empirical study is conducted using Points-of-Interest (POI) data from the Yangtze River Delta urban agglomeration for 2013 and 2022 as the primary dataset. The varying gradient values indicate whether urban functions develop through trade-offs or synergy. The contributions of this study are: (1) We provide a more refined classification of urban functions compared to the coarse categorization used in existing methods; (2) The use of the shift-share model allows for a quantitative assessment of urban functional development; and (3) To explore reasons behind the distance gradients, we employ the SHAP model to analyze the driving factors behind the gradient effects. By applying our approach to the Yangtze River Delta, our findings indicate that urban functional evolution exhibits distinct distance-dependent patterns, with trade-offs and synergies varying across spatial scales. Additionally, nighttime light intensity and road network density changes play significant roles in shaping spatial reorganization.
Keywords
Introduction
Spatial reorganization is the advanced stage of urban development. Spatial reorganization contains various types of urban functions, and the functions of each city have spatial heterogeneity. In the process of spatial reorganization, due to industry, location, policy, and other reasons, there are trade-offs/synergies between functional development, that is, in the evolution process of these functions, there is a certain trend of mutual attraction, migration, and loss (Liu et al., 2023; Yang et al., 2023). Scholars have measured the functional trade-offs/synergies from many aspects, among which the research on the measurement of the production–living–ecological function has occupied a dominant position in recent years (Huang et al., 2022; Pang et al., 2022; Xue et al., 2022; Zhang et al., 2022). In addition, many scholars have conducted separate studies on cultivated land and ecosystems (Jafarzadeh et al., 2021; Qian et al., 2020; Wang et al., 2023; Xue and Ding, 2023). However, the research based on the fine division of urban functions is still not deep enough, and the problem of urban function mismatch frequently occurs (Gao et al., 2024; Lin et al., 2023; Schrammeijer et al., 2022). This brings challenges to the optimal layout of refined urban functions.
In recent years, with the application of big data, the methods of fine division of urban functions have become increasingly mature (Miao et al., 2021; Niu and Silva, 2021). It is proposed that the urban function trade-offs/synergies analysis based on big data become possible. In terms of methods, the mainstream methods include pearson (Li et al., 2021; 2023b), spearman (Li et al., 2023a; Zhang et al., 2021) correlation coefficient, global spatial autocorrelation (Gao et al., 2024), and local spatial autocorrelation (Jia et al., 2023; Shao and Li, 2021). However, these methods are mainly based on various land use types and related statistical indicators to express the intensity of function. In fact, if observed from the perspective of spatial reorganization, functional strength can’t be simply calculated as an indicator of calculation of trade-offs/synergies, but the competitiveness of these functions within the region and whether the regional arrangement of functional development structure is reasonable should also be comprehensively considered. Although the indicators used to calculate functional strength have been rigorously evaluated, the indicators used to calculate functional strength have different dimensions (Huang and Wu, 2023; Shao et al., 2022).
However, from the perspective of spatial reorganization, urban functions can’t exist in isolation, that is, these urban functions exist competition with other functions in different distance gradient (Li and Long, 2018; Shi et al., 2020; Yu et al., 2018). The trade-offs/synergies analysis of factors are important for the adjustment of development strategies of various urban functions in the next planning period. Therefore, a new model is needed to consider the measurement and objective comparison of spatial reorganization factors. Shift-share model is a relatively mature model of regional development, which was first proposed by American economist Creamer (1943). Since 1960, it is has been widely used by regional science, geography, and other multidisciplinary studies to classify the growth of population, employment, productivity, income, and other indicators according to sources, and also decompose the growth of indicators into three components: national share component, industrial mix component, and regional shift component (Dembińska et al., 2022; Li et al., 2017; Montania et al., 2023; Nazara and Hewings, 2004; Shi et al., 2007).
Materials and methods
Materials
As shown in Figure 1, the Yangtze River Delta urban agglomeration, an internationally renowned typical urban agglomeration, is selected as research area. The industrial structure in the region is diversified and the city cooperation and integration are close. It includes 307 county-level administrative units. Electronic map point of interest (POI) refers to the point data in the electronic map that contains the name, type, coordinate and other information (Liu et al., 2021), for example, hospital, schools, and shopping malls marked in the electronic map. We selected the POI data of 2013 and 2022 as the basic data to identify urban functions, and used Amap as the source of POI acquisition (https://www.amap.com/). The initial data obtained is 9331943 POI in 2013 and 9530219 POI in 2022. Although the number of POI varies greatly, considering that urban functions increase and disappear all the time, the mainstream POI based function identification method is to synthesize the POI of a region to determine the dominant function type of the region (Li et al., 2023b; Sun et al., 2021). Therefore, the disappearance, addition and location change of POI in different periods don’t significantly affect the accuracy of function identification (Li et al., 2023c; Shi et al., 2020). Research area and POI data.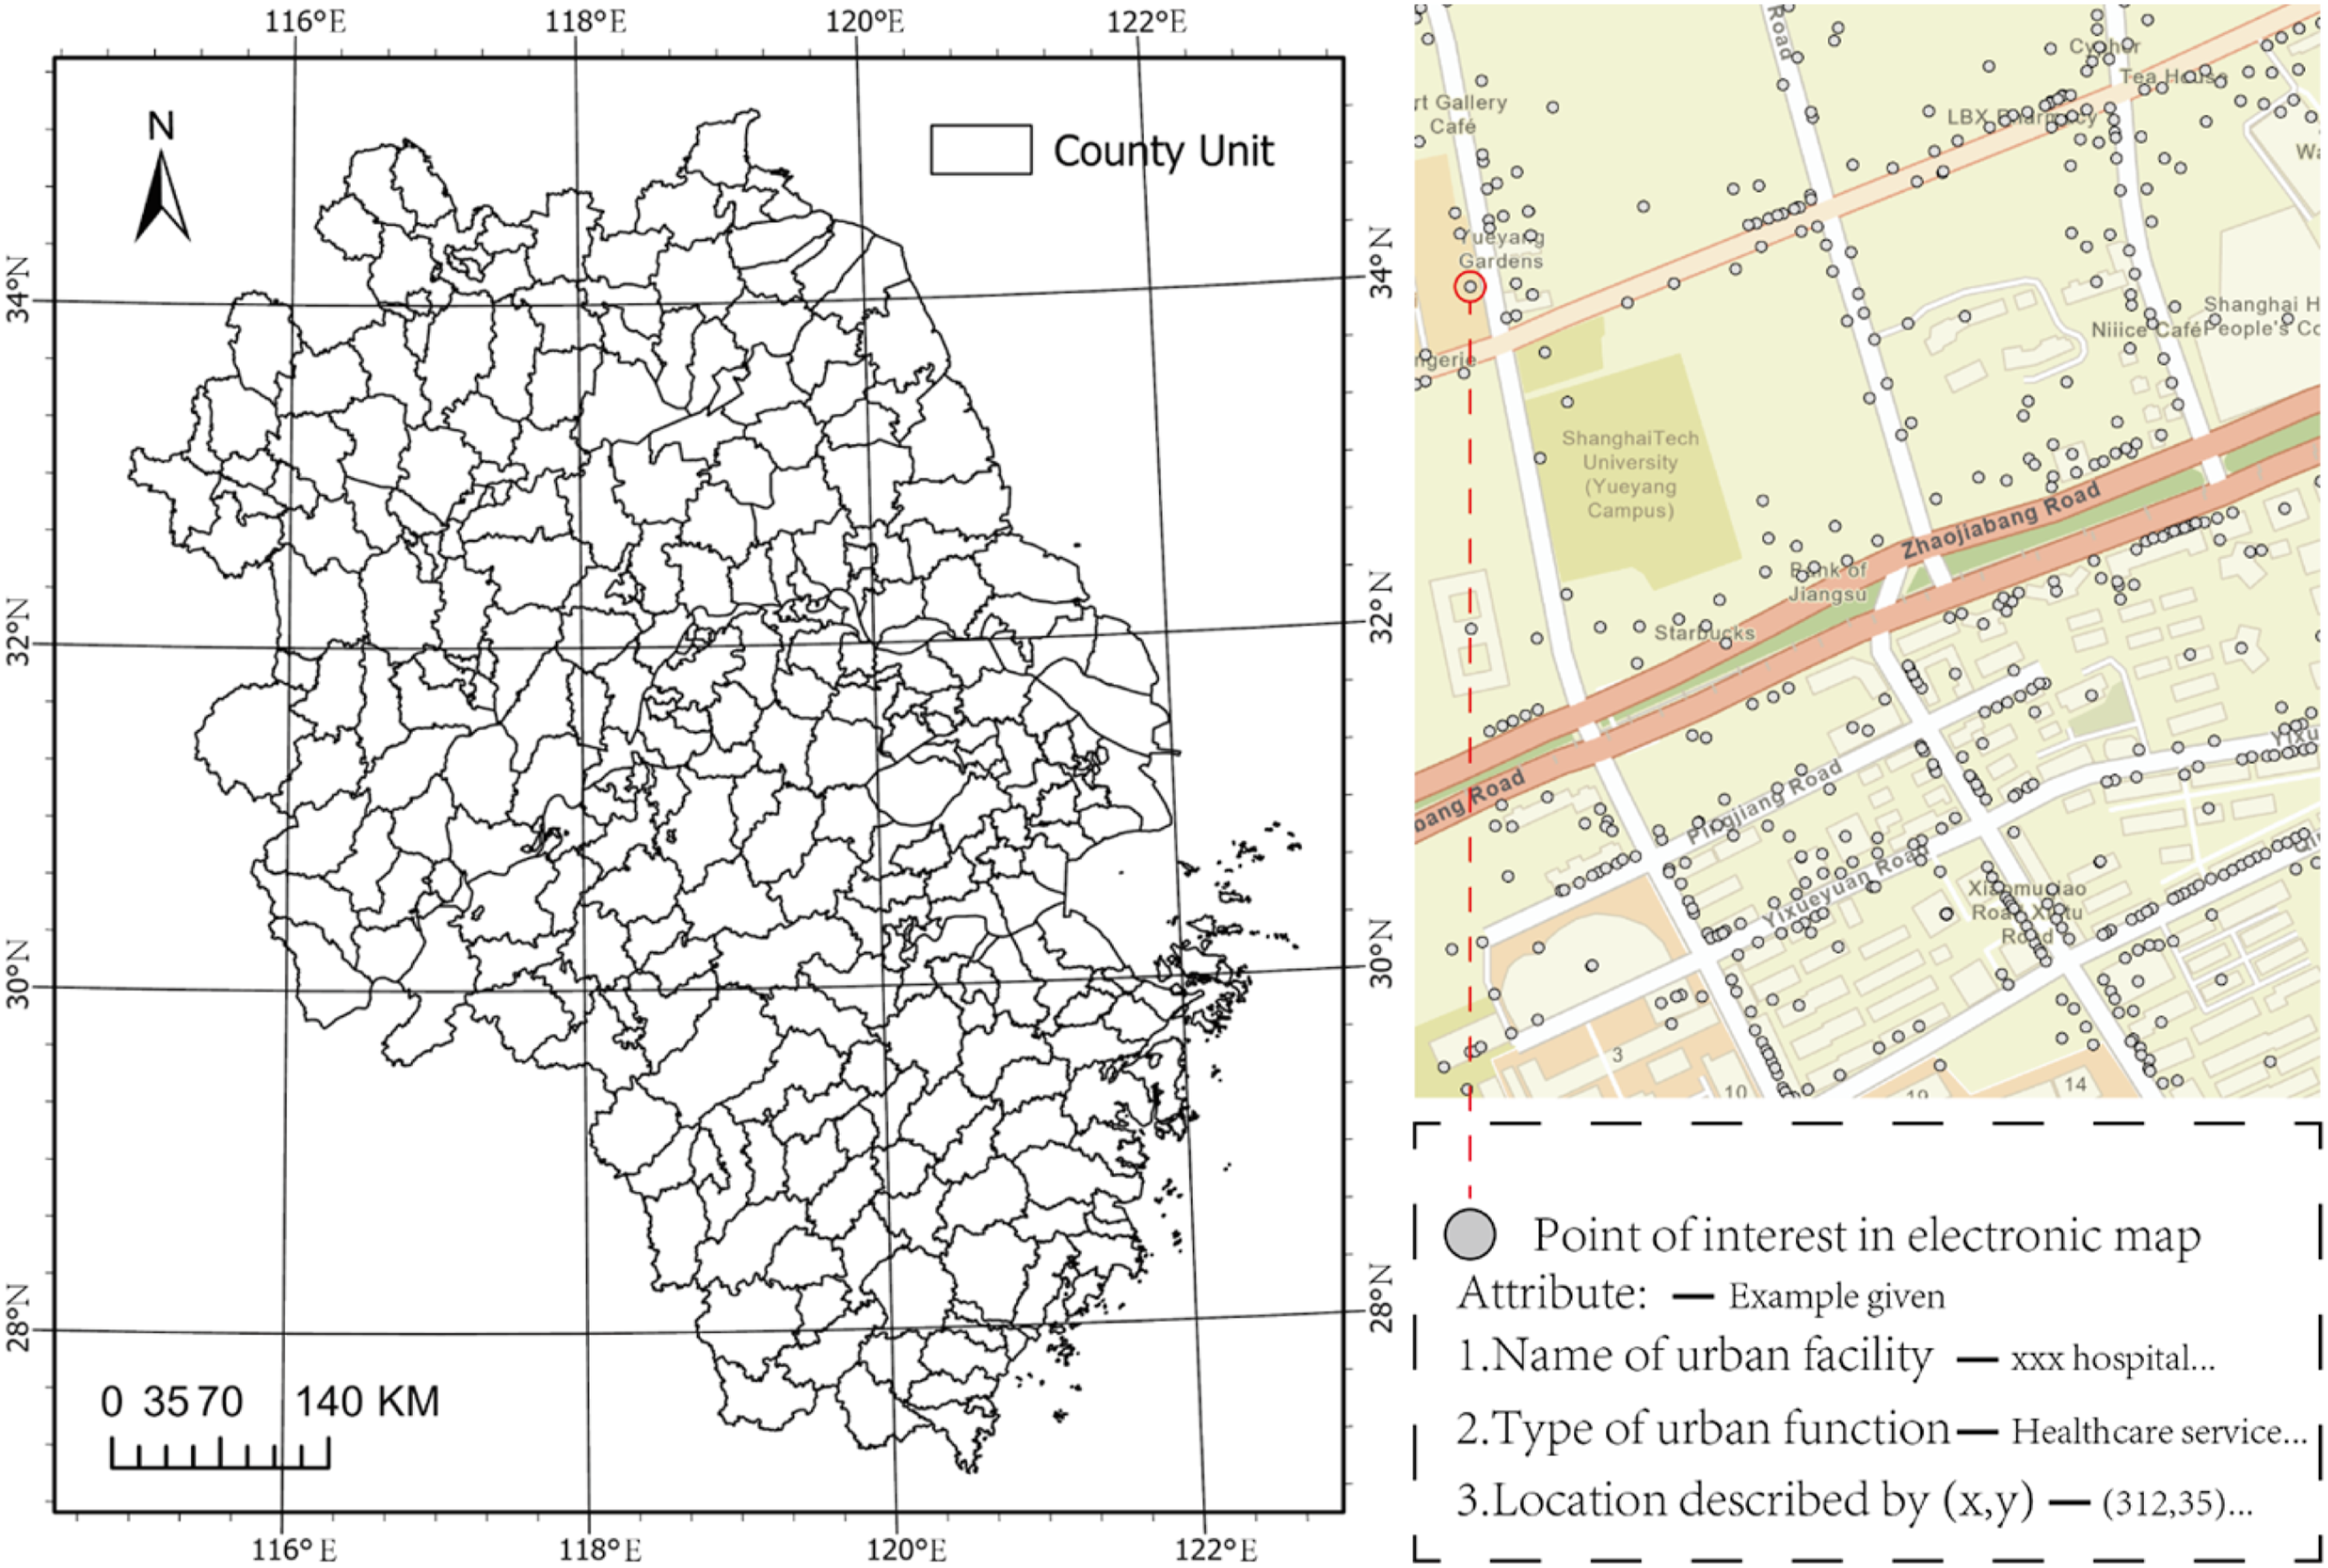
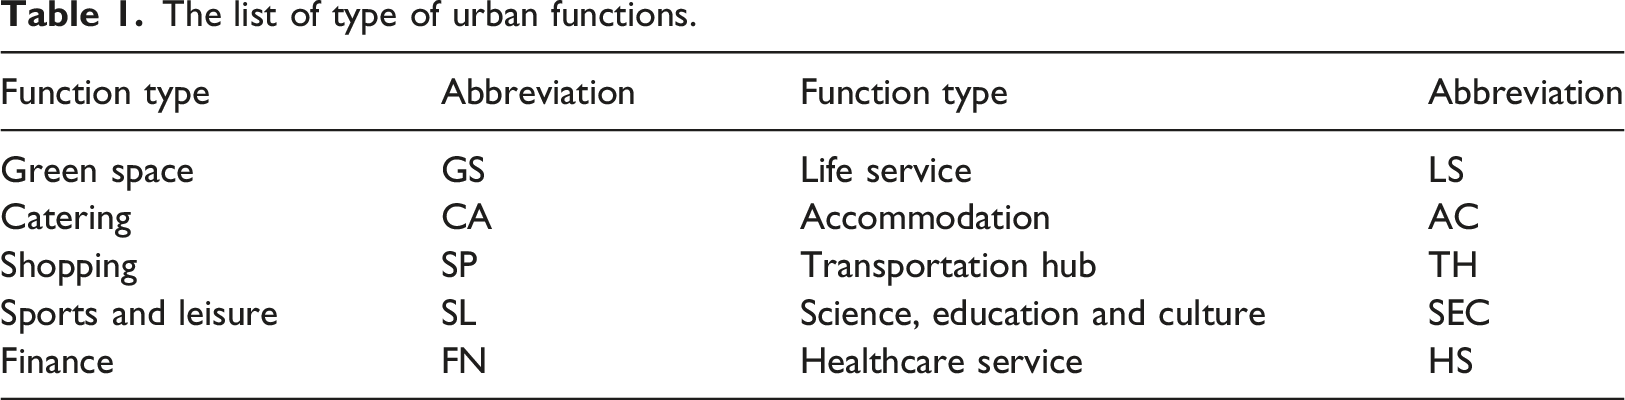
The list of type of urban functions.
Other data used: (1) Administrative division data, obtained from https://gadm.org, are used to determine the extent of the study area. (2) Nighttime light data, obtained from https://eogdata.mines.edu/products/vnl, are used to calculate the density of urban nighttime light. (3) Road data obtained from https://www.openstreetmap.org/ are used to calculate the density of urban road network. (4) Population data, obtained from statistical yearbook. (5) Gross Domestic Product (GDP) data, obtained from statistical yearbook. The dates of these data are consistent with POI data.
Methods
Model’s framework
The model is mainly used to study the different functional areas of spatial reorganization. It can help planners and decision makers understand the dynamic relationships between cities, so as to better carry out urban planning and management work. As shown in the technical process in Figure 2, the functional interaction model framework we built first needs to determine the base region and its superior region. Urban agglomeration is taken as the superior region and county as the base region. Then we collect POI data, population data, nighttime light data, GDP, and road data in the extent of research area; The Place2vec functional subdivision model, Shift-share model, trade-offs/synergies analysis, and SHAP model were used to carry out calculations, so as to complete the functional space interaction and its driving force analysis; The format of the input and output data is described in the data format of Figure 2, (A) -- B(B belongs to A)-- specific data-format. The framework of model.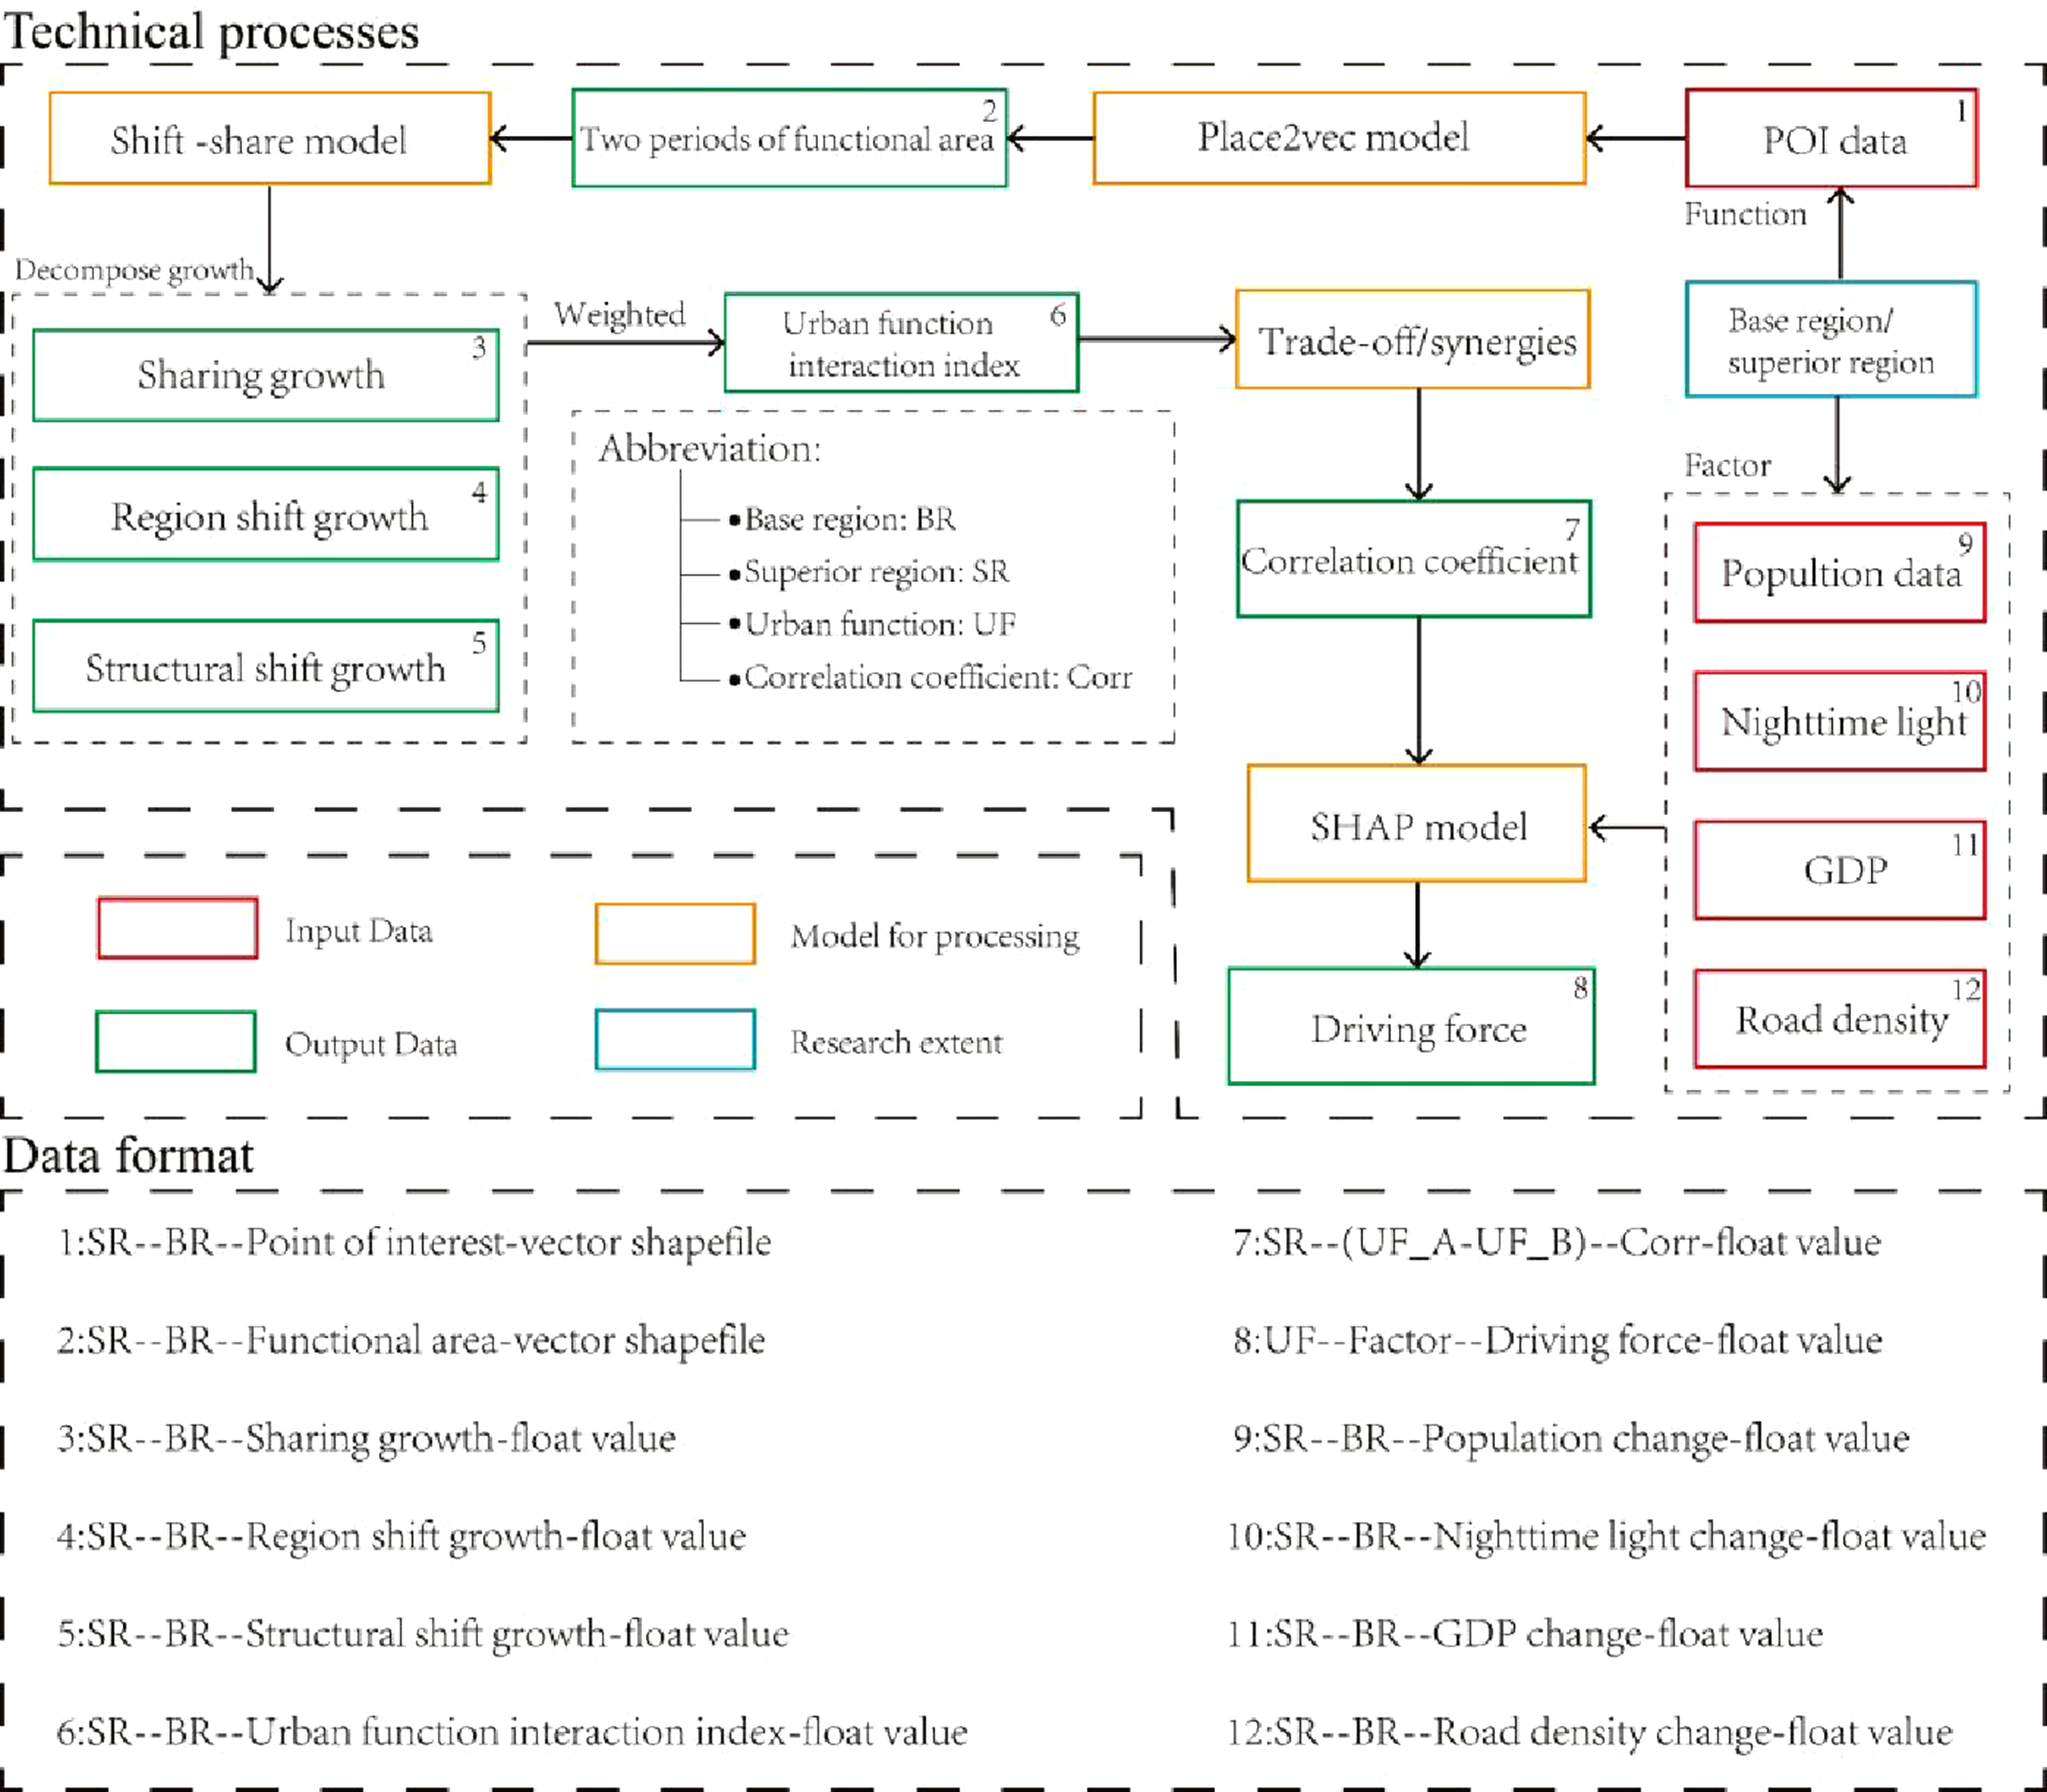
Identification of urban function
Zhai et al. (2019) proposed a Place2vec model based on Word2vec. This method considers the spatial neighbor relationship between POI and is a mature method to identify functional areas based on POI. This approach doesn’t initially subdivide functions, but simply divides them into broad types. But Li et al. (2022) confirmed that this method also has a good performance in functional subdivision. Therefore, we used this model to identify the functions on the basis of fine division of types.
Then considering the various functional divisions within different spatial reorganization, grid is adopted as the identification unit to ensure the universality of the model. Further, considering that too large scale is too comprehensive, and too small scale has low computational efficiency. By comparing the grid scales commonly used to identify functional areas such as 10 km, 5 km, 1 km, 500 m, and 250 m, finally 1 km
Calculation of functional indicators for spatial reorganization
The Shift-share model can decompose the economic growth of a region into two parts: shift and sharing, so as to explain the cause of regional economic development and decline, and determine the direction of regional industrial adjustment and economic development planning in the future (Nazara and Hewings, 2004). It is based on the premise of spatial disequilibrium, only in the state of spatial disequilibrium, there is the transfer of elements (Krugman, 1992; Zhao et al., 2024a). Similarly, the shift of urban functions within the extent of urban agglomeration is also based on the premise of spatial disequilibrium, that is, there are obvious differences in the spatial distribution of various functions within urban agglomeration.
Therefore, we assume that the growth of a certain type of urban function can be decomposed into shared growth, regional shift growth, and structural shift growth (the latter two are part of shift growth) like economic variables so that the indicators of functional trade-offs/synergies can be calculated with the help of this model.
According to the relative relationship between shift growth and sharing growth in the model, if there is no element shift between regions, then each region shares the growth of the superior region at the same growth rate, and there is no shift growth. Therefore, the first two are used to represent the intensity of spatial reorganization, and functional sharing growth is used as a standard parameter to measure the intensity of regional reorganization. The following are the calculation metrics used in the spatial reorganization analysis model and the specific introduction of the model: (1) Region shift growth of function (2) Function sharing growth (3) Structural shift growth of function (4) Urban function index



Here we construct an index-Urban function index (UFI) and use it to reflect the overall characteristic of spatial reorganization. We refer to shift share ratio (Dong and Li, 2022) to reflect the moderating strength of the shift component on the share volume. The difference from the original formula is that: further considering regional differences, we use the entropy weight method to calculate the weights of these indicators in spatial reorganization in different regions. It is assumed that the greater the degree of dispersion of indicators, the greater the influence on UFI (Liu and Yan, 2024). Accordingly, each indicator corresponding a certain type of function in each region will be weighted. In addition, to prevent the calculation of 
Trade-offs/synergies of functional indicators
Referring to the expression of functional trade-offs/synergies in existing literatures (Lyu et al., 2022), we used spearman correlation coefficient to calculate the trade-offs/synergies relationship in the process of functional evolution of urban agglomeration, that is, whether there are two functional indicators: synergy or trade-off, the formula is as follows:
SHAP model for driving force of trade-offs/synergies
SHAP (Shapley Additive explanations) is a game theory approach used to explain the driving forces of a model (Lundberg and Lee, 2017; Strumbelj and Kononenko, 2010). It uses the Shapley value, developed by Shapley, to characterize the contribution of a feature to the outcome, that is, the driving force (Mertens, 1994). Accordingly, we use this model to calculate the driving forces that influence the spatial reorganization. The factors used to calculate driving forces include population, GDP, nighttime light density, and road density, which are basic indicators that reflect the level of urban development. We use the SHAP library in Python3 to implement the calculation of this model (https://shap.readthedocs.io/en/latest/index.html), and the process is as follows: For a certain function, the trade-offs/synergies of UFI of each region of all spatial reorganization and possible driving factors are input into the SHAP model to get the driving force of the reorganization.
Analysis and results
Preliminary study on the distance gradient effect of functional trade-offs/synergies
As shown in Figure 3, in general, the distributed functions are mainly SEC, LS and HS in the middle distance and near distance. At a longer distance, although these functions still occupy a certain proportion, the proportion of other types of functional trade-offs/synergies has been significantly improved. Among them, there is a concentrated area (black circle area in the Figure 3) in (150-450 km), and there are relatively dense districts and counties in this region with trade-offs/synergies. This area happens to be the core area of the Yangtze River Delta. The functions of these regions that have trade-offs/synergies are mainly SEC, HS, LS. In addition, the relationships existing in these regions are mainly synergies between (150-350 km) and become trade-offs from (400-450 km). As for the strength of the trade-offs/synergies, it is not found that the strength of the synergistic effect is between 0.77 and 0.98, and the strength of the tradeoff effect is between −0.98 and −0.77 with the obvious change of the distance gradient. In general, when the distance increases, the number of trade-offs/synergies decreases significantly, and trade-offs dominate. The functional trade-offs/synergies of the Yangtze River Delta urban agglomeration are mainly based on the balance and coordination of science, education and cultural services, life services and medical services between the central core city and the surrounding city. The trade-offs/synergies distribution map based on the distance gradient (Distance unit: km, p value<=0.01).
Finely trade-offs/synergies distance gradient effect
Four stages of distance gradient effect
As shown in Figure 4, on the basis of 3.1, we further divided the distance gradient with a step length of 10 km, and found that there are four stages of functional trade-offs/synergies in the Yangtze Revier Delta: (1) First, in the (0-100 km) range, the number of functional trade-offs/synergies rapidly; (2) At this stage (100-350 km), the number of functional trade-offs/synergies reaches its peak, and there is a larger fluctuation compared with (1), but there is no significant upward or downward trend; (3) In this section (350-610 km), although the quantity fluctuation still exists, there is a relatively obvious downward trend in general; (4) At (610km-), the number is still declining, but the downward trend is not as obvious as in the previous stage, and there is a long tail feature, the distance gradient span is large, but the change is relatively small. Fine statistics of distance gradient effect of trade-offs/synergies (Distance unit: km, p value<=0.01).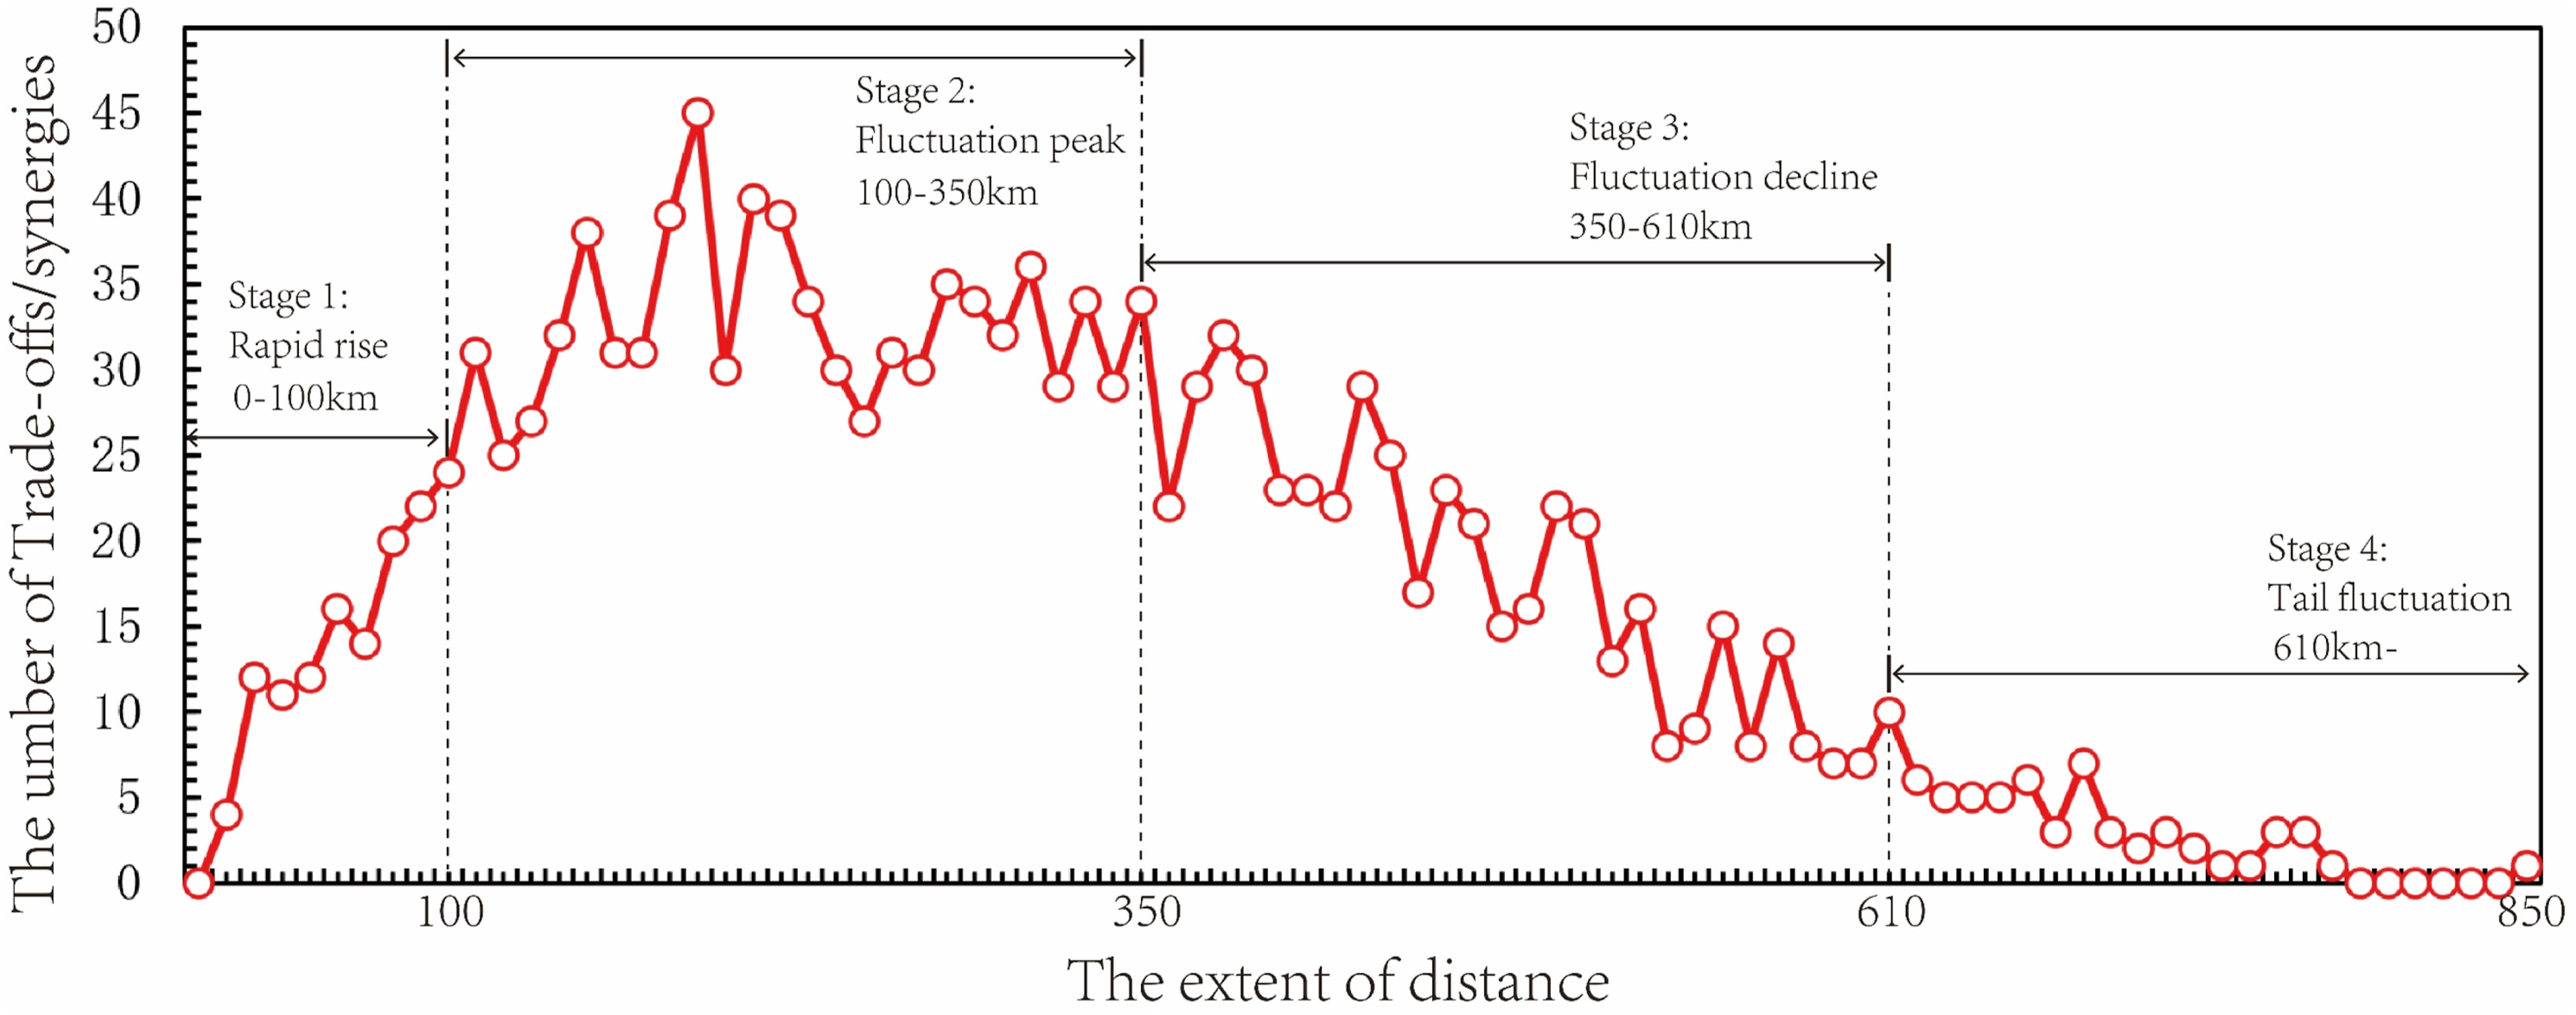
The main functions of four stages
As shown in Figure 5, we have counted the number of trade-offs/synergies of various functions in the four stages of 3.2.1, and the stage 1-stage 4 in the figure correspond to the serial numbers of the stages of 3.2.1. It can be found that, in general, these functions can be divided into three gradients in each stage. In each stage, the functions of the first gradient are HS, SEC, and LS, which are in line with the core functions in 3.1. The function of the second gradient are FN and CA. The functions of the third gradient are mainly TH, SP, AC, and GS. In the first stage and the second stage, the function of the first gradient is sorted as HS - SEC - LS; In the third stage and the fourth stage, the first gradient function is sorted as SEC - HS - LS. Four stages of the main functions of trade-offs/synergies (The values on the vertical axis represent the number of trade-offs/synergies).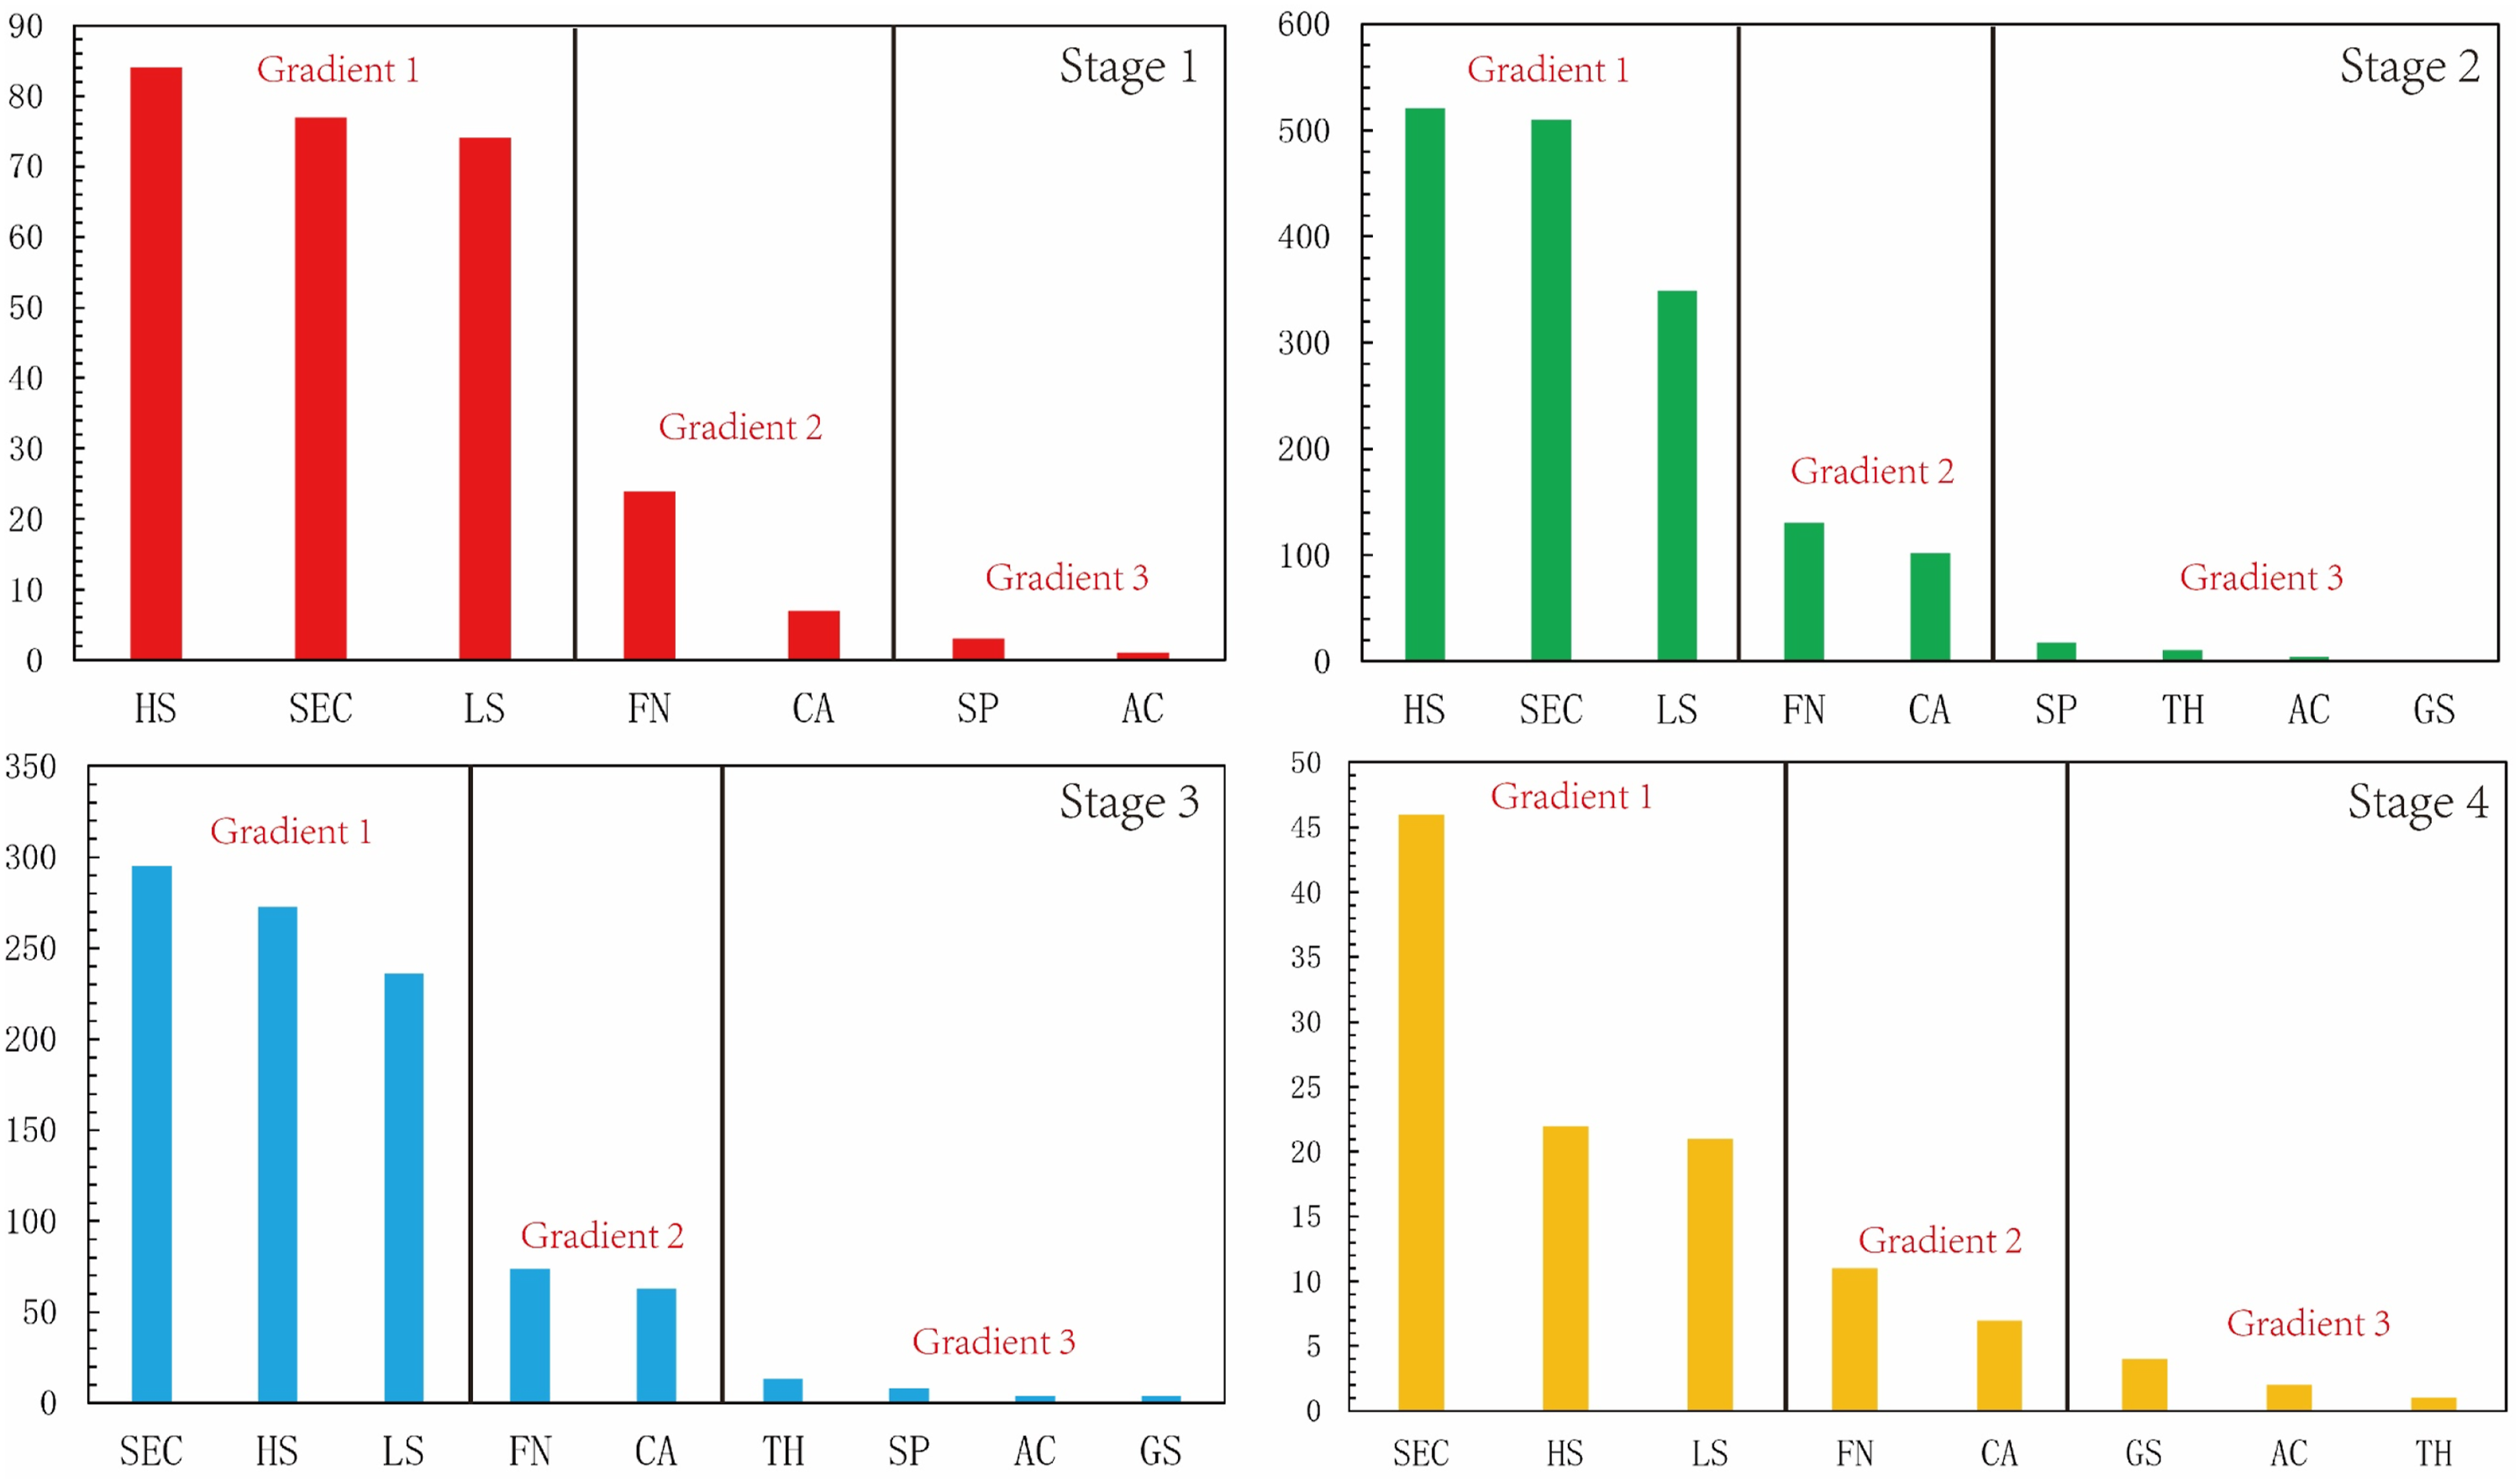
Driving force analysis of functional trade-offs/synergies
Overall driving force analysis
As shown in Figure 6, the effect of road density change (road_change) on functional trade-offs/synergies is weaker in short distance and middle distance than in long distance; The effect of nighttime light density change (night_change) on functional trade-offs/synergies was significantly stronger at middle distance than at long distance. The change of population (pop_change) has similar characteristics for functional trade-offs/synergies; However, the change of GDP (gdp_change) contributes more to trade-offs/synergies over long distances. The largest contribution of these four driving factors is still the road network density. Overall driving force contribution of trade-offs/synergies.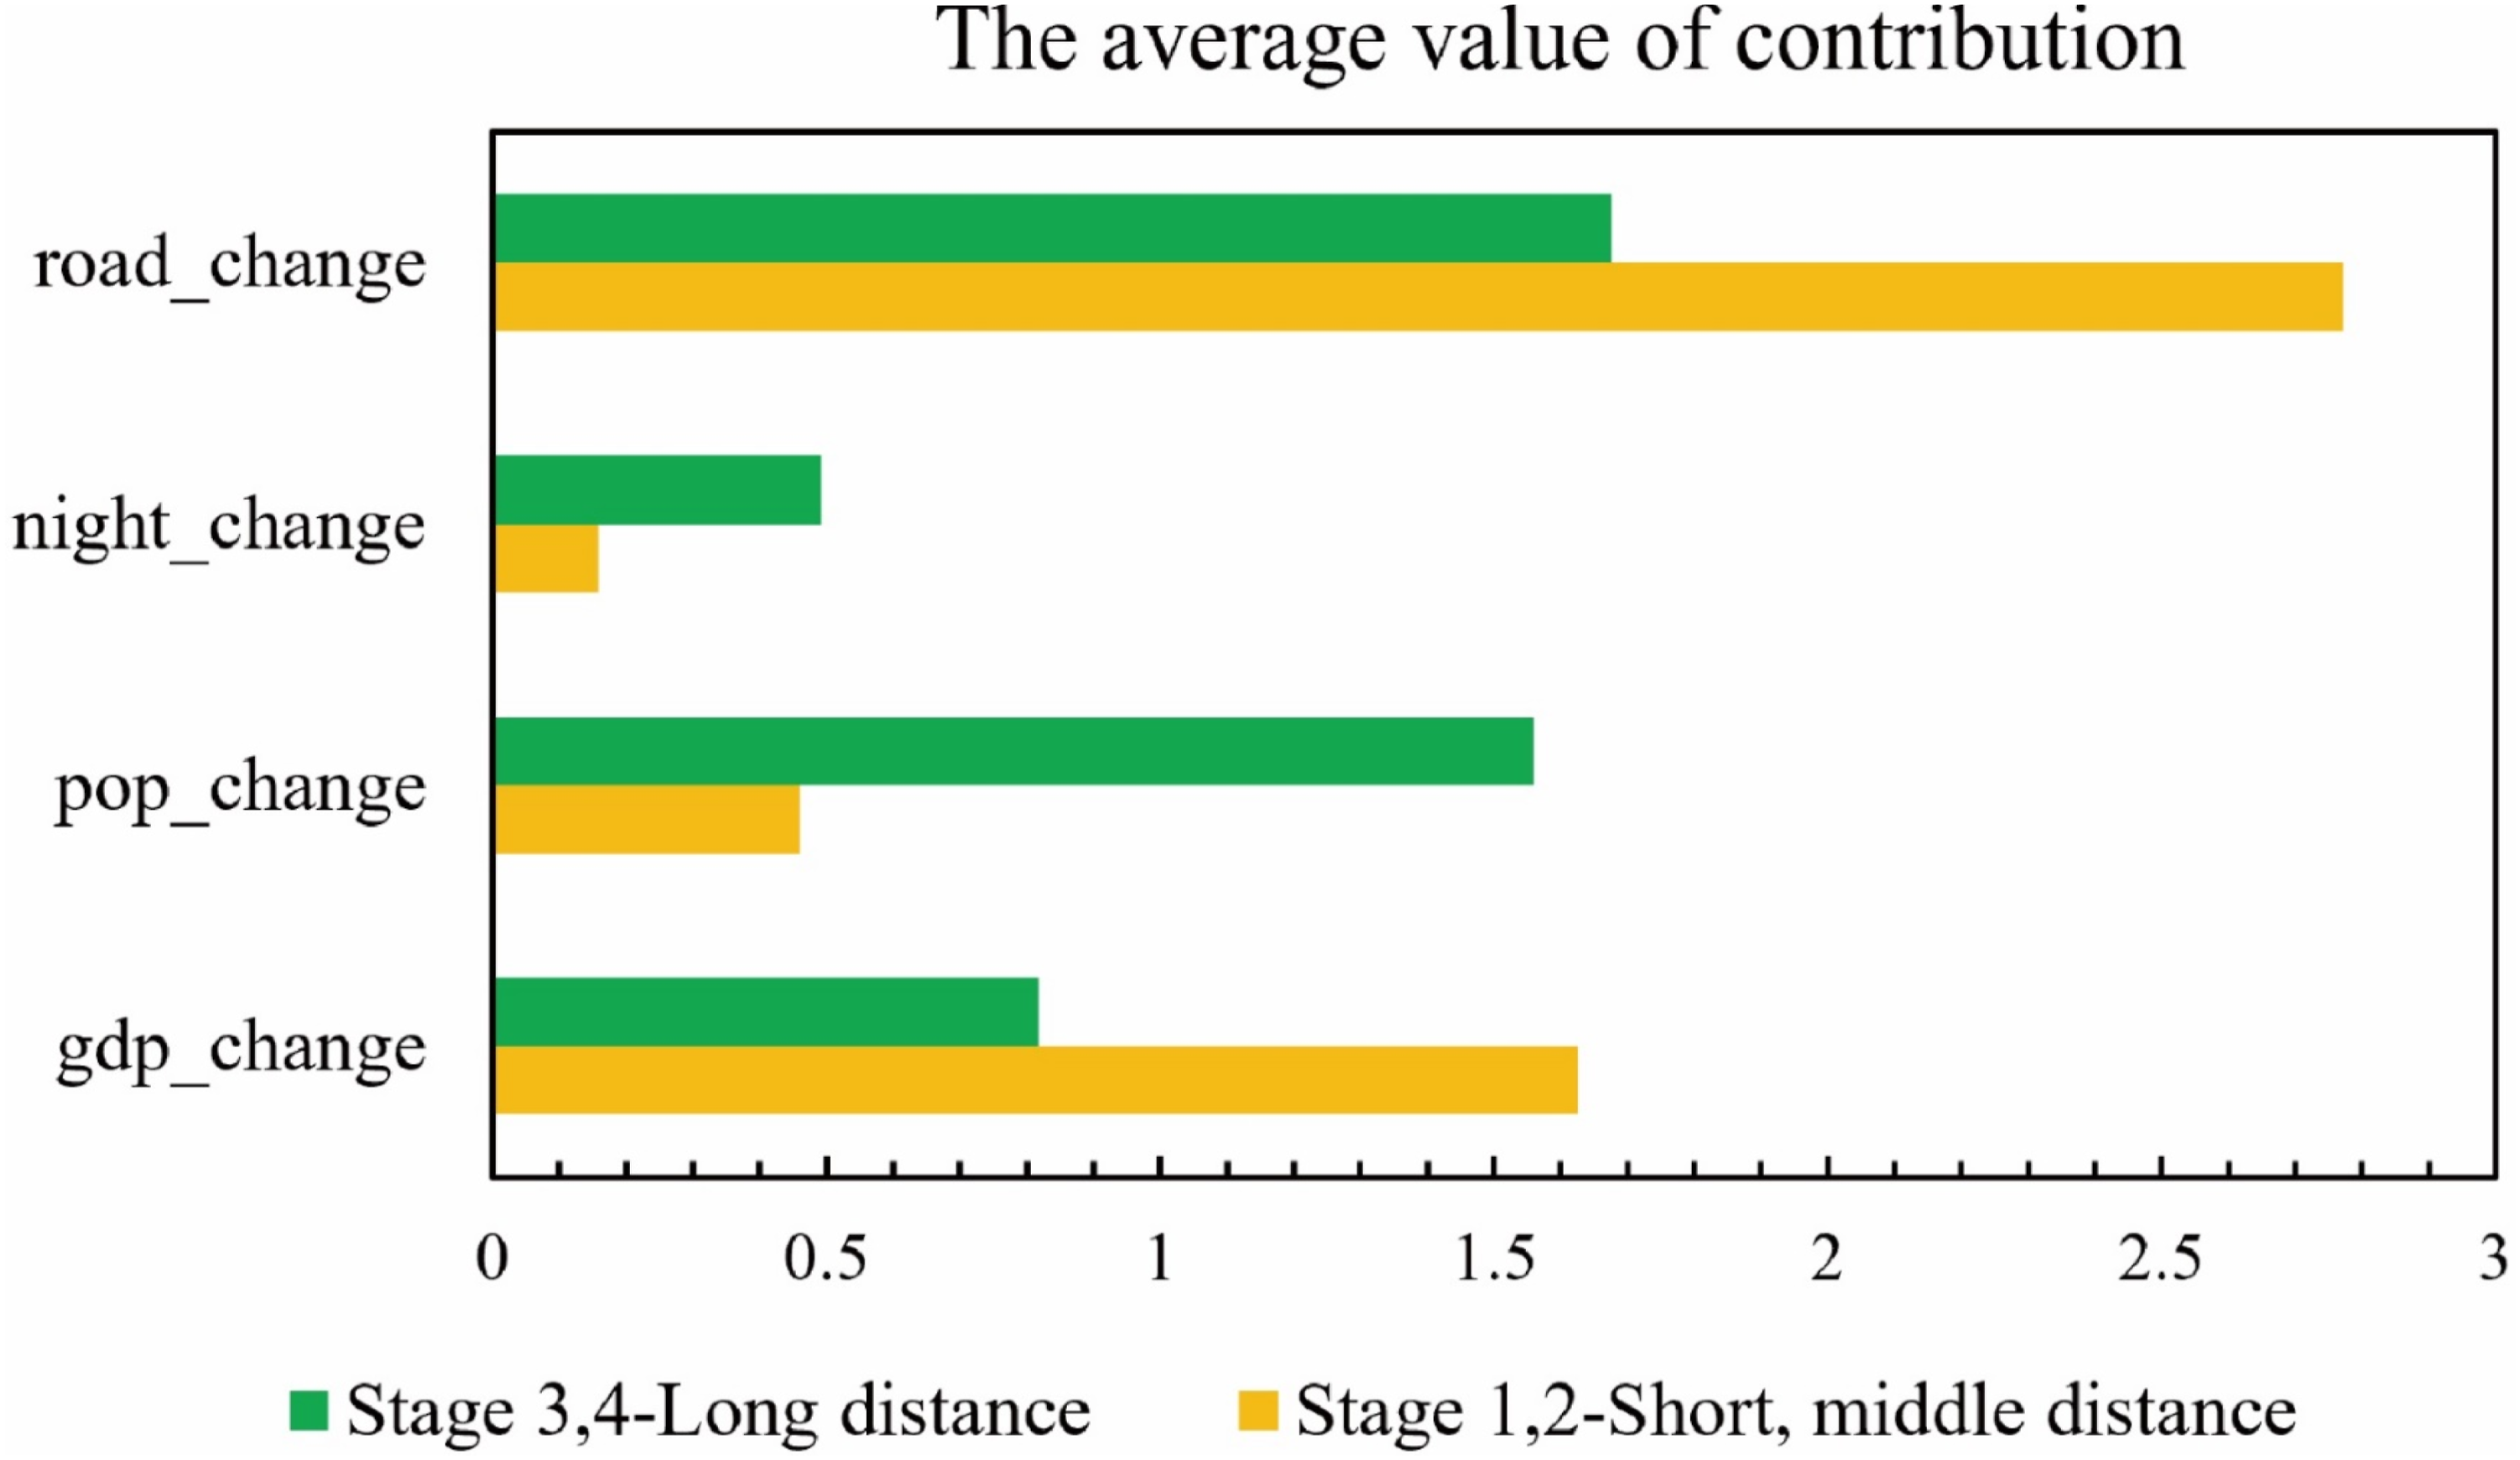
Driving force of each distance gradient
As shown in Figure 7, in the first stage, the primary driving force of the first gradient function is the change of population (pop_change); The main driving force of the second gradient function is the change of GDP (gdp_change). However, compared with first stage, the contribution of change in road density (road_change) increased significantly. The third gradient of functional tradeoff synergy drives similar to the first two gradients. In the second stage, the driving force of nighttime light change (night_change) increases significantly compared to the first stage, especially the contribution of the third gradient functional trade-offs/synergies. In the third stage, the contribution of road density changes began to increase significantly, while the contribution of GDP and population changes decreased significantly compared with the first two stages. In the fourth stage, the change of road density and the change of GDP become the main factors driving the synergy of functional trade-offs/synergies. Driving force chart of trade-offs/synergies (The values on the vertical axis represent the average value of contribution).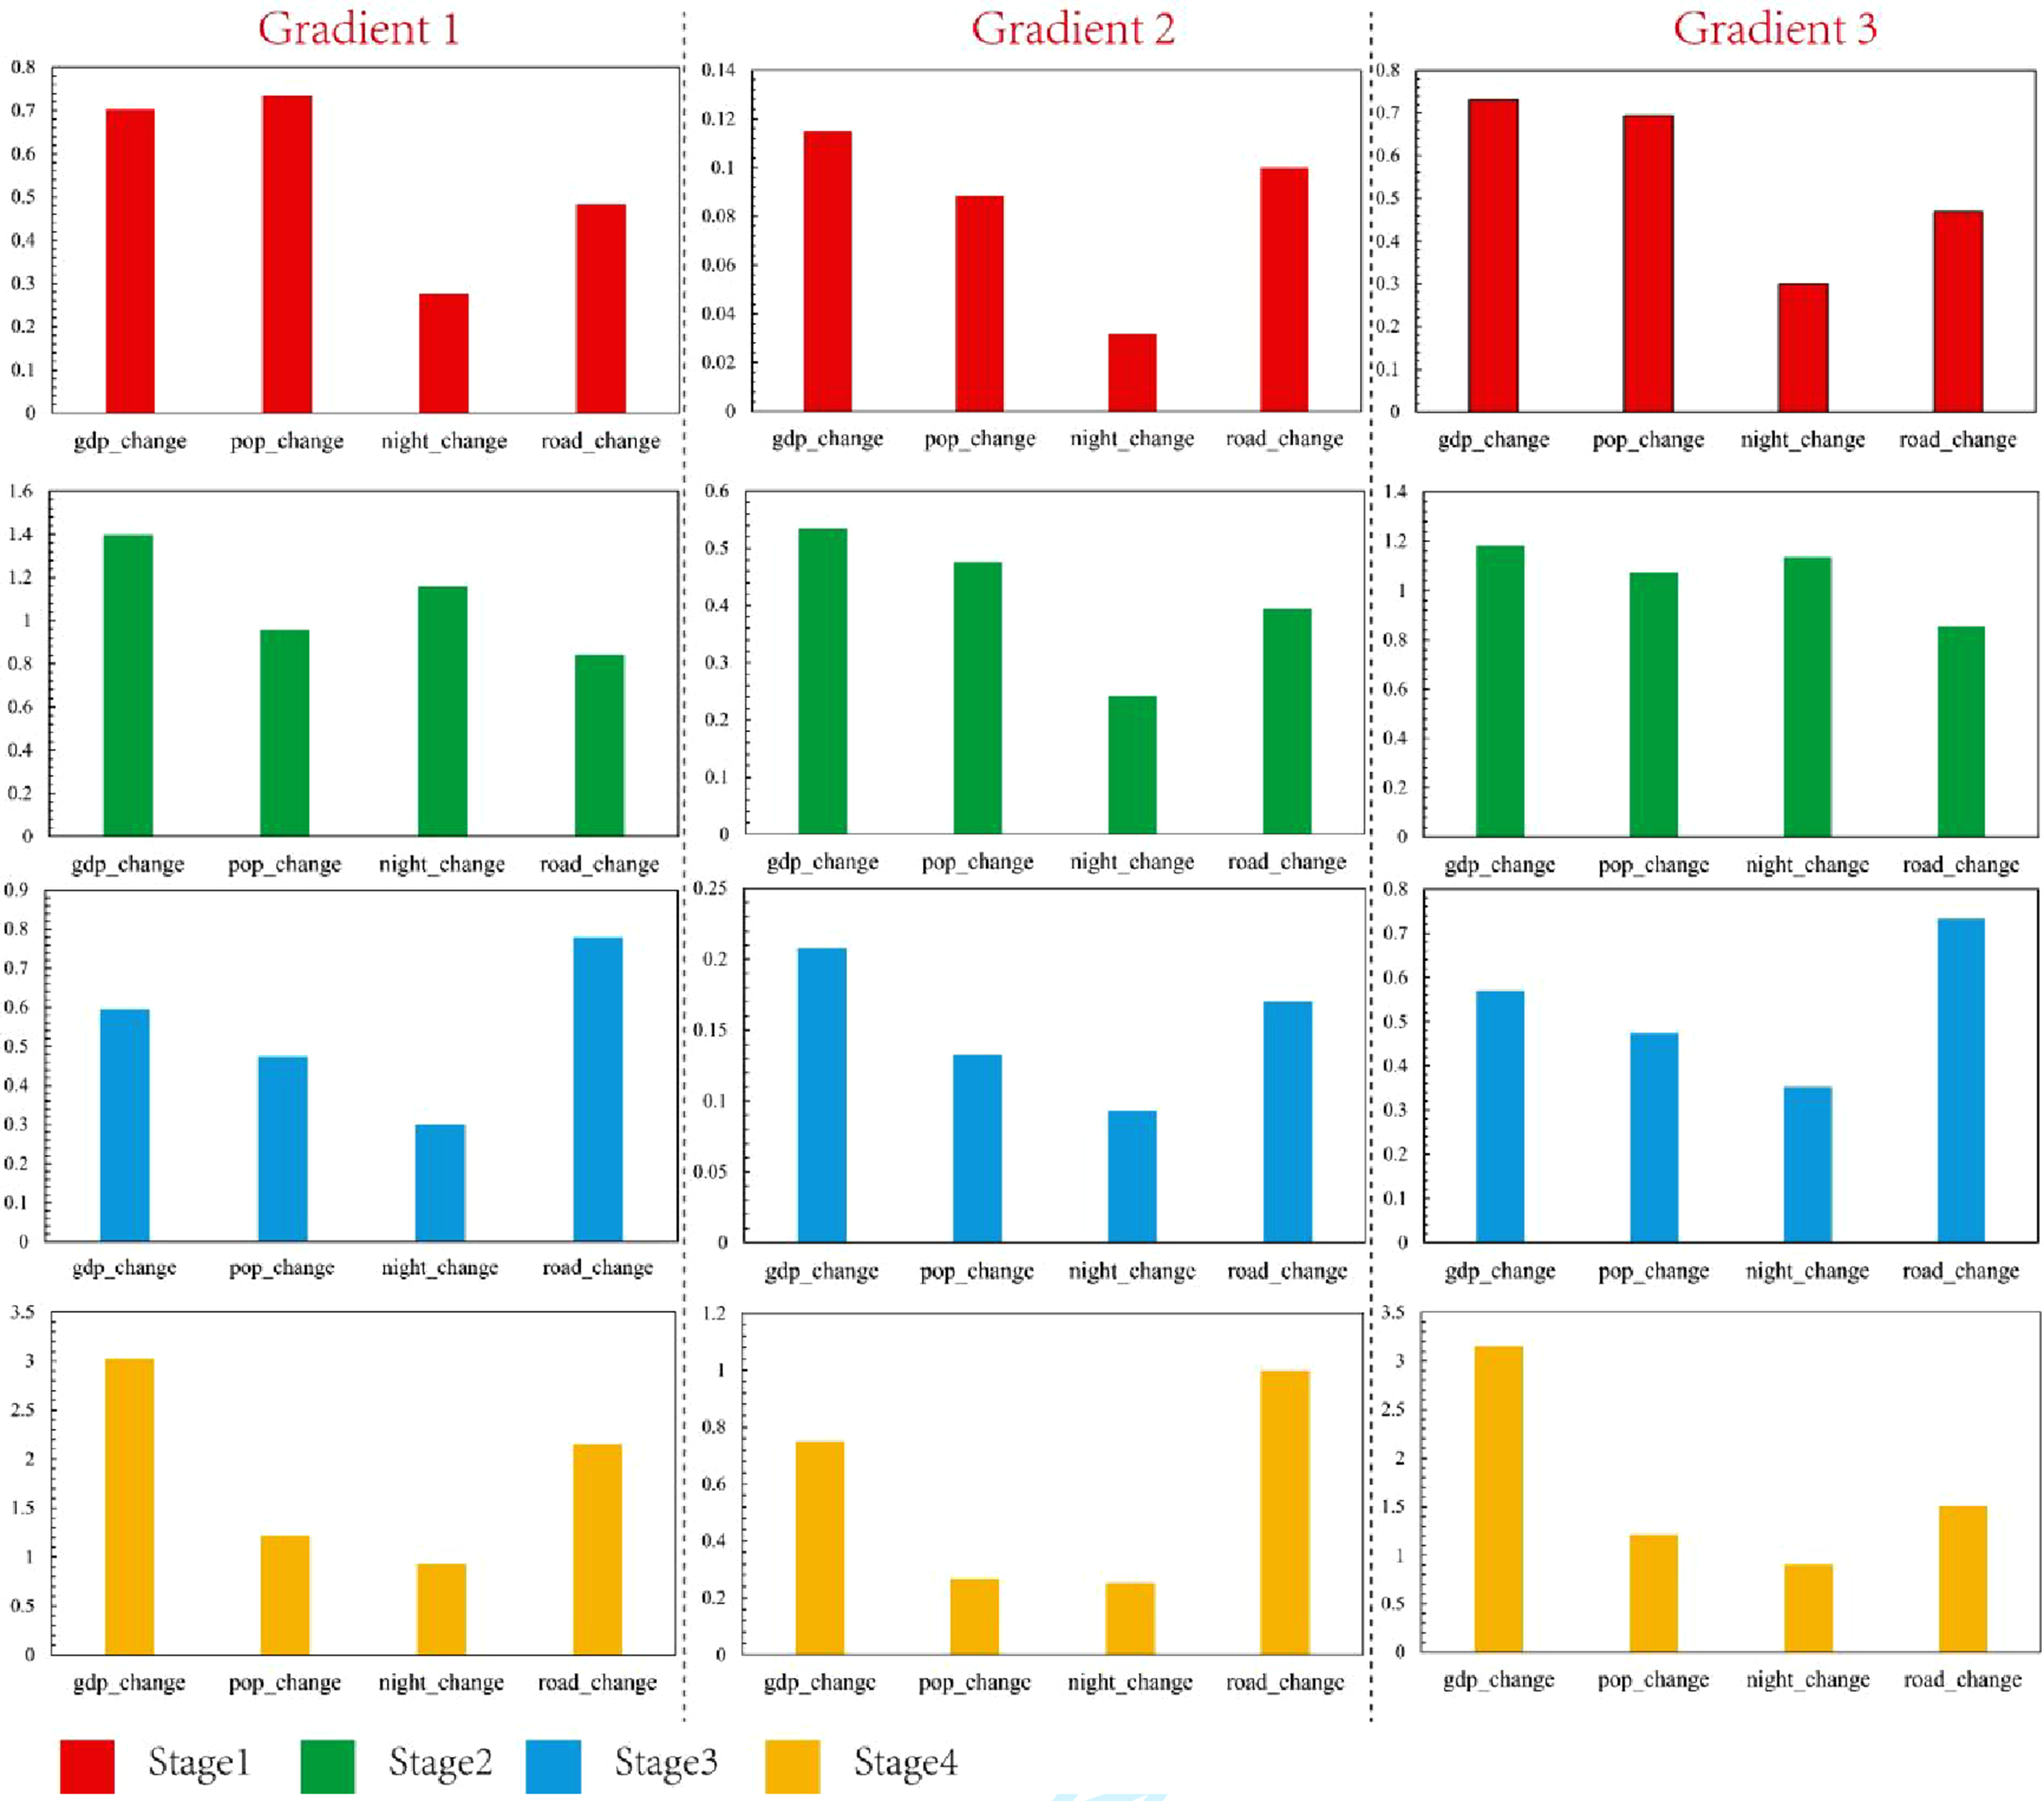
Discussion
Functional trade-offs/synergies in spatial reorganization
Our model reveals that functional trade-offs and synergies are key drivers of spatial reorganization in urban areas. This aligns with foundational work like Batty (2013), who emphasizes interactions between urban functions and their mutual reinforcement or competition. Recent evidence suggests synergies often emerge in eco-oriented planning but trade-offs persist in high-density zones. For example, Wang et al. (2024b) compare PLE spatial patterns in Fuzhou and Saskatoon, finding “high ecological space/compacted living space/strong trade-off between ES and other spaces” in Fuzhou due to dense populations—mirroring our base region’s challenges in balancing residential and commercial shifts. In comparison, Schwarz et al. (2020) optimize virtual urban landscapes via genetic algorithms, revealing that block-level composition shifts trade-offs to synergies for targets like compactness and green space—supporting our model’s role in quantifying functional shifts.
Distance gradient effect and spatial reorganization
One of the key innovations of our model is its ability to quantify the distance gradient effect in spatial reorganization, where urban functions decay nonlinearly from city centers, influenced by infrastructure and economic drivers. This effect refers to how activities change with distance from cores, with reorganization accelerating peripherally via population and land expansion. It aligns with Henderson’s models but extends them through recent spatial analysis (Henderson, 2002).
Evidence leans toward stronger gradients in monocentric cities, as Zhao et al. (2024b) uncover using anisotropy metrics: commutes lengthen with expansion in monocentric setups, while polycentric ones stabilize—echoing our driving forces like urban construction land area. Wu et al. (2023) further quantify spatial spillovers in Xiamen, showing urban vitality’s nonlinear growth with development intensity thresholds, where functional diversity thresholds amplify gradients—directly paralleling our POI-based reorganization patterns.
The application of trade-offs/synergies framework in the urban context
This study elucidates the urban-specific application of the trade-offs and synergies framework in spatial reorganization, setting it apart from its traditional roots in ecological and environmental research, where the focus is predominantly on interactions between nature and human well-being (Batáry et al., 2025; Lv et al., 2025; Wang et al., 2024a). In the urban context, the framework highlights anthropogenic drivers such as economic growth, urban development, and infrastructure, allowing quantification of scale-dependent functional dynamics—like trade-offs in core city densification versus synergies in peripheral mixed-use growth. These quantified dynamics provide a reference for the targeted adjustment of urban land-use intensities and infrastructure layouts along core–periphery gradients to reveal spatial reorganization. Overall, the framework serves as a tool for analyzing functional patterns of urban agglomeration, stressing human-driven factors to support balanced regional development.
Conclusion
There is a gradient effect of trade-offs/synergies among different levels of spatial reorganization; The trade-offs/synergies of functional evolution have a distance threshold. Taking the Yangtze River Delta as an example, the trade-offs/synergies relationship will continue to decrease after 300-350 km. The first gradient is mainly SEC, HS, LS, the second gradient is mainly FN, CA, and the third gradient is mainly TH, SP, AC, GS. The effect of nighttime light intensity variation on functional evolution is stronger in the short distance than in the long distance gradient.
Our results show a 300-350 km distance threshold beyond which functional synergies give way to trade-offs, consistent with spatial interaction theory. This manifests in hierarchical gradients where SEC/HS/LS dominate short ranges, mid-ranges, and long ranges, ultimately endorsing a polycentric-network perspective shaped by distance, accessibility, and functional development.
Future research should refine micro-scale UFI, replace geometric distance with travel-time metrics, explore causal mechanisms through quasi-experiments, test external validity across megaregions, and address data biases by incorporating mobility and transaction data, benchmarking against independent proxies.
Footnotes

Funding
The authors disclosed receipt of the following financial support for the research, authorship, and/or publication of this article: This work was supported by the Fundamental Research Funds for the Central Universities (2652023001), National Natural Science Foundation of China (42201471), National Natural Science Foundation of China (7203005), Beijing Social Science Foundation (2022YJC264).
Declaration of conflicting interests
The authors declared no potential conflicts of interest with respect to the research, authorship, and/or publication of this article.
Data Availability Statement
Data sharing not applicable to this article as no datasets were generated or analyzed during the current study.
Statement on the use of generative AI
During the preparation of this work, the authors used ChatGPT (OpenAI) in order to improve the readability and language of the manuscript. After using ChatGPT, the authors reviewed and edited the content as needed and take full responsibility for the content of the published article.