
Abstract
A lot of data is collected at state, district, block, and village levels across India as part of the monitoring and evaluation process for various government schemes ongoing in the country. Under the department of Women and Child Development in Karnataka a lot of data on children under 6 years of age and pregnant and lactating women is collected by Aanganwadi workers in the state. Although the current process of data collection, its analysis and interpretation require much more fiscal and human investment, it continues to generate large amounts of data. Interpretation of these data occur largely at the national and sub-national levels ignoring district and sub-district level variations in health and nutrition indices. Rarely are the results of this data analysis shared with district and sub-district level officials as they are not involved in policy formation. These officials also do not have training in data analysis and its interpretation and hence unable to use the vast sets of information available to them. This article is an effort to develop a monitoring and evaluation tool that uses easily available, taluk level data, from various sources to compute a cumulative nutrition index that can serve as a dipstick for monitoring nutrition status by block/district level officials.
Keywords
Indian Nutritional Landscape
India recently became the fifth largest economy in the world surpassing the United Kingdom. Economic progress can be seen by the large increase in the use of smartphones on the streets and as well as in steady improvement in health and nutrition indicators within the country. However, it is also true that the country’s progress is not uniform. On one hand, we have Kerala with near perfect scores on the socio-economic fronts and on the other hand we have the states of Bihar, Uttar Pradesh and Rajasthan which lag behind other states in health and nutrition indicators.
The health and nutrition outcomes in developing countries particularly depend upon the type of policy interventions targeted and the budget allocated for the health sector. The National health estimates show that the share of Government Health Expenditure(GHE) in overall GDP of the country increased from 1.13% in 2014-15 to 1.35% in 2019–20. Additionally, the share of GHE in Total Health Expenditure (THE) has also increased over time, standing at 41.4% in 2019–20, substantially higher than 29% in 2014–15 (Ministry of Finance Government of India, 2023). However, the health status of India as per the National Family Health Survey-5 (NFHS-5) presents both good and sober news. The survey shows improvement in the coverage of immunisation, institutional deliveries, Ante Natal Care (ANC), and other process indicators which have resulted in the improvement of the mortality outcomes such as infant mortality rate, neonatal mortality rate and under-five mortality rate. On the other hand, the country has fared poorly on several nutrition indicators. Between NFHS-4 and NFHS-5, the proportion of anaemic children increased from 58.6% to 67.1%. The proportion of pregnant women with anaemia and the proportion of women of productive age with anaemia have increased from 50.4% to 52.2% and 53.1% to 57%, respectively, for the corresponding period. Besides, the disaggregated figure at the subnational level suggests variation between the states in their performance in terms of health indicators. For example, while the less developed states such as Odisha, Jharkhand, Bihar, UP, Rajasthan and MP witnessed progress in stunting, the western and southern states such as Telangana, Maharashtra, Gujarat, and Kerala have fared worse. Similarly, the anaemia among pregnant women was worsened in most of the states including the developed states such as Kerala and Tamil Nadu, while other states witnessed minimal progress or stagnant in their condition during the period from 2015 to 2020.
Similarly, world over, the health indicators of nations across the world have improved in the last decades but it has not been translated equally among all the nations. For example, child mortality varies among the regions across the world and the gap among them is increasing. In 1990, while there were only nine deaths per 1,000 live births in the industrialised countries, in sub-Saharan Africa, the figure was 180 per 1,000- a 20-fold difference. In 2000, the gap had increased to 29-fold with mortality rates of six and 175 per 1,000 live births in industrialised countries and sub-Saharan Africa respectively (Black et al., 2003). Furthermore, the 2021 WHO report on levels and trends in child malnutrition shows that between 2000 and 2020, levels of stunting has decreased across the globe, but it has increased from 54.4 million to 61.4 million in Africa(UNICEF, World Health Organization, International bank for Reconstruction and Development, & World Bank, 2021). This is largely attributed to the deficient investment in the health system and the interventions necessary to achieve significant changes in the worst-performing regions. Moreover, the realistic picture of the country’s epidemiological profile and the capabilities of its health system that need to be drawn before any kind of intervention in the health sector for these regions remained blurred and hence contributed to slower progress in the health sector (Black et al., 2003). Furthermore, the development of interventions depends upon the determinants of the indicators which include socio-economic factors such as social status, income, education, and so on, that work through an intermediate level of environmental and behavioural factors. These factors remained unattended while policymaking and subsequently resulted in meagre improvement in the health indicators for these African and Eastern Mediterranean regions (Mosley & Chen, 1984).
The Need for Monitoring and Evaluation Below State Level
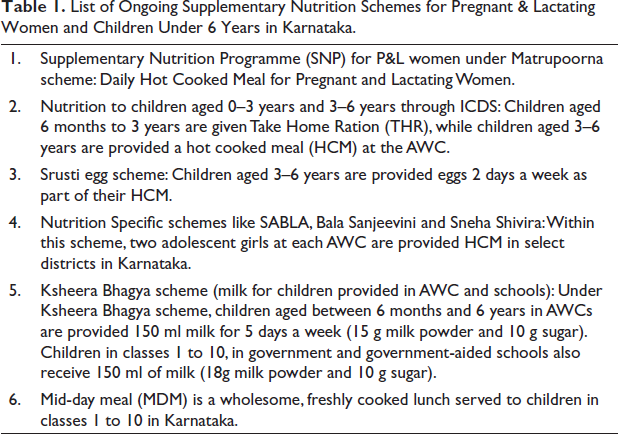
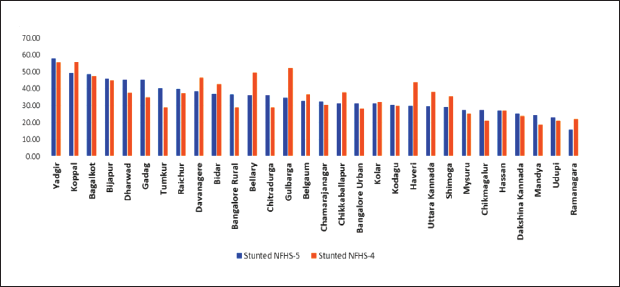
In short, understanding a region’s socio-economic and cultural contexts is a must in addition to increasing investments in the health and nutrition sector. However, In India, increasing allocations merely based on state-level indicators may not be enough. For example, Karnataka has been one of the top five states in India in terms of per capita Gross State Domestic Product (Government of Karnataka, 2022) but continues to perform poorly on the child nutrition front. The state government launched many nutrition-specific schemes as a part of addressing the nutritional challenges at the sub-national level through different governance and monitoring processes. The details of some the schemes targeted towards children under 6 years of age and pregnant and lactating women (PLW) are below given in Table 1. Despite these sub-national-level health-specific schemes, the state’s position in terms of health indicators has not shown much progress. Although there have been some improvements in reduction of the proportion of children under 5 years experiencing stunting (from 36.2 to 35.4) and wasting (26.1 to 19.5) between 2015–2016 and 2019–2020 (NFHS-4 and -5) the district-wise figures showed a varied picture (Figure 1) 1 that needs attention. The number of children who were stunted has, in fact, increased in 16 districts. Within Karnataka, between two rounds of the NFHS, Yadgiri remains the worst affected with more than 57% of its children under five suffering from stunting. This number increased from 55% in 2015–2016.
List of Ongoing Supplementary Nutrition Schemes for Pregnant & Lactating Women and Children Under 6 Years in Karnataka.
Therefore, in India it is pertinent to understand not only interstate variations, it is also important to look at intra-state differences in social and economic indices. Under such circumstances, the efficient and effective monitoring and evaluation of health schemes play a major role in improving health indicators.
The validity and utility of the health indicators depend upon the monitoring and evaluation (M&E) of the project or policy initiatives. In other words, the monitoring of progress and evaluating impacts have been the important process to ensure that the money is well spent, and the objectives are met. In most contexts, these are interlinked. Monitoring is associated with the words like ‘observing change’ or ‘ongoing assessment of activities and trends,’ while evaluation is associated with the words like ‘periodic performance review’ or ‘assessment of strategic issues, changes, achievements, and of impacts’ (Guijt et al., 1998).
In developing countries, resources are scarce, and they cannot, therefore, construct a big set of health indicators. There are only a few developing countries that can maintain birth, death, and disease registries. Moreover, in a country with underdeveloped health infrastructure, not all who are sick visit healthcare centres which is a constraint to constructing an indicator for morbidity (Larson & Mercer, 2004). Investing in robust data management systems as well its associated infrastructure and capacity building has always taken a back seat in India when in the face of enormous investment requirements for providing and maintaining clinical infrastructure in the country. However, data are collected as part of all vertical programmes and schemes for M&E purposes. It is collected at village level and collated at taluk/block 2 level. This is further aggregated at district and state levels. Each programme or scheme has its own vertical of data compilation and seldom are these verticals analysed together. For example, data collected under the National Health Mission (largest conglomeration of health schemes in India) is not connected to the health information collected by private hospitals or insurance schemes. Nor is this information connected to nutritional related information maintained under the supplementary nutrition programme run by the department of Woman and Child Development (WCD).
In addition, the information collected by the programmes are merely a compilation of service delivery points and rarely perform an impact assessment. For example, Levinson and Madzorera (2005) in their study on the monitoring and evaluation of nutrition-related projects in nine developing countries including India, remarked that in most of the nutrition project-related M & E the ‘behavioural outcome’ column was often neglected (Levinson & Madzorera, 2005). In addition, as nutritional deprivation is the effect of multiple factors from poverty to poor education to gender and attributing the change in the nutritional status to impact of a single programme may not give the correct picture (Adhikari & Bredenkamp, 2009). In addition, Levinson and Madzorera believe that the current system neglects the primary purpose of monitoring, that is, the ability to quickly correct the problems in implementation.
In summary, even though literature has shown that each dollar invested in prevention of maternal and child malnutrition provides rich returns on investments (Bhutta et al., 2013), this has not been realised even in a state like Karnataka which has nutrition friendly policies for its children and PLW. The developmental goals, SDGs, international commitments, returns to investment on the social sector particularly children make a clear case for investments in nutrition. However, measured investments targeting the low hanging fruits and focusing on the poor or backward areas to improve the average becomes critical for sustainable developments. In this context, measuring both the development especially through indicators along with the investments serves two purposes: (a) for the state to monitor and invest in critical blocks/taluks and (b) the local officials would be able to reason out for the poor performance of indicators or come up with strategies for local problems. There is also a need for establishing a monitoring framework for nutrition specific programmes that are part of the feedback loop and aids in quick decision-making and course-correction leading to better nutritional governance. Our article tries to come up with such an M&E tool that will aid in quick decision-making at the district and block levels with the help of easily available data at that level while also capturing the multi-causality of malnutrition in the process.
Current Nutritional Data Collection Practices in India, Specifically, Karnataka
The need for data collection and analysis within various social sectors, like health and nutrition and education cannot be emphasised enough. There is collection of data at all levels of government function from the village all the way to the state. Each day, week, and month frontline workers like ASHA and Anganwadi workers (AWW) fill in multiple registers with data on beneficiaries within their service area. These data are collated by their supervisors and entered into the computer systems by data entry personnel. This is further aggregated at the block, district, and state levels. Take the case of an AWW at an Anganwadi Centre (AWC) in a village. She must maintain about 11 registers, which include information on mothers visiting the AWC for Ante Natal Check-ups (ANC), Childrens’ growth records (under 6 years), separate supplementary nutrition registers for children and PLW, adolescent girls registers (where eligible), etc. To get a sense of the amount of data collected by anganwadi workers in a taluk, in Udupi Taluk of Udupi district, in the month of March 2022, weights of more than 19,000 children under 6 years of age have been collected in its 274 AWCs. Similarly in Bengaluru South taluk of Bengaluru Urban district, weights of more than 36,000 children (in 499 AWCs) have been measured and written down in the registers, while in Shahpur Taluk (Yadgiri district) data of more than 40,000 children aged under 6 years and 10,000 PLW (395 AWC) data is being collected during the same time. The state currently has 31 districts and about 235 taluks (Department of Economics and Statistics, n.d.). In 2017–2018, there were 62,580 AWCs and 3,331 mini anganwadi centres are functioning in 204 Integrated Child Development Scheme (ICDS) projects in the State, and 5.65 million beneficiaries availed benefits under the ICDS (Directorate of Women And Child Development Department, n.d.).
Using Smart Phones and Technology in Data Process
Until recently, all this data were uploaded on to excel sheets as part of the monthly progress report (MPR) which are collated at the block level by the Child Development Project Officer (CDPO) of the WCD and then sent up to the district for further review which forwards it to the state WCD office. Under Poshan Abhiyan scheme, the GOI introduced the ICDS-Common Application Software (ICDS-CAS), now known as the Poshan Tracker to digitalise the registers for nutrition related data on children and PLW. As per the scheme, AWWs are supplied with smartphones to enter the data which gets uploaded to a centralised system providing real time data on nutritional and health status of lakhs of children across the country. The application is not only meant to serve as a tool for entering and accessing real time data; it also keeps track of services delivered at the AWC. Services like receipt of Take-home Ratios (THR), Hot Cooked meals and Vaccinations can be tracked. In addition, the app also monitors the health status of children as well as provides home visit alerts to the AWWs. However, the smartphones and therefore the Poshan tracker software are being used only in limited capacity.
Field studies have shown that hardware issues and network issues often resulted in non-usage of the smartphones by the AWWs. In Karnataka, cases of non-payment of phone dues resulted in disruption of services which resulted in the AWWs going back to registers during the pandemic (Yareseeme et al., 2022). In other cases, like in Maharashtra, the phones were said to be outdated and unavailable in the regional language that led to non-usage of these phones (Gokhale, 2023). Not making allowances for additional barriers faced by women in using these smartphones have also led to limited use of apps introduced in the country. For example, the national mobile monitoring software app introduced for the Mahatma Gandhi National Rural Employment Scheme has also been facing similar issues which lead to workers not getting paid correctly (Madhukalya, 2023). In addition, just going by the sheer number of workers, that is, 1.397 million AWWs, indicates the enormity of time, effort and resources required to make the Poshan tracker the tool it is meant to be.
Sub-state Level Officials, Data Interpretation and its Use in Karnataka
Considering the enormous amount of data being collected and collated at all levels is aided only by limited technology. It is no wonder then that all this ICDS data is being analysed and used for planning purposes at the state level only. Data at district level and below is used mainly for scheme implementation and rarely seen as an opportunity for research and innovations at that level. Officials at district level and below also have limited to almost no training in data interpretation, monitoring, and evaluation. Officials also rarely share data with their counterparts in other departments which often limits the scope of schemes (e.g., lack of co-ordination between ASHA and AWWs on home visits to newborn and infants). We already know that district and block level officials currently have a limited role in policy planning for areas under their jurisdiction but they also lack the training to required to interpret and therefore use the high volume of varied data collected in their area to provide localised solutions. Already, COVID-19 has shown that in the hands of well-informed and proactive local authorities, technology and data tools can be an asset. For example, while studying the state of nutritional distributional systems during COVID-19 (2020–2021) in Yadgiri (north Karnataka) and Tumkuru (south Karnataka) districts of Karnataka, it was seen that a resource poor district (Yadgiri) could rise up to the occasion to maintain service delivery (Yareseeme et al., 2022). In Yadgiri, anganwadi helpers visited homes of severely acutely malnourished children and ensured that every child was fed an egg or protein rich porridge in their presence. The AWH then, clicked pictures via smartphone and was sent to the CDPO. This way children were monitored, and records of children been fed were maintained.
However, it was also during COVID-19 that data gathering processes were affected. For example, children could not be weighed at the AWCs due their closure and social distance norms that were prevalent at that time. The MPR reports collected from the above two districts during the months from April 2020 to March 2022 show a steady decline in the number of children who are moderately underweight and severely underweight. These data are contradictory to news reports published at that time which talk of increase in undernourished children. One can further speculate that how weights of children were measured and reported within the MPR reports during the initial lockdown period between March and July 2020 when AWCs were closed and there were strict social distancing norms. Field interviews also point to the complete stoppage of all AWC services except distribution of THR for the first 3 months of the pandemic. Hence indirect evidence points to the fact that weight measurements of children undertaken at that time could be an underestimate.
Intra District Differences in Nutritional Indicators
It is also well known that northern Karnataka has poorer socio-economic, health, and nutrition indicators than the districts in Southern Karnataka (Benni & Chowdappa, 2017; Hanagodimath & Annigeri, 2019; Niranjan, 2020). As we have already seen above, nutrition indicators also vary with district. These districts require additional institutional and financial support to undertake the required improvements in service delivery and gap in resources. The COVID-19 pandemic has only emphasised the need for maintaining accurate and systematic data. A study was conducted by CBPS in 2022, where RTIs were filed to get MPR reports from the best performing and the worst performing taluk in each district in Karnataka for the period of April 2019 to March 2022. MPR from 15 taluks were analysed belonging to 10 districts of southern and central Karnataka. It was seen that there was an increase in the number of PLW who sought take home rations (THR) in the first six months of the pandemic from April 2020 to September 2020 as compared to the previous 6-month period of October 2019 to March 2020. In the Udupi (Udupi district), South Bangalore (Bangalore Urban) and Ponnampet (Kodagu) there was an increase of more than 300% in PLW accessing THR. Differences were seen between two taluks in the same district. For example, Hirekerur taluk in Haveri district saw an increase of only 0.6% in the first 6 months of the pandemic (April 2020 to September 2020) which decreased further in the next 6 months (–3.4%) (October 2020–March 2021). At the same time in Byadgi taluk also in Haveri, the number of PLW beneficiaries increased by 61%. In addition, all taluks varied widely in anganwadi to beneficiary ratio, for example, there were only 34 beneficiaries per AWC Narsimhapura (Chikamagalur) while there were 152 beneficiaries per AWC in Shahpur (Yadgiri).
While importance of district wise indicators and presence of inter-district disparities have been established, seldom have taluk/block level indicators been considered as monitoring tools. In cannot be denied taluk level differences do exist within a district and these are not usually addressed in the one size fits all approach of the schemes. In their study of the Hyderabad Karnataka region, Benni and Chowdappa show that even within the backward districts of this region, the human development index reveals that some districts have a larger inter-taluk disparity than others (Benni & Chowdappa, 2017). A look at the data published under the, ‘District at a Glance document’ for each district in Karnataka, differences between taluks can be seen at a greater detail. For example, women’s literacy rate in 2019–2020 varies from 56% in Pavgarh taluk in Tumkuru district to 77% in Tumkuru taluk of the same district. Similarly, Pavgarh also has a high schedule tribe population in the district at 17%. Although a lot of data is collected by ASHA and AWW as part of the HMIS and MPR systems, all the variables are not updated on government websites. This is especially true for nutrition related indicators. Although through NFHS, nutrition indicators are available at district level, these only measure nutrition outcomes (like the percentage of stunted or wasted children) and seldom look at service delivery and other indirect (nutrition sensitive) causes for malnutrition. It is well known that interventions to prevent and treat undernutrition can be broadly divided into nutrition specific causes and nutrition sensitive causes (Nutrition in the Lancet | Scaling Up Nutrition, n.d.). According to the Lancet, nutritional interventions that address the immediate determinants of foetal and child nutrition are called nutrition-specific interventions. For example, parental practices, feeding practices, adequacy of food and nutrient intake, etc. While nutrition sensitive interventions are those that address the underlying determinants of foetal and child nutrition, example, food security.
To understand availability of nutrition specific and nutrition sensitive indicators at taluk level we looked at possible sources for block level data which are easily accessible online. We shortlisted the ‘District at a glance document’ for all of Karnataka’s districts. This document has taluk level information from all sectors in the district. Although it had data on good number of nutrition variables like (no. of AWCs, no. of Antyodaya card holders, etc. it cannot give updated information on nutrition indicators like percentage of women with anaemia, percentage of children who are malnourished). However, the DAG shows the high variability between blocks in the district. Karnataka has seen an improvement in nutritional indicators in some taluks but not in others. The dependency on public provisioning of the nutritional services varies across districts/taluks (blocks) and prioritisation has to be accorded to match the same. Districts/taluks which are relatively poor in the nutritional sensitive services such as water supply and sanitation also need to be accounted for while prioritising services. While the existing system does focus on monitoring and improving the provisioning of services through Anganwadi Centres, nutrition sensitive indicators also need to be taken into account.
Therefore, the current system of managing nutritional data is limited by technological concerns with centralised decision-making. Understanding that monitoring of nutritional interventions needs to multi-dimensional and rooted at taluk level is critical.
Proposed Framework for Sub-district Level Nutritional Monitoring
Drawing from the lessons of COVID-19 management along with the existing monitoring/reporting for nutritional services in Karnataka, a simple monitoring and evaluation framework has been developed to assist the administration that will help in quick assessment which can be used for undertaking suitable action. This framework can also be used as an evaluation tool. This monitoring and evaluation framework aims at providing a quick yardstick or dip stick that aids in monitoring the nutritional situation focusing largely on the beneficiaries of Anganwadi centres. The idea was to develop a simple tool like the HDI which can be used by officials at taluk or district level with readily available data. Using taluk level indicators empowers district/block officials to undertake quick situational analysis of their districts and prioritise relief/operations to the taluk that requires it the most. Although this framework has been developed taking Karnataka’s context into account, it can be easily adapted to taluks and districts in other states.
The main feature of this framework is
to generate indices at taluk/block level which comes under the same district administration, enabling comparisons across taluks and providing explanations for the variations, as well leading to possible local solutions. to use the existing government information systems of monitoring and reporting of nutritional services without asking for any additional burden for the ground level workers, and aimed at covering beneficiaries under the ICDS scheme and can be used for (a) either pregnant or lactating women alone, (b) for Children under 5 alone, or (c) or for both sets of beneficiaries together.
For the purposes of the ease of compilation, calculation and assessment, the proposed M&E Framework has been restricted to cover only a key set of indicators (Table 2). These markers have been carefully chosen to achieve the objective of quicker assessment and evaluation using the indicators that are regularly collected and monitored. We have grouped the indicators into three categories, namely:
Influencing Indicators Process Indicators Outcome Indicators
List of Indicators to be Used in Calculation of the Cumulative Nutritive Index for Children 0–5 Years and PLW.
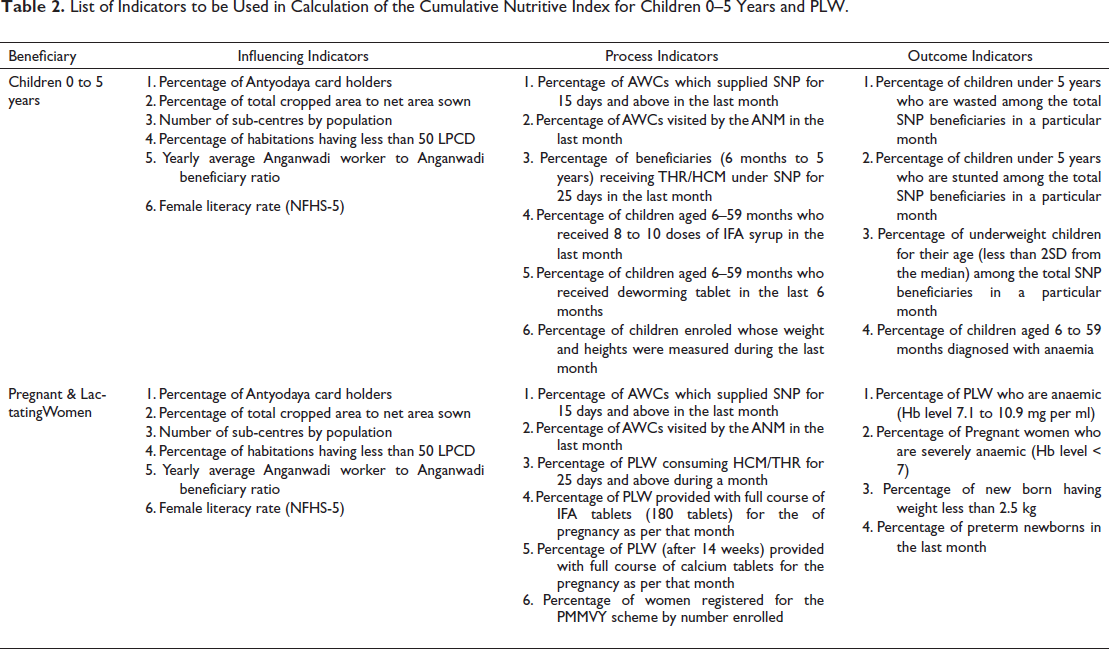
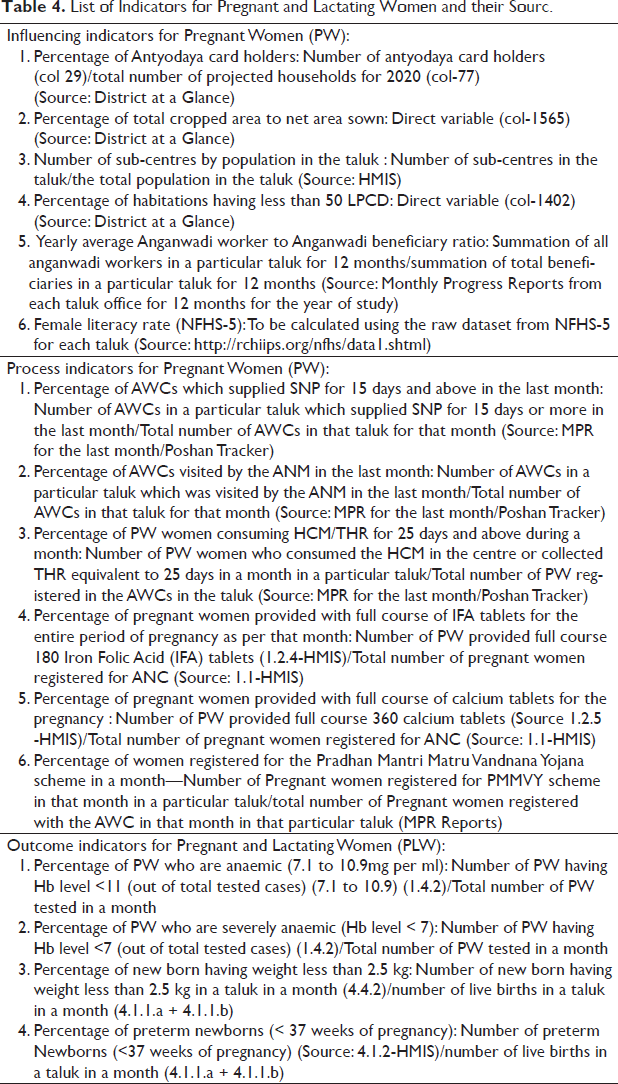
Influencing Indicators are largely nutrition sensitive and influence the nutrition specific interventions in a significant manner. These indicators cumulatively also indicate the case load/priority area for action. These six indicators can cumulatively be compiled to form an index for quicker use. This can also be used independently as well to assess the status of influencing indicators which indicate towards the need for greater investments in enabling factors and/or IEC efforts. All six influencing indicators remain the same for children, pregnant women and nursing mothers.
Process Indicators focus on the processes of the nutritional interventions to reflect upon the efficiency of the system to deliver. This bucket contains six indicators for each target group: children below six, and pregnant & lactating women. While the first three indicators remain the same for children below 5 years 3 and PLW, the next three indicators are specific to the target group. These indicators focus on the processes that can be quickly assessed and monitored.
Outcome Indicators are largely influenced by the intervention and reflect the efficiency of the same in a shorter duration. This bucket contains four indicators for both children and PLW, All outcome indicators are separate for the two target groups:
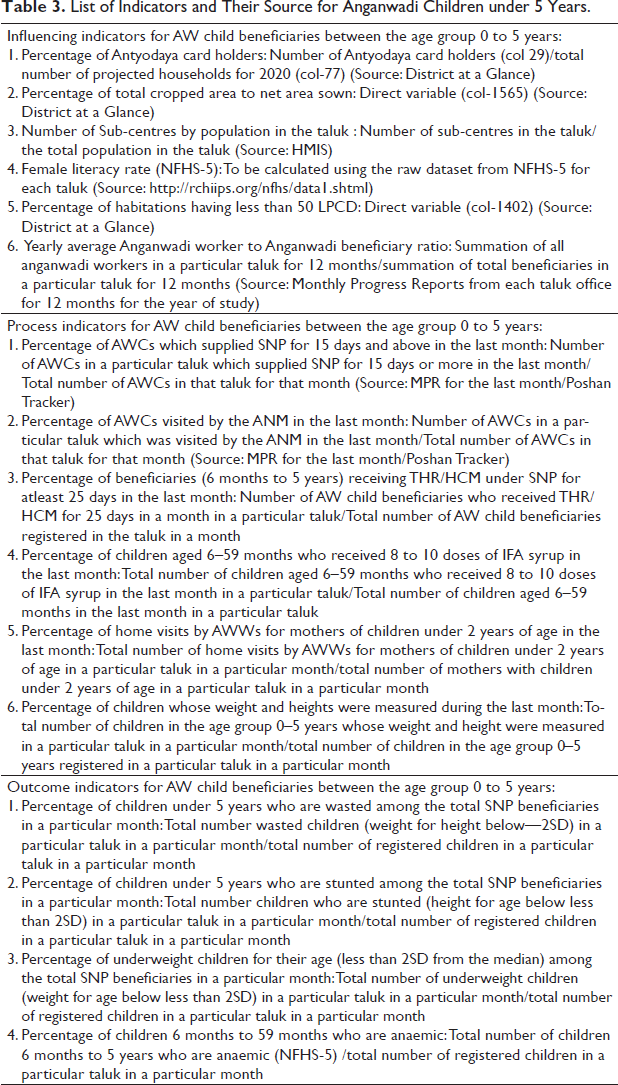
The data sources for these indicators can be easily obtained at the taluk or district level as these are routinely collected and are part of (a) District at a Glance—regularly published by Directorate of Economics and Statistics, Government of Karnataka; (b) Health Management Information System- Ministry of Health and Family Welfare, Government of India; (c) MPR/Poshan Tracker—Department of Women and Child Development, Government of Karnataka; and (d) NFHS-5. Tables 3 and 4 give details of how each indicator can be calculated. All indicators are in terms of proportion and hence comparable to each other.
List of Indicators and Their Source for Anganwadi Children under 5 Years.
List of Indicators for Pregnant and Lactating Women and their Sourc.
Cumulative Nutrition Index Methodology
Each of the indicators can be compiled together to form separate set of indices for children (0–5 years), and the PLW. As mentioned earlier, while the influencing indicators remain the same for both children and women, the process and outcome indicators vary. These two indices for women and children can further be combined to arrive at Cumulative Nutritional Index (CNI, CNI-C for children, CNI-PL for PLW) after providing appropriate weightage for each of these types of indicators.
These types of indicators can also be used by way of colour coding (Red- poor, Yellow- moderate and Green-Good) both individual indicators as well as the indicator-buckets for different categories of children and women.
Assumptions, Challenges, and Limitations
While the index/CNI-colour coded matrix can potentially serve as a good tool for monitoring and evaluating the nutritional interventions, it is not a comprehensive solution by itself for a variety of reasons that need attention. Some of those are listed here:
The quality and efficiency in collection and reporting of data (veracity) can affect the decisions and further actions
4
. Honest reporting needs to be encouraged (Honest reporting should not be discouraged by way of harassment or viewing it as underachievement). This exercise also assumes that the efforts to improve nutritional governance are also undertaken. This would mean the political leadership at the district and taluk level together with administration drive the nutritional interventions, and not leave it to the frontline workers alone.
5
The nutritional interventions are supplementary in nature which assumes that there is main nutrition sources remain at household level. Enhancing the quality and quantity of nutrition to suit the needs at the household level largely depends on nutritional counselling. IEC efforts of personal engagement with beneficiaries have proved to be far more effective than distributing IEC material. The Karnataka Multi-sectoral Nutrition Project funded by The World Bank has developed the proof of concept on the same (Swain, 2018). Use of low-cost nutritional sources available locally along with the local recipes along with educating on junk food has potential to be more effective. Ideally such an index should also be developed for children aged 6 years and above especially after the pandemic. There is also no such index that focuses on children above six or adolescents whose nutritional needs increase with advent of puberty. However, absence of detailed monitoring of health status of school children currently does not exist making it impossible to monitor their health in a similar manner. Rashtriya Bal Swasthya Karyakram data may be used to serve as a baseline in the future, and the potential for the same needs to be explored.
Conclusion
Nutrition needs to be accorded a high priority for its intergenerational influence. The focus needs to shift from making the lower-level officials and frontline workers accountable to stand themselves as responsible for the change. This tool also takes into account at multiple dimensions of malnutrition for which data is collected at the taluk and district level. This ensures that lower-level officials can undertake quick analysis of their jurisdiction’s progress with this tool and take immediate action and apply corrective measures without having to rely on the state’s directive. This kind of process requires frequent and constructive engagement with lower-level officials and frontline workers along with the flexibility for making desired changes at the taluk level. It is also important to undertake capacity building of all lower-level functionaries to ensure not only understanding of the monitoring tool and its purpose but also importance of collecting and maintaining robust datasets. Ensuring collective responsibility for the results of data collection, analysis and interpretation ensures a pride in the job well done by all and paves a way to good governance.
Footnotes
Acknowledgements
We thank Achala Yareseeme for collaborating during the initial phase of ideation, and Jyotsna Jha for reviewing the draft. We also thank UNICEF Hyderabad Office supporting the project that this paper is based on.
Declaration of Conflicting Interests
The authors declared no potential conflicts of interest with respect to the research, authorship and/or publication of this article.
Funding
The authors received no financial support for the research, authorship and/or publication of this article.