
Abstract
The present study investigates the degree of financial inclusion (FI) among tribal communities, specifically focusing on the rural tribal populations of the South Tripura district. More specifically, the study examines the level of access to and usage of formal financial services, including banking, credit and insurance, among scheduled tribes (ST) households. An appointed field investigator has collected primary data from 408 households belonging to the tribal community in the South District of Tripura through a structured interview schedule. We used the methodology suggested by the Reserve Bank of India (RBI) to compute the composite financial inclusion index (CFII) to assess the degree of FI among the ST population in the study area. The results indicate that most respondents demonstrate moderate to high levels of FI, with only a small percentage classified as having low FI. The study also confirms that FI varies based on education, income source type and income groups. Government and policymakers should enhance effective FI programmes, particularly in digital banking, mobile money services and microfinance. Improving digital infrastructure and reducing transaction costs can further increase accessibility for these communities.
Introduction
Inclusive growth has become a buzzword, and it is a key priority in the government’s agenda worldwide, as it aims to ensure that the benefits of economic progress are distributed equitably among all segments of society, with a special focus on marginalised and vulnerable groups. Financial inclusion (FI) is a crucial enabler of inclusive growth (Sahoo et al., 2017), as it provides access to financial services and opportunities for individuals and communities to participate in the economy. FI is the process of ensuring access to financial services, timely and adequate credit for vulnerable groups such as weaker sections and low-income groups at an affordable cost, Reserve Bank of India. ‘Broad access to financial services implies an absence of price and non-price barriers in the use of financial services’. Different authors have provided different definitions of FI. For instance, Rajan (2009) defines FI as the provision of universal access to a wide range of financial services at an affordable price. These encompass not only banking products, but also financial services such as insurance and equity products, which are all part of this category. According to Aggarwal (2014), FI aims to provide financial services at a reasonable cost to various marginalised and disadvantaged groups in society. Sahay et al. (2015) define FI as the access, usage and delivery of financial services at affordable costs to vulnerable segments of society. Sarma and Pais (2011) gave a comprehensive definition of FI based on several dimensions, including accessibility, availability and usage of the formal financial system for all members of an economy. The only way to address the isolation of the poor from the formal financial sector of the country is through FI. As a subset of economic inclusion, FI has the potential to improve the financial situations of the unprivileged and impoverished and enhance the quality of their living. A more resilient and stable real economy can be achieved through FI, which entails making risk management financial resources more accessible to individuals, households and small businesses (Cull et al., 2012).
According to Mohan (2006), FI is the polar opposite of financial exclusion. Thus, it is reasonable to infer that financial exclusion results from the lack of access to and willingness or ability to use a variety of financial services. It is strongly linked to poverty and is an outgrowth of the broader issue of social exclusion and imposes a substantial price tag on personal development and economic advancement. The factors that can lead to financial exclusion are access exclusion owing to geographical distance and risk management; price exclusion owing to unaffordability of financial products; condition exclusion due to inappropriate conditions that some people are forced to endure; marketing exclusion because of niche marketing and sales of financial products and self-exclusion resulting from people’s voluntary self-withdrawal from the formal system due to fear of rejection or psychological barriers (Kempson & Whyley, 1999; Mukherjee et al., 2019). In the economic development process, the financial exclusion of the tribal population and rural poor of the country has resulted in poverty, economic disparities, unemployment and income inequalities. Access to and involvement in the financial system can empower people, particularly those from lower socio-economic backgrounds, strata of society to gain social and economic empowerment (Mukherjee et al., 2019). Therefore, strengthening FI in the country has been one of the important developmental agendas of both the Government of India and the financial sector regulators (namely RBI, SEBI, IRDAI and PFRDA). The RBI adopted the term FI for the first time in its 2005–2006 annual policy statement, and since then, it has taken several initiatives to make this a reality (Majumdar & Gupta, 2013). However, India has a long history towards ensuring FI without the formal usage of the term. The journey of FI in India began in 1956 with the nationalisation of life insurance companies. This was followed by the nationalisation of banks in 1969 and 1980, and general insurance companies in 1972, mandatory priority sector lending by commercial banks and ‘no-frill accounts’ mandate in 2005–2006. Despite this, the status of FI in India is not up to expectations, and a sizable portion of the Indian populace remains out of the formal financial system. Therefore, the Government of India has adopted several schemes to boost FI and economic prosperity in the current century. The recent initiatives include Pradhan Mantri Jan-Dhan Yojana (PMJDY) to encourage saving and open access to credit, Pradhan Mantri Suraksha Bima Yojana (PMSBY) to provide accidental death or disability cover and Atal Pension Yojana (APY) to provide pension cover to subscribing bank account holders. Most recently, the RBI has also taken up two crucial initiatives, such as a national strategy for FI (2019–2024) to make financial services available, accessible and affordable to all citizens and a national strategy for financial education (2020–2025) to build a financially aware and empowered India. Thus, India has been on the verge of witnessing two decades of experimentation and implementation in the area of FI. As a basic measure of FI, the proportion of adults with an account in a formal financial institution rose from 35% in 2011 to 77% in 2021, which is on par with the global average. The eventual objective of FI is to eliminate poverty, eradicate income disparity and enhance economic empowerment.
However, despite consistent effort, the FI level remained low in the North East Region (NER) (Bhanot et al., 2012). According to CRISIL Inclusix (2018) score, the macro data shows that compared to the aggregate India, the FI status in NER is lower than the national level. It is believed that insufficient literacy and lack of knowledge among the tribal population have led to low levels of FI. Indian scheduled tribes (STs) have long encountered socio-economic obstacles (Guha et al., 2017). They have limited access to financial resources and the ability to improve their well-being. Due to their deprivation of modern banking and financial services, they are compelled to remain content with limited resources. Considering the above-mentioned facts, the government is striving hard to bring the maximum tribal population under a formal banking system by making them open accounts in banks or other financial institutions to encourage saving and facilitate the extension of credit. The present study investigates the financial literacy (FL), financial service usage, factors responsible for FI and demographic factors’ impact on FI among tribal community populations, with a particular focus on South Tripura district, considering the respondents from the rural areas. The study of FI in rural areas is important because the rural population contributes significantly to economic development, as observed by various studies (Hasan et al., 2020; Le et al., 2019). Lal (2018) reported that access to basic financial services such as savings, loans, insurance and credit helps to come out of poverty. By providing access to financial services to a diverse range of individuals, the entire financial system can experience significant growth and foster deeper connections within communities (Hasan et al., 2020; Rashidin et al., 2020) and be connected with the eradication of poverty (Chao et al., 2021). Mukherjee et al. (2019) found that Tripura is one of the six Indian states that demand urgent attention for the promotion of FI. The FL among the ST population in India is significantly poor. A significant proportion of the rural population belonging to STs, as many as 77% and 58% in urban areas, do not possess even the most fundamental financial knowledge, leaving them susceptible to financial abuse (Singh & Singh, 2023). Regulatory authorities with a prophetic approach, political interference, internet restrictions and an ineffective project evaluation mechanism are some of the obstacles to FI in Tripura (Maity, 2019; Maity & Sahu, 2022). This study is expected to fill that caveat in the existing literature.
Socio-economic Profile of Tripura
Tripura is the third smallest state in the country, bordered by the neighbouring country Bangladesh to the south, west and north and by the states of Assam and Mizoram to the east side. It is the second most populous state in the NER of India, following Assam. The economy of Tripura is predominantly agrarian and is marked by a significant rate of poverty coupled with low per capita income, limited capital formation, infrastructural bottlenecks, geographical remoteness and communication challenges, slow industrial progression and a high degree of unemployment. Approximately 74% of the state’s population resides in the rural areas. The state has the highest literacy rate (87.22% as per the 2011 census) among all states in India, placing third after Kerala and Mizoram in 2011. The literacy rate among the tribal population of the state is likewise remarkably high. According to the Census 2011 data, 79.23% of households in the state (78.19% in rural Tripura and 81.93% in urban Tripura) were availing banking services. There were 508 branches of commercial banks in the state in 2015–2016, which increased to 547 in the year 2021–2022. The state has a total of 548 ATMs as of March 2024, with the highest number in West Tripura (309) and the lowest in Unakoti (22).
Tribal Population Profile of Tripura
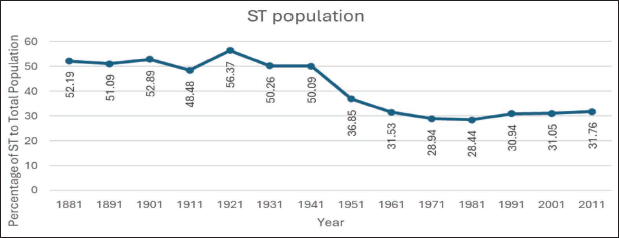
Decadal Variation in Percentage of Scheduled Tribe (ST) Population to Total Population of the State.
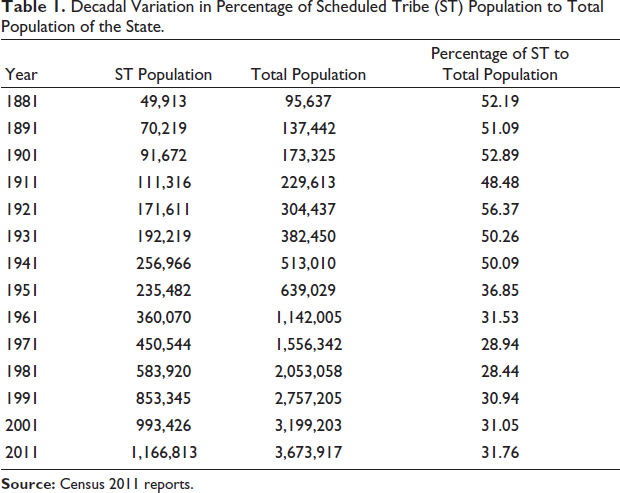
Tribal Population Profile of Tripura.
Data and Methodology
This section outlines the approach and procedures employed to investigate the level of FI among the ST population of select rural areas of Tripura. This study aims to explore the current state of FI among the ST population.
Methodological aspects have been devised corresponding to the objectives of the study. The structured schedule has been prepared with an appropriate literature review for primary data collection. The first part of the questionnaire is related to the demographic factors of respondents. The second part is related to financial awareness based on dichotomous questions corresponding to the first objective. For the fulfilment of the second objective, the questionnaire is dedicated to exploring the degree of financial service usage by the respondents. The content validity of the questionnaire has been verified in discussion with academicians in the relevant field before starting the final data collection process. From a socio-economic point of view, the study of FI among the tribal populations of the South Tripura district has significant importance because the Tripuri community people are the largest tribal community representing more than 50% of tribal communities in Tripura. Therefore, the overall economic development of the state largely depends on the development of the tribal community, which is not possible without proper FI. A representative sample has been selected based on a stratified random sampling technique to conduct the research within the given time and cost. The required primary data were collected over 6 months by qualified field investigators. A personal interview was preferred over a self-administered questionnaire, considering the low level of education and awareness among the target respondents. The study calculated the FI index based on RBI methodology. The index summarises information on various aspects of FI into a single value ranging from 0 to 100. To measure the Composite Financial Inclusion Index (CFII), we first assessed Percentage. Positive Scores (PPS), which represent the proportion of positive responses among all questions (Debi et al., 2025). We calculated the PPS separately for three key dimensions of financial inclusion: Access to financial services (Access), Usage of financial services (Use) and Quality of Financial Services (Quality) (Paul & Debnath, 2025).


Wilcoxon Rank-sum Test
The Wilcoxon rank-sum test, also known as the Mann–Whitney U test, is a non-parametric test used to compare the distribution of a continuous variable between two independent groups. In this study, we used the Wilcoxon rank-sum test to examine the difference in FI between two demographic groups, such as males and females or rural and urban residents.
Kruskal–Wallis Test
The Kruskal–Wallis test is a non-parametric test used to compare the distribution of a continuous variable among three or more independent groups. In this study, we used the Kruskal–Wallis test to examine the difference in FI among multiple demographic groups, such as different age groups, income levels or education levels.
Purpose of the Tests
The purpose of using these tests was to determine whether there are significant differences in FI between different demographic groups. By using these non-parametric tests, we can identify whether the observed differences in FI are statistically significant, which can inform our understanding of the factors that influence FI.
The Wilkinson rank-sum test and the Kruskal–Wallis test are useful for this study because they do not require normality of the data, which is often an assumption of parametric tests. Additionally, these tests are robust to outliers and can handle skewed distributions, making them suitable for analysing FI data.
Result and Discussion
The present chapter elucidates the findings derived from the study on FI among the ST population in select rural areas of Tripura. FI, an imperative for sustainable development, is pivotal in ensuring equitable access to financial services for marginalised communities. This study aims to unravel the extent of FI among the STs in Tripura, identifying critical gaps and highlighting the socio-economic implications of such disparities.
This chapter is organised into two sections: Results and Discussion. The Results section presents the empirical data collected through surveys and interviews, offering a quantitative and qualitative analysis of FI metrics. Key indicators such as access to banking services, utilisation of financial products and awareness levels are meticulously examined. The Discussion section interprets these findings, providing a contextual analysis correlating the data with broader socio-economic trends and policy frameworks. It also explores the challenges faced by the ST population in accessing financial services and proposes recommendations for enhancing FI in these regions.
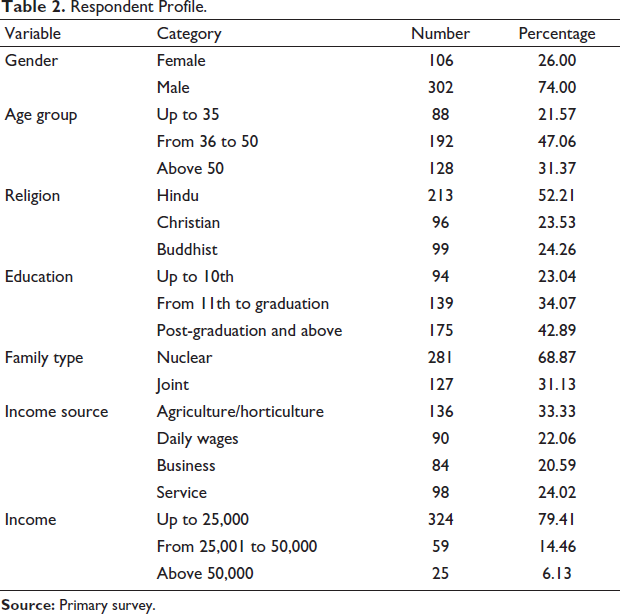
Respondent Profile.
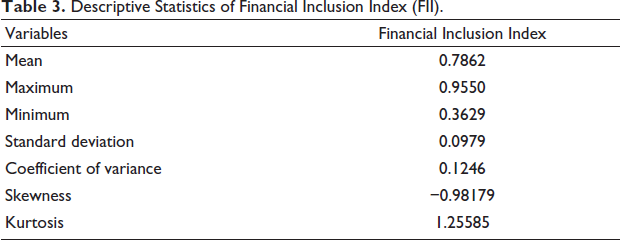
Descriptive Statistics of Financial Inclusion Index (FII).
Distribution of Respondents Based on Financial Inclusion Index (FII).
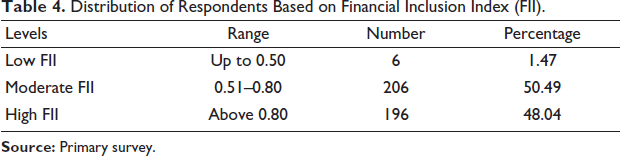
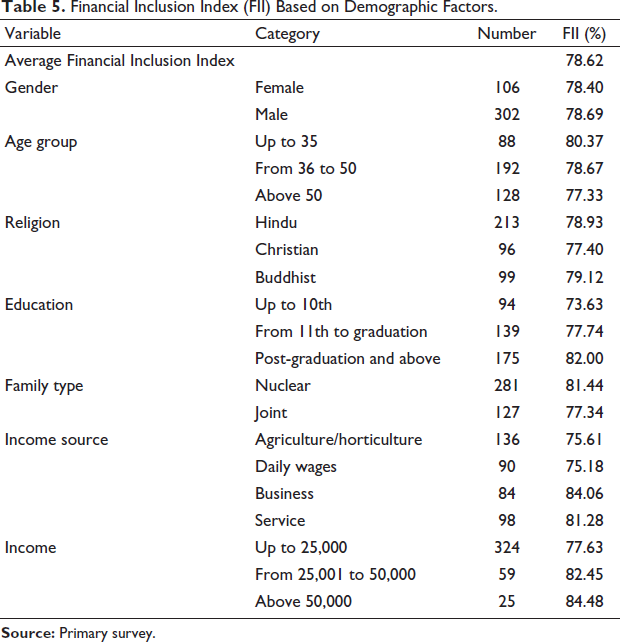
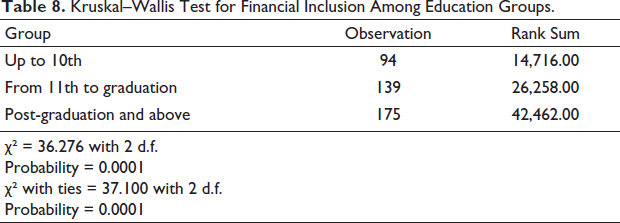
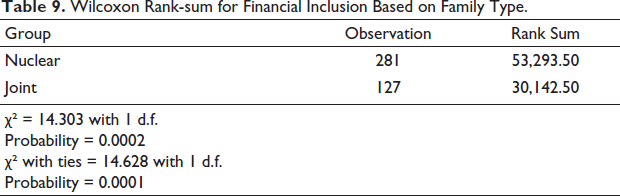
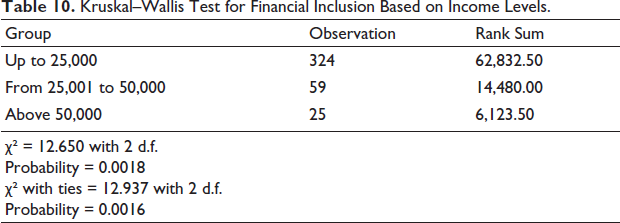
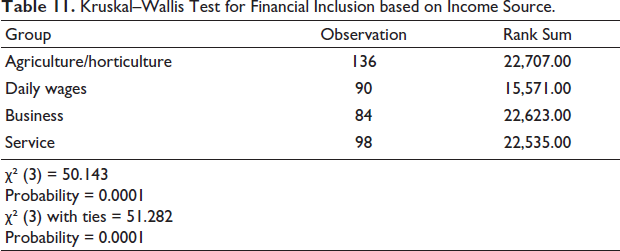
Table 5 describes respondents’ overall FL status and differences in FL based on socio-economic backgrounds. Overall, FL among the surveyed respondents is about 78.62%. The FII, based on various demographic factors, reveals interesting trends and disparities in FI. The overall average FII is 78.62%, reflecting a generally strong level of FI among respondents. Gender differences are minimal, with males (78.69%) having slightly higher inclusion than females (78.40%), indicating near-equitable access to financial resources. Age-wise, younger individuals (up to 35 years) exhibit the highest FII at 80.37%, while the inclusion declines for older groups, with those above 50 recording the lowest FII at 77.33%. Educational attainment strongly influences FI, as respondents with post-graduate education show the highest FII (82.00%) compared to those with education up to 10th grade (73.63%), emphasising the role of education in improving FL and access. Income also correlates with FII—respondents earning above ₹50,000 achieve the highest inclusion (84.48%), while those earning up to ₹25,000 have lower inclusion (77.63%). Similarly, those in business (84.06%) and service (81.28%) sectors report higher inclusion, while agricultural workers (75.61%) and daily wage earners (75.18%) lag behind. Family type also matters, as nuclear families (81.44%) demonstrate higher inclusion than joint families (77.34%). Religious differences show Buddhists with the highest FII (79.12%), followed by Hindus (78.93%) and Christians (77.40%). These findings underscore the need for targeted policy interventions, focusing on vulnerable groups such as the less-educated, lower-income earners, older individuals and those in informal sectors like agriculture and daily wages. Enhancing access to financial services for these groups can further close the gaps and promote equitable FI for all.
Financial Inclusion Index (FII) Based on Demographic Factors.
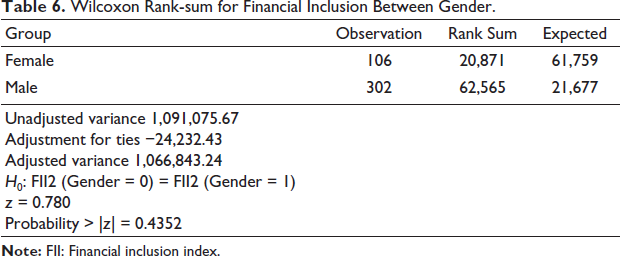
To investigate the FI difference between male and female groups, we used the Wilcoxon Rank-Sum (Mann–Whitney) Test.
Wilcoxon Rank-sum for Financial Inclusion Between Gender.
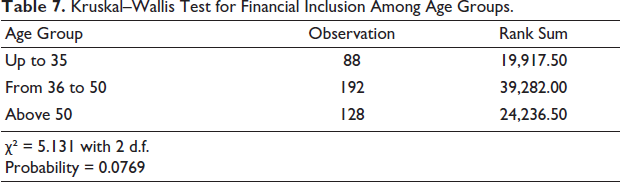
Kruskal–Wallis Test for Financial Inclusion Among Age Groups.
Kruskal–Wallis Test for Financial Inclusion Among Education Groups.
Wilcoxon Rank-sum for Financial Inclusion Based on Family Type.
Kruskal–Wallis Test for Financial Inclusion Based on Income Levels.
Kruskal–Wallis Test for Financial Inclusion based on Income Source.
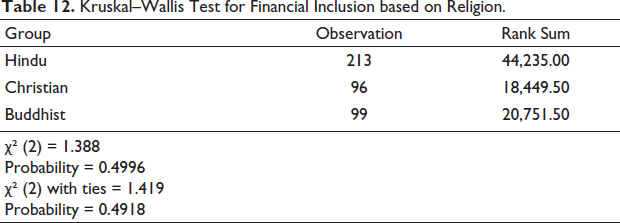
The Kruskal–Wallis test results presented in Table 12 in connection with FI based on religion indicate that there are no statistically significant differences among the three groups (Hindu, Christian, Buddhist). The χ² values (χ²(2) = 1.388 without ties and χ²(2) = 1.419 with ties) are very small, and the associated p values (.4996 and .4918) are much higher than the conventional threshold of .05. This means that FI levels are broadly similar across religious groups, and religion does not appear to be a determining factor in access to or participation in financial systems. This suggests that financial institutions and policymakers should focus on socio-economic variables (such as occupation, income stability or education) that have a stronger impact. The finding reinforces the idea that FI policies should remain religiously neutral, ensuring equal access across communities while prioritising groups disadvantaged by economic or occupational factors.
Kruskal–Wallis Test for Financial Inclusion based on Religion.
Conclusion and Implications
FI is critical to socio-economic development, particularly for marginalised communities, such as the ST population in rural areas. It ensures that individuals and businesses within these communities have access to essential and affordable financial products and services. These services include banking, credit, insurance and digital transactions, all offered in a manner that is sustainable and beneficial to their long-term economic health.
FI plays a pivotal role in advancing social equity, empowering individuals and fortifying communities by enabling them to engage more actively in economic activities. For marginalised groups, especially the ST population, FI serves as a vital element to mainstream economic systems, offering them expanded opportunities for savings, investment and access to credit. Furthermore, examining FI in rural areas is essential because the rural population contributes significantly to overall economic development and productivity.
The present study provides valuable insights into various aspects of FI, such as FL and the usage of financial services. It focuses particularly on the South Tripura district, analysing responses from individuals in rural settings. The study’s findings indicate that FI among the population is approximately 78.62%. The level of FI varies across different age groups, with younger respondents demonstrating higher FI compared to older respondents. Moreover, there is an absence of significant disparities in FI based on gender and religion. This is particularly encouraging, given that the RBI Report, 2023, highlights a trend where females typically possess lower FL levels compared to their male counterparts. The equal levels of FL observed among both male and female populations within the tribal communities of South Tripura lead to an overall higher level of FI in the region. In addition, the FII scores recorded in the study are moderately high, indicating a substantial degree of FI within the population. The findings reveal that the majority of respondents exhibit moderate to high levels of FI.
To conclude, this study highlights the multifaceted nature of FI among the tribal community in South Tripura, emphasising its significance not only for economic advancement but also for social empowerment and community development. Continued efforts to enhance FL and promote access to financial services will be critical in bridging the economic divide and fostering inclusive growth in these marginalised populations. Government and policymakers should prioritise the enhancement of effective FI programmes, with a particular focus on digital banking, mobile money services and microfinance options. Improving digital infrastructure and lowering transaction costs can further increase accessibility. However, it is important to recognise that the study’s findings may not fully represent the broader population. Future research could expand the scope by including diverse communities across different regions, which would allow for a more comprehensive understanding of FI challenges and opportunities.
Social Implications
The study’s findings on FI among the ST population of select rural areas of Tripura have several social implications: The study’s findings help increase financial awareness and literacy among the ST population, enabling them to make informed decisions about their financial resources. Understanding the FI needs of the ST population, efforts can be made to improve their financial management skills and practices. By promoting FI, the study’s findings contribute to improved livelihoods and economic well-being among the ST population. The study’s findings help address financial exclusion and promote FI among the ST population, reducing social and economic inequalities. By understanding the FI needs of the ST population, efforts can be made to promote inclusive growth and development. The study’s findings help empower marginalised communities, including the ST population, by providing them with access to financial services and promoting FL. By addressing financial exclusion and promoting FI, the study’s findings contribute to promoting social justice and equality.
Footnotes
Declaration of Conflict of Interests
The authors declare no potential conflict of interest with respect to the research, authorship and/or publication of this article.
Funding
The authors disclosed receipt of the following financial support for the research, authorship and/or publication of this article: The authors acknowledge the grant received under the scheme of Studies on the Culture, History and Geography of the STs of India (Award Letter No. 02/69/2022-23/OBC/TS/RP dated 3 August 2023) from Indian Council of Social Science Research (ICSSR), New Delhi, India.