
Abstract
Health equity is of particular concern in the Indian context in the light of widening economic inequality and healthcare reforms which have wider ramifications on healthcare access. Despite various programs and interventions, a wide gap in health condition is observed in society among different castes, groups and income-classes. In this article, the inequality in healthcare access is studied at the cross-section of gender (man and women) and social groups—Schedule Caste and Schedule Tribe (SC-ST), Other backward classes (OBC) and Others—and an attempt has been made to explore how much the women from SC-ST community are deprived of healthcare access in comparison to other gender-group intersections. To proceed with analysis, data on ‘National Sample Survey (NSS), 75th Round (2017–2018) on Health Consumptions’ are taken. Analyses are carried on in SPSS Ver.18 and Stata-16. Regression Analysis shows that women from SC-ST are 1.37 times more likely to non-access to healthcare services than men from the general category. Further, to measure the intensity of inequality in healthcare access, Wagstaff’s Concentration Index (CI) is calculated at –0.195 that shows income-related inequality highly persists among the poor. At last, the decomposition analysis of CI reveals that gender, income and social groups are some of the major contributory factors to CI, that is, health inequality. The results indicate despite the mandate of universal healthcare access, India is lagging in achieving equity in healthcare as the poor and marginalized are deprived of it.
Introduction
Equity in the provision of healthcare is a principal goal of the health system as differentials in healthcare access exacerbate health inequalities leading to unequal health outcomes (Culyer et al., 1992; Mooney et al., 1991; Wilkinson & Marmot, 2003). The COVID-19 pandemic has peeled off the harsh reality of poor health infrastructure and lack of coherent health policy of India. Even most of the developing countries have hugely suffered from lack of appropriate health infrastructures and robust health policies on health services and disease prevention. The health expenditure in India is currently abysmally low. In 2018–2019, the health expenditure was 1.5% of GDP which is significantly lower than the European countries’ average spending of 7%–8% of GDP and WHO’s recommendation of 5%–6% of GDP (The Hindu, 2021). Out of the pocket (OOP) expenditure on health is also too high. The government’s share on health expenditure is around 27% while the rest of the 63% of expenditure is borne by the household (Financial Express, 2021). Such high OOP expenditure adversely affects middle-income and poor-class people. In an estimate made by SOS Children’s Villages (2021), Canada, around 68.8% of the population of India lives on less than $2 a day and 30% live on less than $1.25 per day and are considered extremely poor. Such high OOPS further push them to extreme poverty and destitution. The COVID-19 pandemic has further pushed 75 million people to poverty during 2019–2020 (Lee, 2021). The NSSO 71st round report shows around 8.1% and 7.9% population in the rural and urban sectors fell below the poverty line due to high OOP expenditure (Sangar et al., 2019).
Poor health infrastructure and high OOP expenditure have led to health inequality that has always been deeply persistent in our society. Despite of constitutional guarantee of ‘Right to health’ and India’s commitment to Sustainable Development Goal (SDG) goals—3 (Health) and 5 (gender equality), India is far behind in providing a subsistence level of health services. Apart from supply-side challenges, social determinants like caste, class, gender and their intersection also play a significant contributory role in widening health inequality. Hence, inequality in healthcare access is caused by both demand and supply side factors.
Gender and caste are two prominent factors that are deep-rooted in social structure of India (Newman & Throat, 2007; Shah & Jodhka, 2010) and significantly contribute to inequality in the attainment of higher education, employment, access to other public services like PDS, vaccination, enrolment to Aadhaar, public transportation and of course health services. Further, the situation gets worsen if a person belongs to the intersection of the lowest ranks of socio-demographic variables like, women from SC-ST group, women who are illiterate, women from rural area, SC-ST people who are illiterate, and so on. Most of the past empirical studies have addressed the inequality on a single dimension of socio-economic attributes and the interplay of caste, class and gender has largely been neglected (Sen et al., 2009; Sen et al., 2012). Therefore, the intersectionality approach to address the inequality in healthcare access across the axes of social differentiation like caste, class and gender has emerged as a prioritized area of research in health equity (Kelly, 2010; Ostlin et al., 2011). The intersectionality approach is also important to identify the actual beneficiaries of public services as most of the government’s services are targeted at the most deprived class. For example, under the National Rural Health Mission (NHRM), the government provides quality and affordable healthcare services to the vulnerable section of society including the SC-ST community. Similarly, Janani Suraksha Yojana is meant for providing kinds of maternity services, especially to women from the SC-ST group.
Research studies to date in India often explained inequalities in access in terms of healthcare utilization. The findings of these studies suggest that social dynamics of class, caste and gender along with health system issues explain adequately health inequality (Bang et al., 1989; Baru et al., 2010; Mukherjee et al., 2011; Prinja et al., 2012). These studies examine the social determinants of health inequality among those utilized with little emphasis on factors causing unmet needs. A recent study on health inequality (Mahapatro et al., 2021) examined the contribution of income and gender in determining unmet needs with little emphasis on the social group and its intersection with gender. the present study thus attempts to fill this gap by examining how social inequalities in health operate at different levels leading to unmet needs for healthcare access.
In this article, first, we have tried to figure out the contribution of different socio-economic and demographic attributes to inequality in healthcare access in India. Second, the intersectionality approach is used to determine the inequality in healthcare access at the intersection of gender and caste. The finding of this article would help to address the health inequality at the lowest strata of society by appropriate intervention and more equitable distribution of resources
Gender Inequality and Health
Gender inequality between men and women is observed in almost all spheres of life and in most the countries. Such inequality is less observed in developed countries but significantly higher in developing and undeveloped countries. In India, gender inequality exists right after they are born. According to the UN’s World Population Prospects 2019, the sex ratio in India is 108.18 males per 100 females in 2020 which has significantly increased from the ratio of 104.40 in 2050. In the same year 2020, India placed at the rank of 140 among 156 countries on WEF’s gender Gap Index and closed 65% of its gender gap to date. The position of India is poorer than its neighbours like Bangladesh, Nepal and Bhutan which are placed at 65th, 106th and 130th positions although better than Pakistan (153) and Afghanistan (156). Gender inequality is also significantly observed on the ‘Health and Survival Subindex’ where India has closed 93.7% of the gap to date and ranks among the bottom five countries on the subindex. The gender gap and the efforts to bridge the gap show wide variability across states. As per Census 2011, the sex ratio in Kerala and Puducherry is in the favour of women (1,084 and 1,037 per 1,000 men, respectively) while Delhi and Haryana have been worst at the sex ratio of 868 and 879 respectively.
As per the Sample Registration System (SRS) Report (2016–2018) by the Registrar General of India, the maternal Mortality rate (MMR) is 112, a gradual fall from 122 (SRS (2015–2017) and 130 (SRS 2014–2016)). Assam is the worst performer state with MMR of 215 followed by Uttar Pradesh (197), Madhya Pradesh (173) and Chhattisgarh (159). Top performer states are Kerala (43), Tamil Nadu (60) and Telangana (63). Besides mortality, there are several other illnesses that Indian women specifically face. Undernutrition and Anaemia largely prevailed among them. According to National Family Health Survey (NFHS-4, 2015–2016), the proportion of non-pregnant anaemic women in the age group of 15–49 years is 53.2% while the proportion of pregnant women in the same age group is 50.2%. Further, only 30.3% of pregnant women take iron tablets as prescribed and only 21% of mothers take full antenatal care (NFHS-4, 2015–2016). The report also shows that 22.9% of girls and women in the age group of 15–49 are underweight. Other prevailing illnesses include breast cancer, menstrual problem and mental health. According to Zodpey and Negandhi (2020), ‘Differences in access to health care and the power to seek health care remain major factors influencing illnesses to women’. The in-patient health expenditure for men is 1.5 times higher than for women.
Poor healthcare access to women is clearly observed in Indian society and families. The Indian patriarchal society and the traditional social customs in Indian families have held the root so deep in the mind that women subconsciously assume themselves inferior to men and they believe that men by default, deserve preferences over so many things like food, clothes, property, education and of course healthcare. In a study conducted by Moradhvaj (2019), it is found that more than 70% of women are engaged in unpaid household chores that are economically considered unproductive activities and hence, their health conditions are underestimated and neglected.
Caste Inequality and Health
The caste system of Indian society exists for a long time and it has been so assimilated in the social structure that one can find the brunt of being lower caste in every sphere of life. As per Stata (2020), 41% of the population belongs to ‘Other backward Class (OBC)’ followed by 30% from the forward class. The proportion of SC and ST are 20% and 9% respectively. As per 2011 Census, Punjab has the highest SC to the total population of 31.94% followed by Himachal Pradesh (25.19%) and Haryana (20.19%). North Eastern states are a cluster of ST population where Mizoram has the highest ST to the total population of 94.44% followed by Nagaland (86.46%) and Meghalaya (86.15%). The caste factor is largely observed in Indian society. Upper castes have the highest level of income, expenditure, education and land ownership followed by OBC and SCs (Bharati, 2018). State-wise caste inequality shows that Haryana and Punjab are at the forefront of caste-based inequality but low on the practice of untouchability and caste-based violence while Gujrat and Andhra Pradesh have witnessed exclusion and violence against lower caste people (Chakrabarti, 2013).
Caste has been one of the major determinants of health inequality and several empirical studies have confirmed it. Jungari and Chauhan (2017) studied the National Family Health Survey (NFHS) data for the period 2005–2006 and found that SC and ST women and children are at greater disadvantage on all the health indicators as compared to other groups. Wealth and income are highly unequally distributed among different castes. SC and ST have the lowest per capita income than upper caste (Bharti, 2019) and hence, they are less capable to spend on healthcare services. Therefore, caste-based inequality in health expenditure is highly observed and in turn, unequal access to quality health services (Mukherjee et al., 2011).
‘Untouchability’ has been cursed on Dalits that not only led them to poverty and misery but also prevented them to get equal opportunities in health, education and employment. Despite of constitutional provision for the prevention of untouchability under article 15, it widely prevails in Indian society. According to Tan (2016), more than 20% of Dalits have no access to safe drinking water which results in fatal illness like diarrhoea, malaria, jaundice and Typhoid severely affecting the child’s health and mortality. …Further, 21.3% of Dalits are prevented from going to clinics and private health care and healthcare workers also reserve themselves from go to 65% of Dalit communities. Boorah (2007) found in his study that among the 15% of Hindus who didn’t receive the prenatal care, 26% of them were Dalits, while for post-natal care, the percentage of Dalits was 36%. Similarly, Guha (2007) observes that 15.6% of Dalits have no access to healthcare services and only 57.6% of Dalit children are immunized. Mishra et al. (2021) find that around 68% of SC women, 78% of ST women and 80% of OBC women receive institutional delivery services against 83% of forward caste women. ‘Janani Suraksha Yojana (JSY)’ is a maternal health service run by the government where the difference of access by SC/STs women against non-SC/STs is as much as 54%. Kowal and Afshar (2015) have pointed out three underlying factors of a caste system that affect health—early environment, genetics and opportunities due to social mobility which compound the resulting disadvantages.
Data and Methodology Used
To capture the health inequality between SC/ST women and others, the National Sample Survey (NSS) data—75th round on ‘Social Consumption in India: Health’ is used. The data is taken from the ‘Ministry of Statistics and Programme Implementation, Government of India’ website—mospi.gov.in. Unit-wise data are merged together in SPSS and then the analysis is carried on by using both SPSS and STATA software.
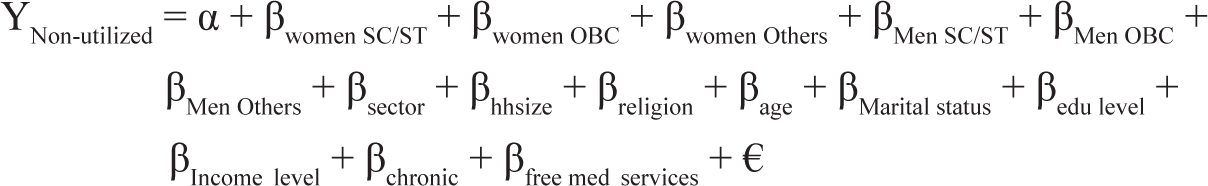
A regression model is constructed to establish the cause–effect relationship between variables—‘utilization of health services’ and ‘gender-caste interaction’. The variable—‘utilization of health services’ is considered a dependent variable and is already given in NSS data which has two outcomes—Yes and No and hence they are coded as 0 (Yes) and 1 (No) respectively. Further, the variable ‘gender’ has two outcomes—women and men that are coded as 1 and 0 respectively. The variable ‘caste or social group’ has so many responses that few of them are combined and categorized in mainly three major castes—SC/ST, OBC and others and hence, coded as 1, 2 and 0 respectively. Now to capture the effect of gender-caste interaction on healthcare utilization, we create six new dummy variables by using the ‘gender’ and ‘caste’ variables and those variables are—female_SC-ST, female_OBC, female_Others, male_SC-ST, male_OBC and male_Others. So, the variable ‘female_SC-ST’ has two codes—(a) a women who is also SC-ST is coded as 1 otherwise 0; (b) female _OBC is coded as 1 if a women is from OBC otherwise 0 and so on.
Apart from them, few controlling variables like ‘status (rural/urban)’, ‘household size’, ‘religion’, ‘income’, ‘age’, ‘marital status’, ‘education level’, ‘whether chronic illness’ and ‘whether avail free medical services’ are taken and they are categorized and coded as we found appropriate. Since the dependent variable—‘utilization of health services’ has a binary outcome (1 and 0), we use logistic regression and the model is as follows:
To measure health inequality, the Wagstaff’s Concentration index (CI) is generally used to show how much inequality in one variable is present due to the distribution of other variables. The difference between ‘yes’ and ‘no’ of the variable—‘utilization of health services’ represents the inequality in this variable that may be affected by several underlying factors like gender, income, caste, education and so on. The value of CI lies between –1 and +1 and hence, a negative CI value will represent the inequality in the ‘utilization of health services due to underlying factors’. The decomposition analysis of CI will further let us know to what extent a variable is responsible for inequality in healthcare utilization.
Analysis and Discussion
Descriptive Statistics
The sample size of data is around 43,420 in which 39,365 individuals (91%) utilize health services while the rest of the 3,875 individuals (9%) do not utilize healthcare services. The percentage of utilization and non-utilization of healthcare services across the different social groups in each gender category is given in Table 1.
Non-utilization of Healthcare Services.
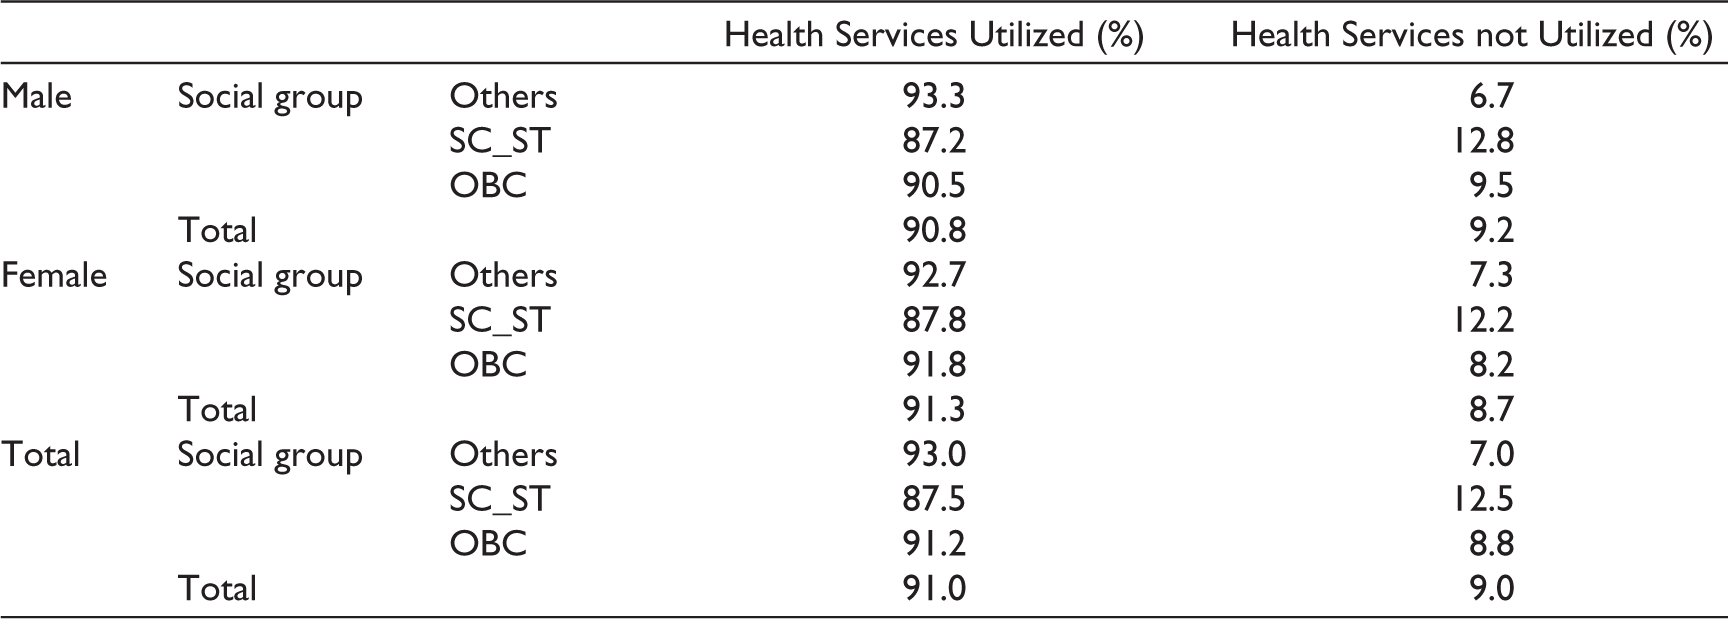
The difference between utilization and non-utilization of healthcare services across the social groups is highest in both men and women. In total, 12.5% of SC-ST individuals do not utilize healthcare services followed by 8.8% of OBC and 7% of Others. Among men and women of SC-ST, the proportion is highest at 12.8% and 12.2% respectively who do not utilize health services, while in OBC it is 9.5% and 8.2% respectively. Individuals from other groups have the least gap in non-utilization across gender. Hence, in the SC-ST group which is socially marginalized, and also deprived of the utilization of healthcare services, the condition of women is a little better than their counterparts. A similar situation is also observed with the OBC group, although better than SC-ST across the gender.
Regression Analysis
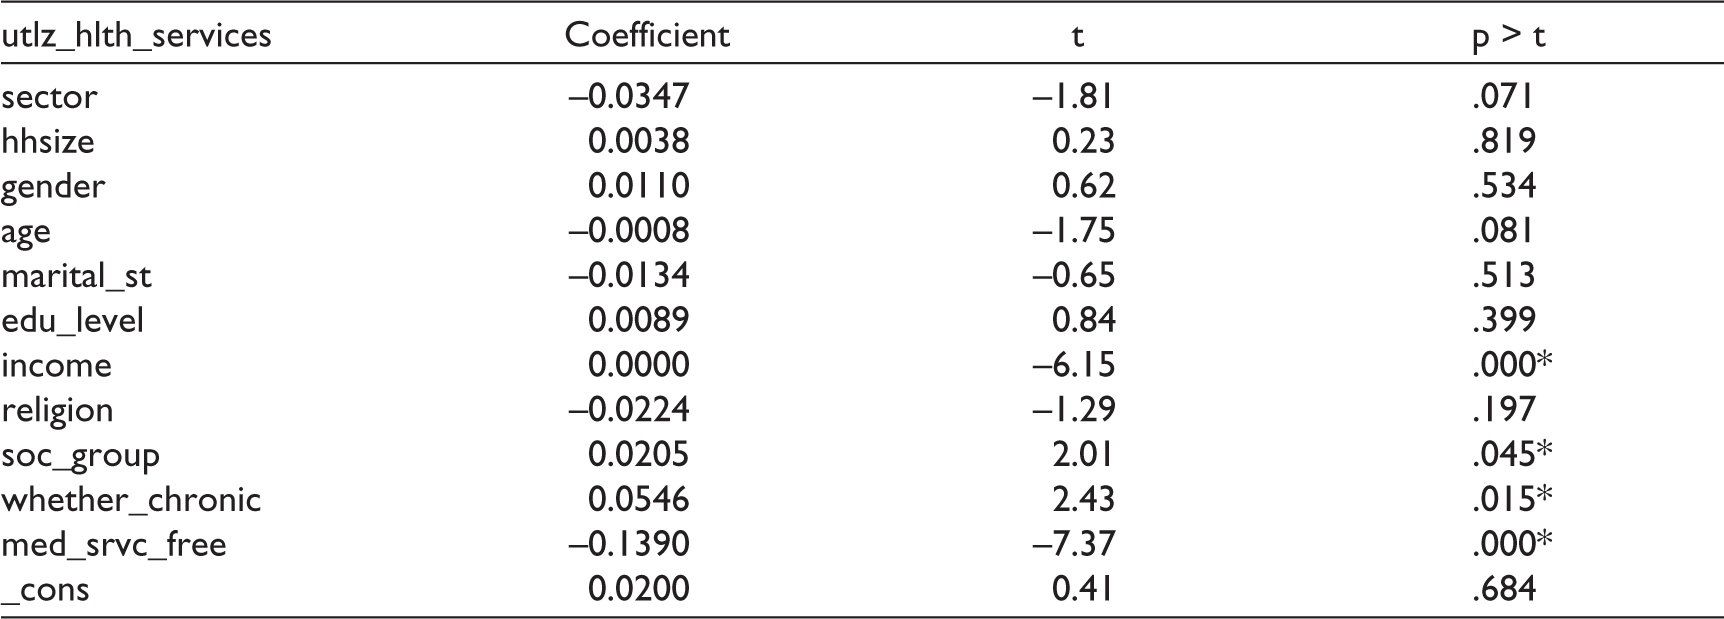
The regression is run as per the model where the ‘utilization of health services’ is taken as dependent variable and the rest of the other socio-demographic variables as the independent variable. The logistic regression is run in STATA whose output is shown in Table 2.
Regression Output.
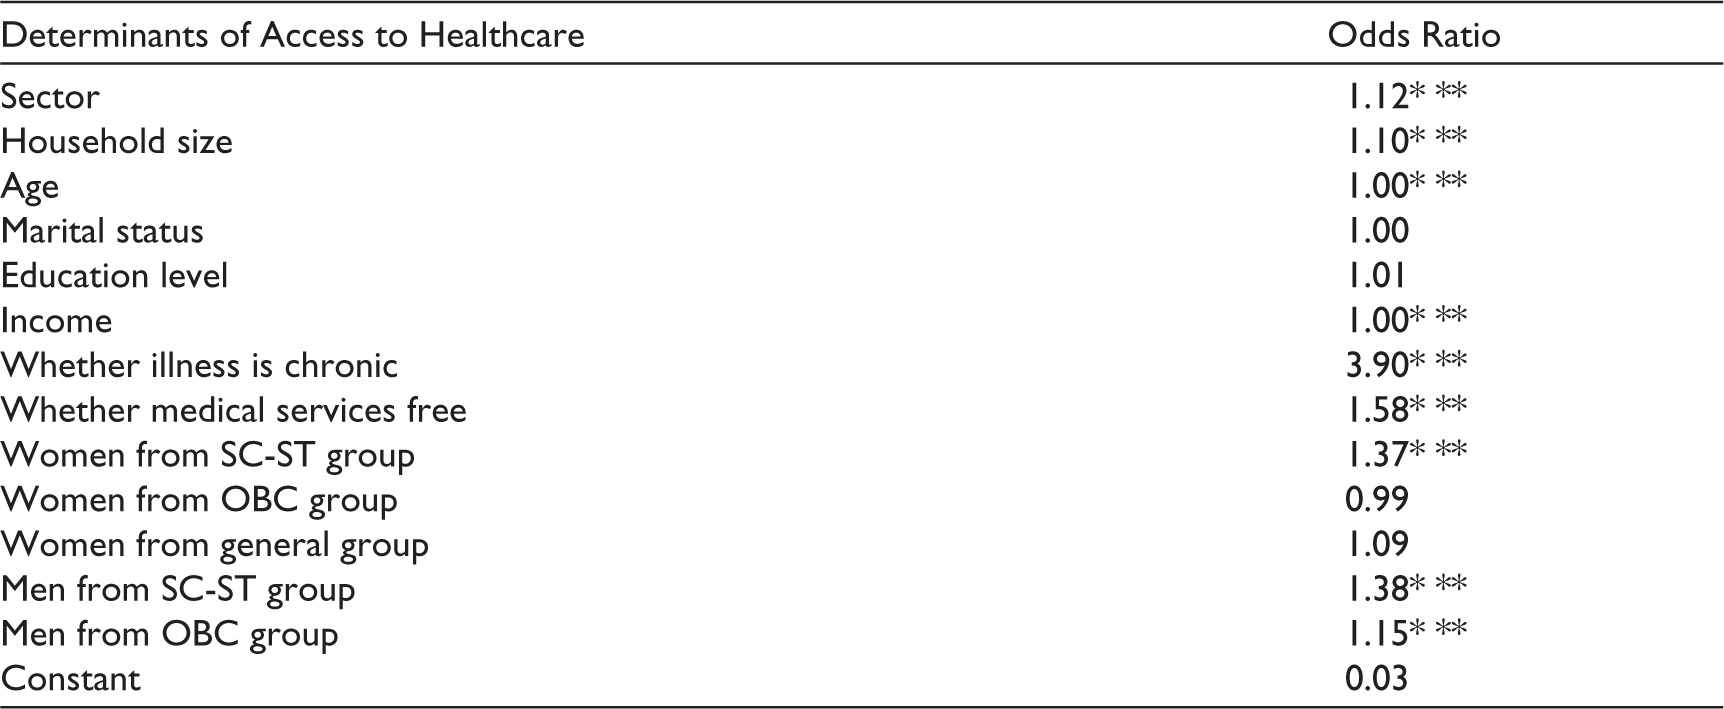
The result shows that variables—sector, household size, age, income, whether the illness is chronic, whether availed free medical service, (female_SC-ST, male_SC-ST and male_OBC) significantly affects the utilization of health services. Women from the SC-ST group is 1.37 times more likely to non-utilize health services than men from the general category. Similarly, women from SC-ST and men from the OBC group are 1.38 and 1.15 times more likely to non-utilize health services than men from the general category. Hence, the condition of both men and women from SC-ST group are equally likely to deprivation of healthcare utilization. However, ‘whether illness is chronic’ has the highest effect on healthcare non-utilization, the result shows that a person having a chronic illness is 3.90 times more likely to non-utilize healthcare services. The other significant factors are sector, household size, age, income and free medical services. Hence, our result confirms the earlier studies that found poor access and utilization of healthcare services for women and low-caste people.
Concentration Index
To determine income-related health inequality, we refer non-utilization of health services as a health sector variable and to any (continuous) measure of socioeconomic status as income. Income-related health inequality through CI is determined by plotting the cumulative proportion of health across individuals ranked from lowest income to highest income, that is, poorest to richest. The 45o line indicates no relationship between health inequality and income variable, that is, show equality of health across income. Unlike the Lorentz curve, the CI curve may lie above the 45o line that shows the health or more likely the measure of ill-health is highly concentrated among the individual of low income. Mathematically, CI is calculated by using the formula:
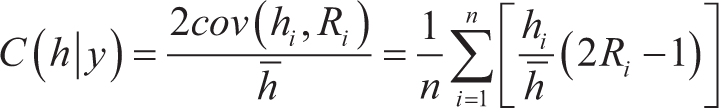
Where hi is the health variable like ill-health in which the inequality has to be measured and Ri is the Rank of individuals with income variable. The range of CI is (1–n)/n to (n–1)/n where n is the total number of individuals. Therefore, CI can vary between –1 and +1. Any negative value of CI represents higher income-related health inequality among the poor, that is, pro-poor and positive CI represents pro-rich health inequality.
Income-related health inequality is measured here through Wagstaff-type CI (Wagstaff et al., 1991) and hence, Table 3 shows the CI result of our analysis.
Here, the CI value is negative at –0.195 which is significant and hence we can conclude that income-related health inequality significantly persists among the poor. Figure 1 shows the Concentration curve for the year 2017–2018.

Wagstaff CI.

The CI is above the 45o line clearly shows health inequality among the poor, that is, the non-utilization of health services is pro-poor.
Decomposition of CI
Several factors may have significant contribution to the health inequality and therefore, the health inequality can be further decomposed into contributory factors in which the contribution of each factor is the product of sensitivity of health to that factor and the degree of income-related health inequality in that factor (Wagstaff et al., 2003). The CI can be written as
Where, µ is the mean of y, health variable;
Decomposition of CI.
The result shows that ‘social group’ has a significant contribution to income-related health inequality although gender has no significant contribution. Another significant contributory factors are ‘whether illness is chronic’ which has actually the highest contribution. Income distribution varies significantly across the different social groups. Most marginalized people belong to the SC-ST group and OBC and thus, they have poor access to healthcare services and therefore, large health inequality is observed across groups.
Conclusion
Inequalities in health with continuous govt initiatives are expected to be narrowing down as the health needs of the disadvantaged group are prioritized. Despite the rhetoric of universal health coverage, the study finds a certain section of the population still is deprived of accessing healthcare services. The analysis suggests that besides income-class, the position in the social hierarchy that is social group and gender are the social factors that contribute to non-access to healthcare services. The study shows the condition of women from the SC-ST group is worst in accessing healthcare services. Therefore, specific programs and policies should be designed for these vulnerable women whose healthcare needs were not met due to their social status.
Our study has also some limitations. First, the poorest access to healthcare is observed among women from SC-ST group in comparison to men from the general category but the article fails to describe the level of inequality within the SC-ST group itself due to the rural–urban gap, the income gap and the educational gap. Second, the study is based on NSS data and hence, is limited to analysing the demand side barriers that are difficult to be explored. Third, the cognitive behaviour towards illness and treatment also inhibits to access healthcare services and hence, needs to be incorporated in a study for a better insight into the cause of health inequality.
Footnotes
Declaration of Conflicting Interests
The authors declared no potential conflicts of interest with respect to the research, authorship and/or publication of this article.
Funding
The authors received no financial support for the research, authorship and/or publication of this article.