
Abstract
Traditionally, nomadic communities have earned their livelihood through community-based occupation with less occupational diversity. However, under the influence of modern development processes, administrative policies and programmes, nomadic communities’ traditional means of livelihood have been severely affected. As a result, they shifted from traditional to modern means of livelihood. Based on data collected from India’s censuses from 1981 to 2011, the present study explores the changes occurring in the occupational domain of one of India’s nomadic communities—the Sapera community—living in Haryana. Traditionally, the community earned a living from snake charming and herbal medicines. The study’s findings reveal a decreasing trend of primary and household industry–based workers. Further, the study finds a significant increase in their engagement in cultivation and other works that are not their traditional occupation. Based on the study’s findings, it is recommended that the researchers and concerned developmental authorities carry out an in-depth livelihood analysis among the nomadic Sapera community to explore and understand the changes occurring in the livelihood domain of the community. Thus, a people-centric policy can be framed by policymakers to promote the welfare and development of Saperas.
Introduction
Livelihood
The term ‘livelihood’ can be used in many ways. Conceptually, it refers to the means, activities, entitlements and assets by which people or a group of people make a living, attempt to meet their various consumption needs and economic necessities and cope with uncertainties and respond to new opportunities (Tiwary, 2020). According to the Department for International Development, ‘A livelihood comprises the capabilities, assets (including both material and non-material), and activities required for a means of living’ (DfID, 1999). On the other hand, an ‘occupation’, which is a livelihood activity, can be defined as an individual’s specialized activity to earn a living, and it has three aspects, namely economic, technological and social (Singh, 2020). The economic aspect is related to the mode of payment, that is, in cash or kind. In contrast, the production tools, such as manual, handicraft and machines, comprise the dimensions of technology of an occupation. Further, each occupation is attached to a social status that is directly linked with the degree of freedom in a society, particularly a traditional one. With the introduction of science and technology and the capitalist system of production, all aspects of occupation have gone through a tremendous change and thus drastically affected the lives and livelihood of tribes (Singh, 2020, p. 173). Occupational change has been primarily understood as a change in the activities of the members of a society to earn their livelihood (Desai, 1971). The present study, based on India’s census data, is an attempt to look into the dimension of ‘activities’ of livelihood among one of the country’s nomadic tribes, Sapera, in the state of Haryana.
A Brief Introduction to the Sapera Community
Sapera is a nomadic community of snake charmers found in North India and has ‘Nath’ as their common title (Idate, 2017; Singh, 1994). The people of Sapera community live in camps on the outskirts of most of the towns (Idate, 2017) and on the fringes of agricultural fields in the villages (Dutt, 2004). The Sapera community refers themselves by various regional name in Haryana and other different states of the country (Dutt, 2004, p. 18). In Haryana, they are called Sapela, Nath and Jogi Nath; Kalbeliyas in Rajasthan; and Jogi in Punjab. In India’s different states, the Saperas are classified in different constitutional categories, namely Scheduled Caste (SC), Scheduled Tribe (ST) and Other Backward Classes (OBC). Further, in some states, the community has also been tagged as ‘De-notified Tribe’ (DNT). DNTs are the erstwhile criminal tribes of India, which were declared as ‘born criminals’ or ‘hereditary criminals’ under the Criminal Tribes Act on 12 October 1871 under the colonial rule in the country (Dandekar, 2018). Since the inclusion of a particular community in the list of Criminal Tribes, prepared during colonial rule, was not uniform across the states of India, therefore, a particular community may be found to be de-notified in one state but not in another state (Radhakrishna, 1989). However, in the case of the Sapera community, it has been classified as ‘nomadic’ and ‘de-notified community’ or ‘erstwhile criminal tribe’ in NCT of Delhi, while in the state of Haryana, and its surrounding states of Punjab, Uttar Pradesh and Rajasthan, the community is classified as ‘nomadic community’ only.
Constitutional Classification of the Sapera Community in India
To find out the inclusion of the Sapera community in the constitutional category, the study of the administrative history of Haryana becomes very important. Before tagging the state with Punjab by the British government in 1858 as a political punishment due to the emotional participation of Haryanvis in the First War of Independence in 1857, the state of Haryana was part of the North-Western Province (Haryana State Gazetteer, 2004, p. 21). On 1 November 1966, Haryana came into existence as India’s 17th state with seven districts, namely Gurgaon, Ambala, Rohtak, Mahendergarh, Hissar, Jind and some parts of Sangrur (Haryana State Gazetteer, 2004, p. 4). In 1936, when the Government of India’s Scheduled Castes Order was published, the Sapera/Sapela community was listed among Punjab state’s 27 SCs (Government of India, 1936, p. 3). However, it is clear that the Sapera community was classified as one of the SCs of the Haryana state in 1936.
Since the Sapera community is known by various regional names in different states of the country, the communities with such different regional names have been identified as separate castes/tribes in the respective states. Thus, their constitutional classification also varies. For instance, in Punjab, the Sapera community has been classified as a SC, while the Jogi/Jogi Nath community is identified as Backward Class (Idate, 2017). In the state of Rajasthan, the Sapera/Kalbeliya community is one of the state’s 59 SCs. Further, in Rajasthan, the community with Jogi Kalbeliya, Jogi Kanpatha and Jogi Nath names is identified as OBC, whereas the Jogi Kanipa community is not listed in any constitutional category (or general category). In the state of Uttar Pradesh, the Sapera community is not classified in any of the constitutional categories, namely, SC, ST and OBC, while the Jogi community is one of the state’s OBCs.
Traditionally, the Sapera community has earned a living through snake charming. Additionally, the Saperas have played a significant role as traditional healers for a large mass residing in rural and urban parts of the country. However, the rise of the market economy and industrialization and declaring the natural forests as government property by the Indian Forests Act 1865 and subsequent amendments, followed by the declaration of the CTA 1871, did not only drastically affect the lives of tribal and nomadic communities but also endangered their very existence and survival (Singh, 2020). The introduction of modern means of entertainment, namely cinema, mobile phones, television and radio, has affected the livelihood of entertainers (i.e., Dombari, Chitrakathi, Kolhati, Bahurupi, Nats, Madari, Qalandars and Sapera), and Wildlife Conservation Acts have affected the nomadic communities (i.e., Nandiwallas, Garudi, Makadwale, Madari and Sapera), whose lives and livelihood were based on wildlife flora and fauna (Bokil, 2002). Several studies point out occupational change among tribal communities in India. Sinha (1984) informs that the Hill Kharia of Purulia, who were hunter-gatherers, were restricted to small agriculture and, from there, slowly shifted to making brooms and fish traps for their survival.
Structural Transformation and Occupational Change in India
Structural transformation is defined as the transition of an economy from low productivity and labour-intensive economic activities to higher productivity and skill-based intensive activities (United Nations Human Settlements Programme, 2016). It also refers to reallocating economic activities across the broad sectors of agriculture, manufacturing and services (Kim & Roemer, 2020). Kuznets listed structural transformation as one of the six main features of modern economic growth. The pattern of employment growth is a critical factor in facilitating the structural transformation of the economy, as has happened in the developmental experience of developed countries (Behera, 2015). However, in India, there are three apparent observations at the outset concerning the nature of structural transformation, namely in terms of income, occupational transformation led by the service sector and an overwhelming share of the modern sector in an informal economy (Behera, 2015, p. 197). However, to understand the structural transformation of India, information on changing trends of workforce participation in different broad economic activities, namely cultivation, agriculture labour, household industry and other remaining sectors, and their contribution to the Indian economy can be considered as a significant input. Indian economy embarked on the development process after independence in the 1950s. Over the decades, workforce participation in agriculture and its contribution to India’s GDP have significantly declined. A World Bank (2012) report reveals a progressive decline in India’s agricultural share compared to the share of industrial and service sectors. The contribution of agriculture to India’s GDP was 60%, which progressively declined to 14% in 2011 and further (Behera, 2015). On the other side, the NSSO data also revealed that the share of the agriculture sector in India’s labour force declined from about 75% in the 1970s to less than 50% in the 2020s (Waghmare, 2024). Despite a significant decline in workforce participation in agriculture, a vast section of India’s population earns their living out of it. Agriculture and its allied sectors, namely forestry, fishing, crops and livestock, logging, etc., are critical for employment and livelihood for a large group of people. However, with the advent of the modern development process, the agricultural sector’s share in India’s economic development has significantly declined. The theory of structural transformation suggests a decline in agriculture’s share in total output and employment over time (Pingali et al., 2019, p. 47). As per India’s census economic data, workers’ share of agriculture involvement as cultivators and labourers declined from 39.69% and 27.37% in 1991 to 24.65% and 29.95% in 2011, respectively. However, the declining trends are higher among farmers or cultivators than among labourers. During the contemporary period, the study of the phenomenon of moving out of agriculture has been prevalent among the youth of India, who have lesser interest and involvement in livelihood strategies related to farming due to the inability of this sector to fulfil the growing needs of younger generations (Mahapatra, 2020, cited in Sonowal, 2022). Moreover, NSSO’s (2006) estimates also revealed that during 2004–2005 and 2010–2012, about 34 million farmers moved out of agriculture at a rate of 2.04% per annum. Chowdhury et al. (2020) find that lack of sufficient public investment for agrarian development, along with inadequate access to institutional credit, frequent droughts and floods, is a prominent reason contributing to the declining trend in the agricultural sector’s share in rural employment (Sonowal, 2022).
Data Sources and Methods
Data Sources
The census of India is the only data source at the national level that provides demographic and socio-economic information about individual castes and tribes classified as SC and ST, respectively. Although there is no separate census or survey to collect socio-economic and demographic data of nomadic communities in India, information about education attainment, economic activities and population count can be obtained for the nomadic communities that are classified as SC or ST in the states of India. However, since the Sapera community is classified as one of the 37 SCs in Haryana, the required socio-economic and demographic information has been collected from India’s national census. India’s census provided data on individual SCs in the census table entitled ‘A-10: Individual Caste Primary Census Abstract (PCA) data’. In order to analyse the shifting trends of the workforce in different industrial sectors of the economy, data on economic activities were collected for the years 1981, 1991, 2001 and 2011. Data on the economic activities of all SCs have also been collected from India’s census and analysed to compare shifting livelihood practices among the Sapera community.
Collecting data on economic activity has traditionally been part of the population census of India. Data on economic activities were collected from the first regular census, which was conducted in 1872. However, the concepts and definitions adopted for the economic classification of population vary from census to census. Till the Indian census of 1921, the main economic questions were related to livelihood or occupation or means of subsistence of each engaged person. In actual practice, however, even persons who were not working but receiving income from land, property, etc. were considered economically active. Therefore, the concept of income was explicitly introduced in the 1931 census and continued in the 1941 and 1951 censuses. Thus, based on the concept of ‘income’, India’s whole population was classified into three classes: ‘Earner’, ‘Working dependent’ and ‘non-working dependent’. India’s 1941 census divided the whole population as ‘Wholly Dependent,’ ‘Partially Dependent’ and ‘Others’. In the 1951 census, there were further changes, and the classification was ‘Self-supporting Person’, ‘Earning Dependent’ and ‘Non-earning Dependent’.
The census of 1961 adopted the concept of ‘Work’ to collect the economic data, and the whole population was divided into ‘Workers’ and ‘Non-workers’. Work included not only the actual work but also adequate supervision and direction. The reference period as the criterion of work was any of the 15 days preceding the date of enumeration in the case of regular employment such as trade, profession, service, business or commerce, while for seasonal work such as cultivation, livestock, dairying and household industry, if a person had some regular work for more than one hour a day throughout the more significant part of the working seasons, she or he was to be treated as a worker.
Since the 1971 census, a person was defined as a ‘worker’ based on participation in any economically productive physical or mental activity. In 1971, the reference period for regular employment in industry, trade or services was a week prior to the date of enumeration and one year preceding the enumeration date for the seasonal work of agriculture (Census of India, 1988). For the first time in 1981, based on participation in any ‘Economically Productive Activity’, India’s whole population was divided into primary workers, marginal workers and non-workers, and this continued till the latest available census of 2011. The census of India provides four broad categories of industries: cultivators, agricultural labourers, household industry and others. A brief description of all four categories has been given below:
Data on Individual Castes and Tribes in India: History
The census of India is the primary data source for enumerating each community residing within the territory of India and publishing their socio-economic and demographic characteristics. In the Indian censuses before 1931, information was collected and published for each caste and tribe separately. In the 1931 census, tabulation of the data for individual communities was limited to three broad categories: (a) exterior castes, (b) primitive castes and (c) all other castes, with the exception of (a) those whose members fell short of four per thousand of the total population and (b) those for which separate figures were deemed to be unnecessary by the local government. In the 1941 census, ‘group totals’ were tabulated for SCs/STs and Anglo-Indians; only for a few individual tribes, separate totals were furnished by the census of India. It was the 1951 census, when the Government of India decided, with the policy of official discouragement of community distinction based on caste, that no general race, caste or tribe should be enumerated separately. Inquiries should be made regarding race, caste or tribe only to the extent necessary to provide information about certain special groups of people referred to in the Constitution of India. However, since the census of 1951, it has been a tradition with the Indian Census Organization to enumerate and publish population statistics on the SCs and STs separately. Socio-economic and demographic information such as age–sex structure, marital status, educational attainment and involvement in economic activities as primary and marginal workers are published as special tables for communities and tribes belonging to SC and ST by each sex and rural–urban place of residence at state as well as district level (Census of India, 1991).
Methods
The changing trends of livelihood practices among the nomadic Sapera community over the four census years were assessed by calculating the percentage with the help of Microsoft Excel software, and results have been presented in tables and graphs. Additionally, ArcMap software was used to prepare maps for the geographical representation of the demographic information of the community.
Literacy rate refers to the number of literates per 100 people aged seven and above. Literacy rate is calculated using the following formula:

Sex ratio refers to the number of females per 1,000 males and is calculated by the following formula:
Child sex ratio refers to the number of girls per 1,000 boys and is calculated by the following formula:
Work participation rate refers to the number of persons who are engaged in any economically productive activity by her/her physical and mental activity per 100 persons and is calculated by the following formula:
The exponential growth rate calculates the annual growth rate of the population, 1 which gives a better estimate than linear or arithmetic growth rate.
Results
Socio-demographic Characteristics of Sapera Community
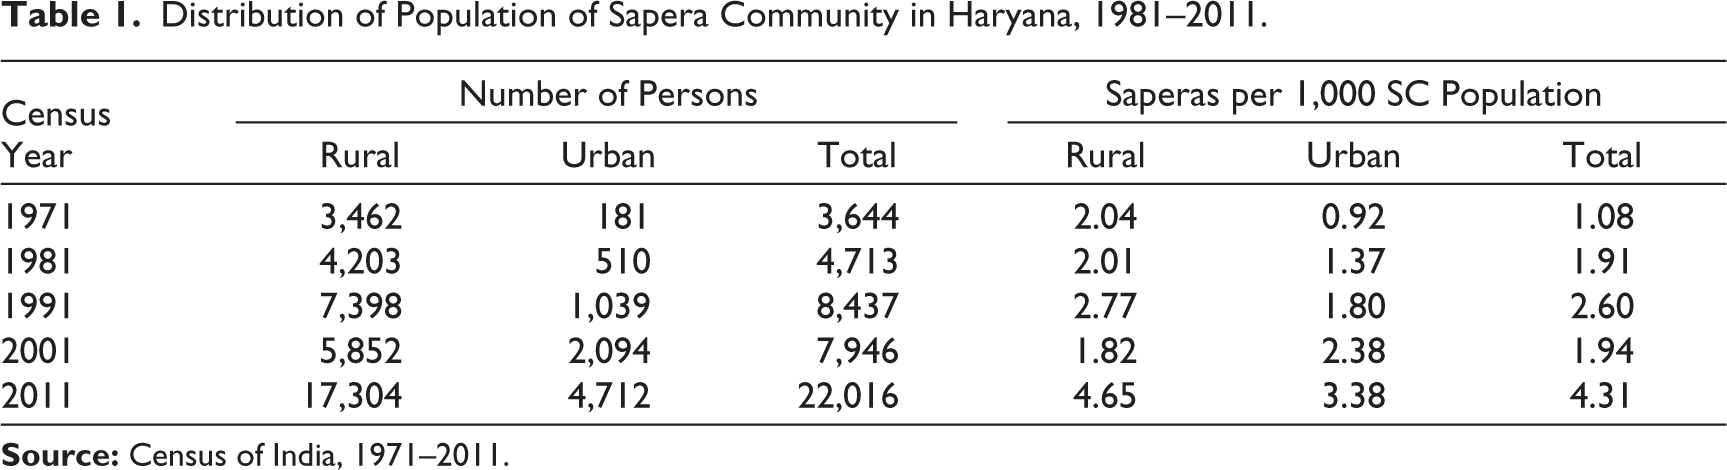
Table 1 shows the size of the Sapera population from 1971 to 2011. Additionally, the share of the Sapera population in the total population of SCs in the state of Haryana has also been given in Table 1. It may be noticed that from 1971 to 2011, there was a slow but steady increase in population, except for the 2001 census. Their population declined from 8,437 in 1991 to 7,946 in 2001. The decline in the total population was attributed mainly to the decrease in the Sapera population in rural areas of the state. On the other hand, urban areas have witnessed a slow and steady increase in the population of the Sapera community during the last five decades. The share of the Sapera population in the total population of SCs in the state also increased from 1.08 persons per 1,000 SC population in 1971 to 4.31 persons per 1,000 SC population in 2011.
Distribution of Population of Sapera Community in Haryana, 1981–2011.
The annual exponential growth rate of the population of the Sapera community from 1981 to 2011 is shown in Figure 1. After 1971, the population of the Sapera community increased from 3,644 to 22,016 in 2011, with an average annual exponential growth rate of 4.50%. On the other hand, the population growth rate of all SCs during 1971–2011 was 2.49%. The annual growth rate of the Sapera population was 2.58% during 1971–1981, which increased to 10.19% during 2001–2011. After witnessing a negative annual growth rate of −0.60% during the last decade of the twentieth century, the population of the Sapera community has increased at a tremendous and surprising growth rate of 10.19% during the first decade of the present century. Furthermore, the negative growth rate of the population from 1991 to 2001 was associated primarily with the negative growth rate of the Sapera population in their rural counterparts compared to urban areas. During 1991–2001, the annual growth rate in urban areas was estimated at 7.01% compared to −2.34% in rural areas. It is important to note that during the same period (1991–2001), the population of all SCs also experienced a significant decline in the annual growth rate in rural areas from 2.45% during 1981–1991 to 1.83% during 1991–2001.
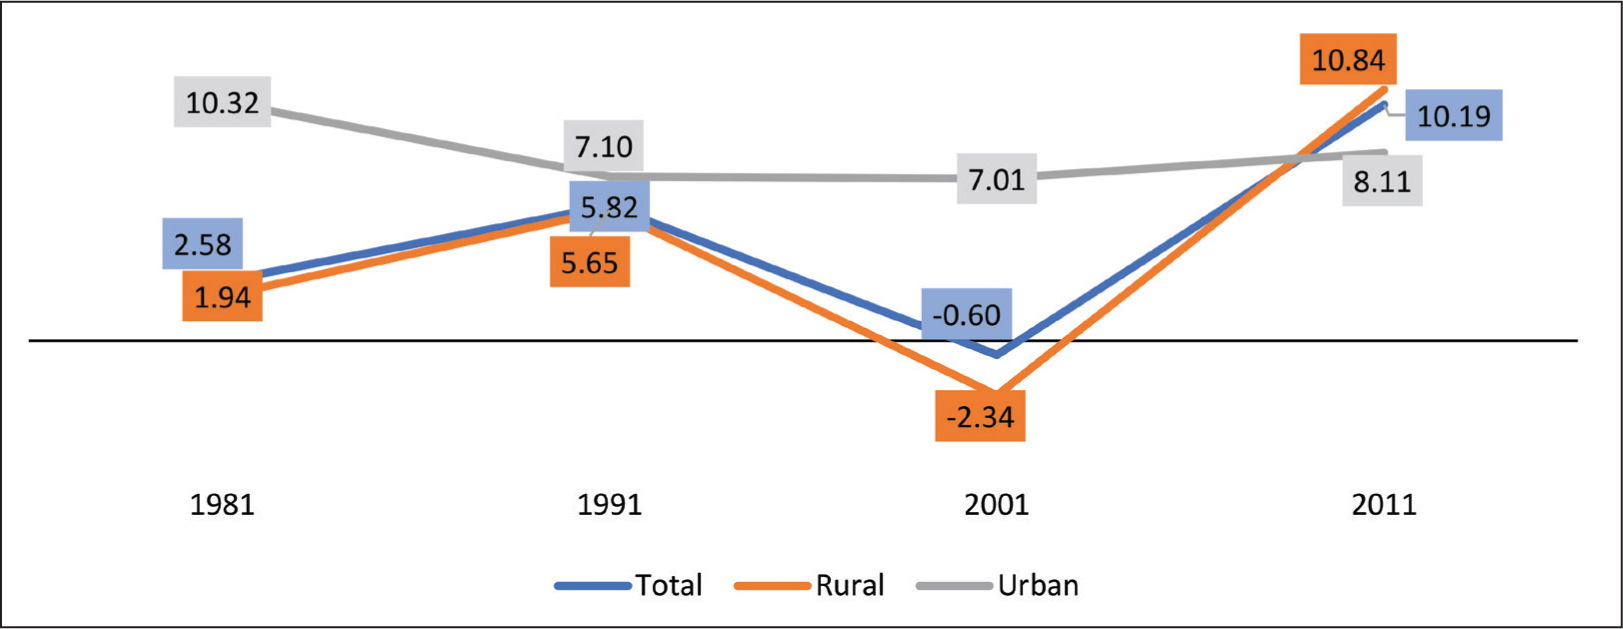
Table 2 provides information about the sex ratio, child sex ratio, literacy rate and Saperas’ involvement in work from 1981 to 2011. Table 1 shows that from a significant imbalance of about 733 females per 1,000 males in India’s 1981 census, the overall sex ratio among Saperas appears to have normalized significantly over the last four decades, narrowing to about 836 in India’s 2011 census. On the other hand, the same trends have also been observed in the child sex ratio of the Sapera community from 1981 to 2011. It is worthwhile to highlight the fact that as compared to all SC populations, improvement in sex ratio is more in the Sapera community.
Socio-economic Profiles of the Sapera Population in Haryana, 1981–2011.
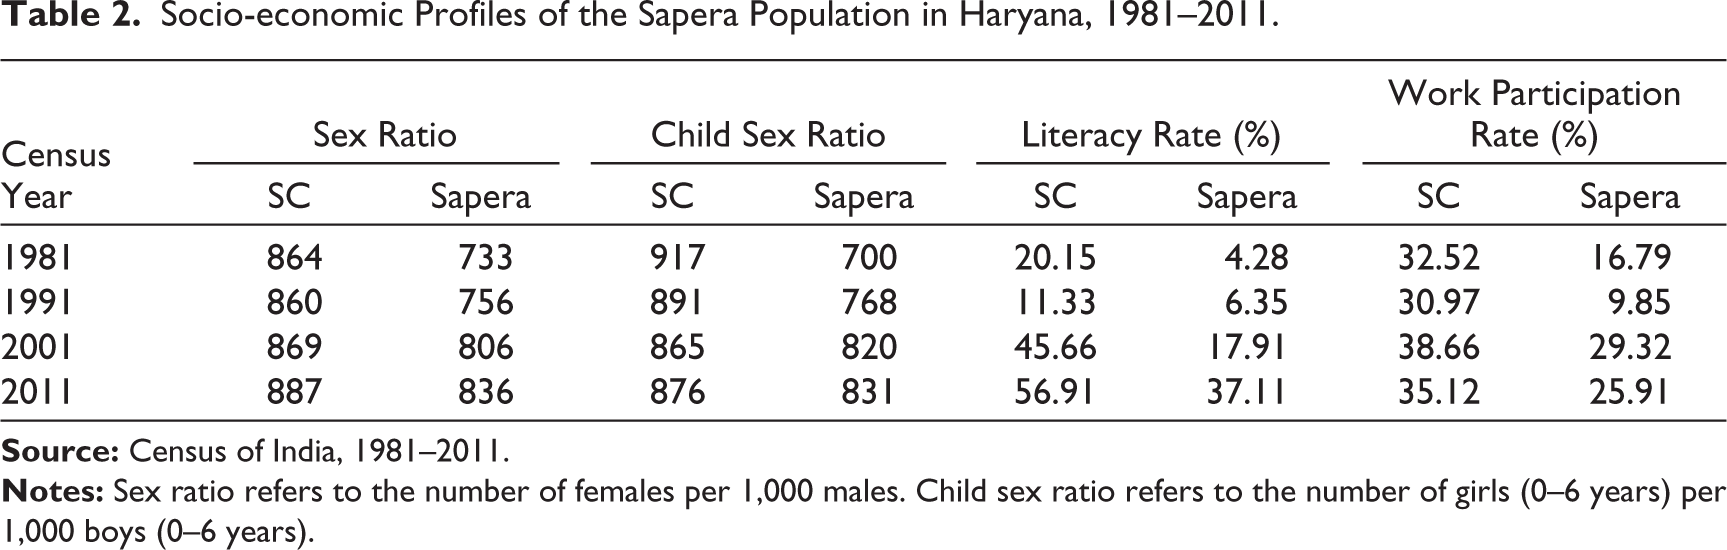
The percentage share of the literate population among Saperas increased from 4.28% in 1981 to 37.11% in 2011. The possible reason for the very low literacy rate levels among Saperas in the past may be attributed to their nomadic lifestyle. One of the factors for improvement in their literacy can be the phenomenon of a sedentary lifestyle among the nomadic Sapera community. It is noteworthy that as per India’s 2011 census, more than 70% of the eligible population of the Sapera community remains illiterate. The figure of literacy for the entire SC population of Haryana stands at 56.91%, which indicates that 53.09% of the state’s 37 SCs are illiterate.
During the period 1981–2011, the work participation rate, which reflects Saperas’ involvement in any economic activity, increased from 16.79% to 25.91%. During the first decade of the present century, census data revealed a decrease in the work participation rate from 29.32% in 2001 to 25.91% in 2011. The decrease in the work participation rate during the period 2001–2011 has also been observed in the state’s SC population.
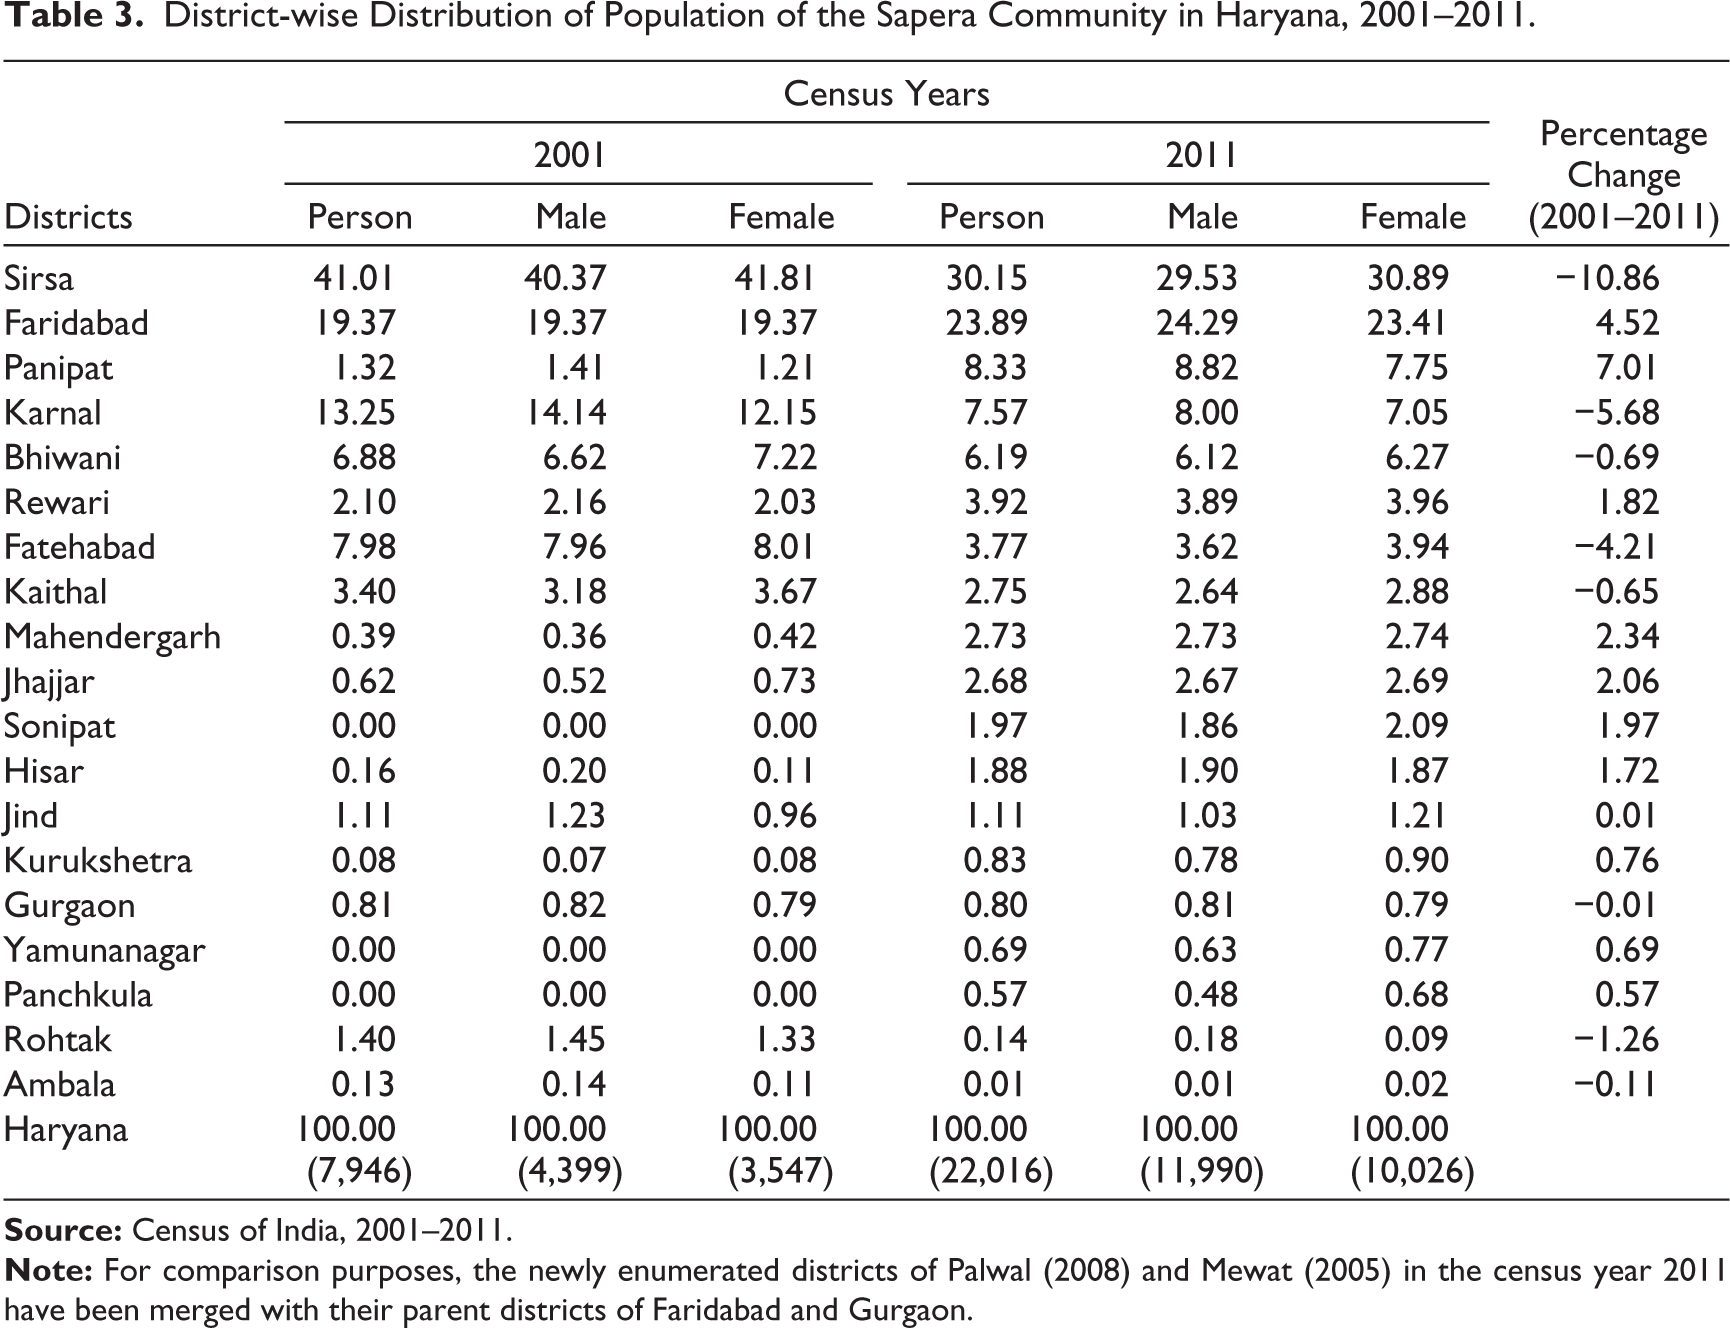
Table 3 provides information on the district-wise distribution of the population of the Sapera community in Haryana for 2001 and 2011. According to India’s 2011 census, more than three-fourths (76.13%) of the Saperas’ total population was enumerated in five districts only, namely Sirsa, Faridabad, Panipat, Karnal and Bhiwani. The percentage share of Saperas’ total population in the six districts mentioned above was 81.84 in 2001. The change in the percentage share of population in each district in the total population of the Sapera community in Haryana during the period 2001–2011 has seen a negative trend in the districts of Sirsa (−10.86), Karnal (−5.68), Fatehabad (−4.21), Rohtak (−1.26), Ambala (−0.11), Kaithal (−0.65) and Bhiwani (−0.69). It is important to highlight the fact that, traditionally, the Sapera community has been on the spatial movement to earn their living; however, it is possible that at the time of census’s enumeration, the Sapera community might have moved from one district to other districts of the state. Thus, this phenomenon might have resulted in the decrease in their population in some districts and corresponding increase in other districts. The highest percentage change in the population of the Sapera community has been found to be in the district of Panipat (7.01), followed by Faridabad (4.52) and Mahendergarh (2.34).
District-wise Distribution of Population of the Sapera Community in Haryana, 2001–2011.
Shifting Trends of Livelihood Strategies Among the Sapera Community
This section discusses the change in the magnitude and marginal workers and the shifting trends of the Sapera community’s dependency on agriculture as labourers and cultivators, household industries and other economic activities from 1981 to 2011.
Changing Trends of Main and Marginal Workers Among the Sapera Community
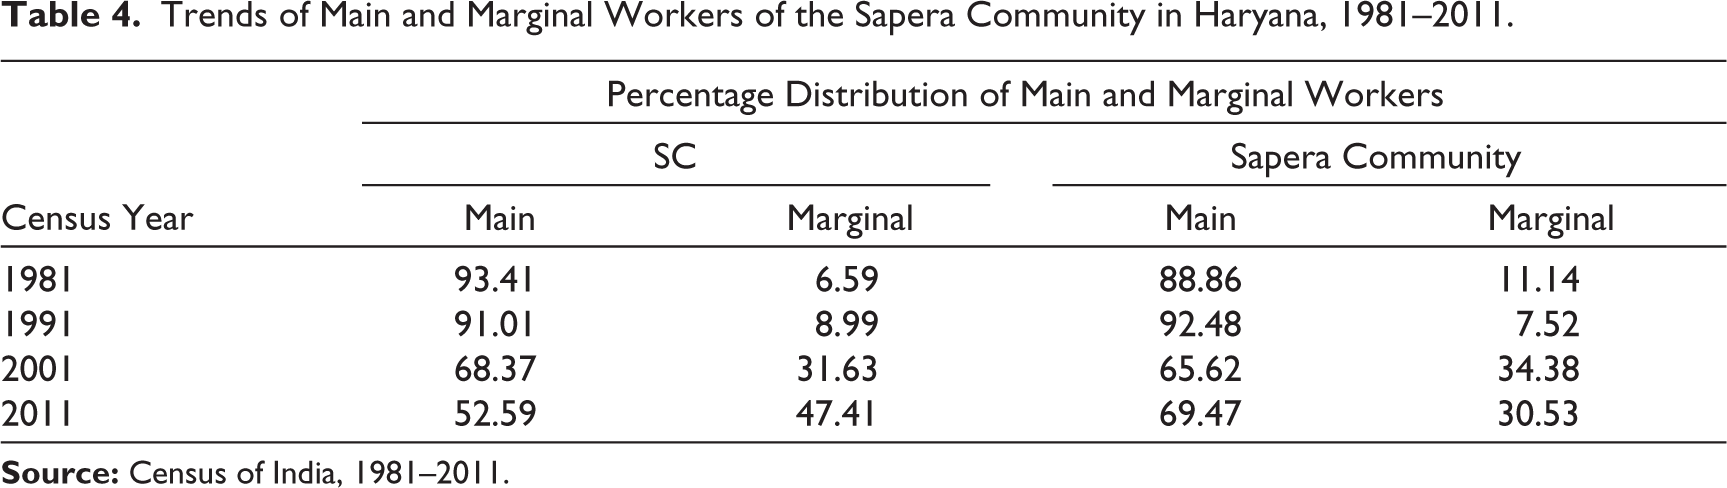
Table 4 shows changing trends of main and marginal workers in terms of change in the percentage share of main and marginal workers in the total population of the Sapera community from 1981 to 2011. The census data shows that among the Sapera community, there was a substantial decline in the share of main workers from 93.41% in 1981 to 52.59% in 2011. The decline in the proportion of main workers during the period 1981–2011 occurred primarily due to the declining growth rate trends in the percentage figure of main workers engaged in agriculture as labourers and in household industries. On the other hand, only 6.59% of the total workers among Saperas was marginal in 1981, which increased to 47.41% in 2011. This increase in the percentage share of the marginal workforce among the Sapera community has been primarily among marginal workers involved in other works followed by household industry. A similar trend of increase and decrease in the percentage share of marginal and main workers, respectively, has also been found among all 37 SCs in Haryana.
Trends of Main and Marginal Workers of the Sapera Community in Haryana, 1981–2011.
Dependency of Saperas on Cultivation
Traditionally, people belonging to the Sapera community were primarily involved in their community-based occupations of snake charming and traditional medicines. However, due to several biodiversity laws and the modern development process, they are shifting towards other kinds of formal and informal occupations. The percentage share of main workers among Saperas engaged in cultivation has been given in Figure 2. The involvement of main workers in cultivation among the Sapera community increased over the decades from 2.53% in 1981 to 4.23% in 2011. Contrary to Saperas’ increasing trends of main workers in cultivation, the share of main cultivators among all SCs witnessed a significant decrease of 5.88 percentage points from 1981 to 2011.
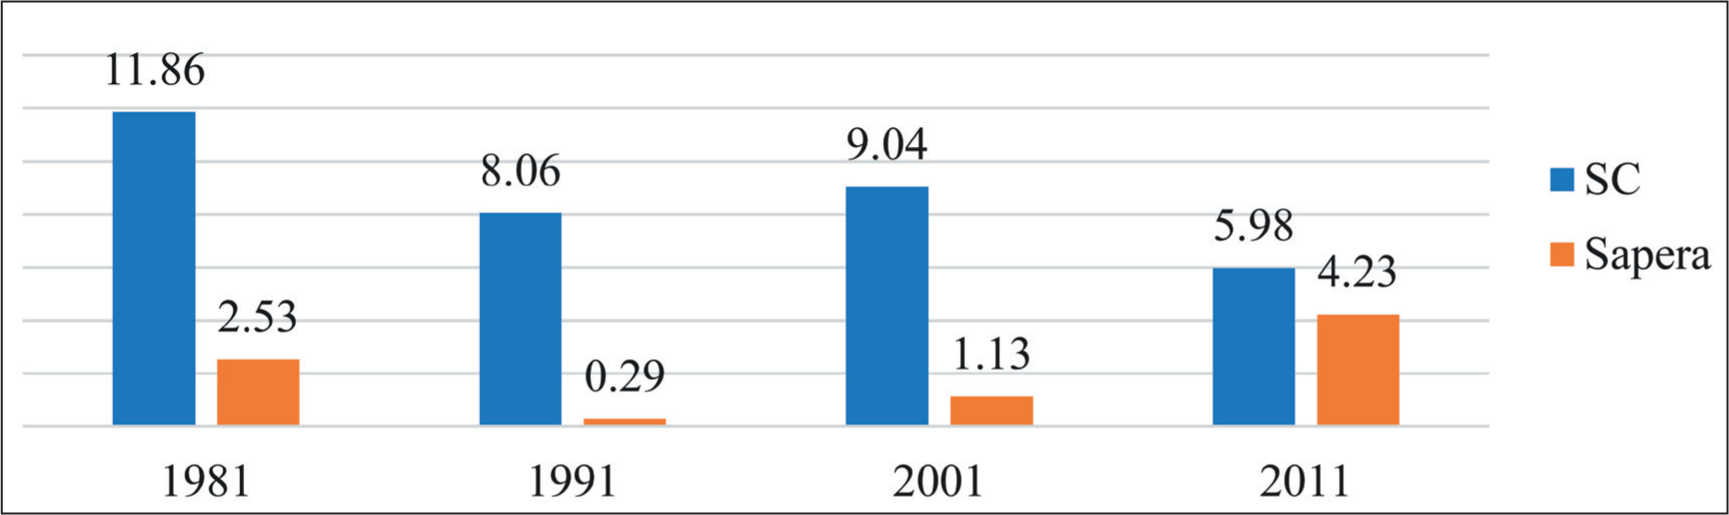
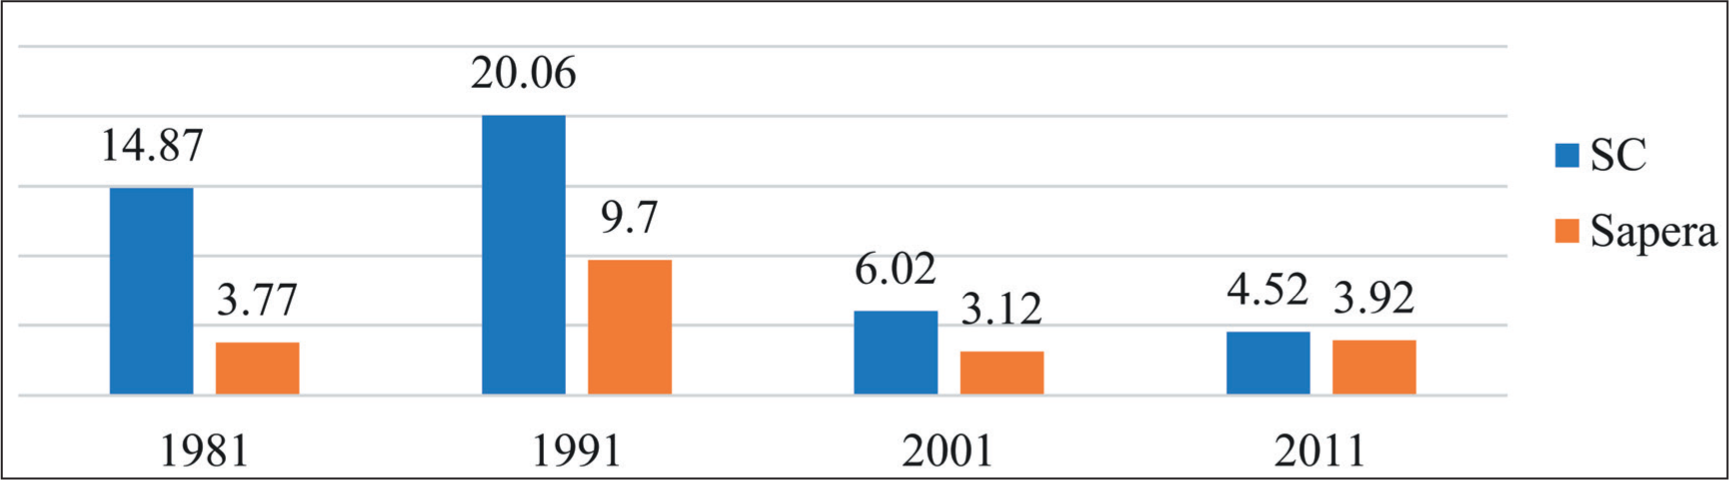
Figure 3 shows the percentage share of marginal cultivators among Saperas from 1981 to 2011. The share of marginal cultivators to the total marginal workers among Saperas increased slightly from 3.77% to 3.92% from 1981 to 2011. On the other hand, the involvement of marginal workers in cultivation among all SCs decreased from 14.87% in 1981 to 4.52% in 2011. The decrease in the proportion of marginal cultivators among all SCs mainly occurred from 1991 to 2001.
Dependency of Saperas on Agricultural Labour
Figures 4 and 5 show changing trends of main and marginal workers’ agricultural involvement as labourers. Overall, there has been a declining trend of main and marginal involvement as agricultural labourers among the Sapera community during the last four census years.
Figure 4 shows that in 1981, compared to only 8% among all SC main workers, nearly 40% of the main workers were agricultural labourers. The share of main agricultural labourers among Saperas decreased to 29.33% in 2011. It is noteworthy to highlight that contrary to the decreasing trend of main agricultural labourers among the Sapera community, census data revealed an increasing trend of involvement of main workers in agriculture as labourers among all SCs in Haryana during the period 1981–2011.
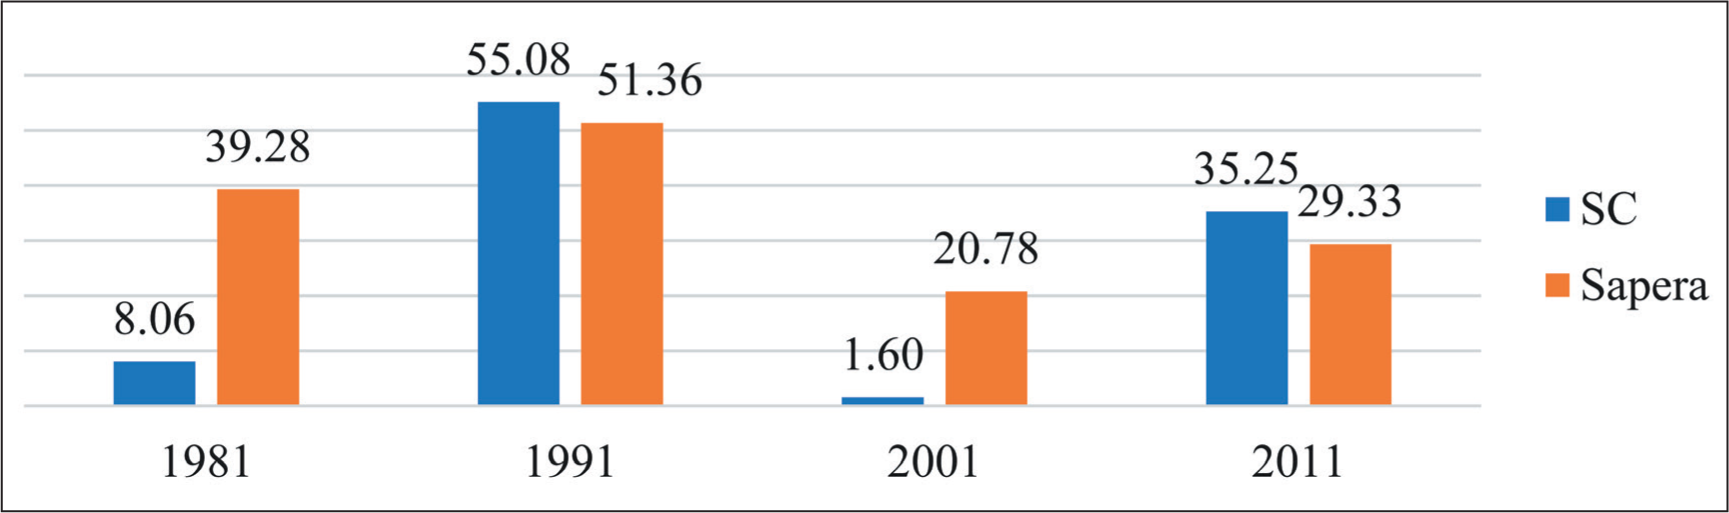
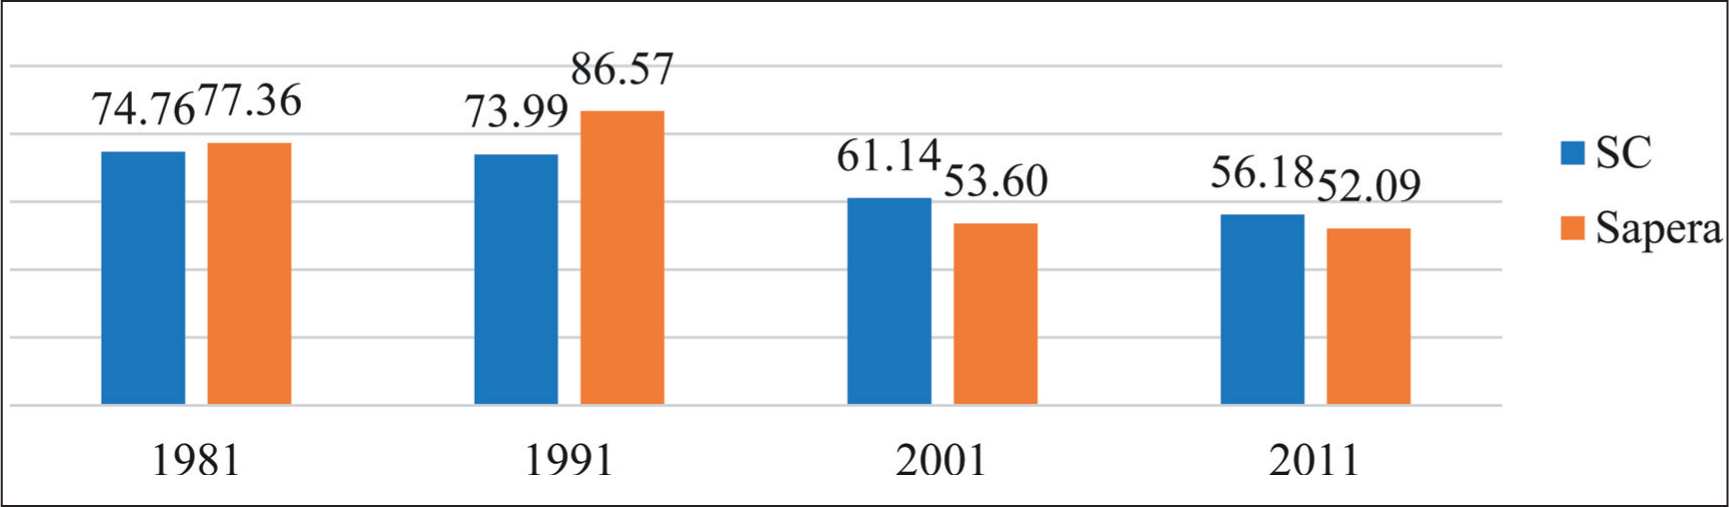
Figure 5 shows that the share of marginal agricultural labourers among Saperas was more than 75% in 1981, which decreased to 52.09% in 2011. The decline in the percentage share of marginal workers as agricultural labourers was the highest during 1991–2001 among both Saperas and SCs. While in 1981, 74.76% of marginal workers among SCs were recorded as labourers in agriculture, it came down to 58.18% in the 2011 census, a sharp decline of 17 percentage points.
Dependency of Saperas on Household Industries
The category of household industries in India’s census includes manufacturing, processing, servicing and repairs. The information on the involvement of people belonging to the Sapera community in household industries is given in Figures 6 and 7 for main and marginal workers, respectively. Figure 6 shows a substantial decrease of 10 points in the percentage share of main workers among Saperas in household industries from 1981 to 2011. The share of main workers engaged in household industries was 13.32% in 1981, which decreased to 2.90% in 2011. Contrary to such a picture, census data has found a significant increase of 47.32 percentage points in the share of main household industries among all 37 SC categories.
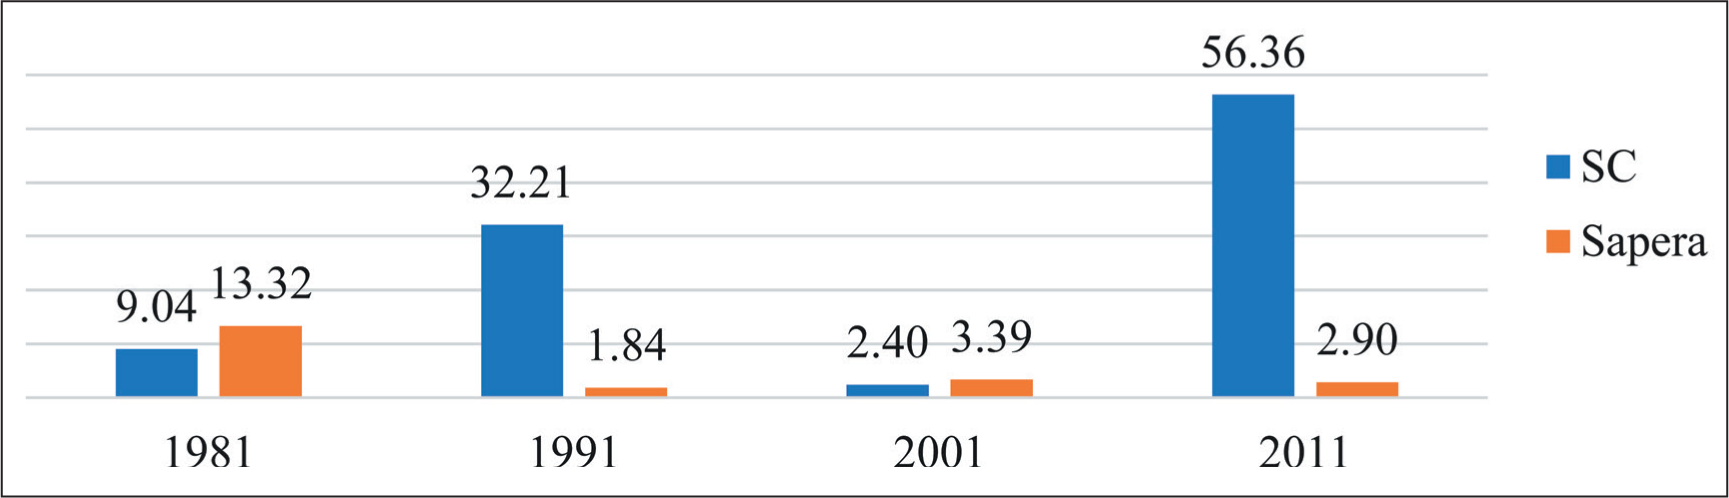
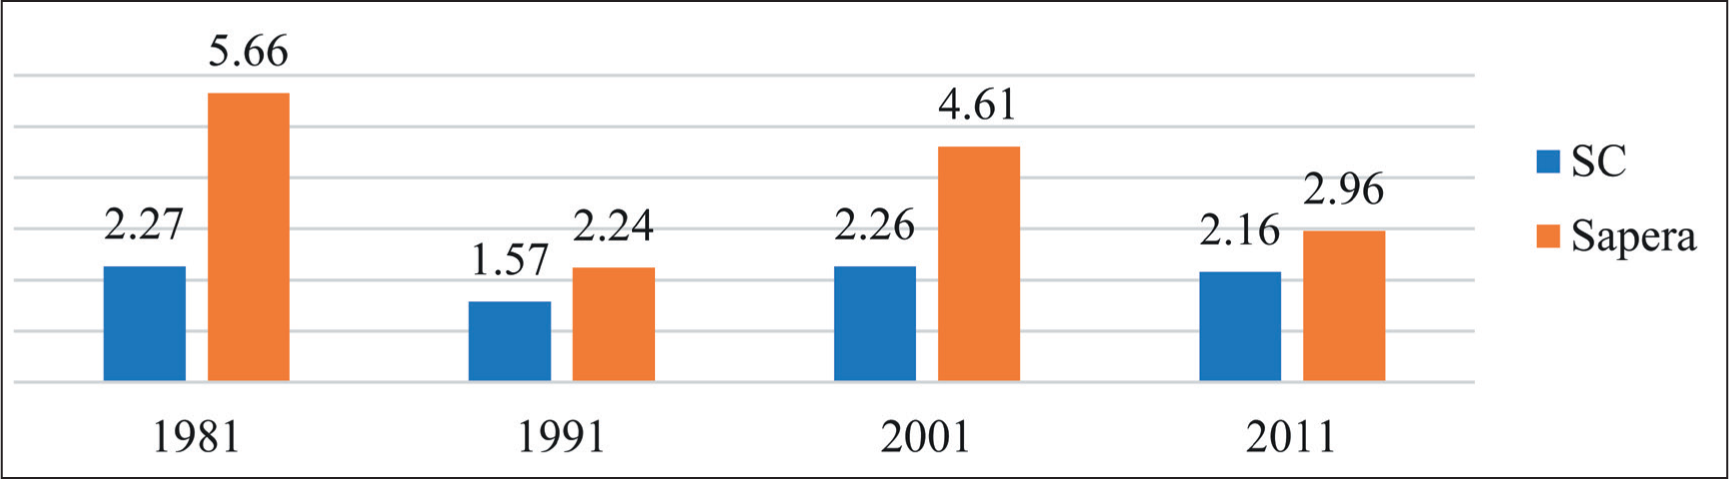
Figure 7 reveals a slight decline in the share of marginal workers engaged in household industries among Saperas during the period 1981–2011. A similar decline in the proportion of marginal workers involved in household industries was been observed in the case of all SCs during the same period. The decline in the percentage share of marginal household industries is higher among the Sapera community than in the SC category.
Dependency of Saperas on Other Economic Activities
Economic activities other than cultivation, agricultural labour and household industries have been classified into the broad category of ‘Other’ work in India’s census. However, the traditional occupation of snake charming and traditional medicine comes under the census’s ‘Other’ work category. The dependency of Sapera’s community on ‘Other’ works in terms of the percentage share of main and marginal workers in other economic activities has been presented in Figures 8 and 9. The share of main workers in other economic activities increased from 44.87% to 63.53% from 1981 to 2011 (Figure 8). The increase in the share of other main workers is substantially higher among the SC category compared to the Sapera community.
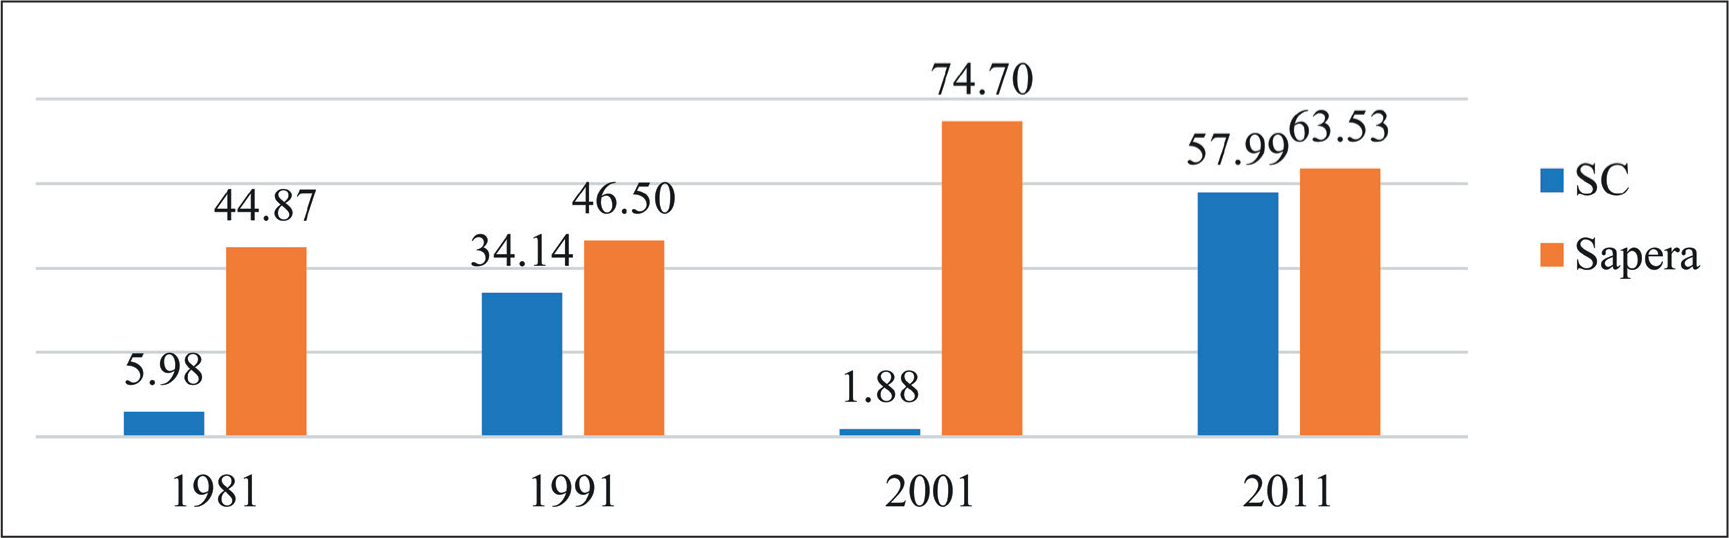
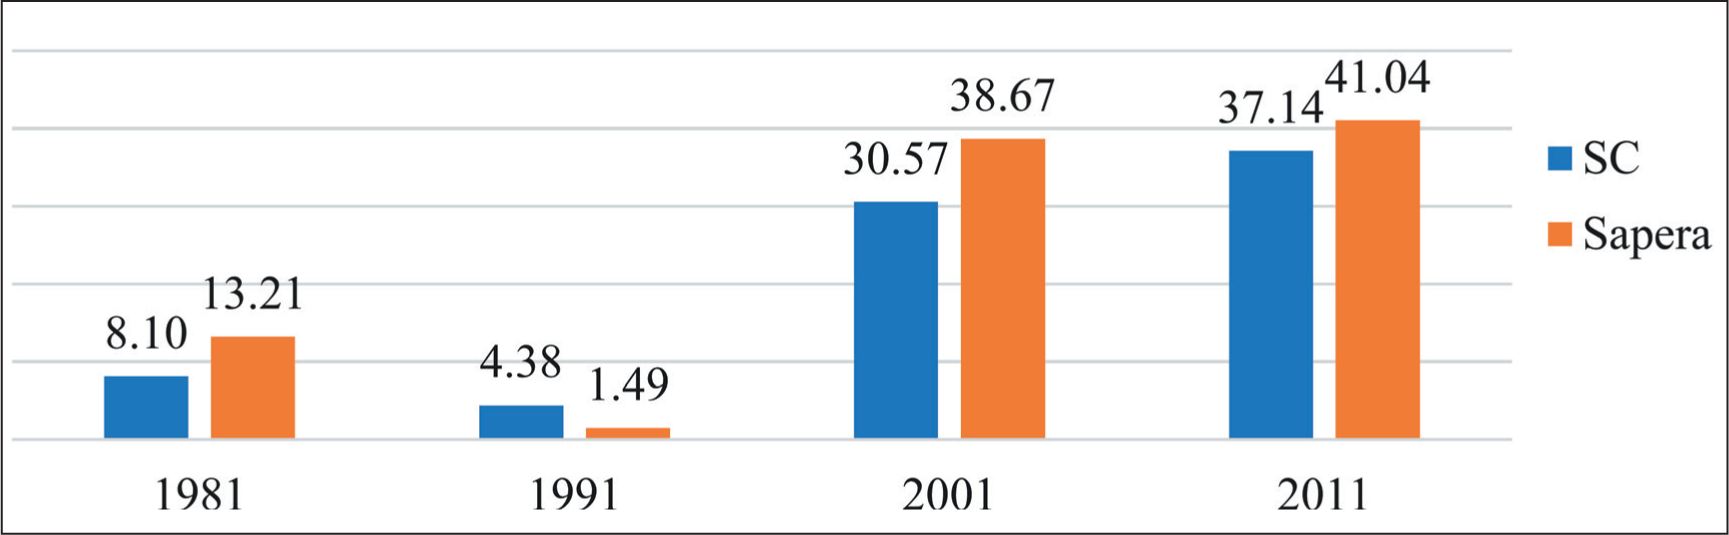
Figure 9 shows a significant increase in the share of marginal workers in other works. In 1981, about 13.21% of the total marginal workers of the Sapera community were engaged in economic activities other than cultivation, agriculture labour and household industries, which increased to 41.04% in 2011. The increase in the share of other works was significant during 1991–2001, where the percentage figure rose to 38.67% in 2001 from 1.49% in 1991. A similar trend of significant increase in the percentage share of other marginal work can also be seen among the category of SCs.
Discussion
Changing Pattern of Demographic and Social Profiles of the Sapera Community
The change in the population of a community can be attributed to the three components of demographics, namely birth, death and migration. An increasing population is the result of either net in-migration and/or natural increase. However, the study revealed that the population of the Sapera community had increased six times, with an average annual growth rate of 3.96% over five decades (1971–2011). The absolute increase during 1971–2011 was higher (26 times) in urban areas than in rural areas (5 times). The population increased with an average annual growth rate of 6.51% in urban areas compared to 3.22% in rural areas. During the period 2001–2011, the population of the Sapera community experienced an unprecedented increase of nearly three times in size, the highest of all decades, with a growth rate of 10.19% per annum. The absolute increase in Saperas’ population was the lowest during 1991–2001, wherein the population grew with a negative annual growth rate of −0.6% in total and −2.34% in rural areas. Contrary to negative growth of −2.34% in rural areas, the population growth rate in urban areas was positive (7%) during 1991–2001.
Historically, most of the societies across the world have preferred sons over daughters. Skewed child sex ratios (CSRs) in geographies that traditionally prefer a son have attracted a great deal of attention since the late 1980s and early 1990s (Das Gupta, 1987; Keyfitz, 1977; Sen, 1990, quoted in Kumari & Goli, 2022). Bokil noted that the nomadic and de-notified tribes in India are mainly patriarchal communities wherein the authority of elderly males is considered supreme. The status of women is deficient, and very often, brutal sanctions are imposed on them (Bokil, 2002, p. 148). Our study has revealed a high imbalance between males and females overall and boys and girls aged 0–6 years. India’s 2011 census highlighted that there were only 831 girls for 1,000 boys in the Sapera community, which means that in numerical terms, there is a lack of 169 girls compared to boys. However, it has become very crucial and essential to highlight the fact that over 40 years, from 1981 to 2011, there has been a significant favourable change in the child sex ratio among the Sapera community. It increased to 831 from 700 during 1981–2011.
The participation of females in economically productive activities also becomes an issue of concern because of their very low work participation rate. Of the total female population of the Sapera community, only about 15% were involved in work in 2011. Of this, nearly two-thirds work in the agriculture sector as labourers.
The study observed an increasing trend in literacy rates, especially among females. The literacy rate among females was 29% in 2011, which was even less than 1% in 1981. The total literacy rate among Saperas was 37.23%, indicating that more than 60% of their population could not write and read in one language with understanding.
The Declining Trends of Main Workers in the Sapera Community
Over the last four decades (1981–2011), study has revealed a clear shift in work engagement between main and marginal workers. There appears to be some inconsistency in the 1991 census data regarding declining trends in the involvement of main workers. However, when we compare the 1981 and 2011 census data, we can observe a sharp decline in the engagement of main Sapera workers and a corresponding increase in marginal work involvement. This shift is similar across the workers of all 37 SCs in the state. There exist multiple reasons for such a decline in the number of main workers and the corresponding increase in marginal workers.
Increasing Involvement in Cultivation
Over the period from 1981 to 2011, among the Sapera workers, we found an increasing trend in involvement in the agricultural sector as cultivators. The study has revealed a sharp increase in the case of main workers’ involvement as cultivators from 2.53% to 4.23%, while there was only a slight increase in the share of marginal cultivators, from 3.77% to 3.92%, an increase of less than 1%. One of the requirements of the profession of cultivation is to have a habitat or settlement near the agricultural field. However, the process of settling down at the outskirts of towns and villages among Saperas took place some six to seven decades ago. Thus, it is possible that with increasing trends of their permanent or semi-permanent settlement accompanied with increasing availability and accessibility of various livelihood assets, namely financial asset (i.e., income), physical asset (i.e., vehicles), human asset (i.e., education and health), natural asset (i.e., land) and social asset (i.e., support of community/clan members), people belonging to the Sapera community have entered into the profession of cultivation either being the owner of land or by taking land on lease. There seems to be some inconsistency between 1981 and 1991 among primary workers and between 1991 and 2001 among marginal workers concerning the increasing trends. Contrary to the increasing trends of involvement in cultivation among Saperas, there are declining trends of involvement of both main and marginal cultivators among Haryana’s 37 SCs. In the case of Haryana’s 37 SCs’ declining cultivation trends, the study has found some inconsistency in the 2001 census data among main workers and the 1991 census among marginal workers.
Negative Shift in Engagement in Agricultural Labour
Compared to the extent of the increase in absorption of both main and marginal workers among Saperas in cultivation, the agriculture sectors have revealed a decline in the absorption of labour among Sapera workers. Compared with the decline among marginal workers, the declining trends among main workers are steady and slow. The declining trends of marginal cultivators among all 37 SCs of Haryana are in accordance with the declining trends of Saperas’ marginal cultivators’ declining trends. There has been a sharp decline in the involvement of agriculture as labour among the Sapera community. Although there are overall declining trends in the involvement of Saperas’ main agricultural labourers, the 1991 and 2011 censuses have recorded an increasing trend. However, the decade of 1991–2001 recorded a sharp decline in the engagement of Saperas’ main workers in agriculture as labourers from 51.36% to 20.78%, a decline of more than twofold.
Trends of Sapera Workers in Household Industries
The involvement of workers of the Sapera community in household industries, which include manufacturing, processing, servicing and repairs, has decreased sharply among main workers compared to marginal workers. The declining pattern of household industries was reversed in the 2001 census. The decline in the share of main as well as marginal household industry workers was the highest during the period 1981–1991 compared to the rest of the decades.
On the other hand, Haryana’s 37 SCs have recorded an increasing trend in the involvement of their main workers in the household industries.
The Shift of Sapera Workers Towards Other Economic Activities
The ‘Other work’ category includes the traditional livelihood strategies of snake charming and traditional medicines. Additionally, musical dance performances and entertaining people through street shows of snakes have been an integral part of Saperas’ lives and livelihood. The study has found an increasing trend of involvement of main and marginal Sapera workers in other works during the period 1981–2011. Compared to main workers, the increasing trends have been sharp and significant among marginal workers, where their share in other works went up to 41% in 2011 from 13% in 1981, an increase of more than three times. A similar pattern has also been observed among the state’s 37 SCs. During the decade 2001–2011, we found a sharp decrease of nearly 10 percentage points in the involvement in other economic activities among the main workers of the Sapera community, while a similar trend was recorded among marginal workers during the period 1981–1991.
Concluding Remarks
The nomadic Sapera community is in transition regarding the socio-economic sphere of life. Broadly, the changing trends of global developmental processes and modern skill-based education have been crucial factors behind the decline of community-based traditional occupations across the world. Traditionally, people of the Sapera community earned their living with the occupations of snake charming, entertainment shows and herbal medicines, which required the skill of catching snakes, the knowledge of medicinal herbs and plants and the process of preparing herbal medicines, and playing the flute—locally known as been. The traditional means of Saperas’ livelihood did not require formal school-based education. On the other hand, modern means of livelihood, mainly formal sectors of the economy, demand knowledge and skills acquired through modern school-based education. However, due to a lack of formal schooling, the members of the Sapera community remain out of the labour market and earn their livelihood by involving in daily wage labour, rag picking and other different categories of informal work. The present study has also highlighted the increasing trends of Sapera workers’ engagement in economic activities other than cultivation, household industry and labour in the agriculture sector. Under the background of the Wildlife (Protection) Act 1972 and the changing pattern of the modern developmental processes, namely the introduction of modern means of entertainment, transport and communication, their traditional occupations have lost importance and identity. Contrary to their community-based occupational specialization in snake charming and herbal medicine, the people of the Sapera community may be engaged in many occupations, either as primary workers or as marginal workers. Nevertheless, field-based studies on nomadic and de-notified tribes in India have pointed out the declining trends in traditional occupations, on the one hand, and less or no interest of youths in getting involved in their traditional occupations, on the other hand. However, the present study concludes that during the first decade of the present century, workers of the Sapera community were getting involved in agriculture as both cultivators and labourers, as well as in other sectors of the economy. Moreover, based on the findings of the study, it is recommended that the researchers and concerned developmental authorities carry out an in-depth livelihood analysis among the nomadic Sapera community to explore and understand the changes occurring in the livelihood domain of the community. Thus, a people-centric policy can be framed by policymakers to promote the welfare and development of Saperas.
Footnotes
Declaration of Conflicting Interests
The authors declared no potential conflicts of interest with respect to the research, authorship and/or publication of this article.
Funding
The authors received no financial support for the research, authorship and/or publication of this article.