






Abstract
India has witnessed substantial growth over the past three decades, but its benefits have remained unevenly distributed. This article examines caste-based inequalities in health outcomes in India post-1990s using multiple rounds of the National Family Health Survey and the National Sample Survey Organization data sets. While average health indicators have improved over time, caste-based inequalities in premature mortality and morbidity not only persist but, in some cases, have also widened. Scheduled Castes (SCs) and Scheduled Tribes (STs) continue to face higher levels of premature mortality and disease burden than the Other Backward Classes and upper-caste groups. The result also points to a socially uneven epidemiological transition. SC/ST groups continue to experience a higher burden of infectious diseases, whereas the prevalence of non-communicable diseases and cardiovascular diseases is more prevalent among upper castes. Finally, regression estimates suggest that caste exerts an independent and significant influence on health outcomes in India, highlighting the need for more targeted health policy interventions.
Introduction
Background and Motivation
Following the economic reforms of the 1990s, India recorded an average growth rate of 5.8% per annum, a marked improvement over the 4.1% average during the first four decades after independence. During this period, the size of the economy expanded more than eightfold, rising from $326.6b in 1990 to $2,660.24b in 2020. Yet the gains from this growth were unevenly distributed, benefiting only a small segment of the population. As a result, inequality widened sharply. The share of the total wealth held by the top 1% increased from 16.1% in 1991 to 42.5% in 2020, while the wealth share of the bottom 50% fell from 8.8% to 2.8% over roughly the same period (Ghatak, 2021). These patterns of unequal growth have disproportionately affected marginalized communities, who have long faced neglect and exploitation from both state and market institutions (Deshpande & Ramachandran, 2016; Drèze & Sen, 2002). Such inequalities have not been limited to income alone; they have also shaped people’s health outcomes and their broader capabilities, reinforcing a deeply entrenched social hierarchy of health endowments.
A major axis of this hierarchy is the caste system, one of the most enduring forms of social stratification in India. Caste has historically governed social relations, access to resources and the distribution of rights and privileges. This system constructs a hierarchy of rights and privileges, producing exploitative and unequal power relations within Hindu society. Positioned at the bottom of this hierarchy, Dalits have faced centuries of social and economic marginalization. They were denied property rights, excluded from education and skill development and tied to production processes through forms of bondage such as slavery and bonded labour. Even today, Dalits are often identified as a serving class and relegated to ritually stigmatized and physically demanding tasks such as scavenging, skinning dead animals and managing cremation and burial work (Human Rights Watch, 1999; Ravindran & Gaitonde, 2018). Tribal communities, though differently located, have also experienced long-term marginalization due to their relative isolation and historical neglect. The constitution identifies these groups as Scheduled Castes (SCs) and Scheduled Tribes (STs), and a later expansion of affirmative action brought certain other disadvantaged caste groups under the category of Other Backward Classes (OBCs). India’s social landscape is framed by four groups: SCs, STs, OBCs and Others (the forward or upper castes).
The ill-effects of historical exclusion continue to shape the health and health-seeking behaviours of these communities (Ghosh et al., 2023; Nayar, 2007; Scott & Shankar, 2010). Evidence shows that caste operates as a significant determinant of health in India, with lower-caste status often translating into systematic disadvantages in accessing healthcare and achieving good health outcomes (Coelho & Belden, 2016; Dutta et al., 2020; Joshi, 2014; Mukhopadhyay, 2015; Sadana, 2009; Vart et al., 2015). Across several indicators, SC and ST individuals consistently exhibit poorer health endowments than those from upper castes. For instance, SC/ST adults and children fare worse on anthropometric measures, body mass index levels and anaemia prevalence (Ghosh, 2025, 2026; Sabharwal, 2011). Research further shows that children born into Dalit and tribal households face a higher risk of mortality compared to those born into intermediate or upper-caste families (Dwivedi et al., 2013; National Institute of Medical Sciences, 2012; Ranjan et al., 2018). These disparities have persisted over time; for example, childhood anaemia among Hindu SCs and STs has remained substantially higher than among Hindu upper castes for over a decade and a half (Ghosh, 2025).
Adult mortality patterns reflect similar inequalities. Dalit and tribal women constituted 37% and 24% of maternal deaths in 2009, respectively, far exceeding their population share, according to MAPEDIR data (Kumar, 2010; Ravindran & Gaitonde, 2018). Borooah et al. (2012) find striking differences in the mean age at death: Dalit women die, on average, at around 39.5 years, compared to 54.1 years for upper-caste women. Estimates of life expectancy reinforce these gaps. Kumari and Mohanty (2020) report that SC and ST groups have the lowest life expectancy at birth (63 and 64 years, respectively), compared to around 68 years for Others. More recent estimates after the coronavirus disease 2019 (COVID-19) pandemic show a sharper decline in life expectancy for SC and ST groups (2.7 and 4.1 years) than for Others (1.3 years; Gupta et al., 2024).
While policy efforts have expanded public health infrastructure and insurance coverage, significant differences persist in health outcomes across social groups, even as national averages improve (Baru et al., 2010). Decades of reforms have not dissolved the caste boundaries that continue to shape health behaviours, access and outcomes. The poorer health outcomes of a subgroup that includes more than 100 million Indians highlight a major barrier to achieving the right to health, a central component of the Sustainable Development Goals (Lim et al., 2016).
Research Gap and Contribution to the Literature
Assessing differences through the lens of social groups allows a clearer understanding of social inequalities in health and supports targeted actions and policies aimed at eliminating these disparities. Viewing health outcomes through an identity-based lens not only advances the discourse on health as a human right but also provides insights into how these inequalities are reproduced and how they may be dismantled.
Much of the existing literature on caste-based health disparities examines a single set of indicators, either mortality or morbidity, at one point in time. There is comparatively limited emphasis on understanding how caste inequalities in health have evolved over the years. Consequently, a systematic and long-term assessment of caste-based disparities using multiple indicators and nationally representative data sets remains noticeably sparse. Furthermore, the specific combination of indicators used in this study—premature mortality and the disease burden among the ailing population—has received relatively less attention within caste-focused health research.
This study contributes to the literature in two key ways. First, it evaluates long-term trends and patterns in caste inequalities in health since the 1990s, a period marked by major economic reforms and rapid structural changes. Second, it examines both mortality and morbidity disparities using the latest available evidence, drawing on recent data sets for adult mortality and disease morbidity.
Research Questions and Objectives
In light of the above research gaps, this article addresses the following research questions:
How do mortality and morbidity outcomes vary across caste groups in India? How have these caste-based disparities evolved over time? To what extent can observed differences in health outcomes be explained by demographic, socio-economic and behavioural factors?
Accordingly, the objectives of this study are as follows:
To examine the health profile of India across major social groups in India. To analyse long-term trends in caste-based health disparities since the 1990s. To assess whether caste retains an independent and persistent influence on health outcomes after controlling for relevant covariates. To quantify the contribution of various determinants in explaining the observed disparities.
Database and Methodology
Database and Sampling Design
This study draws on nationally representative data sets to examine caste-based disparities in mortality and morbidity. Mortality outcomes are obtained from the National Family Health Survey (NFHS), conducted by the Indian Institute of Population Sciences. Premature death at the household level serves as the mortality indicator. This binary variable is coded 1 if any premature death occurred in the household and 0 otherwise. Although mortality information is included in most NFHS rounds, it is not available in NFHS-3 (2005–2006). Therefore, our analysis incorporates data from NFHS-1 (1992–1993), NFHS-2 (1998–1999), NFHS-4 (2015–2016) and NFHS-5 (2019–2021).
For morbidity outcomes, the article utilizes data from the National Sample Survey Organization (NSSO), Social Consumption Health: 52nd (1995–1996), 60th (2004), 71st (2013) and 75th (2017–2018) rounds. These surveys collect information on ailing individuals in the population within a 15-day reference period prior to the survey. We classified self-reported morbidities into four broad categories based on the International Classification of Diseases (World Health Organization, 2012), excluding disabilities:
Infectious/communicable diseases Cardiovascular diseases (CVDs), including hypertension and heart disease Non-communicable diseases (NCDs), including jaundice, cancer and pregnancy-related complications Other diseases, including malaria, typhoid and other diagnosed or undiagnosed ailments
Outcome and Explanatory Variables
For mortality, the outcome variable is the occurrence of a premature death in the household, coded as a binary indicator (1 = premature death; 0 = otherwise).
For morbidity, four binary outcome variables are constructed, each indicating whether an ailing individual reported a condition belonging to one of the four morbidity categories listed above. Each variable equals 1 if the individual suffered from the illness category and 0 otherwise.
The primary explanatory variable across all models is caste. Additional covariates include individual- and household-level characteristics such as gender, age, wealth index and education. All models also include state fixed effects to account for unobserved heterogeneity across states.
Analytical Strategies
The empirical analysis proceeds in two stages. First, we document caste-based differentials in health outcomes by computing proportional differences between the ‘Others’ caste group, identified as the best-performing category, and the SC and ST groups, which consistently exhibit poorer outcomes across both mortality and morbidity indicators.
Second, we estimate a series of logistic regression models to quantify the independent effect of caste on six distinct health outcomes. In each specification, caste, gender and wealth serve as key covariates, while all other socio-economic and demographic characteristics enter as controls.
Given the binary nature of the dependent variables ( y = 1 when some event occurs and y = 0 if the event does not occur), logistic regression is the appropriate estimation technique. The logistic regression model is expressed as:

where x is a vector of explanatory variables, β is a vector of parameters. x includes both continuous and categorical variables.
In the odds form, the logistic model is expressed as

The odds indicate how often something (e.g., y = 1) happens relative to how often it does not happen ( y = 0).
After a bit of manipulation, we find that
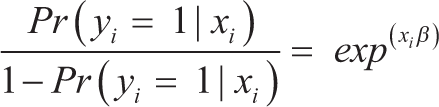
By taking the logarithm of both sides, we arrive at
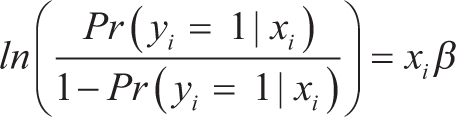
The logistic regression model (logit model) estimates the log odds of the dependent variable as a linear combination of the independent variables (caste categories and other controls).
Results
Trends and Patterns of Mortality Across Social Group in India Since the 1990s
Longevity refers to the ability of a human being to surpass a specific age and live a healthy, long life. Mortality rates are a key measure of group-based longevity, highlighting differences in health status among populations. Lower mortality rates correlate with higher life expectancy, making mortality a proxy for longevity. Premature mortality, defined as death before age 60, is a critical measure of unfulfilled life expectancy. According to the WHO, people in lower‐middle-income countries face not only lower life expectancies but also a higher risk of premature death compared to those in high‐income countries (World Health Organization, 2021). In India, premature adult mortality constitutes almost half of all male deaths and roughly one third of all female deaths. These largely preventable deaths are primarily due to NCDs and infectious diseases.
Table 1 shows the proportion of households that have experienced at least one premature death in the 5 years preceding the survey, stratified by social groups in rural and urban areas of India since the 1990s. Premature deaths are significantly higher in rural areas and among SC/ST households compared to urban areas and non-SC/ST groups (OBC and ‘Others’ category). For instance, according to the latest round of NFHS data, rural households have experienced 29% more premature deaths than urban households. Nationally, the proportion of households experiencing at least one premature death has halved, but this decline varies across different population segments. SC and ST households have seen reductions of 55% and 48%, respectively, while households in the ‘Others’ category have seen a reduction of 61%.
Proportion of Households That Have Experienced at Least One Premature Death in the 5 Years Preceding the Survey Across Social Groups in Rural and Urban Areas of India, 1992–1993 to 2019–2021.
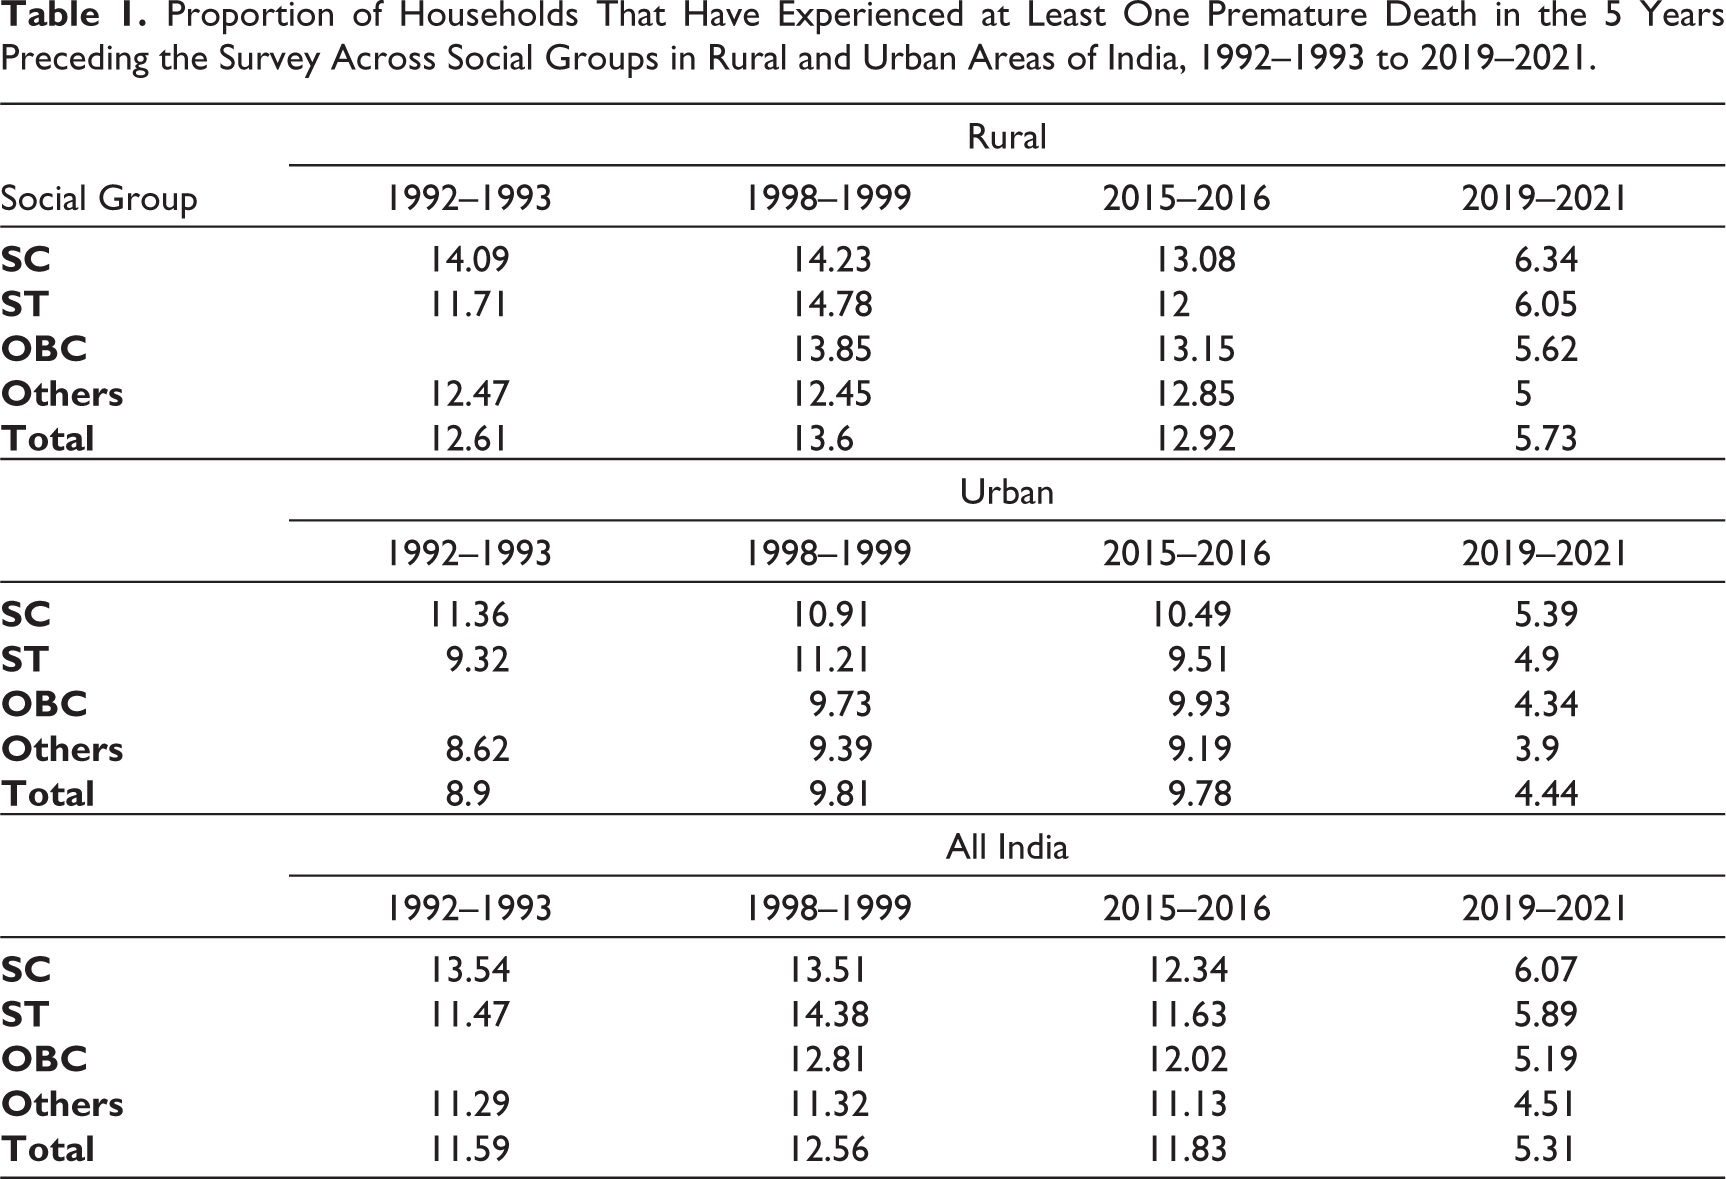
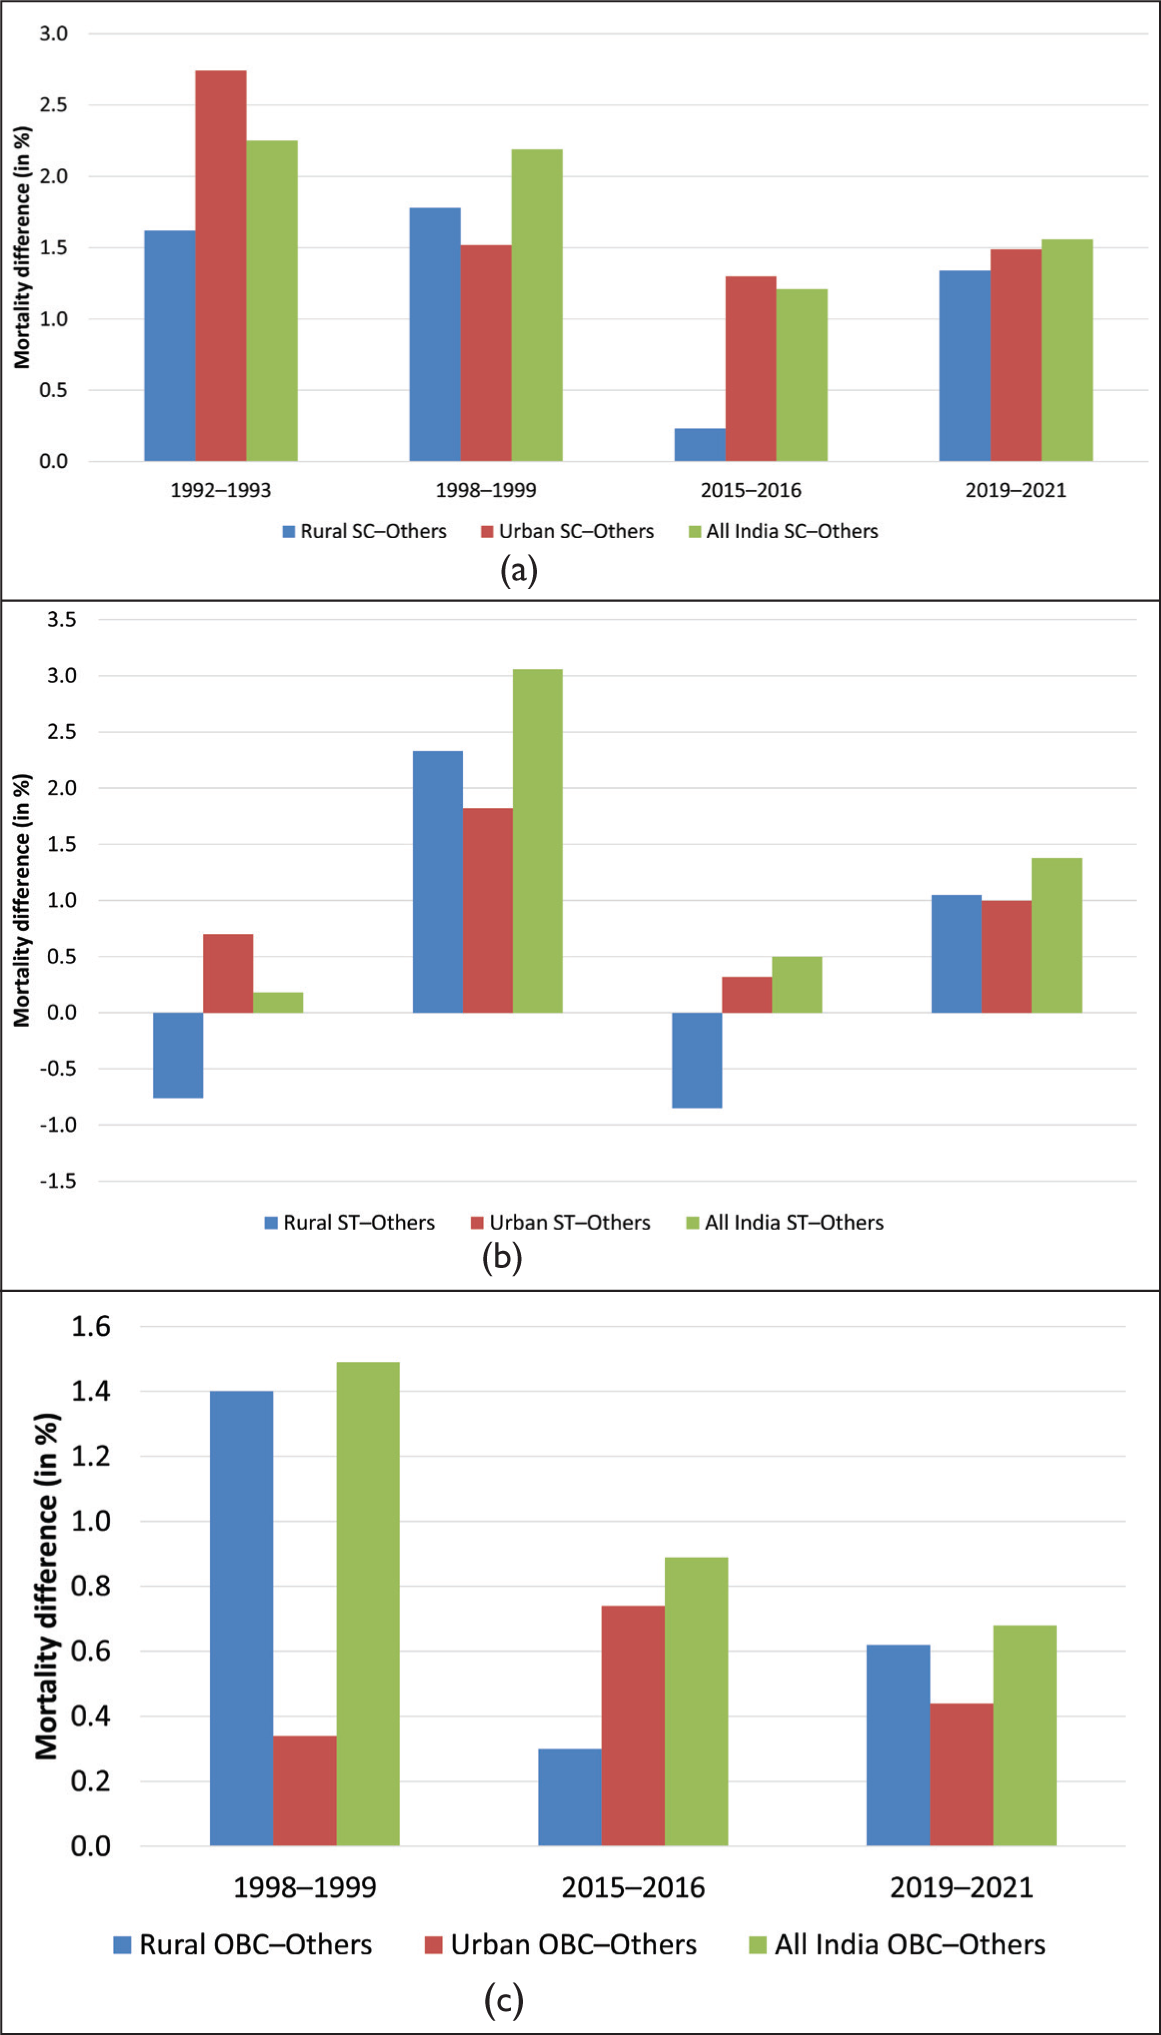
Considering the trends in the proportion of households experiencing at least one premature death, disparities have gone up between SC and ‘Others’ (SC–Others) as well as between ST and ‘Others’ (ST–Others) households when compared to the 1990s levels. While the trend has been somewhat erratic, the disparity has markedly increased between the last two rounds of data.
At the all-India level, the differential in premature deaths between SC and ‘Others’ households remained relatively steady until 1998–1999, then declined in 2015–2016. However, in the next round, the gap significantly widened. This period also coincides with the COVID-19 pandemic, highlighting the greater burden of COVID-induced mortality on SC households. Similarly, the gap between ST and ‘Others’ households was at an all-time low (almost negligible) in 1992–1993 but surged to 3.6 in 1998–1999 and subsequently declined to 0.5 prior to rising to 1.38 in 2019–2021.
The all-India trend of the gap in premature mortality between OBC and Others is different from that of SC and Others and ST and Others. In this case, the gap has continuously declined during the period, showing convergence in premature mortality between OBC and Others. The decline in the gap is mainly because of the decline in the gap between the groups in urban areas. However, in rural areas, though the trend of the gap in premature mortality is similar to SC and Others, the rise in the gap in later years is lower as compared to the SC and Others. The obvious reason for this is the better economic and social position of this group as compared with to the SCs. Being in a better social and economic position, these groups can afford better health services and live a healthier life than SC. Unlike the rural and all-India trends, the gap in premature mortality between OBC and Others in urban areas is secularly rising during the periods 1998‒1999 and 2019‒2021. Economic inequality within OBC, migration and urban vulnerability, along with the severe impact of COVID-19 in urban areas, are plausible reasons for it (Figure 1).
Premature Death Difference Between (a) SC and Others, (b) ST and Others, and (c) OBC and Others in Rural and Urban Areas of India, 1992–1993 to 2019–2021.
Trends and Patterns of Self-reported Morbidity Across Social Group in India
Survival status may not wholly capture the health status or the health potential of an individual, as it has really been improved over modernizations and technological upgradation. Adequate information about a population’s health is therefore determined by its quality of life, ascertained under the assessment of disease and disability profiles in a country. In that respect, assessing health via measuring morbidities among the population serves as a critical component. Morbidity refers to having a state of disease or ailment, or a symptom of disease, or any medical complications or consequences attained via a medical process resulting from a disease.
Table 2 shows the proportion of the ailing population in a 15-day period prior to the date of the survey by nature or the type of ailment across social groups in rural and urban areas of India since the 1990s. A cursory look at Table 2 shows that infectious diseases and ‘other diseases’ are more prevalent in rural areas, while NCD and CVD are more urban-centric. According to the latest round of NSSO data, the prevalence of infectious diseases in rural areas is 41% higher than that in urban areas. As for CVDs and NCDs, urban prevalence is 54% and 51% higher than rural prevalence. Similarly, irrespective of region, SC and ST categories are seen to be reporting a higher prevalence of infectious diseases and ‘other diseases’, while OBC and ‘Others’ category people report higher NCD and CVD prevalence.
Proportion of Ailing Population in a 15-day Period by Nature or Type of Ailment Across Social Groups in Rural and Urban Areas of India, Since the 1990s.
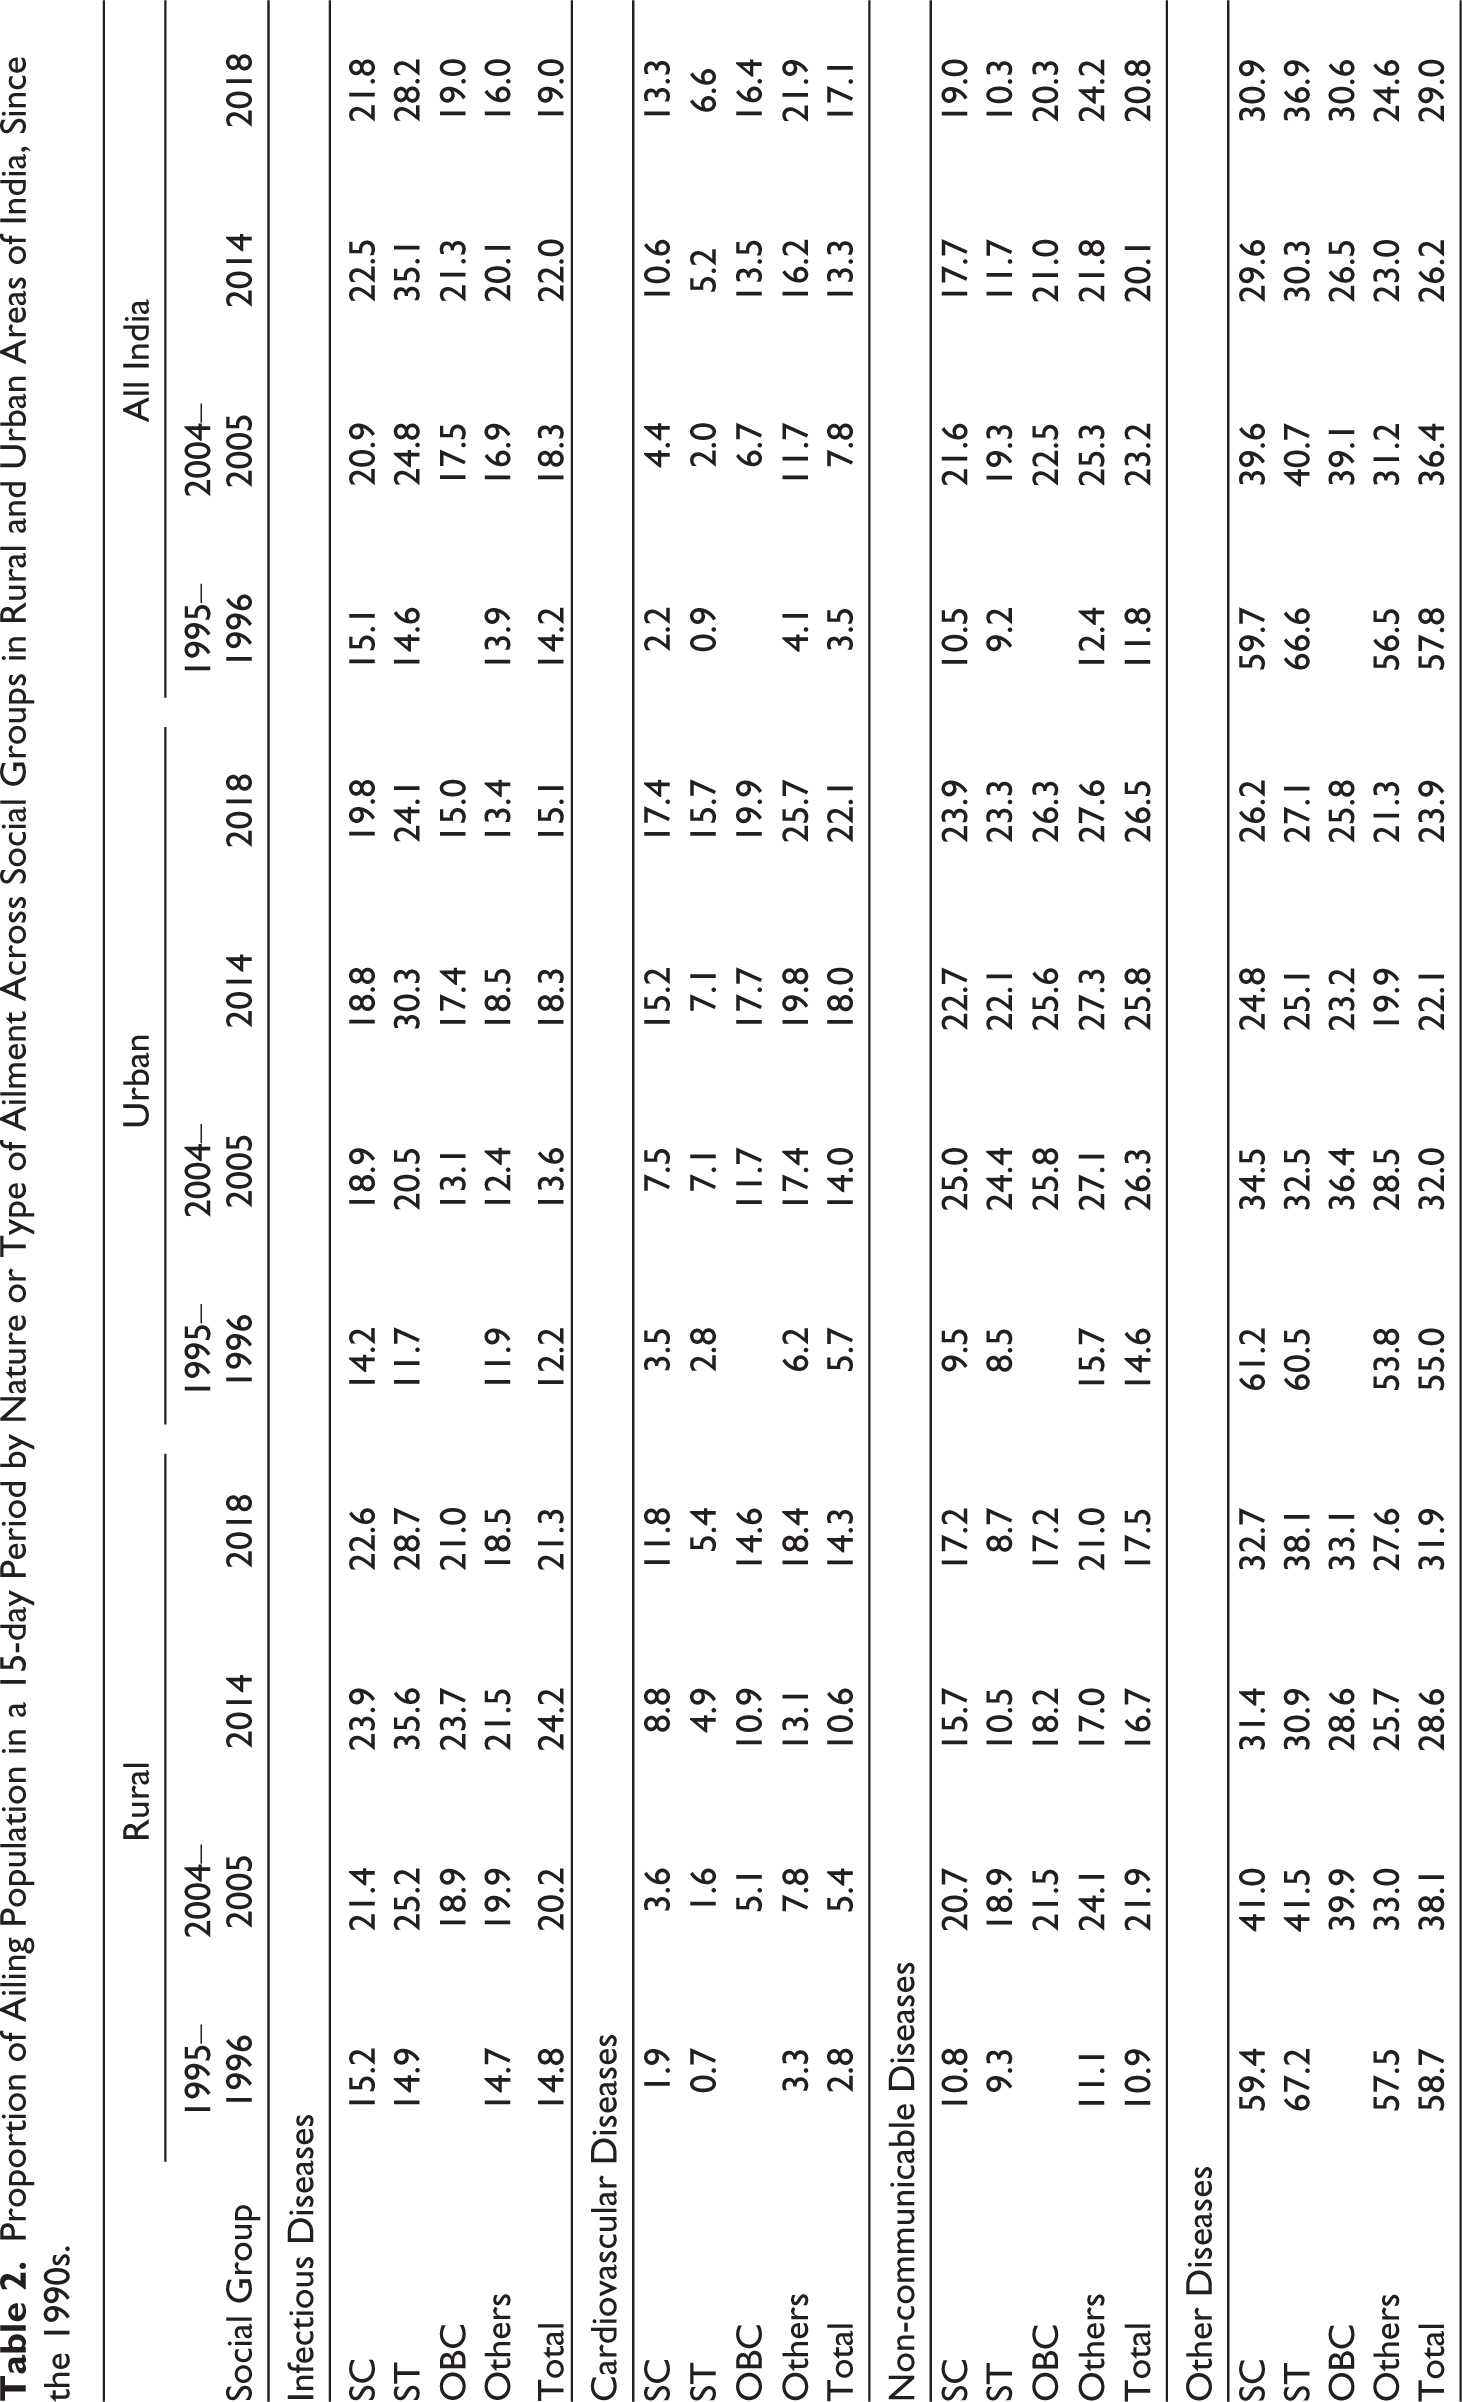
Additionally, it is observed that the prevalence of CVD and NCD has been rising steadily over the reference period: an increase of roughly 387% and 76%, respectively. The absolute levels of the disease prevalence have been higher among OBC and ‘Others’ categories compared to SC/ST. Yet the rate of increase in the prevalence was higher for SC/ST than non-SC/ST. Between 1995‒1996 and 2017‒2018, Dalits and tribals experienced an increase in the CVD prevalence by nearly seven times, while the ‘Others’ category experienced a rise of nearly five times. Similarly, NCD prevalence overall increased by a greater proportion for OBC and ‘Others’ categories. However, in urban areas, NCD prevalence for SC and ST increased by a significantly greater proportion than the ‘Others’ category; prevalence for SC and ST increased by 174% and 151%, respectively, compared to 76% for the ‘Others’ category.
The prevalence of ‘other diseases’, which includes undiagnosed ailments and fever from malaria, typhoid and so on, has declined significantly by 50% since 1995‒1996. Across social categories, the ‘Others’ (50%) and OBC (56%) categories witnessed a greater decline in prevalence than SC (45%) and ST (48%). Besides, compared to the previous round of data, that is, between 2014 and 2017‒2018, the prevalence of ‘other diseases’ increased by 10%. This increase was again borne by the SC and ST communities, experiencing an increase in the prevalence by 22% and 15%, respectively, compared to a 7% increase in the prevalence by the ‘Others’ category.
Figure 2 shows the gap in the proportion of individuals having suffered from infectious diseases between social groups. The prevalence gap between SC and ‘Others’ increased from 1.2% in 1995‒1996 to 5.8% in 2017‒2018. However, between 2004 and 2014, some reduction in the gap was observed (from 4% to 2.4%), which was subsequently followed by a more than twice increase in disparities from that of the 2004 level (see Figure 2(a)). The reduction in the national-level disparity in 2004 was mainly due to improvement in the gaps in urban areas (a sharp decline in the gap in 2014). On the other hand, the prevalence gap in rural areas has been rising steadily since 1995‒1996, from 0.5% in 1995‒1996 to 1.5% in 2004, to 2.4% in 2014 and to 4.1% in 2017‒2018.
Between ST and ‘Others’, the prevalence gap increased from almost no difference in 1995‒1996 to a 12.2% difference in 2017‒2018. As observed from Figure 2(b), disparities measured as gaps in the prevalence of infectious disease between ST and ‘Others’ have been increasing steadily across both rural and urban areas, except for some decline after 2014 in rural areas. In urban areas, the prevalence gap was primarily negative (−0.2) in 1995‒1996 (i.e., in 1995‒1996, the ‘Others’ category suffered more from infectious disease than ST), which subsequently rose to 11.8 percentage point in 2004 to 10.6 percentage point in 2017‒2018.
The Trend in Gaps in Prevalence of Infectious Diseases Between (a) SC and Others, (b) ST and Others and (c) OBC and Others, 1995‒1996 to 2017‒2018.
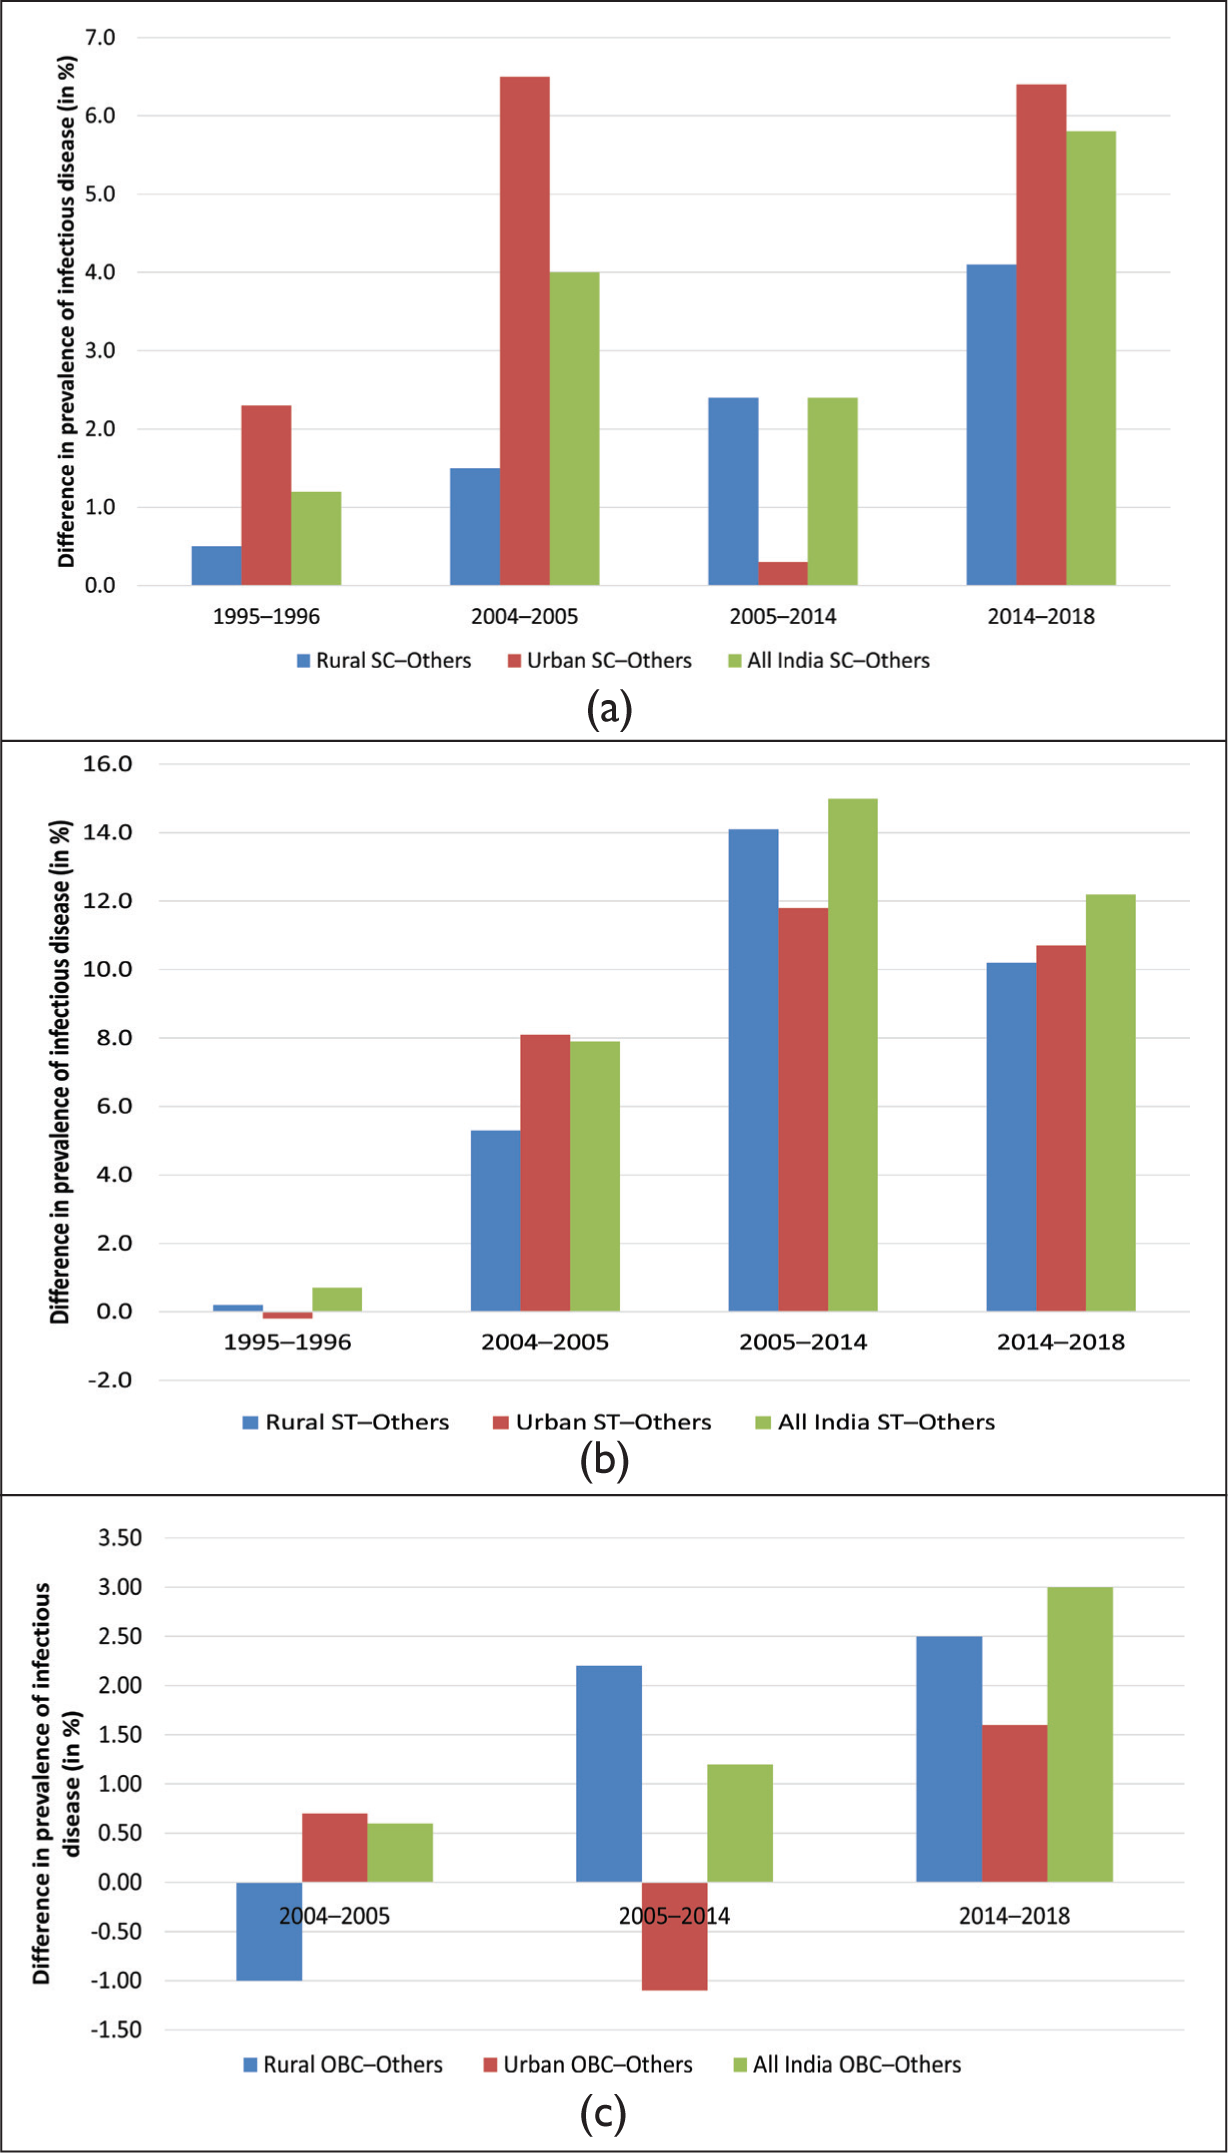
Figure 3 shows the trend in differences in the prevalence of CVD between SC and ‘Others’ in Figure 3(a), and between ST and ‘Others’ in Figure 3(b). In all instances, non-SCs/STs incur higher CVD prevalence than SCs/STs. Hence, the gap measured as the difference in prevalence rates between SC/ST and ‘Others’ is negative (as shown in Figure 3). The downward slope, therefore, implies a rising gap, while the upward slope indicates improvement. The gap between SC and Others in the proportion of individuals suffering from CVD increased until 2004, following a substantial decline of roughly 67% in 2014. Post-2004, CVD prevalence among SC increased at a higher rate than ‘Others’, so the gap declined drastically in 2014. Later in the next round, disparities increased by a small proportion of 22%.
The Trend in Gaps in Prevalence of Cardiovascular Disease Between (a) SC and Others, (b) ST and Others and (c) OBC and Others.
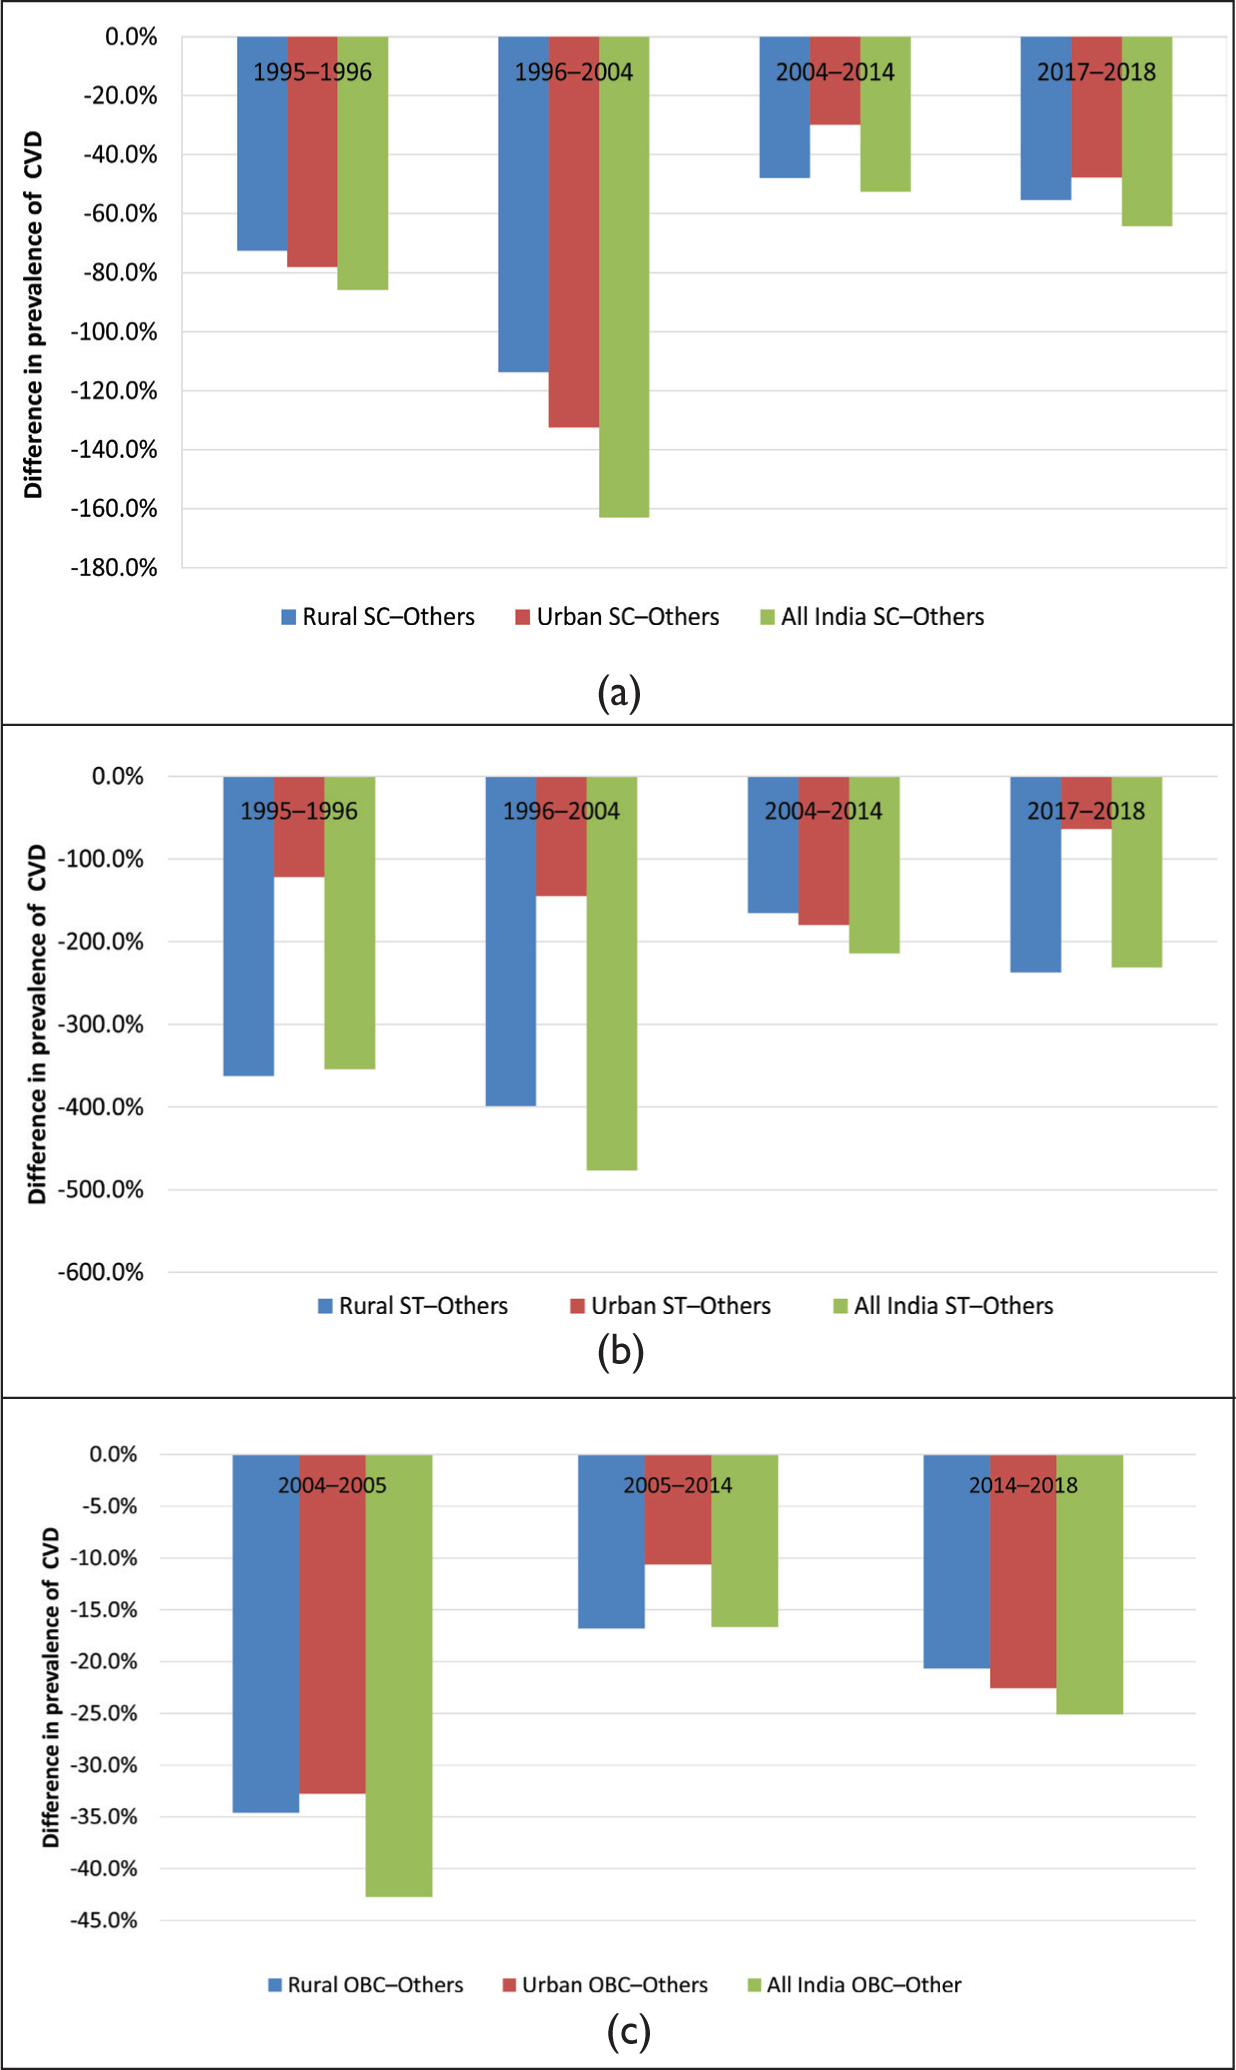
A similar trend is observed in the prevalence gap between ST and ‘Others’, which increased between 1995‒1996 and 2004, following a substantial decline of 55% in 2014. Later, in 2017‒2018, the prevalence gap again increased by a small proportion of 7%. Higher disparities are seen in rural areas compared to urban areas, where the gap between SC and Others was as high as 300%‒400% between 1995‒1996 and 2004.
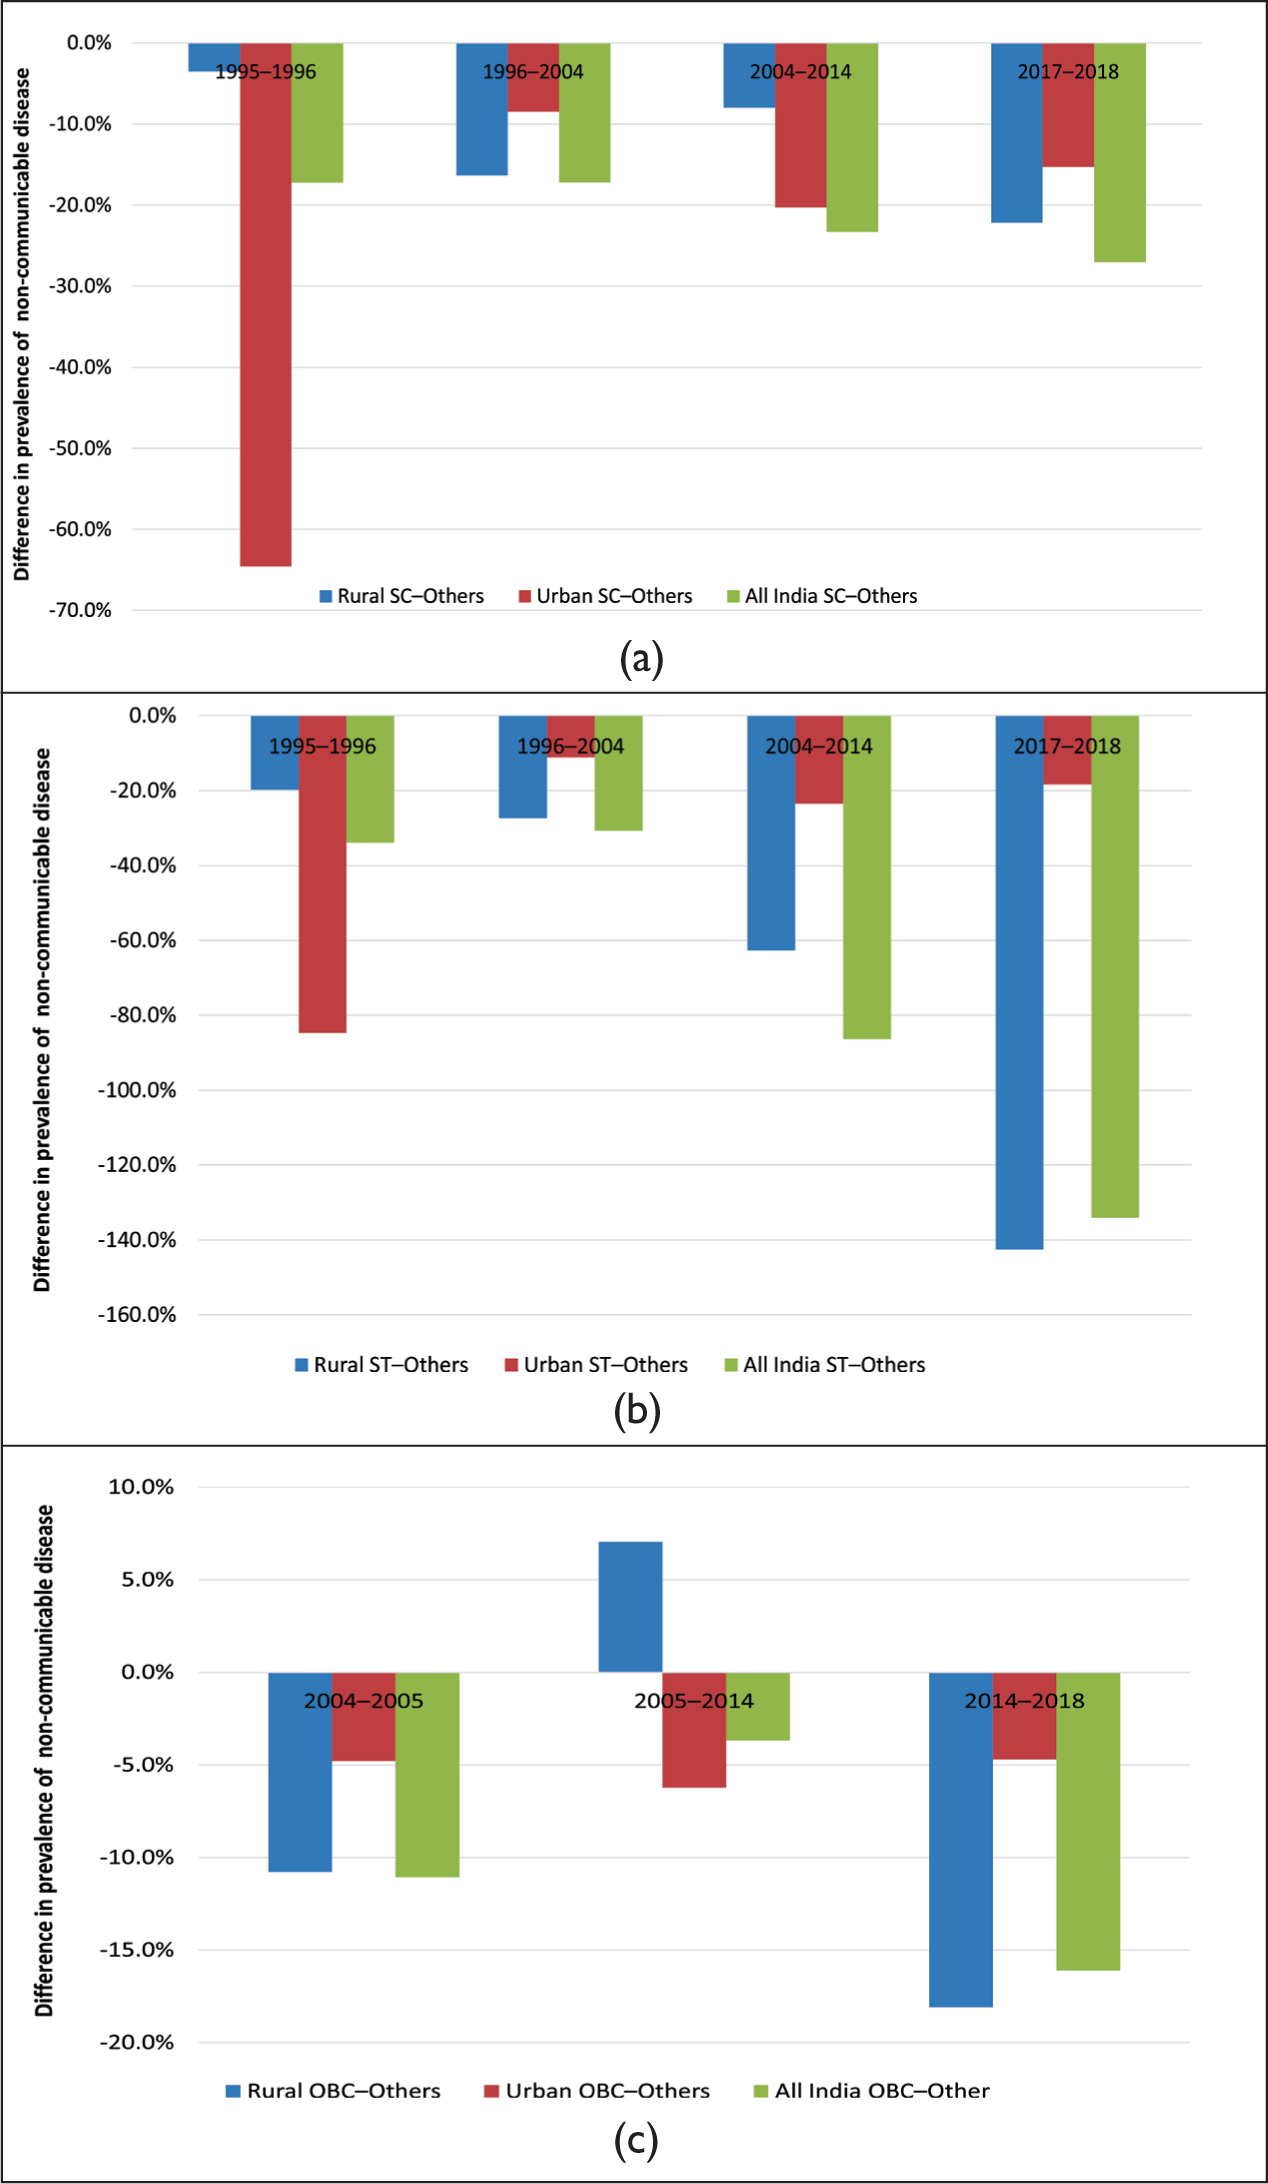
Like CVD, gaps in NCD prevalence between SCs/STs and ‘Others’ stand negative, indicating that NCD prevalence is higher among individuals in the ‘Others’ category than among SC and ST individuals. In absolute terms, the gap in the prevalence of NCD between caste groups is lower than that in CVD. These are largely driven by rural disparities in self-reported morbidity. In urban areas, where people are more aware, the gap is rather declining (Figure 4).
The Trend in Gaps in Prevalence of Non-communicable Diseases Between (a) SC and Others, (b) ST and Others and (c) OBC and Others.
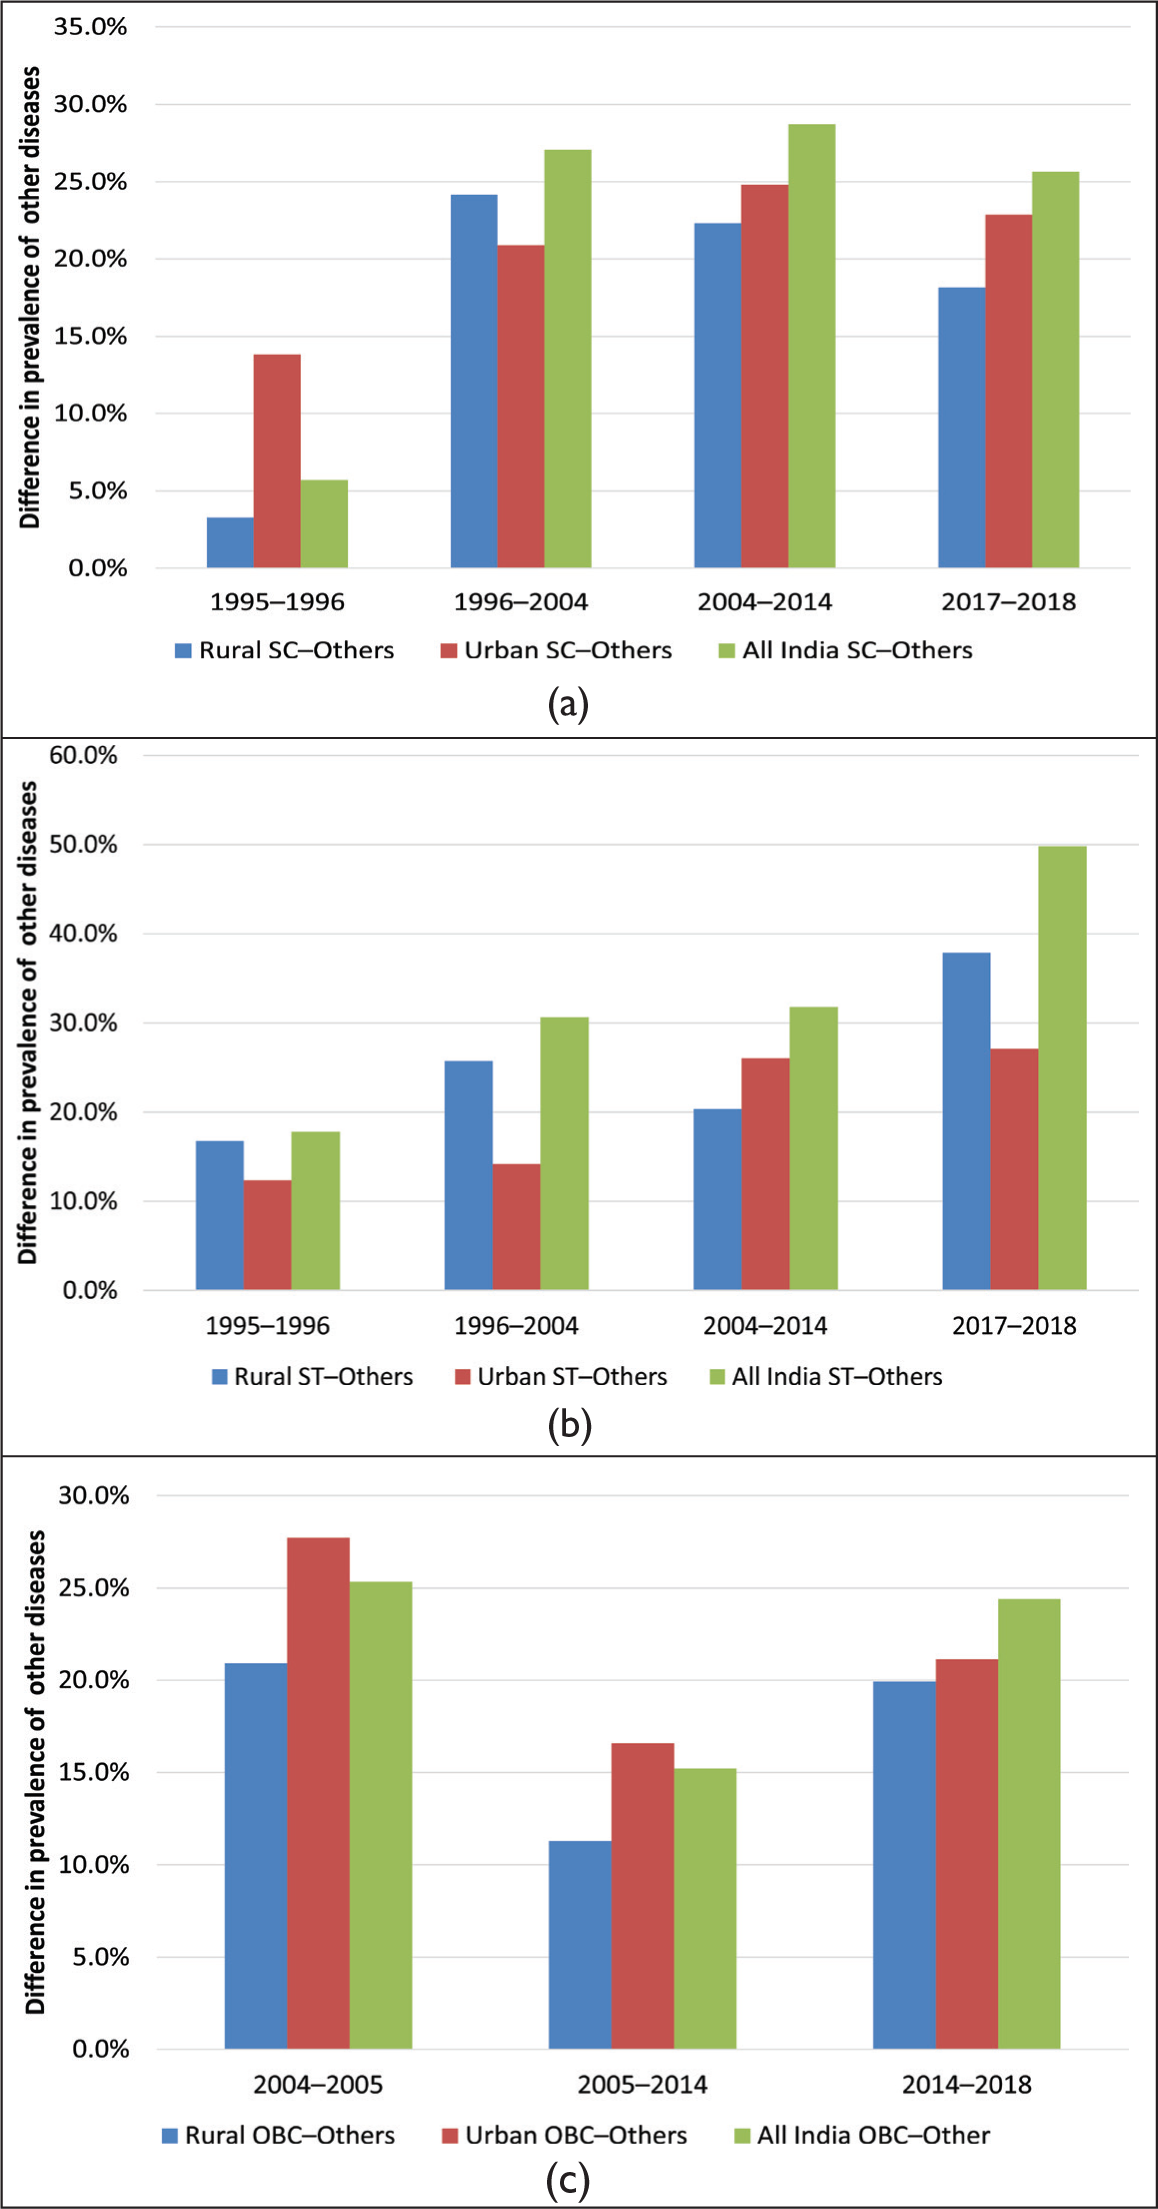
In the case of ‘other diseases’, we see that in all instances, SC and ST category individuals incur a higher prevalence compared to non-SC/ST individuals (Figure 5). This differential in the prevalence rates has also been rising over the reference period, following an upward trend in disparities. In 1995‒1996, Dalits incurred a 6% higher disease prevalence than the ‘Others’ category people. This proportion increased to 27% in 2004 and 29% in 2014, followed by a slight reduction of 3% in 2017‒2018. Rural disparities grew at a higher pace until 2004 (following a slight decline thereafter), while urban disparities grew at a relatively modest pace until 2014 (and remained nearly the same thereafter). Between ST and ‘Others’, the prevalence gap increased from 18% in 1995‒1996 to 31% in 2004, to 32% in 2014 and to 50% in 2017‒2018. This differential was more prominent in rural areas than urban areas, where the gap largely followed a secular rise from 17% in 1995‒1996 to 26% in 2004 and to 38% in 2017‒2018.
The Trend in Gaps in the Prevalence of ‘Other Diseases’ Between (a) SC and Others, (b) ST and Others and (c) OBC and Others.
Econometric Analysis
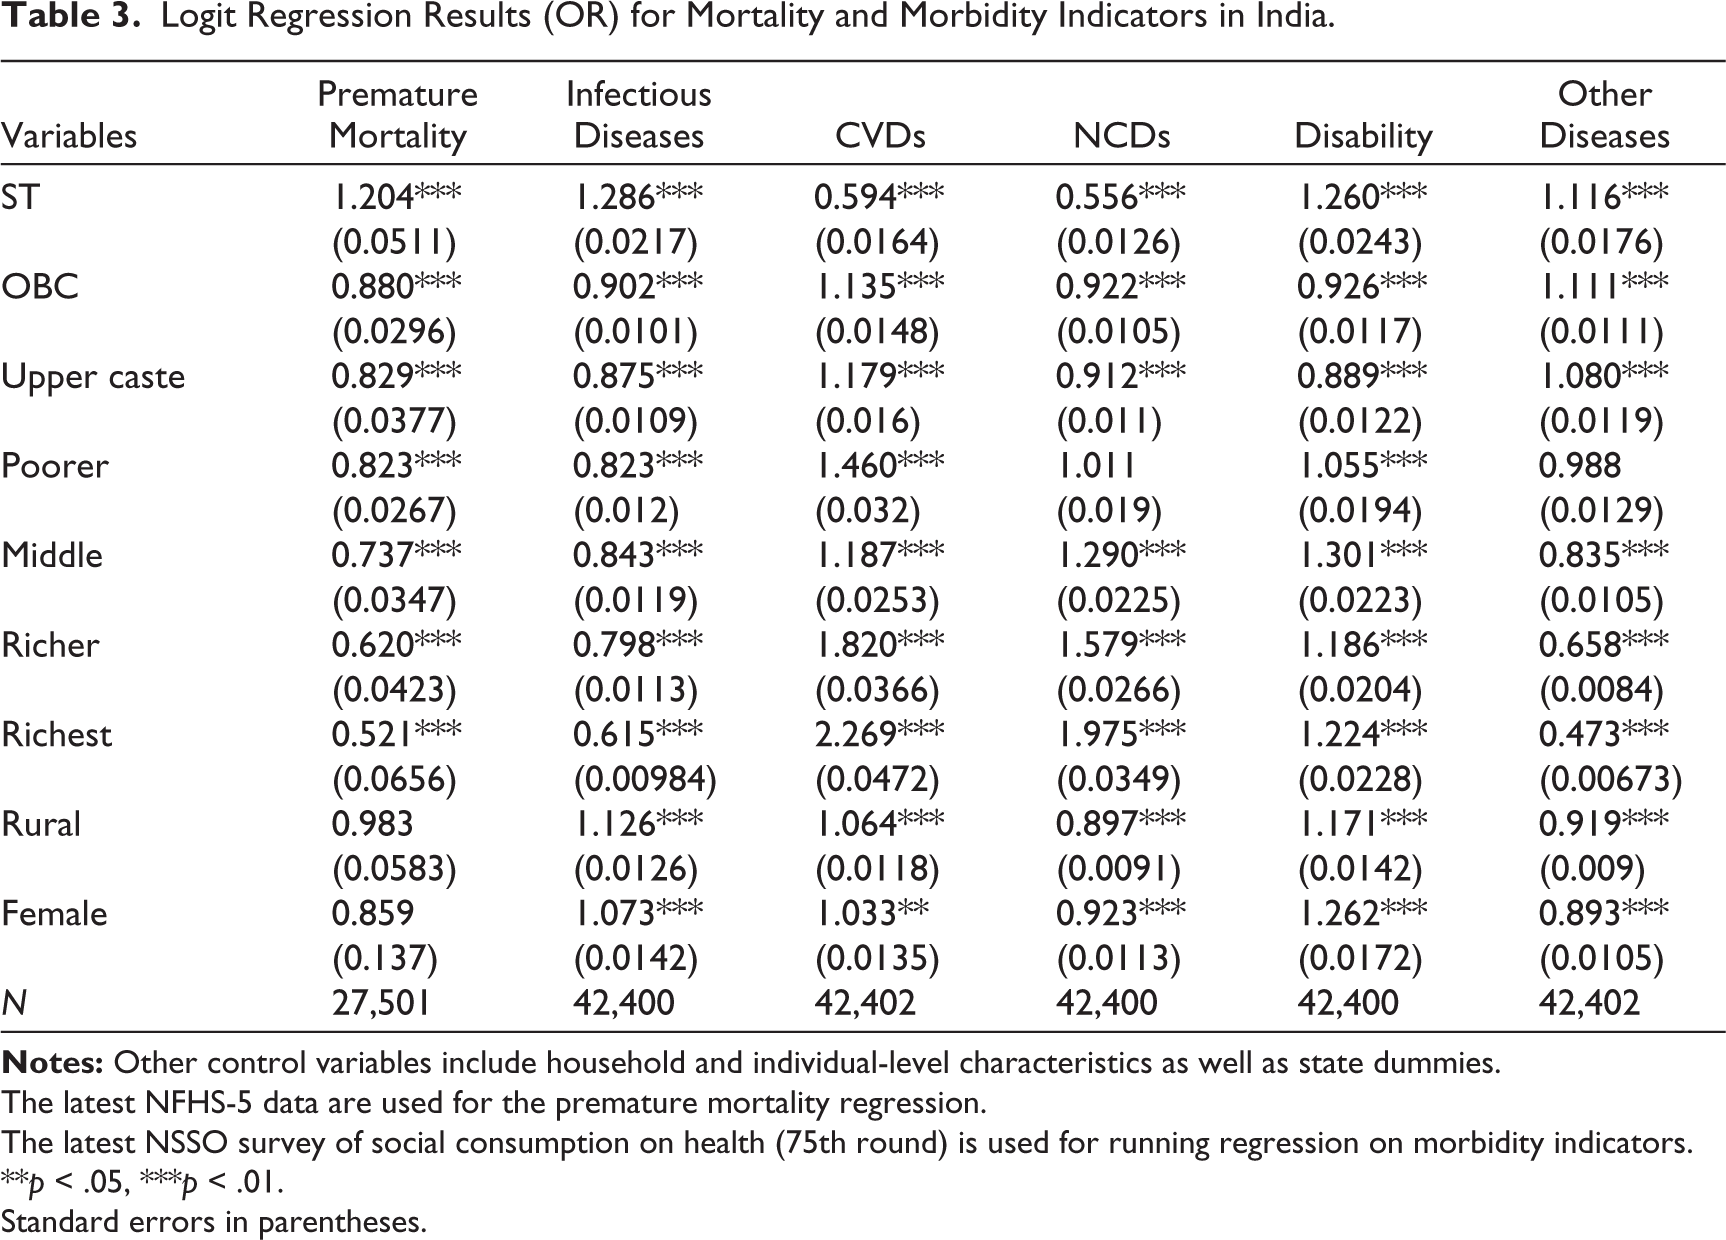
Table 3 presents regression results for mortality and morbidity indicators, with the primary predictor being an individual’s caste. Additional explanatory variables include household-level factors such as wealth index/income quintile, usual source of care, house type (kuccha, pucca and semi-pucca), household structure, family insurance, major cooking fuel used and individual-level controls such as region (rural/urban), age, gender, occupation and education. State fixed effects are also accounted for. For the NSSO data, consumption expenditure is reported, and income quintiles have been created based on each household’s ‘monthly per capita expenditure’. In the case of NFHS data, the wealth index is used, which is a composite measure of a household’s cumulative living standard. This index is calculated using easily collected data on a household’s ownership of selected assets (e.g., televisions and bicycles), housing construction materials and types of water access and sanitation facilities.
Logit Regression Results (OR) for Mortality and Morbidity Indicators in India.
The latest NFHS-5 data are used for the premature mortality regression.
The latest NSSO survey of social consumption on health (75th round) is used for running regression on morbidity indicators.
**p < .05, ***p < .01.
Standard errors in parentheses.
Our regression results indicate an independent relationship between an individual’s caste and their health status. Upper-caste and OBC households have lower odds of premature mortality compared to SC households. The odds ratios (ORs) of 0.829 and 0.880 suggest that upper-caste and OBC households, on average, have 17% and 12% lower odds of a family member dying prematurely compared to SC households, respectively. Similarly, individuals from OBC and upper-caste groups have lower odds of suffering from infectious diseases, NCDs and disabilities compared to SC individuals, as their odds are around 10%‒20% lower than those of SC individuals. However, in the case of CVDs, SC individuals are at a lower risk. Upper-caste and OBC individuals have approximately 13% higher odds of developing CVDs compared SC individuals, which aligns with the trend observed in the descriptive analysis that shows a higher prevalence of CVDs among the non-SC/ST groups.
An individual’s economic status is inversely related to their odds of experiencing poor health. As a household’s wealth index improves, the odds of premature mortality decrease. In other words, households in higher income or wealth brackets have lower odds of experiencing premature deaths. Conversely, individuals from poorer households have higher odds of suffering from infectious or other diseases compared to those from wealthier households. However, for diseases such as CVDs and NCDs, wealthier individuals are more likely to be affected. For example, an OR of 1.975 in the NCD model indicates that individuals in the richest quintile have 97% higher odds of suffering from NCDs compared to those in the poorest quintile.
Gender-based mortality differentials also exist, with women facing higher health risks. The morbidity odds are significantly higher for females compared to males, with women having 7% higher odds of contracting infectious diseases, 3% higher odds of suffering from CVDs and 26% higher odds of being disabled. A clear urban‒rural differential is observed in morbidity indicators. Individuals from rural areas have higher odds of contracting infectious diseases and disabilities compared to those from urban areas.
Discussion
The findings of this study underscore the persistent role of caste as a structural determinant of health in India. Across mortality and morbidity indicators, SC and ST individuals consistently experience poorer health outcomes compared to non-SC/ST groups, with their average health status remaining below the national levels. Even after accounting for socio-economic and demographic factors, caste continues to exhibit an independent association with health outcomes, indicating that economic disadvantage alone does not fully explain these disparities. These findings align with a growing body of research highlighting caste as a persistent structural determinant of health in India (Chatterjee et al., 2023; Ghosh, 2026; Maity, 2017).
The strong interlinkages observed between caste, class and health outcomes point to the existence of a ‘social gradient in health’, wherein Dalits and Adivasis occupy the lowest rungs of both the social and economic hierarchy. This positioning systematically constrains their access to key social determinants of health, including education, income, secure employment and social capital, thereby translating historical and contemporary forms of exclusion into cumulative health disadvantage (Barman, 2009; Haluwalia et al., 2022; Jungari & Chauhan, 2017; Raushan et al., 2022). In this sense, caste-based health disparities can be understood not merely as differences in outcomes but as inequities arising from long-standing patterns of exploitation and unequal distribution of resources.
This study also discusses caste disparities in the disease profile of the country where Dalits and tribal communities have been facing persistently high prevalence of infectious diseases and ‘other diseases’, while the upper caste are being more afflicted with CVDs and NCDs. Two reasons explain this singularity, the first being the epidemiological transition that the country is facing and the second being the erroneous effects of reporting bias. All countries on their development route undergo a phase of epidemiological transition that guides the changing population pattern in terms of fertility, life expectancy, mortality and the leading cause of death. India is also experiencing a similar transition, reports of which show an increasing trend in the prevalence of age-specific CVDs and NCDs over the last 20 years, with the increase in the latter being much higher than that in the former (Dandona et al., 2017; Yadav & Arokiasamy, 2014). However, there is a specific class of people experiencing this epidemiological shift in terms of the increased prevalence of NCDs and CVDs. These are people with an improved living standard, having a better lifestyle and better socio-economic characteristics. On average, upper-caste individuals enjoy better socio-economic status than other caste groups, and the same is reflected in the disease profile experienced by them. Second, the self-reported measures often lack effective validity due to ‘reporting bias’. It is found that factors such as demographics, educational status, caste, media exposure and wealth impact accurate reporting (Subramanian et al., 2009). Likewise, people with poor socio-economic status tend to report less, either on account of low awareness or due to undiagnosed ailments. SC population, the majority of whom belong to poor states such as Uttar Pradesh and Bihar, have been on the lower rungs of economic as well as social ladders. They are characterized by perpetually high poverty, poor occupational ranks and low levels of literacy (Borooah, 2005; Deshpande, 2001; Dommaraju et al., 2008). These attributes explain both their disease profile and the plausibility of their under-reporting of NCDs and CVDs.
Another critical observation is the widening health gaps between caste groups observed in our analysis. While these findings contrast with some recent studies that report a gradual narrowing of inequalities in selected child health outcomes (Ghosh, 2024a; Singh et al., 2023), our analysis provides a broader perspective by examining health disparities beyond early childhood and across a wider range of adult health outcomes. In this sense, while aggregate health indicators may suggest some degree of convergence, substantial disparities persist in morbidity patterns and disease burden, indicating that improvements have not been uniform across different dimensions of health. Overall, the pace of improvement in mortality and morbidity statistics has been higher for the non-SC/ST group than for the SC and ST groups. Speedier improvement in the better-off group than in other groups has, therefore, contributed to the persistence and, in some cases, widening of the caste divide in health. Health differences between SC/ST and the ‘Others’ category have widened in the last 30 years, with the sharpest divergence observed in infectious diseases. While the prevalence of the infectious diseases among Dalits increased nearly twofold, the corresponding increase among the ‘Others’ group was marginal. This indicates that Dalits and tribals in India remain far from completing the phase of epidemiological transition, as most of them continue to suffer from communicable diseases. These patterns are consistent with the broader literature on epidemiological transition in lower‐middle-income countries, where improvements in living standards are typically accompanied by a shift from communicable diseases to NCDs. However, the coexistence of infectious disease burdens among disadvantaged caste groups alongside rising NCD prevalence among more privileged groups suggests that the epidemiological transition in India is uneven and socially stratified (Dandona et al., 2017; Yadav & Arokiasamy, 2014). Similarly, while the prevalence of ‘other diseases’ in the country has declined over the years, caste differentials in the prevalence rates continue to rise. The widening gap is attributed majorly to the poor socio-economic conditions that the Dalits and tribals live in. Living in a poor neighbourhood can affect several demographic outcomes, impacted by individual and community-level factors (Dommaraju et al., 2008). On average, Dalits live in segregated rural areas and slums in big cities, away from affluent and advantageous localities, often in areas with high-risk exposure to hazardous pollutants and contaminants (Vaid & Heath, 2010; Vithayathil & Singh, 2012). Aggravated by residential segregation, Dalits and tribals repeatedly face difficulties accessing clean water, proper drainage and sanitation. The seclusion also creates greater hurdles for them to access basic health services and other state facilities.
Furthermore, our analysis also reveals a large degree of inter-caste health disparities in rural areas. Caste disparities in health have increased from the 1990 levels, much of which came from rural areas. While caste disparities in rural areas rose for all the discussed variables, this was not the case in urban regions. This pattern may partly reflect higher levels of rural poverty combined with caste-based exclusion and limited access to healthcare services.
Caste-based discrimination is one of the inherent features encircling the lives of Dalits in the country. The nature and degree of discrimination, however, vary around the country. In urban areas, caste biases and discrimination manifest subtly, while in rural areas, they are more explicit and downright. Rural inhabitants are far more conditioned to accepting the practice of untouchability and discrimination than their urban counterparts (Acharya, 2007, 2010; Shah et al., 2006; Srivatsan, 2015; Thorat & Joshi, 2020). While observable individual and household characteristics contribute significantly to health outcomes, discrimination and discrimination-induced barriers to accessing formal healthcare can be identified as an additional structural factor that goes beyond the conventional socio-economic determinants. It is well documented in the literature that several SCs/STs face difficulties in accessing professional healthcare services due to discrimination and other structural barriers, leading them to resort to quacks and uncertified private practitioners (George, 2015; Jadhav & Taneja, 2022). At the same time, it is important to recognize that socio-economic factors such as household wealth, education and living conditions also play a substantial role in shaping health inequalities across caste groups. A number of studies have shown that household wealth and maternal education account for a significant share of observed health disparities, particularly in the case of child health outcomes (Ghosh, 2024b; Joe et al., 2009; Raushan et al., 2022). However, these socio-economic disadvantages themselves are closely intertwined with historical processes of caste-based exclusion. Limited access to education, secure employment and productive assets among marginalized caste groups reflects long-standing social discrimination. As a result, caste-based disadvantage operates both directly, through discriminatory practices in social and institutional settings, and indirectly, through its influence on socio-economic status and access to resources.
In conclusion, these findings highlight the limitations of existing health interventions in enabling effective utilization among marginalized groups. Despite targeted policy initiatives, entrenched caste hierarchies persist, reflecting the need for an improved policy design as well as stronger implementation and evaluation mechanisms.
There is an intrinsic need to adapt policy approaches that go beyond expanding healthcare access alone and which also complementarily tackle the broader social determinants of health, including education, income inequality, residential segregation and social discrimination. Policies aimed at improving maternal education, household economic security and equitable access to healthcare services are likely to play a critical role in reducing persistent caste-based health inequalities.
This study has a few limitations. The first is the irregular gaps in the data set used to infer a smooth time trend. The irregularities in the gap of the subsequent rounds of data may therefore not capture precisely the nature of gaps in health outcomes. However, the inference made by taking a period of 30 years substantiates our interpretation. Second, in the initial rounds of NSSO and NFHS, OBC and ‘Others’ were combined; therefore, our analysis of non-SC/ST includes both OBC and ‘Others’.
Conclusion
This article examined the trends and patterns of health inequalities across social groups in India using multiple indicators of health outcomes over the last three decades. The analysis shows that, despite overall improvements in health outcomes, caste-based inequalities in premature mortality and disease burden remain persistent, with SCs and STs continuing to experience poorer health outcomes compared to OBCs and ‘Others’. These findings reaffirm that caste continues to function as a structural determinant of health in India.
By adopting a multi-indicator and longitudinal approach, this article contributes to the existing literature on health inequalities in several ways. First, unlike much earlier work that relies on cross-sectional evidence or a single indicator, this study provides a long-term assessment of caste-based health inequalities over three decades. Second, by jointly examining descriptive trends along with causal analysis, the study demonstrates that caste exerts an independent and persistent influence on health outcomes, reinforcing that caste is a structural determinant of health and not merely a proxy for class disadvantage. Third, our findings also reveal unequal patterns of epidemiological transition: SC/ST groups continue to experience a higher burden of infectious diseases, while the prevalence of NCDs and CVDs is more evident in upper castes, highlighting that the distribution of health gains and disease profiles remains socially stratified.
Collectively, these findings have important implications for public health and planning. While recent policy frameworks, including the 12th Five-year Plan, have emphasized making special provisions to improve healthcare access for SCs and STs, the persistence and widening of health gaps suggest that policy intent has not translated into equitable outcomes on the ground. Structural barriers, discriminatory practices and uneven quality of care within public health facilities continue to constrain effective utilization, often forcing households to rely on private providers and incur high out-of-pocket expenditures, which in turn further limit timely care-seeking. Addressing these gaps, therefore, requires not only expansion of coverage but also stricter monitoring and accountability in the public health machinery, improvements in service quality and a stronger push towards effective financial risk protection through health insurance and related measures. In addition, improving health equity requires strengthening last-mile delivery in rural and socially marginalized areas so that coverage translates into effective access, including greater community engagement by front-line health workers to improve awareness, early diagnosis and timely referrals and stronger primary-care platforms that ensure prevention and continuity of care in remote areas.
Finally, the study points to several avenues for future research. Further work is needed to examine institutional discrimination and the quality of care within healthcare systems. Future research should integrate primary fieldwork with secondary data analysis to generate more fine-grained evidence on everyday experiences of exclusion, delays in care-seeking and treatment and underdiagnosis. This helps identify the mechanism by which caste-based stratification translates into health disadvantages across regions and rural‒urban contexts.
Microlevel extensions of this kind can render cultural and social barriers more visible, thereby informing more robust policy formulation and programme design at both the macro- and local levels in India.
Footnotes
Declaration of Conflicting Interests
The authors declared no potential conflicts of interest with respect to the research, authorship and/or publication of this article.
Funding
The authors received no financial support for the research, authorship and/or publication of this article.