
Abstract
Background:
The characteristic cavovarus foot deformity associated with Charcot-Marie-Tooth disease (CMT) is highly variable between individuals. Although substantial progress has been made in characterizing foot morphology in CMT, previous investigations have not addressed limb symmetry within individuals. This is relevant to functional assessment scales, which typically measure only the dominant limb, and has implications for surgical treatment planning. This study aimed to use weight-bearing computed tomography (WBCT) to examine similarity in deformity between limbs in individuals with CMT.
Methods:
Bilateral WBCT images of 31 individuals with CMT were analyzed through automatic calculation of 9 radiographic measurements and generation of a statistical shape model (SSM). Morphologic variation in the SSM was described with principal components analysis (PCA). Absolute differences in radiographic measures and PCA scores between paired limbs were analyzed with appropriate statistical tests with Bonferroni correction.
Results:
Significant absolute differences between paired limbs were identified in all radiographic measures, ranging from a median difference of 1.2° in calcaneal inclination angle to 5.8° in the axial plane Meary angle. Similarly, significant absolute differences between limbs were identified on all 3 analyzed modes of variation in the SSM, with the greatest difference seen in in hindfoot varus rotation. Significant laterality-dependent morphologic differences could not be identified.
Conclusion:
Both radiographic measures and SSM demonstrated statistically significant absolute differences between limbs. In both methods, greater magnitude of difference was seen between limbs in hindfoot varus rotation than arch height.
Clinical Relevance:
These data provide quantitative characterization of the clinically suspected limb-to-limb asymmetry in CMT-related cavovarus deformity. Alignment differences between limbs support the use of limb-specific assessment in functional outcome measures and surgical algorithms. This supports the need for further research quantifying clinically significant differences in foot morphology and consideration of limb asymmetry in research and patient education for CMT.
Level of Evidence:
Level III, retrospective cross-sectional study.
Introduction
The characteristic cavovarus foot deformity associated with Charcot-Marie-Tooth disease (CMT) is a frequent focus of orthopaedic surgical intervention.1-13 Despite substantial efforts to optimize a surgical algorithm, surgical management remains varied, in part because of the heterogeneity of deformity presentation in CMT.1-4,9,14,15 Current surgical algorithms emphasize customization of treatment based on specific anatomic factors of the limb and typically recommend staged surgeries for bilateral cavovarus feet.1,2,6 These algorithms rely on intraoperative examination following soft tissue procedures to determine necessary osteotomies. Several recent studies have worked to quantify CMT-related foot deformity, characterizing differences in hindfoot, midfoot, and forefoot alignment and morphology.16-25 Further, differences in deformity presentation have been identified between genetic subtypes of CMT.16-18 These studies demonstrate substantial variability in deformity presentation between individuals across the disease but have not addressed the clinical suspicion of asymmetric deformity between limbs within individuals. Asymmetry in function between limbs has been demonstrated in a portion of individuals with CMT, although the results demonstrated no consistent differences between left and right limbs. 26 Existing functional outcome scales predominantly rely on measurement only of the dominant limb, assuming symmetry in function, which, although appropriate for some measures, may limit their applicability in understanding foot and ankle impacts of CMT.26-28 Improved characterization of contralateral limb symmetry or asymmetry may better inform surgeons and patients, as symmetric deformity between limbs would allow for more straightforward preoperative planning for surgical correction of the second limb and asymmetry provides a necessary piece of information for patient education so that patients understand likely similarities or differences in their surgical procedures and results when having bilateral cavovarus corrective surgery.
Existing analyses have predominantly used weight-bearing computed tomography (WBCT) to evaluate foot structure under normal load and take advantage of the relatively lower radiation dose of WBCT.29,30 The 2 primary methods used to analyze foot morphology from this image data are 2-dimensional (2D) radiographic measurements, which can be automatically calculated from bony segmentations from WBCT, and 3-dimensional (3D) statistical shape modeling.3,14,16-21,23-25 To thoroughly investigate potential symmetry or asymmetry between limbs, this study used both 2D and 3D image analysis methods to evaluate differences in foot morphology between contralateral limbs in individuals with CMT. The objective was to quantitatively test the clinical suspicion that CMT-related cavovarus deformity presents asymmetrically between limbs, which has applications for further refinement of functional assessments and surgical algorithms. Given previous research demonstrating symmetric function, we hypothesized that although some individuals may show substantial asymmetry, the cavovarus foot deformity would on average present similarly between contralateral limbs.
Materials and Methods
Participants
To capture a large and diverse cohort of individuals with this rare disease, the data set used in this study consisted of a combination of retrospectively and prospectively collected WBCT scans from 2 institutions with data acquisition and material transfer approval from both institutional review boards (FWA00003745 and FWA00003007). Prospectively collected WBCT scans were gathered from 2 ongoing studies. Inclusion criteria for retrospective inclusion and for both prospective studies were a genetic or clinical diagnosis of CMT who either received bilateral WBCT in a prospective study or had received bilateral WBCT with large capture volume at either institution between 2015 and 2023. Exclusion criteria included prior surgery of the legs or feet, prior fracture in legs or feet, symptomatic osteoarthritis of ankle, other congenital foot deformity, past or present malignancy, or other comorbid chronic disease.
This yielded bilateral imaging from 31 individuals with CMT (Table 1). All individuals included in this study had no prior surgery or fracture on either lower limb, no other comorbid neurologic or neuromuscular disease, and were able to stand for the image collection. Of these 31 individuals, 16 were diagnosed with CMT 1, 6 had CMT 2, 4 had X-linked CMT, 3 had intermediate CMT, 1 had CMT 4, and 1 had sorbitol dehydrogenase deficiency (CMT-SORD). To better represent the spectrum of foot types in modeling, the statistical shape model was optimized with a control cohort consisting of 33 limbs from 25 individuals (Table 1). This control group was not analyzed for symmetry as it did not consist of bilateral imaging, and no statistical comparisons were made to the control group; it was included solely to improve optimization of the final model.
Overview Demographics for CMT Group and Control Group Used in Model Optimization.
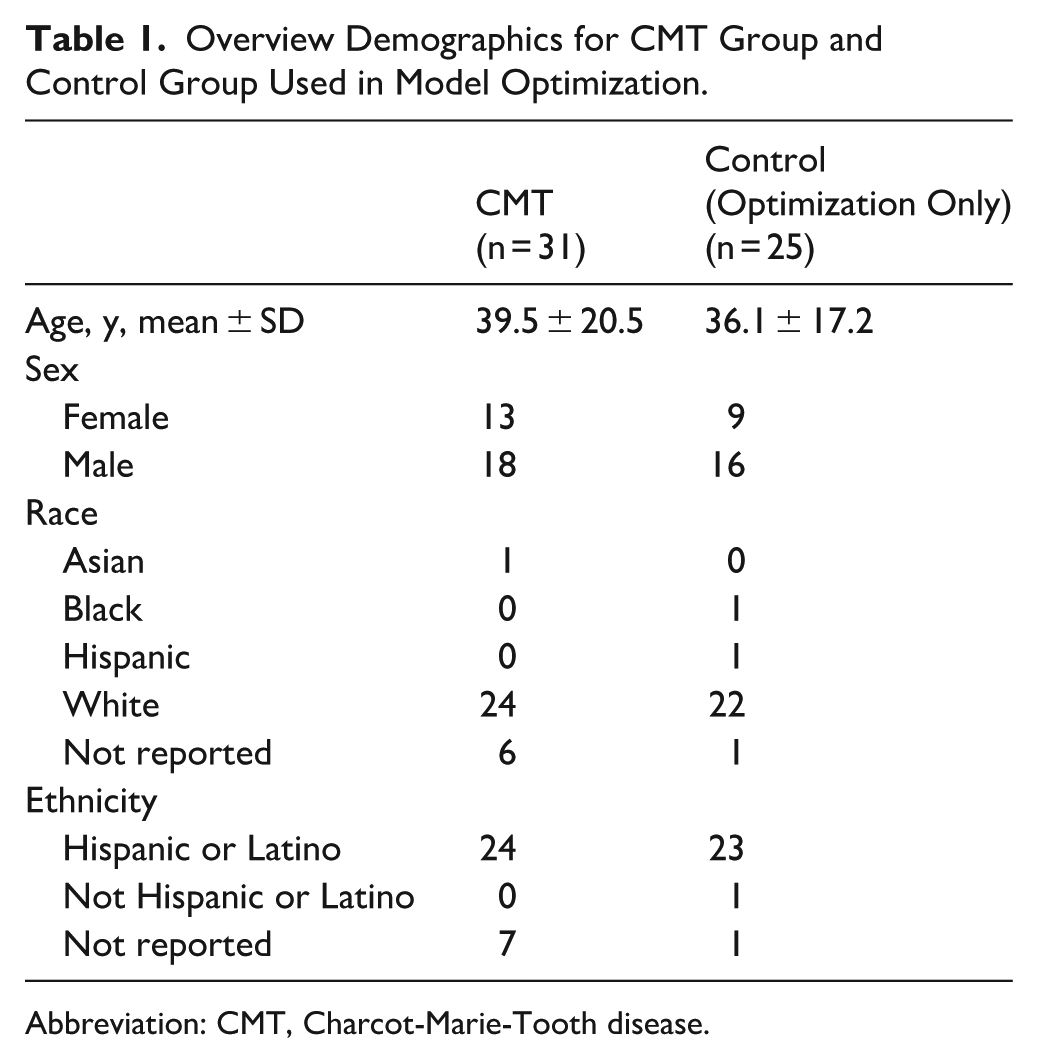
Abbreviation: CMT, Charcot-Marie-Tooth disease.
Imaging and Image Segmentation
Bilateral WBCT scans were collected in a bipedal standing position with either a 0.3- or 0.37-mm isovoxel size, depending on institution. This variability in resolution has been demonstrated to not impact statistical shape model analysis, and images at voxel sizes up to 1 mm3 have been used in previous studies generating 2D radiographic measures from WBCT.23-25,31,32 Following previously published methods, bones from the tibia and fibula proximally through the metatarsals distally were segmented from WBCT images semi-automatically (Bonelogic; Paragon 28) followed by manual verification and cleaning (Mimics; Materialise). The 3D parts calculated from these segmentations were consistently smoothed and re-meshed to allow for consistent analysis.18,33-36
2D and 3D Image Analyses
Using a validated toolbox, anatomical coordinate systems were automatically calculated for each of the 3D bone reconstructions. 37 Then, commonly used 2D radiographic measures were automatically calculated from those anatomical vectors. 37 Based off previously reported radiographic measures in CMT, the measures calculated consisted of Meary angle (sagittal and axial planes), calcaneal inclination angle, hindfoot alignment angle, talocalcaneal angle (sagittal and axial planes), calcaneal to first metatarsal angle, talar tilt angle, and tibiocalcaneal angle.3,10,14,19,21,23-25,38-43 To generate the SSM, parts were aligned with iterative closest point alignment (MATLAB; MathWorks) and the model was optimized using a particle correspondence algorithm (Shapeworks; University of Utah) with applied Procrustes algorithm to remove the impact of size variation.18,31,44,45 Following model optimization, the SSM was analyzed with principal components analysis to identify modes of morphology variation that explain portions of the population variance. Each mode of variation demonstrates 1 component of morphologic variation, and the shape of each individual limb is given by the shape score, with the mean shape receiving a shape score of zero and positive and negative values representing morphology variation from the mean in opposite directions. Shape scores were normalized to the SD of each mode for reporting.
Statistical Analysis
Differences between limbs were tested for all 2D measures and for shape scores along principal components analysis modes that explained greater than 5% of population variance. Because asymmetry does not necessarily require more or less deformity on the left or right limb, absolute differences between each pair of limbs were calculated. Absolute differences cannot be assumed to be parametric, so these absolute differences were tested against a null hypothesis of zero with a Wilcoxon rank sum test with Bonferroni correction. To examine any potential laterality-dependent asymmetry, differences between left and right limbs were compared. This consisted of a Shapiro-Wilk test of normality followed by either a paired t test or Wilcoxon signed rank test with Holm-Sidak correction. All tests used a significance level α = 0.05, and Cohen d effect size was calculated for each comparison.
Results
Radiographic Measures
For all 9 of the calculated radiographic measures, there was a significant absolute difference between sides with a large effect size (Table 2). With the sample size of these data, no significant laterality-dependent differences could be detected in any of the 9 calculated measures (Supplemental Table A-1). The degree of difference between limbs varied greatly between measures. Sagittal talocalcaneal angle, calcaneal inclination angle, tibiocalcaneal angle, and calcaneal–first metatarsal angle, demonstrated median percentage differences less than 10% between limbs. Axial talocalcaneal angle, sagittal plane Meary angle, talar tilt angle, and hindfoot alignment angle all showed median percentage differences between limbs between 17% and 37%, and axial plane Meary angle demonstrated a median 55% difference between limbs, equating to a median 5.8° difference between paired limbs. Median absolute differences between limbs were less than 5° for all other measures.
Radiographic Measures, Absolute Paired-Limb Differences, Median Percentage Differences, and Statistical Comparisons Between Paired Limbs.
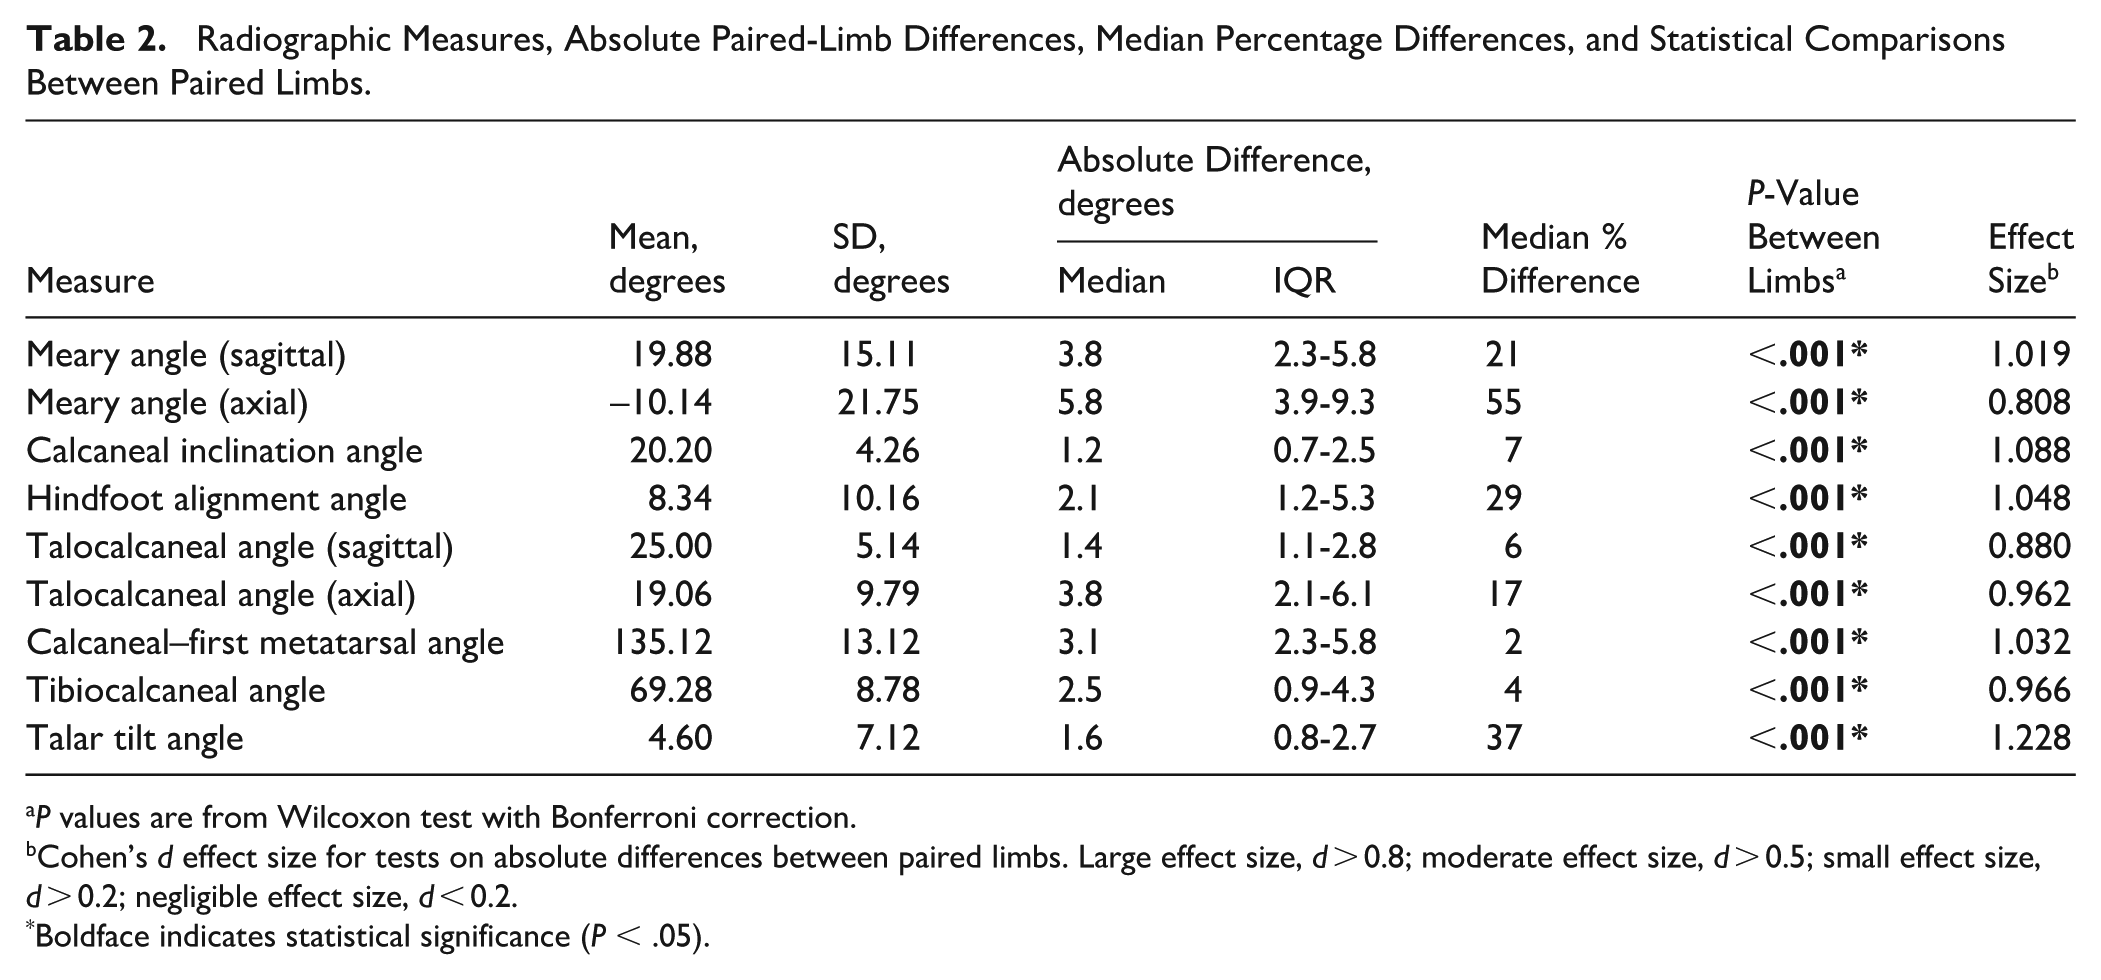
P values are from Wilcoxon test with Bonferroni correction.
Cohen’s d effect size for tests on absolute differences between paired limbs. Large effect size, d > 0.8; moderate effect size, d > 0.5; small effect size, d > 0.2; negligible effect size, d < 0.2.
Boldface indicates statistical significance (P < .05).
Statistical Shape Modeling
Statistical shape modeling revealed three modes of variation that represented greater than 5% of population variance (Table 3). For improved visualization of differences along these modes, the limbs were grouped as positive (CMT+) or negative (CMT–), where the CMT+ group was the limb from each pair with the higher shape score along that respective mode. This allows for the black lines connecting paired limbs to demonstrate the absolute difference between the left and right foot. The first mode of variation (Figure 1) illustrated a variation in overall cavovarus position of the foot. There was a significant absolute difference between limbs along this mode (p < 0.001), with a median normalized shape score difference of 0.2, median percentage difference between limbs of 36%, and a moderate effect size. The second mode of variation (Figure 2) demonstrated a spectrum of arch height and showed a significant absolute difference between limbs (P < .001) with a median normalized shape score difference of 0.14, median percentage difference between limbs of 18%, and a large effect size. The third mode of variation (Figure 3) illustrated variation in hindfoot varus rotation and demonstrated a significant absolute difference between limbs (P < .001) with a median normalized shape score difference of 0.24, median percentage difference between limbs of 47%, and a moderate effect size. With this sample size, no significant laterality-dependent differences could be identified along any of these modes (Supplemental Table A-2).
Explained Variance for SSM Modes Explaining Greater Than 5% of Population Variance, Absolute Paired-Limb Differences in Normalized Shape Scores, and Median Percentage Difference Between Paired Limbs.

Abbreviations: PCA, principal components analysis; SSM, statistical shape model.
P values are from Wilcoxon test with Bonferroni correction.
Cohen’s d effect size for tests on absolute differences between paired limbs. Large effect size, d > 0.8; moderate effect size, d > 0.5; small effect size, d > 0.2; negligible effect size, d < 0.2.
Boldface indicates statistical significance (P < .05).
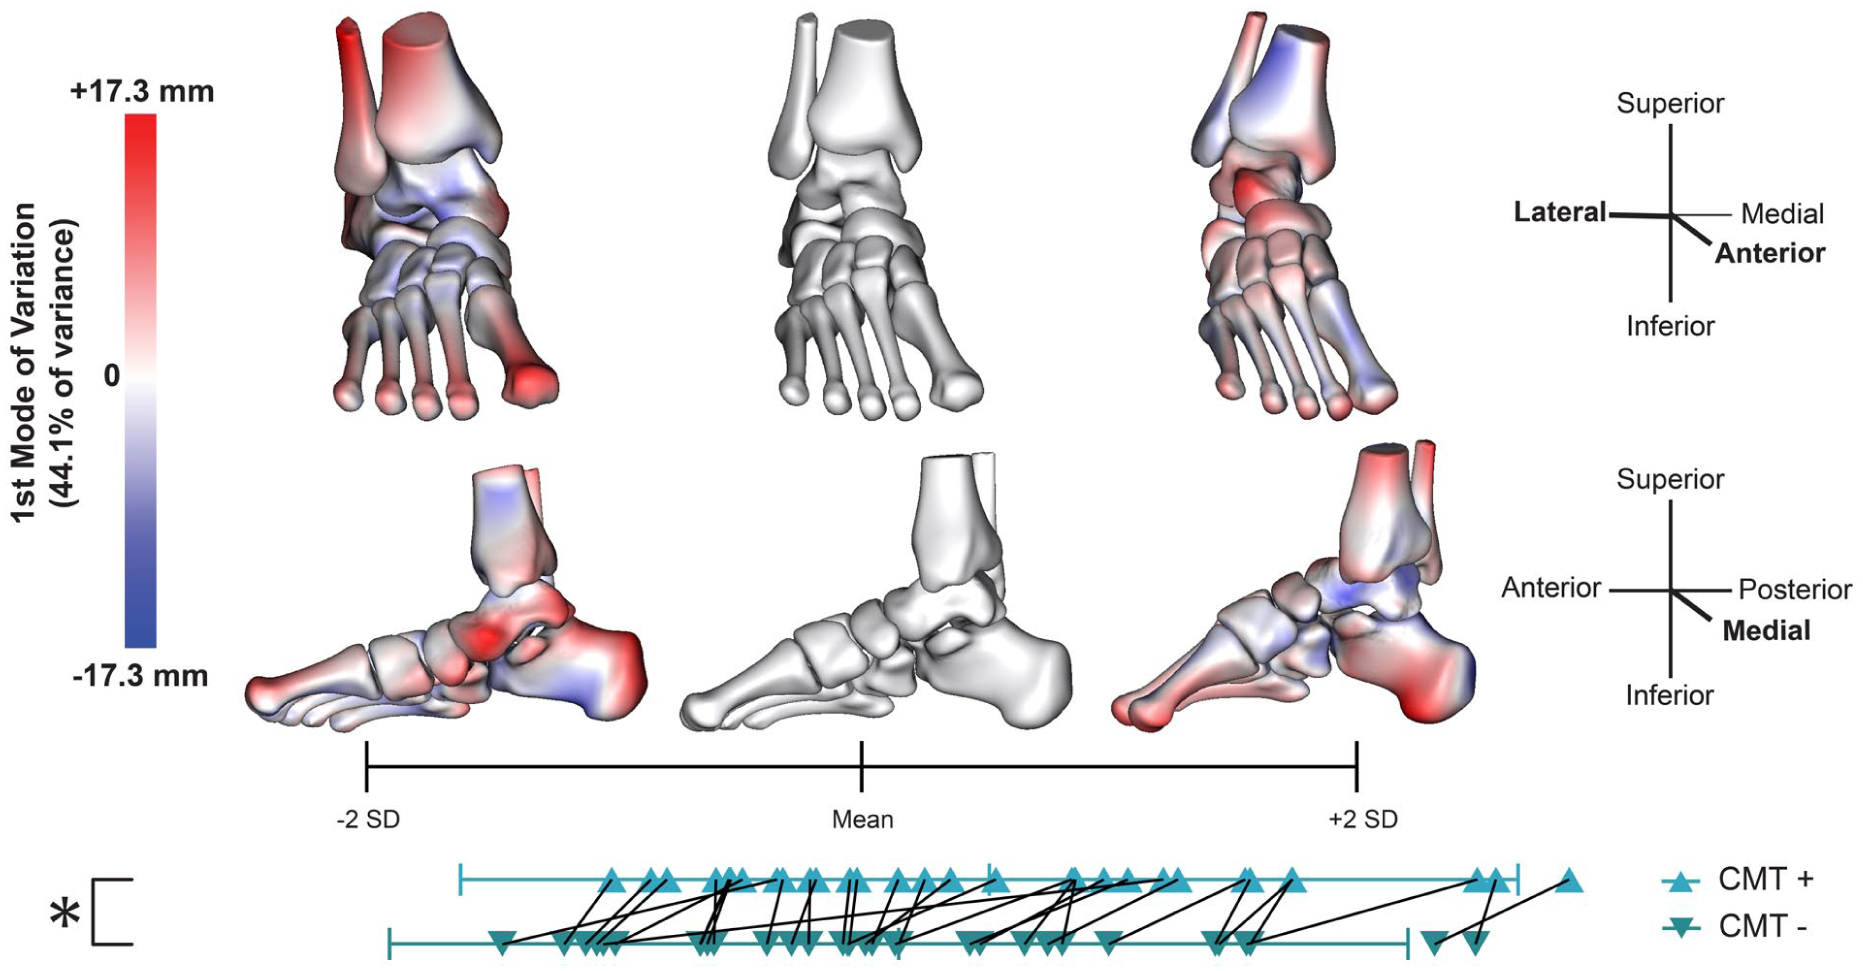
The first mode of variation for the statistical shape model demonstrating a spectrum of more planovalgus (–2 SD shape) to more cavovarus (+2 SD shape) foot positioning. Mean and SD reference the combined population of CMT limbs being studied and controls used to accurately reflect the spectrum of foot deformity. Red represents a positive distance difference from the mean shape and blue represents a negative distance difference from the mean shape, with saturation demonstrating the magnitude of distance difference between the shape and the mean shape. The triangles below represent each limb, with the limb from each pair with the higher shape score identified as CMT+ and the one with the lower shape score as CMT–, so that the black lines demonstrate the absolute difference between paired limbs.
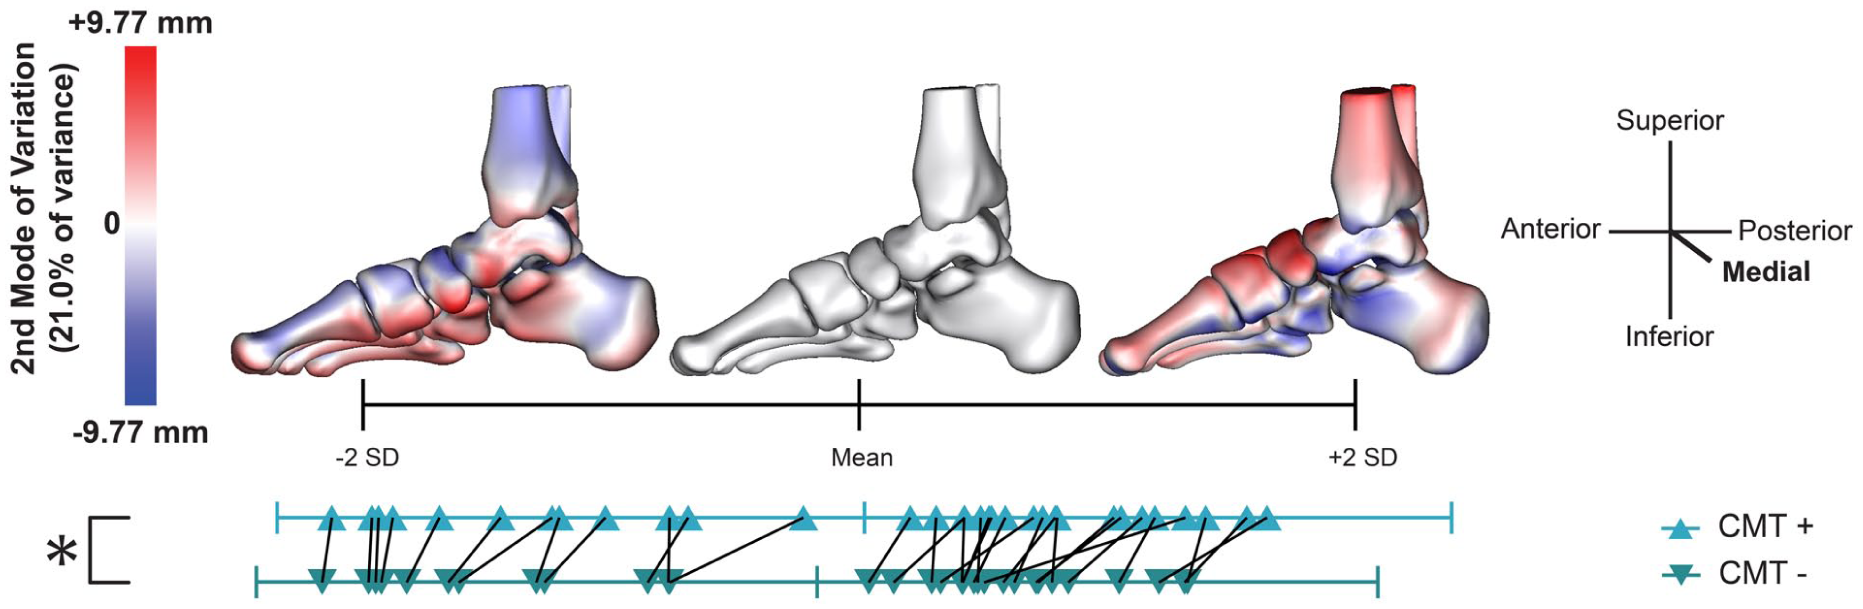
The second mode of variation for the statistical shape model demonstrating a spectrum of lower arch height (–2 SD shape) to higher arch height (+2 SD shape). Red represents a positive distance difference from the mean shape and blue represents a negative distance difference from the mean shape, with saturation demonstrating the magnitude of distance difference between the shape and the mean shape. The triangles below represent each limb, with the limb from each pair with the higher shape score identified as CMT+ and the one with the lower shape score as CMT–, so that the black lines demonstrate the absolute difference between paired limbs.

The third mode of variation for the statistical shape model demonstrating a spectrum from a more neutral hindfoot (–2 SD shape) to a more varus hindfoot (+2 SD shape). Red represents a positive distance difference from the mean shape and blue represents a negative distance difference from the mean shape, with saturation demonstrating the magnitude of distance difference between the shape and the mean shape. The triangles below represent each limb, with the limb from each pair with the higher shape score identified as CMT+ and the one with the lower shape score as CMT–, so that the black lines demonstrate the absolute difference between paired limbs.
Discussion
CMT presents with substantial heterogeneity in foot deformity, both across individuals and throughout the disease course. Prior studies have characterized this variability but have largely overlooked potential differences in deformity between limbs within the same individual. As current surgical algorithms emphasize tailoring interventions to the specific anatomic features of each limb, understanding the degree of symmetry or asymmetry in deformity expression may provide valuable insights for optimizing functional assessment scales, patient education, surgical planning, and outcome expectations.
Both 2D and 3D methods of image analysis identified absolute differences in morphometric data between limbs, indicating that there is a degree of asymmetry between contralateral limbs in individuals with CMT. However, none of the observed differences were specific to the left or right limb, and the measured differences were all small in relationship to the variability within the cohort. Radiographic measures demonstrated significant differences in hindfoot alignment, arch height, midfoot rotation, and forefoot alignment. The numeric difference between limbs varied between measures, ranging from a median 1.2° difference in calcaneal inclination angle to a median 5.8° difference in axial Meary angle, but broadly demonstrated small magnitude differences between 1° and 4°. Generally, the largest magnitude differences were observed in midfoot measurements used to evaluate cavovarus or planovalgus alignment, including axial and sagittal Meary angles and axial talocalcaneal angle. The smallest percentage differences between limbs were primarily in measures of arch height and plantarflexion, consisting of calcaneal inclination angle, calcaneal–first metatarsal angle, and tibiocalcaneal angle. Although the median differences had a small magnitude, there were between 1 and 3 outliers with greater differences between limbs along each radiographic measure, with 3 individuals demonstrating unexpectedly high differences in measurements between limbs in 3 or more measurements. These included >15° differences in sagittal plane Meary angle and >12° differences in axial talocalcaneal angle and calcaneal–first metatarsal angle. These findings are supported by the SSM analysis, which demonstrated differences in overall cavovarus alignment, isolated arch height, and isolated hindfoot varus rotation between contralateral limbs. The highest percentage difference in shape score between limbs was along the third mode of variation, demonstrating a spectrum of minimal to severe hindfoot varus. The smallest percentage difference was along the second mode of variation, which showed arch height variation. There were between 1 and 4 outliers along each mode of variation, with 1 individual demonstrating greater than expected differences between limbs along all 3 modes. Together, these results indicate differences in CMT-related cavovarus deformity between contralateral limbs prior to any surgical intervention with greater variation between limbs in the varus, rather than cavus, component of the deformity. The magnitude of variation between limbs is generally small, but there are some outliers identified through both analyses that demonstrate much larger than expected differences between limbs.
Analysis of limb symmetry is limited by the lack of data on symmetry or asymmetry in healthy control limbs, so it is unknown if these results demonstrate greater or less interlimb difference than would be expected in a non-CMT population. Larger population quantification of expected differences in morphologic parameters between contralateral limbs would be beneficial to understand how CMT and other diseases impact symmetry of the foot and ankle. These findings and clinical applicability of this study are limited by the accessibility of WBCT. The participants in this study included individuals who were seen at one of 2 large academic medical centers, which may represent a more severe subset of CMT cases than the general population. Direct application of this analysis may not be possible in settings without this advanced imaging, but similar studies using plain radiographs could examine symmetry through a more widely accessible imaging technology and the radiographic measures analyzed here provide some reference for comparison between WBCT- and radiography-based analyses.
Although sample sizes remain inherently limited because of the rarity of the disease, our cohort is comparatively large relative to previously published studies. Many of the WBCT images were collected for clinical use, which predominantly come from individuals seeing foot and ankle surgeons and may represent a cohort of individuals with more severe foot symptoms than the average population with CMT. Similarly, individuals with prior foot surgery or fracture were excluded from this analysis, which may select against the most severe cases. Images collected in ongoing prospective studies similarly represent a subset of the population with CMT, as the pediatric study is inherently limited to individuals with symptom onset and diagnosis in childhood, and the study analyzing ankle-foot orthoses only includes individuals with substantial enough foot symptoms to be using bilateral orthoses. Although the use of this heterogeneous data set was necessary to achieve sufficient statistical power in a rare disease, the findings may not be broadly generalizable to all individuals with CMT, particularly those with milder foot and ankle involvement. However, the cohort evaluated reflects the subset of patients most likely to require intervention, underscoring the clinical relevance of their assessment.
These data represent quantification of the clinically suspected difference in cavovarus deformity between limbs, supporting previous surgical algorithms that treatment customization based on imaging and clinical features of the limb.1-6 This suggests that functional assessment scales, which typically analyze only the dominant limb, should consider asymmetry in disease presentation. Given the increased variability in varus rotation, rather than arch height, these results suggest that a thorough clinical evaluation of hindfoot alignment is especially important in understanding subtle differences in disease presentation between limbs. This emphasizes the need for high-quality, reliable, and accessible radiographic measures of hindfoot alignment in all 3 anatomic planes. Further, surgical management is affected by the flexibility or rigidity of the hindfoot deformity, and further research to quantify that flexibility, rather than a binary classification, and to understand differences in hindfoot flexibility between contralateral limbs may be beneficial for surgical planning. In the context of conservative management, these findings further support limb-specific customization of stretching and strengthening rehabilitation programs, as well as individualized bracing or orthotic use, because symmetry between limbs cannot be assumed. Together, these observations highlight the importance of individualized, limb-specific approaches across both surgical and non-surgical management of CMT-related cavovarus deformity.
Beyond the impact that this observed asymmetry between limbs has on treatment planning, it is further useful in effective patient education. Both the broad understanding of asymmetry in foot morphology and use of imaging or clinical evaluation to determine asymmetry between limbs in an individual patient may help set realistic expectations. The observed asymmetry in this study suggests that there may need to be a different surgical approach or rehabilitation strategy for each limb and that recovery time and process may differ substantially between limbs. Similarly, the progression of both symptoms and deformity may be asymmetric, and further research is needed to identify specific markers to predict this progression and quantify symmetry or asymmetry in the rate of disease progression in contralateral limbs. The mechanism underlying this asymmetry requires further investigation but may reflect, at a broad level, delayed disease progression in one limb or, at a finer scale, differences in the relative involvement of agonist vs antagonist muscles between limbs.
Existing morphology analyses of CMT have predominantly used a combination of unilateral and bilateral data because of the rarity of the disease and need for larger sample sizes for adequate analysis. These studies are limited by the inherent dependence and assumption of similarity between contralateral limbs. This finding of asymmetry between limbs supports the use of bilateral data for studies of this rare disease. However, statistical analyses should still consider the lack of independence between samples when bilateral data are treated as separate samples, as the assumption of normality cannot be attained. The primary validated clinical tools for evaluation of CMT either use data only from the dominant hand and foot or combine the presence of symptoms in either limb without differentiating between sides, citing a lack of difference in measurements between the left and right limbs and asymmetry being present in function in only a subset of the population with CMT.26,28,46,47 Although these validated measures provide a thorough measure of overall function, researchers interested specifically in the foot and ankle may want to consider performing tests and recording data bilaterally to account for the difference between limbs.
Previous research on CMT-related foot morphology has demonstrated differences in morphology between subtypes, but this study did not analyze differences in symmetry between subtypes due to the sample size.16-18 The existing analyses of radiographic measures for CMT cavovarus deformity present highly variable ranges for both normative and CMT data, which makes it challenging to interpret some radiographic measures in the context of disease severity.3,14,19-25,39-43 However, the differences between limbs observed in this study remain true regardless of the severity of this population relative to previously published analyses of the disease. Although this study used standard statistical tests with a stringent Bonferroni correction, statistical tools for evaluating absolute differences between groups are limited and inconsistent. Although statistically significant, the differences between limbs in both radiographic measures and shape scores were all less than 1 SD, with all but 1 measure having a mean difference of less than half a SD. There is no existing standard of minimum clinically important difference for either the established radiographic measures or percentage difference in shape scores. Thus, it is challenging to conclude if all the observed statistical differences between limbs are representative of clinically significant differences. Active research toward population-covering statistical shape models in the foot and ankle and large meta-analyses of radiographic measurements may allow for better evaluation of clinically meaningful asymmetry between limbs beyond this statistical analysis.
Overall, the results of both 2D and 3D WBCT image analysis provide quantitative evidence of the clinically suspected asymmetry in CMT-related cavovarus foot deformity. Greater contralateral differences were observed in hindfoot varus rotation than in arch height. These data support the customization of treatment planning based on the morphology of the individual limb and further suggest that this asymmetry in deformity be considered in research and patient education to better understand the orthopaedic complications of CMT.
Supplemental Material
sj-pdf-1-fao-10.1177_24730114261454986 – Supplemental material for Asymmetric Cavovarus Deformity Presentation in Charcot-Marie-Tooth Disease
Supplemental material, sj-pdf-1-fao-10.1177_24730114261454986 for Asymmetric Cavovarus Deformity Presentation in Charcot-Marie-Tooth Disease by Melissa R. Requist, Andrew C. Peterson, Bopha Chrea and Amy L. Lenz in Foot & Ankle Orthopaedics
Footnotes
Supplement A: Statistical Tests Comparing Left and Right Limbs
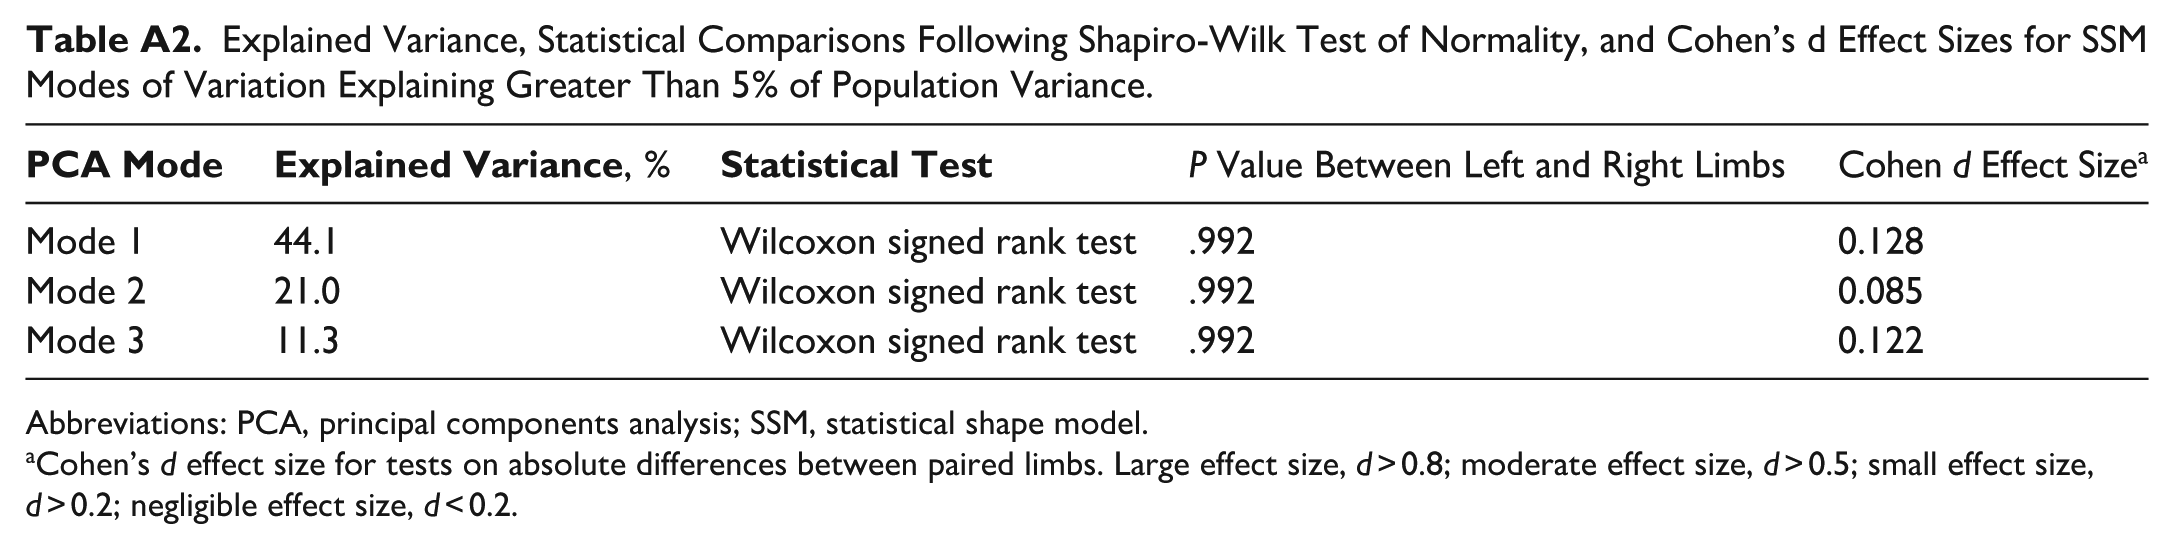
Explained Variance, Statistical Comparisons Following Shapiro-Wilk Test of Normality, and Cohen’s d Effect Sizes for SSM Modes of Variation Explaining Greater Than 5% of Population Variance.
|
|
|
P Value Between Left and Right Limbs | Cohen d Effect Size a | |
|---|---|---|---|---|
| Mode 1 | 44.1 | Wilcoxon signed rank test | .992 | 0.128 |
| Mode 2 | 21.0 | Wilcoxon signed rank test | .992 | 0.085 |
| Mode 3 | 11.3 | Wilcoxon signed rank test | .992 | 0.122 |
Abbreviations: PCA, principal components analysis; SSM, statistical shape model.
Cohen’s d effect size for tests on absolute differences between paired limbs. Large effect size, d > 0.8; moderate effect size, d > 0.5; small effect size, d > 0.2; negligible effect size, d < 0.2.
Ethical Considerations
This use of data for this study was approved by the institutional review board of both institutions (FWA00003745 and FWA00003007). An opt-out statement regarding the application of medical data was published on our institute’s website. This study was performed under the principles of the World Medical Association Declarations of Helsinki.
Funding
The authors disclosed receipt of the following financial support for the research, authorship, and/or publication of this article: Funding provided by the University of Utah VPR Seed Grant, University of Utah Pediatric Orthopaedics Foundation Grant, National Institutes of Health (NIAMS - K01AR080221, NICHD – F30HD118749), and the Inherited Neuropathies Consortium. Additionally, the National Institutes of Health supported ShapeWorks development grants (NIH U224EB029011 and NIH R01AR076120).
Declaration of Conflicting Interests
The authors declared no potential conflicts of interest with respect to the research, authorship, and/or publication of this article. Disclosure forms for all authors are available online.
References
Supplementary Material
Please find the following supplemental material available below.
For Open Access articles published under a Creative Commons License, all supplemental material carries the same license as the article it is associated with.
For non-Open Access articles published, all supplemental material carries a non-exclusive license, and permission requests for re-use of supplemental material or any part of supplemental material shall be sent directly to the copyright owner as specified in the copyright notice associated with the article.