
Abstract
Introduction
Metastasis from uveal melanoma, the most common primary ocular malignancy in adults, 1 occurs in 25% of patients 5 years after treatment, most often with hepatic involvement. 2 Available therapies for treating metastasis are still limited. 3 Although the rates of melanoma-associated mortality vary depending on patient risk factors, more than 50% of patients with high-risk clinical characteristics may die from metastatic melanoma. 4
With the introduction of gene expression profiling from fine-needle aspiration biopsies (FNABs), more precise risk prediction is now possible.5 –7 A validated commercially available assay (DecisionDx-UM, Castle Biosciences) that classifies metastatic risk as low (class 1A), intermediate (class 1B), or high (class 2) based on the expression of 15 genes has been shown to accurately predict metastasis of uveal melanoma within 5 years of diagnosis of the primary tumor. 7 This assay is now widely used in clinical practice to tailor the management of uveal melanoma, in particular with respect to surveillance testing. Accurate metastatic risk prediction is essential to identify patients who may benefit from early intervention or entry into clinical trials of adjuvant therapies.
Despite the robustness of molecular prognostication, refinement of gene expression profiling classification continues as additional data are collected and longer follow-up is available.8,9 The identification of preferentially expressed antigen in melanoma as a molecular marker of metastatic risk has led to enhanced risk prediction. 10 The relationship of this marker to gene expression profiling class and other clinical risk factors is currently being investigated.10,11 In addition, several studies have evaluated the prognostic value of clinical risk factors, such as tumor size and the American Joint Committee on Cancer classification, independent of gene expression profiling and have found that measures of tumor size continue to have prognostic importance.12 –16 In these studies, gene expression profiling has been shown to be the strongest predictor of metastatic uveal melanoma.
It is unknown whether confirmation of tumor cells by cytopathology in a concurrent aspirate influences the predictive value of gene expression profiling. Access to cytopathologists with appropriate expertise in evaluating the scant specimens from these ocular tumors is not always available, and the limited cellularity of some of these aspirates may make it difficult to confirm a diagnosis. Therefore, concurrent cytopathology is not always performed when a sample is obtained for gene expression profiling.
The purpose of this study was to determine whether the prognostic accuracy of gene expression profiling was comparable in patients with uveal melanoma who had gene expression profiling results with concurrent confirmatory cytopathology and those who had gene expression profiling without cytologic confirmation of uveal melanoma. We hypothesized that those samples with nondiagnostic or no cytology might lack a significant proportion of uveal melanoma cells; therefore, the gene expression profiling results presumably would reflect RNA expression from other cells in the tumor microenvironment. We were interested in determining whether, in this case, the gene expression profiling results could be less predictive of the metastatic risk. To evaluate this, we compared the rates of metastasis in these 2 groups overall as well as by the gene expression profiling class.
Methods
A retrospective analysis was performed of patients diagnosed with uveal melanoma at the Ocular Melanoma Center, Massachusetts Eye and Ear, who had an FNAB before proton therapy with successful gene expression profiling between September 2012 and December 2020. Patients were included in the study if they had completed at least 6 months of follow-up after receiving proton therapy. This study was approved by the Mass General Brigham Institutional Review Board under Protocol 2019P000606, Epidemiologic Studies of Uveal Melanoma, and Protocol 2019P000285, the Uveal Melanoma Repository; informed consent was obtained or waived before data collection and analysis.
All patients diagnosed with uveal melanoma and treated at the Ocular Melanoma Center who had gene expression profiling were identified. It was then determined whether a fine-needle aspirate was sent for cytopathology for these individuals. Based on their cytopathology status, patients were assigned to 1 of 2 groups as follows: those with gene expression profiling and cytopathology results confirming or suspicious for uveal melanoma (gene expression profiling+cytopathology group) and those who had gene expression profiling with nondiagnostic cytopathology results or no sample sent for cytopathology (gene expression profiling only group). The rates of metastasis overall and by gene expression profiling in the 2 groups were compared to determine whether cytopathology status (positively diagnostic for uveal melanoma or not) affected the prognostic accuracy of gene expression profiling to predict the metastatic risk. The specific cytopathologic features of melanoma cells were not included in the analysis because this information was not consistently reported.
In most cases, 2 fine-needle aspirates were collected at the time of tumor localization surgery. Depending on the characteristics and location of the tumor, either a transscleral or transvitreal route was used with a 25-gauge or 27-gauge needle. One specimen was prepared for gene expression profiling, and the other was smeared on a slide for cytopathologic review. Biopsies were performed by 2 surgeons, with most (84.4%) performed by a single surgeon. Similar techniques of manual aspiration through a syringe connected to a 27-gauge needle were used by both surgeons. The preparation of samples for gene expression profiling and cytopathology was also consistent between surgeons. The DecisionDx-UM test was used for gene expression profiling.
Statistical analysis was performed using Stata software (release 17, StataCorp LLC). For differences between groups, the Fisher exact test was used for categorical variables and the Wilcoxon rank sum test or Kruskal-Wallis test for continuous variables. Rates of metastasis were calculated using the Kaplan-Meier method. Statistical significance was set at P < .05.
Results
Of 556 patients who had localization surgery during the study period, 147 (26.4%) elected to undergo an FNAB and 141 (95.9%) had gene expression profiling. Ninety-eight patients (69.5%) with gene expression profiling results had cytopathology results that confirmed the presence of melanoma cells (78 with reports confirming the diagnosis of uveal melanoma and 20 with reports stating “suspicious for” or “consistent with” uveal melanoma). Forty-three patients (30.5%) did not have confirmatory cytopathology. For 39 of these 43 patients, the cytology sample was insufficient for diagnosis, and in the remaining 4 patients a cytology sample was not obtained (Table 1). There were no instances of cytology supporting a diagnosis other than uveal melanoma. Most specimens classified as nondiagnostic were noted to have scant cellularity or insufficient material for diagnosis.
Patient and Tumor Characteristics by Gene Expression Profiling Class and Cytopathology Status.

Abbreviation: LBD, largest basal diameter.
Wilcoxon rank sum test was used for all unless otherwise noted.
Fisher exact test.
Patients in the gene expression profiling+cytopathology group were older at diagnosis (median age, 62.8 years; range, 19.3-85.3) than those in the gene expression profiling only group (median age, 55.3 years; range, 34.0-82.0) (P = .03). The median follow-up was similar at 3.4 years (range, 0.72-9.4) in the gene expression profiling+cytopathology group and 4.4 years (range, 0.72-8.6) in the gene expression profiling only group (P = .07).
Patients in the gene expression profiling+cytopathology group presented with thicker tumors (median, 5.0 mm; range, 1.5-12.7) than patients in the gene expression profiling only group (median, 3.1 mm; range, 1.7-11.7) (P = .0003), although the largest basal diameter was comparable (median, 14.0 mm; range, 6.0-20.0 vs median, 14.0 mm; range, 8.0-23.0) (P = .84). The distribution of gene expression profiling class in the gene expression profiling+cytopathology group and the gene expression profiling only group, respectively, was as follows: class 1A, 38 (38.8%) vs 20 (46.5%); class 1B, 20 (20.4%) vs 15 (34.9%); class 2, 40 (40.8%) vs 8 (18.6%) (P = .02). Within each class, confirmatory cytopathology was obtained in more than 50% of patients. Patients with class 2 tumors had the highest rate of confirmatory results (83.3% vs 65.5% and 57.1% for class 1A and class 1B tumors, respectively (P for trend = .07) (Figure 1).

Percentage of patients within each gene expression profiling class with and without confirmatory cytopathology.
The median tumor thickness increased as the risk for metastasis increased, as defined by the gene expression profiling class: class 1A (median, 4.0 mm; range, 1.7-11.0); class 1B (median, 4.7 mm; range, 1.5-12.7); class 2 (median, 4.9 mm; range, 1.8-12.5) (P = .25). The differences in tumor thickness between patients who had cytopathology results and those who did not were most pronounced in patients with class 1A tumors (ie, the median tumor thickness was 2.4 mm in the gene expression profiling only group and 5.3 mm in the gene expression profiling+cytopathology group) (P < .0001). Nonsignificant differences in tumor thickness were found between the 2 groups in patients with class 1B tumors and class 2 tumors (Table 1).
Twenty-five patients (25.5%) in the gene expression profiling+cytopathology group developed metastasis vs 9 patients (20.9%) in the gene expression profiling only group (P = .67). Table 2 shows the development of metastasis by confirmatory cytopathology status. There were no statistically significant differences between groups in the percentage of patients who were diagnosed with metastasis or in the median months from the initial treatment to metastasis diagnosis by gene expression profiling class.
Development of Metastasis by Confirmatory Cytopathology Status.

Fisher exact test.
Wilcoxon rank sum test.
One patient.
Within each gene expression profiling class, the rates of metastasis were independent of cytopathology status. Combining patients with class 1A and class 1B tumors, the 5-year rates of metastasis-free survival were essentially identical (gene expression profiling only group: 88.7% [95% CI, 68.1-96.4]; gene expression profiling+cytopathology group: 88.5% [95% CI, 73.9-95.2]) (P = .86, log-rank test) (Figure 2A). There was no significant difference in the 5-year rates of metastasis-free survival in patients with class 2 tumors (gene expression profiling only group: 37.5% [95% CI, 8.7-67.4]; gene expression profiling+cytopathology group: 50.3% [95% CI, 29.9-67.5]) (P = .50, log-rank test) (Figure 2B).
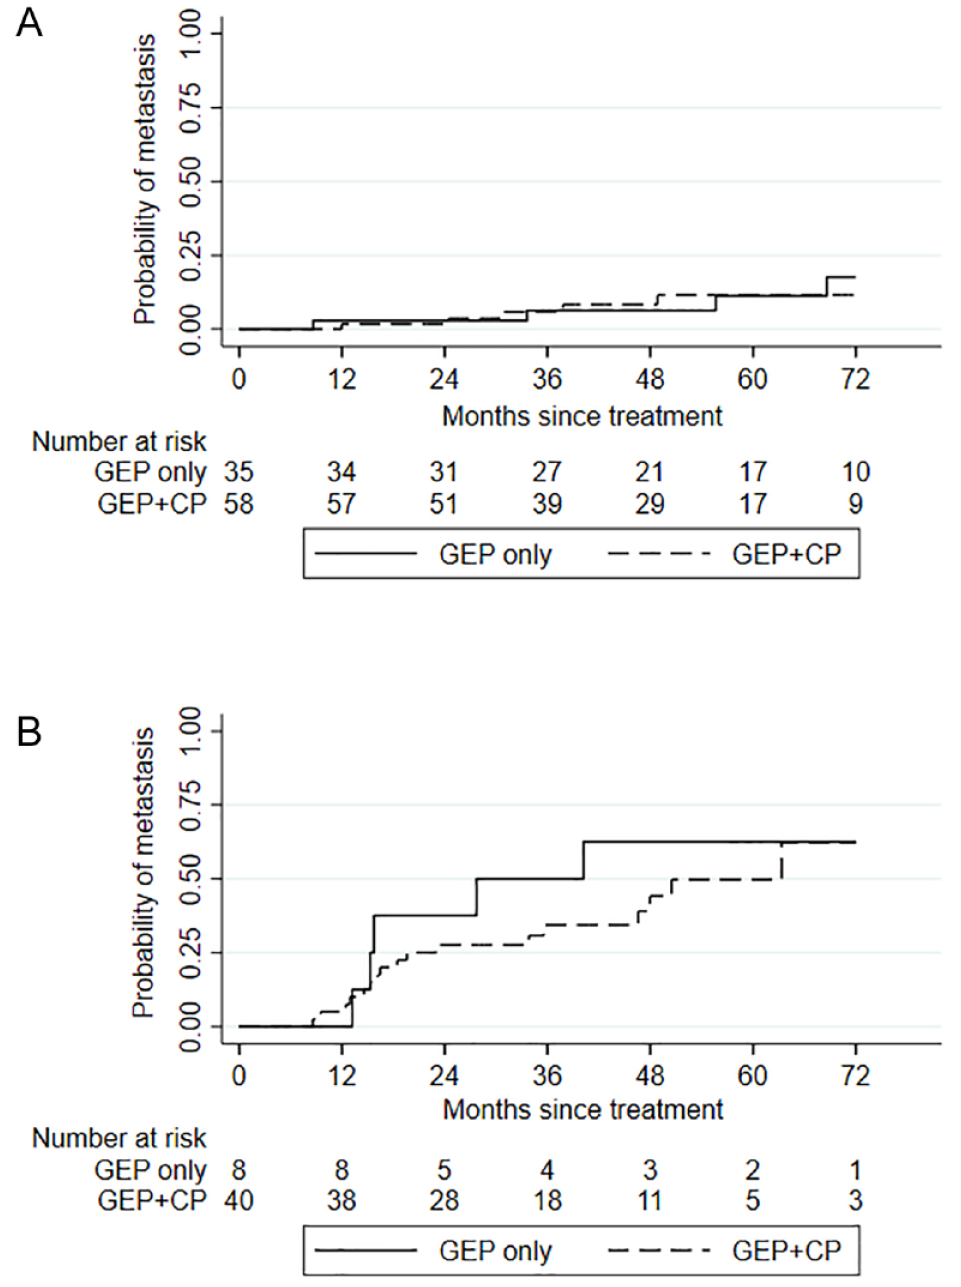
Kaplan-Meier estimates of probability of metastasis by cytopathology status. (A) Patients with class 1 tumors. (B) Patients with class 2 tumors.
Conclusions
The risk for metastasis from uveal melanoma is predicated on a number of characteristics intrinsic to the primary tumor. To date, gene expression profiling tumor classification has been shown to be the best predictor of risk. 7 However, discordant results have been reported in patients who have had 2 fine-needle aspirates. 17 In addition, gene expression profiling results have been obtained from nonmelanoma tumors. 18 In the current study, we sought to determine whether the prognostic accuracy of gene expression profiling could be affected by the lack of corresponding cytopathology. We compared the rates of metastasis in patients who had both gene expression profiling and confirmatory cytopathology with those who had gene expression profiling only.
We did not find significant differences in the proportion of patients with metastasis or the rates of metastasis-free survival between those with confirmatory cytopathology and those without confirmatory cytopathology, both overall and within any of the gene expression profiling classes. In addition, the time to the development of metastasis after the initial diagnosis was similar in patients with and patients without confirmatory cytopathology. However, a limitation of the study was the small sample. The study was underpowered to determine the cumulative rates of metastasis and the associations between tumor size, gene expression profiling classification, and metastasis. Thus, these results must be interpreted with caution. Because of the lack of power, the absence of differences in the rates of metastasis between patients with and patients without confirmatory cytopathology, in particular within each gene expression profiling class, may not be definitive. Nevertheless, our findings support the validity of the gene expression profiling assay even in the absence of corresponding cytopathology.
The accuracy of gene expression profiling may be especially important for smaller tumors because obtaining an adequate sample for cytopathologic testing can be difficult. Nondiagnostic cytopathology results were common in our cohort as a result of insufficient cellular material and were also associated with smaller tumors. A statistically significant difference in the median tumor thickness between the gene expression profiling only group and the gene expression profiling+cytopathology group (3.1 mm vs 5.0 mm; P = .0003) was identified at our site. There was the suggestion of a possible relationship between gene expression profiling class and cytopathology status (P for trend = .07), with fewer patients having confirmatory cytopathology in the class 1A and class 1B groups, which had smaller tumors overall.
Similarly, a study by Correa and Augsburger 19 of 159 patients with posterior uveal melanoma who had an FNAB and were evaluated for cytopathology and gene expression profiling class found that 21% (34/159) of aspirates were adequate for gene expression profiling classification but not for cytopathologic review because of a low cellular yield. Overall, patients in this study were similar to our cohort with respect to the distribution of gene expression profiling class (approximately 30% of patients had class 2 tumors in both cohorts) but had somewhat thicker tumors than the patients in our study (median, 5.4 mm vs 4.5 mm). Thinner tumors have been associated with a lower cellular yield on FNAB20,21 and therefore nondiagnostic cytology.
A more recent study of 58 patients with small tumors (ie, less than 2.5 mm thick) who had a multipass FNAB during a procedure that included microincision pars plana vitrectomy followed by endolaser tumor ablation reported successful gene expression profiling classification in 56 patients (96.6%), similar to the 95.9% success rate found in our study. Cytology was not performed in that series; however, the report confirms the performance and utility of gene expression profiling in smaller tumors. 22
There are additional limitations of our study. Combining patients whose samples were collected for cytopathology but were nondiagnostic and patients who did not have a second aspirate performed may have introduced bias or misclassification. It is unlikely that this occurred, however, because only 4 patients (9%) in the gene expression profiling only group had no cytology specimen collected. It was specifically noted that in 2 of these cases, the second aspirate was not obtained because of the small tumor size.
Furthermore, given that we obtained 2 separate aspirates for gene expression profiling and for cytology, we are making the assumption that the cellular composition of the aspirates is similar in cases with gene expression profiling results and confirmatory cytopathology but potentially dissimilar in cases in which there was a gene expression profiling result but cytopathology was nondiagnostic. One method of confirming the presence of melanoma cells in the gene expression profiling sample is concurrent sequencing for commonly occurring mutations in uveal melanoma. Most patients in our study were evaluated before preferentially expressed antigen in melanoma and next-generation sequencing for relevant somatic mutations were added to the commercially available panel of assays that use a single fine-needle aspirate. Next-generation sequencing was not completed for our entire cohort, making it impossible to correlate next-generation sequencing data with the rates of diagnostic cytopathology.
It is also important to state that this analysis does not support the use of gene expression profiling alone for diagnostic purposes. As mentioned previously, gene expression profiling classification results have been reported from nonmelanoma tumors. 18 Therefore, a DecisionDx-UM result does not confirm a tumor of melanocytic origin. However, the addition of next-generation sequencing to the analysis of the same specimen can provide this confirmation. With regard to indeterminate melanocytic lesions, current prognostic information regarding class 1A lesions is based on follow-up after definitive treatment of the primary tumor. There are limited data regarding the natural history of untreated class 1A lesions. 23 The use of gene expression profiling alone to determine the primary management of ocular melanocytic lesions must still be considered investigational.
Footnotes
Ethical Approval
This study was conducted in accordance with the Declaration of Helsinki. The collection and evaluation of all protected patient health information were performed in a US Health Insurance Portability and Accountability Act–compliant manner. This study was approved by the Mass General Brigham Institutional Review Board under Protocol 2019P000606, Epidemiologic Studies of Uveal Melanoma, and Protocol 2019P000285, the Uveal Melanoma Repository.
Statement of Informed Consent
This was a retrospective chart review study, and informed consent was obtained or waived before data collection and analysis.
Declaration of Conflicting Interests
The authors declare the following potential conflicts of interest with respect to the research, authorship, and/or publication of this article: Dr. Gragoudas owns stock in Aura Biosciences. Dr. Kim receives research support from Allergan and is a consultant to Biophytis, Genentech, and Kodiak Sciences. None of the other authors declared potential conflicts of interest with respect to the research, authorship, and/or publication of the article.
Funding
This research received no specific grant from any funding agency in the public, commercial, or not-for-profit sectors.