
Abstract
Keywords
Introduction
Age-related macular degeneration (AMD) is a chronic, progressive disease of the macula that leads to central vision loss and substantial functional impairment. An estimated 1.49 million people in the United States live with advanced stages of the disease, and it is the primary cause of severe vision loss in individuals older than 65 years.1,2 Vision loss can impact an individual’s quality of life, independence, and mobility, and has been associated with increased risks of falls and injuries, as well as declines in mental health, cognition, social function, and employment.3,4 With an estimated 293 000 new cases of late-stage AMD occurring annually in the US, identifying populations most at risk of poorer outcomes may help alleviate the disease burden by informing targeted interventions, such as optimizing appointment intervals, initiating earlier treatment, and improving patient education. 5
Considerable evidence indicates that lower socioeconomic status (SES) is correlated with risk factors for development of eye disease, increased rates of eye disease, and blindness.6–11 For example, SES has been linked to delayed diagnosis of vision-threatening conditions such as glaucoma and amblyopia, resulting in greater visual morbidity.6,12–14 Prior work has shown that socioeconomic disadvantage is associated with fewer antivascular endothelial growth factor (anti-VEGF) injections and higher rates of missed appointment in patients with retinal conditions. 15 In addition, patients with neovascular AMD (nAMD) in the IRIS Registry had an 11.6% risk of being lost to follow-up at 12 months, with significantly higher odds of loss to follow-up among those with Medicaid insurance, those reporting Black race, or those reporting Hispanic ethnicity. 16 Utilization of eye care, measured by the number of outpatient visits and ancillary tests, is reported to be lower among populations in a low SES group at baseline, potentially attributable to barriers such as cost, limited access to specialists, and transportation challenges. However, this reduced baseline utilization may contribute to delayed disease detection and progression, ultimately leading to a greater need for visits and interventions over time. 14
Population-based studies indicate that lower SES may be associated with increased risk of AMD. The Beaver Dam Eye Study showed that lower education level and working in a service occupation increased the risk of early AMD. 17 Studies conducted using the UK Biobank found that patients with lower education or income and unemployment due to disability had increased risk of incident AMD.18,19 To date, there is a paucity of literature focusing on the relationship between SES and outcomes in nAMD. By specifically assessing nAMD, which requires treatment and timely, routine office visits for visual rehabilitation, we may gain more insight into the relationship between SES and AMD.
The Social Deprivation Index (SDI) is a composite measure that reflects neighborhood-level social drivers of health. 20 Seven demographic characteristics are incorporated into the metric: percent living in poverty; percent with less than 12 years of education; percent of single-parent households; percent living in rented housing units; percent living in an overcrowded housing unit; percent of households without a car; and percent of nonemployed adults under 65 years. The SDI has been utilized to assess disparities in healthcare access and outcomes across small geographic areas, predominantly by zip code. It helps identify locations of at-risk patients and accounts for more variability in health outcomes and healthcare inequity than poverty alone.20,21
The present study sought to assess whether SDI may serve as an objective measure of social determinants of health to stratify disease outcomes in nAMD. Screening measures for detecting individuals at greater risk for more adverse disease progression can be readily implemented in a retina practice, including routine fundus examinations, retinal imaging, and tailored patient counseling. The purpose of this study was to explore the disparities in disease severity at diagnosis of nAMD, as defined by the best-corrected visual acuity (BCVA) at the time of conversion to nAMD, as well as disparities in the presence of submacular hemorrhage at baseline and in treatment outcomes at 12 months among patients with nAMD, based on SES status defined by the SDI score.
Methods
Study Design
This was a retrospective cohort study conducted at the Retina Group of Washington. Electronic health records (EHR) between March 2016 and March 2023 were reviewed. Adult subjects with newly diagnosed unilateral nAMD who were being treated with intravitreal anti-VEGF therapy and followed up for at least 12 months were included. Patients were identified via medical records with an International Classification of Diseases, Tenth Revision (ICD-10) diagnosis code for bilateral dry AMD (ICD-10 code H35.3131-3) and a subsequent code for nAMD (ICD-10 code H35.3231-3), concurrent with a Current Procedural Terminology (CPT) procedure code for intravitreal injection (CPT code 67028).
Exclusion criteria included a history of intravitreal anti-VEGF therapy in either eye prior to referral for or diagnosis of nAMD, or other conditions unrelated to AMD that could potentially affect visual acuity, such as optic neuropathy, posterior uveitis, endophthalmitis, retinal detachment, open globe injury, amblyopia, macular hole, retinal vein occlusion, and retinal artery occlusion. Patients treated with other intravitreal medications, such as complement inhibitors or steroids, during the follow-up period were also excluded.
Data Collection
Data on patient demographics, comorbidities, clinical examination findings, and intravitreal anti-VEGF injections were collected. Presence of submacular hemorrhage and foveal geographic atrophy was determined based on clinical chart documentation, confirmed by either a funduscopic examination finding or optical coherence tomography (OCT) interpretation specifying a submacular location of the hemorrhage. Symptom duration prior to presentation was not consistently documented in our dataset, and we were therefore unable to evaluate whether patients with lower visual acuity or hemorrhage had symptoms for a longer period of time.
Patient zip codes were collected from the EHR. Patient-specific SDI scores were determined using publicly available American Community Survey 5-Year summary files from 2015 to 2019, with scores calculated according to Zip Code Tabulation Area, which is based on US Postal Service zip codes. A higher SDI score indicates greater socioeconomic deprivation. The main outcomes assessed were BCVA at presentation and at 12 months, as well as the number of anti-VEGF injections received in the first year of treatment.
Statistical Analysis
All analyses were conducted using JMP Pro 18 for Mac, version 18.1.0. The prespecified level of significance chosen for the study was a P value less than or equal to .05. Two-tailed analyses were used by default. Clinical data were compared using the Student t test for numerical variables and the chi-square test for categorical variables. Outcome measures included the proportion of patients with a BCVA (in logMAR) of ≥20/40 at baseline and at 12 months. Independent variables analyzed for associations included age at baseline, sex at birth, BCVA ≥20/40 at the time of conversion to nAMD, rate of submacular hemorrhage at baseline, laterality, mean number of anti-VEGF injections in 12 months, lens status, race, and SDI quantiles. Two SDI quantiles, low and high, were used in our analyses: the low SDI quantile was defined as SDI scores below the median value of 18, indicating less socioeconomic deprivation, while the high SDI quantile was defined as SDI scores equal to or higher than the median value of 18, indicating greater socioeconomic deprivation. This median-based cutoff was selected due to the skewed distribution of SDI values within our cohort, particularly the limited representation of patients in the highest deprivation ranges. Using the median for stratification ensured adequate group sizes and stable model estimates, whereas finer categorization (such as tertiles or quartiles) would have resulted in highly imbalanced strata. Associations of outcomes with these SDI quantiles were evaluated using univariate and multivariate logistic regression models. Results are reported as odds ratios (ORs) with corresponding 95% confidence intervals.
Results
Baseline Patient and Eye Characteristics
A total of 643 patients met the inclusion criteria based on data identified from the EHR. Baseline demographics and SDI scores are detailed in Table 1. The median age was 80 years (range, 49–99 years). The majority of patients were female (64.4%) and identified their race as White (73.4%). The median SDI score was 18 (range, 1–97). The majority of patients (63.0%) had a pseudophakic lens status at the time of neovascular conversion. Other than race, there were no significant differences in baseline clinical characteristics between the low and high SDI quantiles, including eye laterality, lens status, presence of submacular hemorrhage, foveal geographic atrophy, and mean BCVA at the time of conversion to nAMD (Table 2).
Baseline Demographic and Socioeconomic Characteristics of Patients With nAMD.
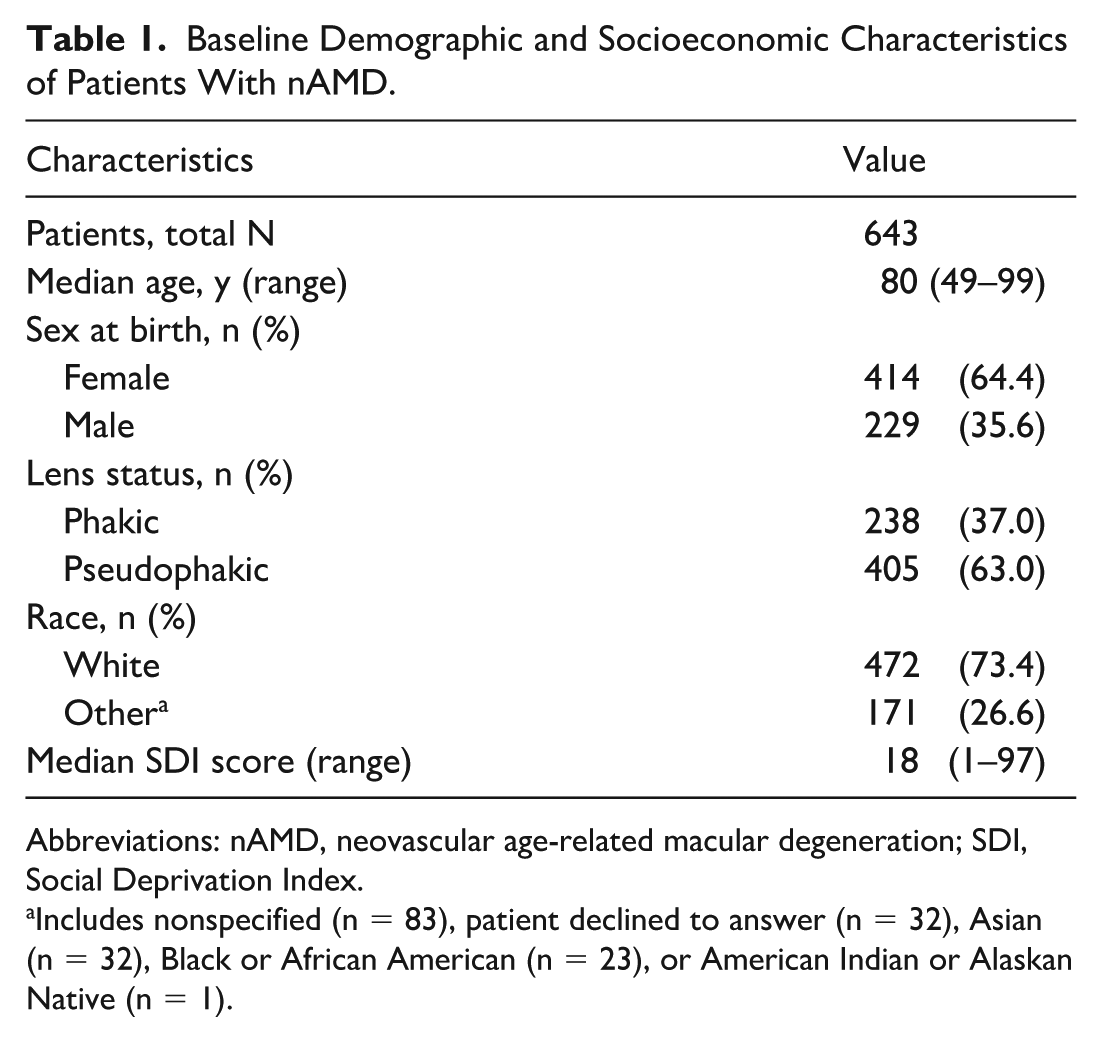
Abbreviations: nAMD, neovascular age-related macular degeneration; SDI, Social Deprivation Index.
Includes nonspecified (n = 83), patient declined to answer (n = 32), Asian (n = 32), Black or African American (n = 23), or American Indian or Alaskan Native (n = 1).
Baseline Demographic and Clinical Characteristics of Patients With nAMD by Low and High SDI Quantile.
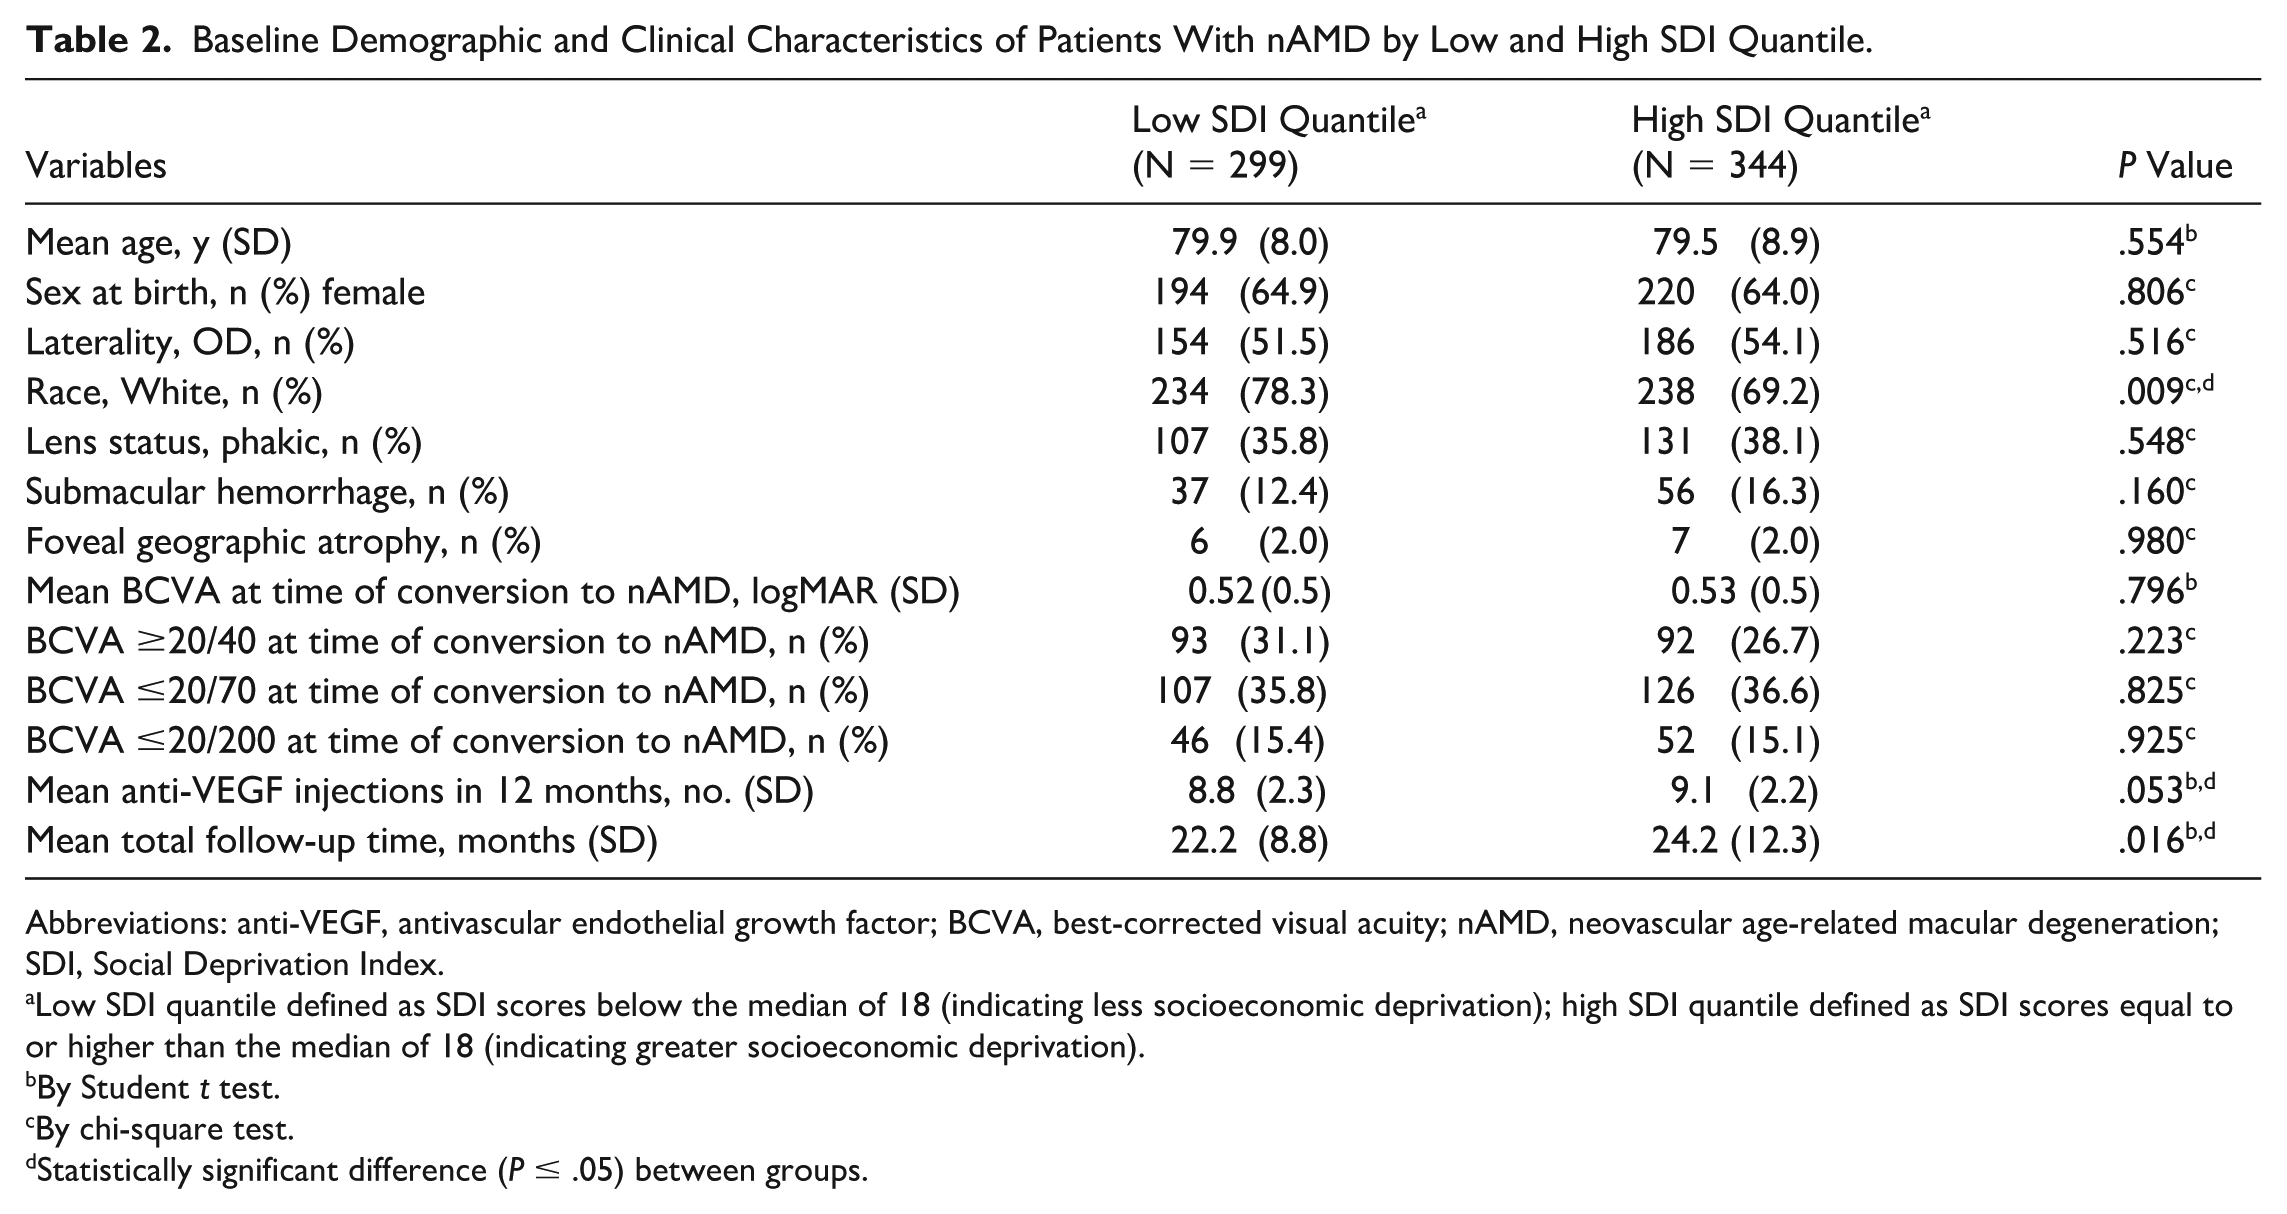
Abbreviations: anti-VEGF, antivascular endothelial growth factor; BCVA, best-corrected visual acuity; nAMD, neovascular age-related macular degeneration; SDI, Social Deprivation Index.
Low SDI quantile defined as SDI scores below the median of 18 (indicating less socioeconomic deprivation); high SDI quantile defined as SDI scores equal to or higher than the median of 18 (indicating greater socioeconomic deprivation).
By Student t test.
By chi-square test.
Statistically significant difference (P ≤ .05) between groups.
Outcomes
There was a negative association between a mean BCVA of ≥20/40 at the time of conversion to nAMD and increasing age (OR, 0.94, 95% CI, 0.93–0.97; P < .001). This association was maintained in multivariable analysis adjusted for sex at birth, submacular hemorrhage, laterality, lens status, race, and SDI score (OR, 0.93, 95% CI, 0.90–0.95; P < .001). Similarly, the presence of submacular hemorrhage at the time of conversion to nAMD was associated with lower odds of achieving a mean BCVA of ≥20/40 (OR, 0.29, 95% CI, 0.14–0.54; P < .001). This relationship held in multivariable analysis after adjustments for age, laterality, lens status, race, and SDI score (OR, 0.27, 95% CI, 0.14–0.53; P < .001). In patients who identified as non-White, a significant negative association with a BCVA ≥20/40 at the time of conversion to nAMD was observed in analyses adjusted for age, sex at birth, submacular hemorrhage, laterality, lens status, and SDI score (OR, 0.60, 95% CI, 0.39–0.91; P = .018). No significant association between higher SDI scores and having a BCVA ≥20/40 at baseline was identified (Table 3). Patients in the high SDI quantile received a similar number of anti-VEGF injections within 12 months of therapy initiation as compared with those received by patients in the low SDI quantile (mean 9.1 vs 8.8 injections; P = .053).
Associations of Baseline Demographic and Clinical Characteristics With a BCVA of ≥20/40 at the Time of New Diagnosis of nAMD.
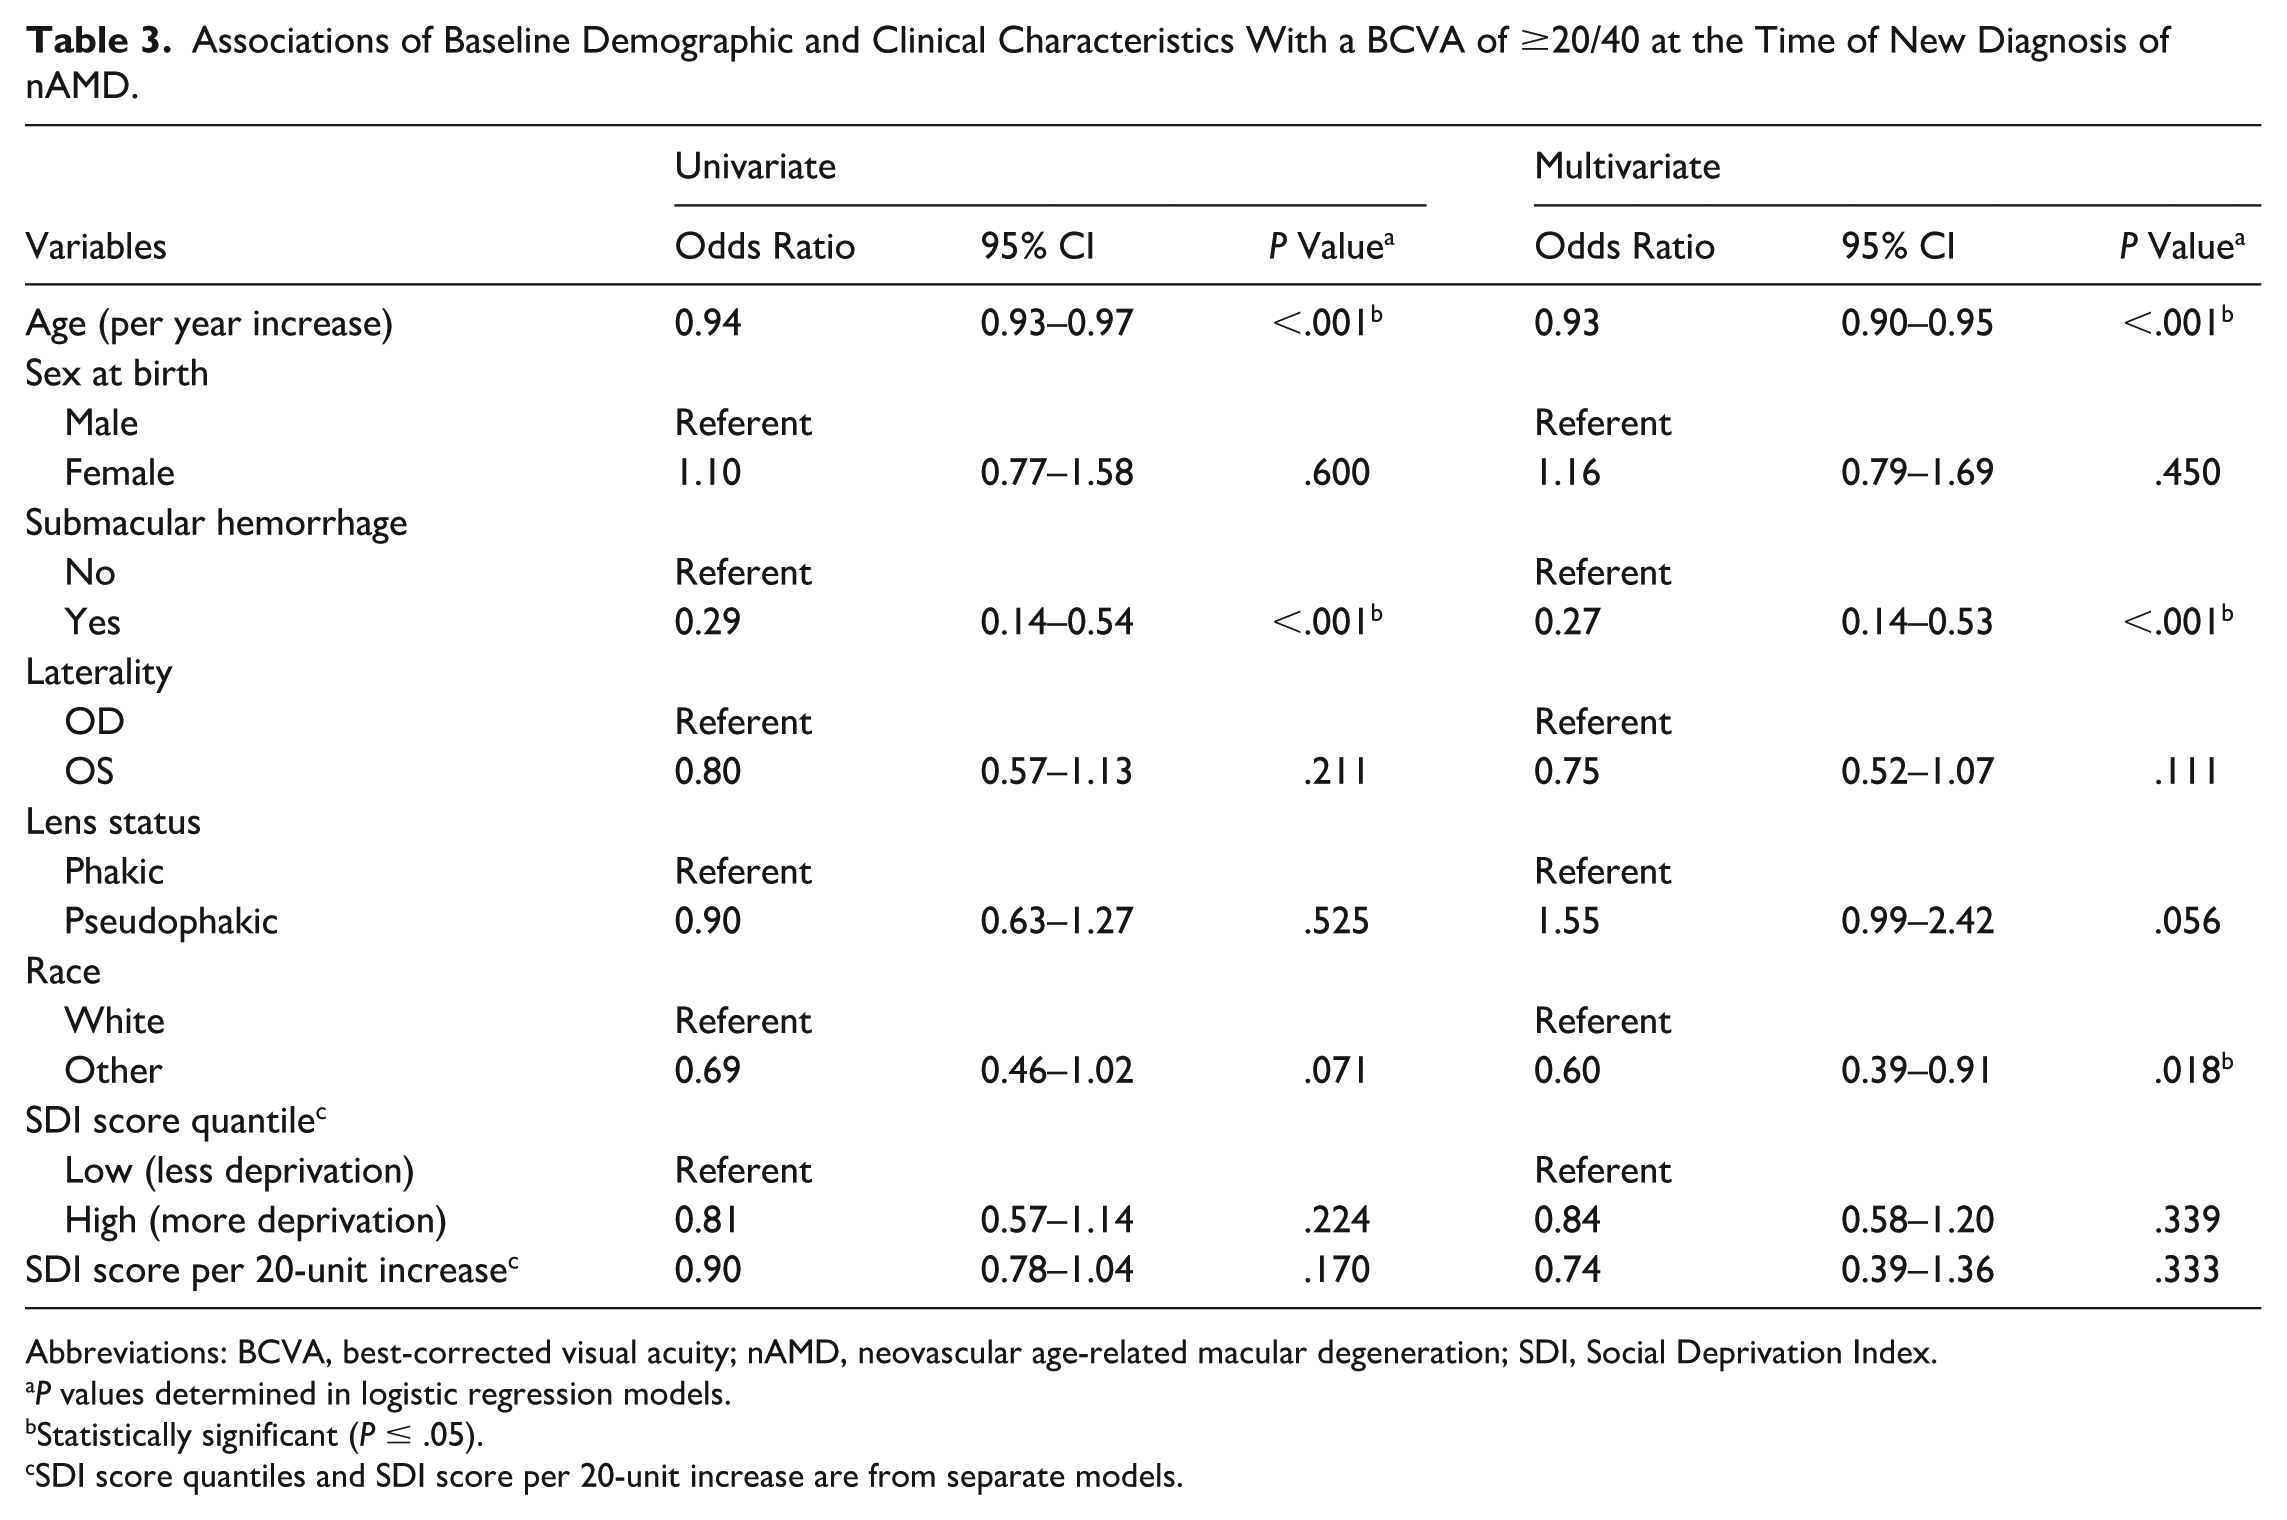
Abbreviations: BCVA, best-corrected visual acuity; nAMD, neovascular age-related macular degeneration; SDI, Social Deprivation Index.
P values determined in logistic regression models.
Statistically significant (P ≤ .05).
SDI score quantiles and SDI score per 20-unit increase are from separate models.
At the 12-month mark, univariate logistic regression analysis revealed that greater socioeconomic deprivation, as indicated by high SDI scores, was negatively associated with achieving a mean BCVA of ≥20/40 at 12 months (OR, 0.66, 95% CI, 0.48–0.90; P = .010). This association between high SDI scores and achieving a mean BCVA of ≥20/40 at 12 months remained significant in multivariate analyses adjusted for age, sex at birth, BCVA ≥20/40 at time of conversion to nAMD, rate of submacular hemorrhage at time of conversion, laterality, mean number of anti-VEGF injections in 12 months, lens status, and race (OR, 0.69, 95% CI, 0.48–0.98; P = .039). Similarly, age, a BCVA of ≥20/40 at baseline, and race were significantly associated with the likelihood of achieving a BCVA of ≥20/40 at 12 months in both univariate and multivariate analysis (Table 4). Sex at birth was not a significant predictor of visual outcomes in either univariate or multivariate analysis.
Associations of Baseline Demographic and Clinical Characteristics With a BCVA of ≥20/40 at 12 Months in Patients With nAMD.
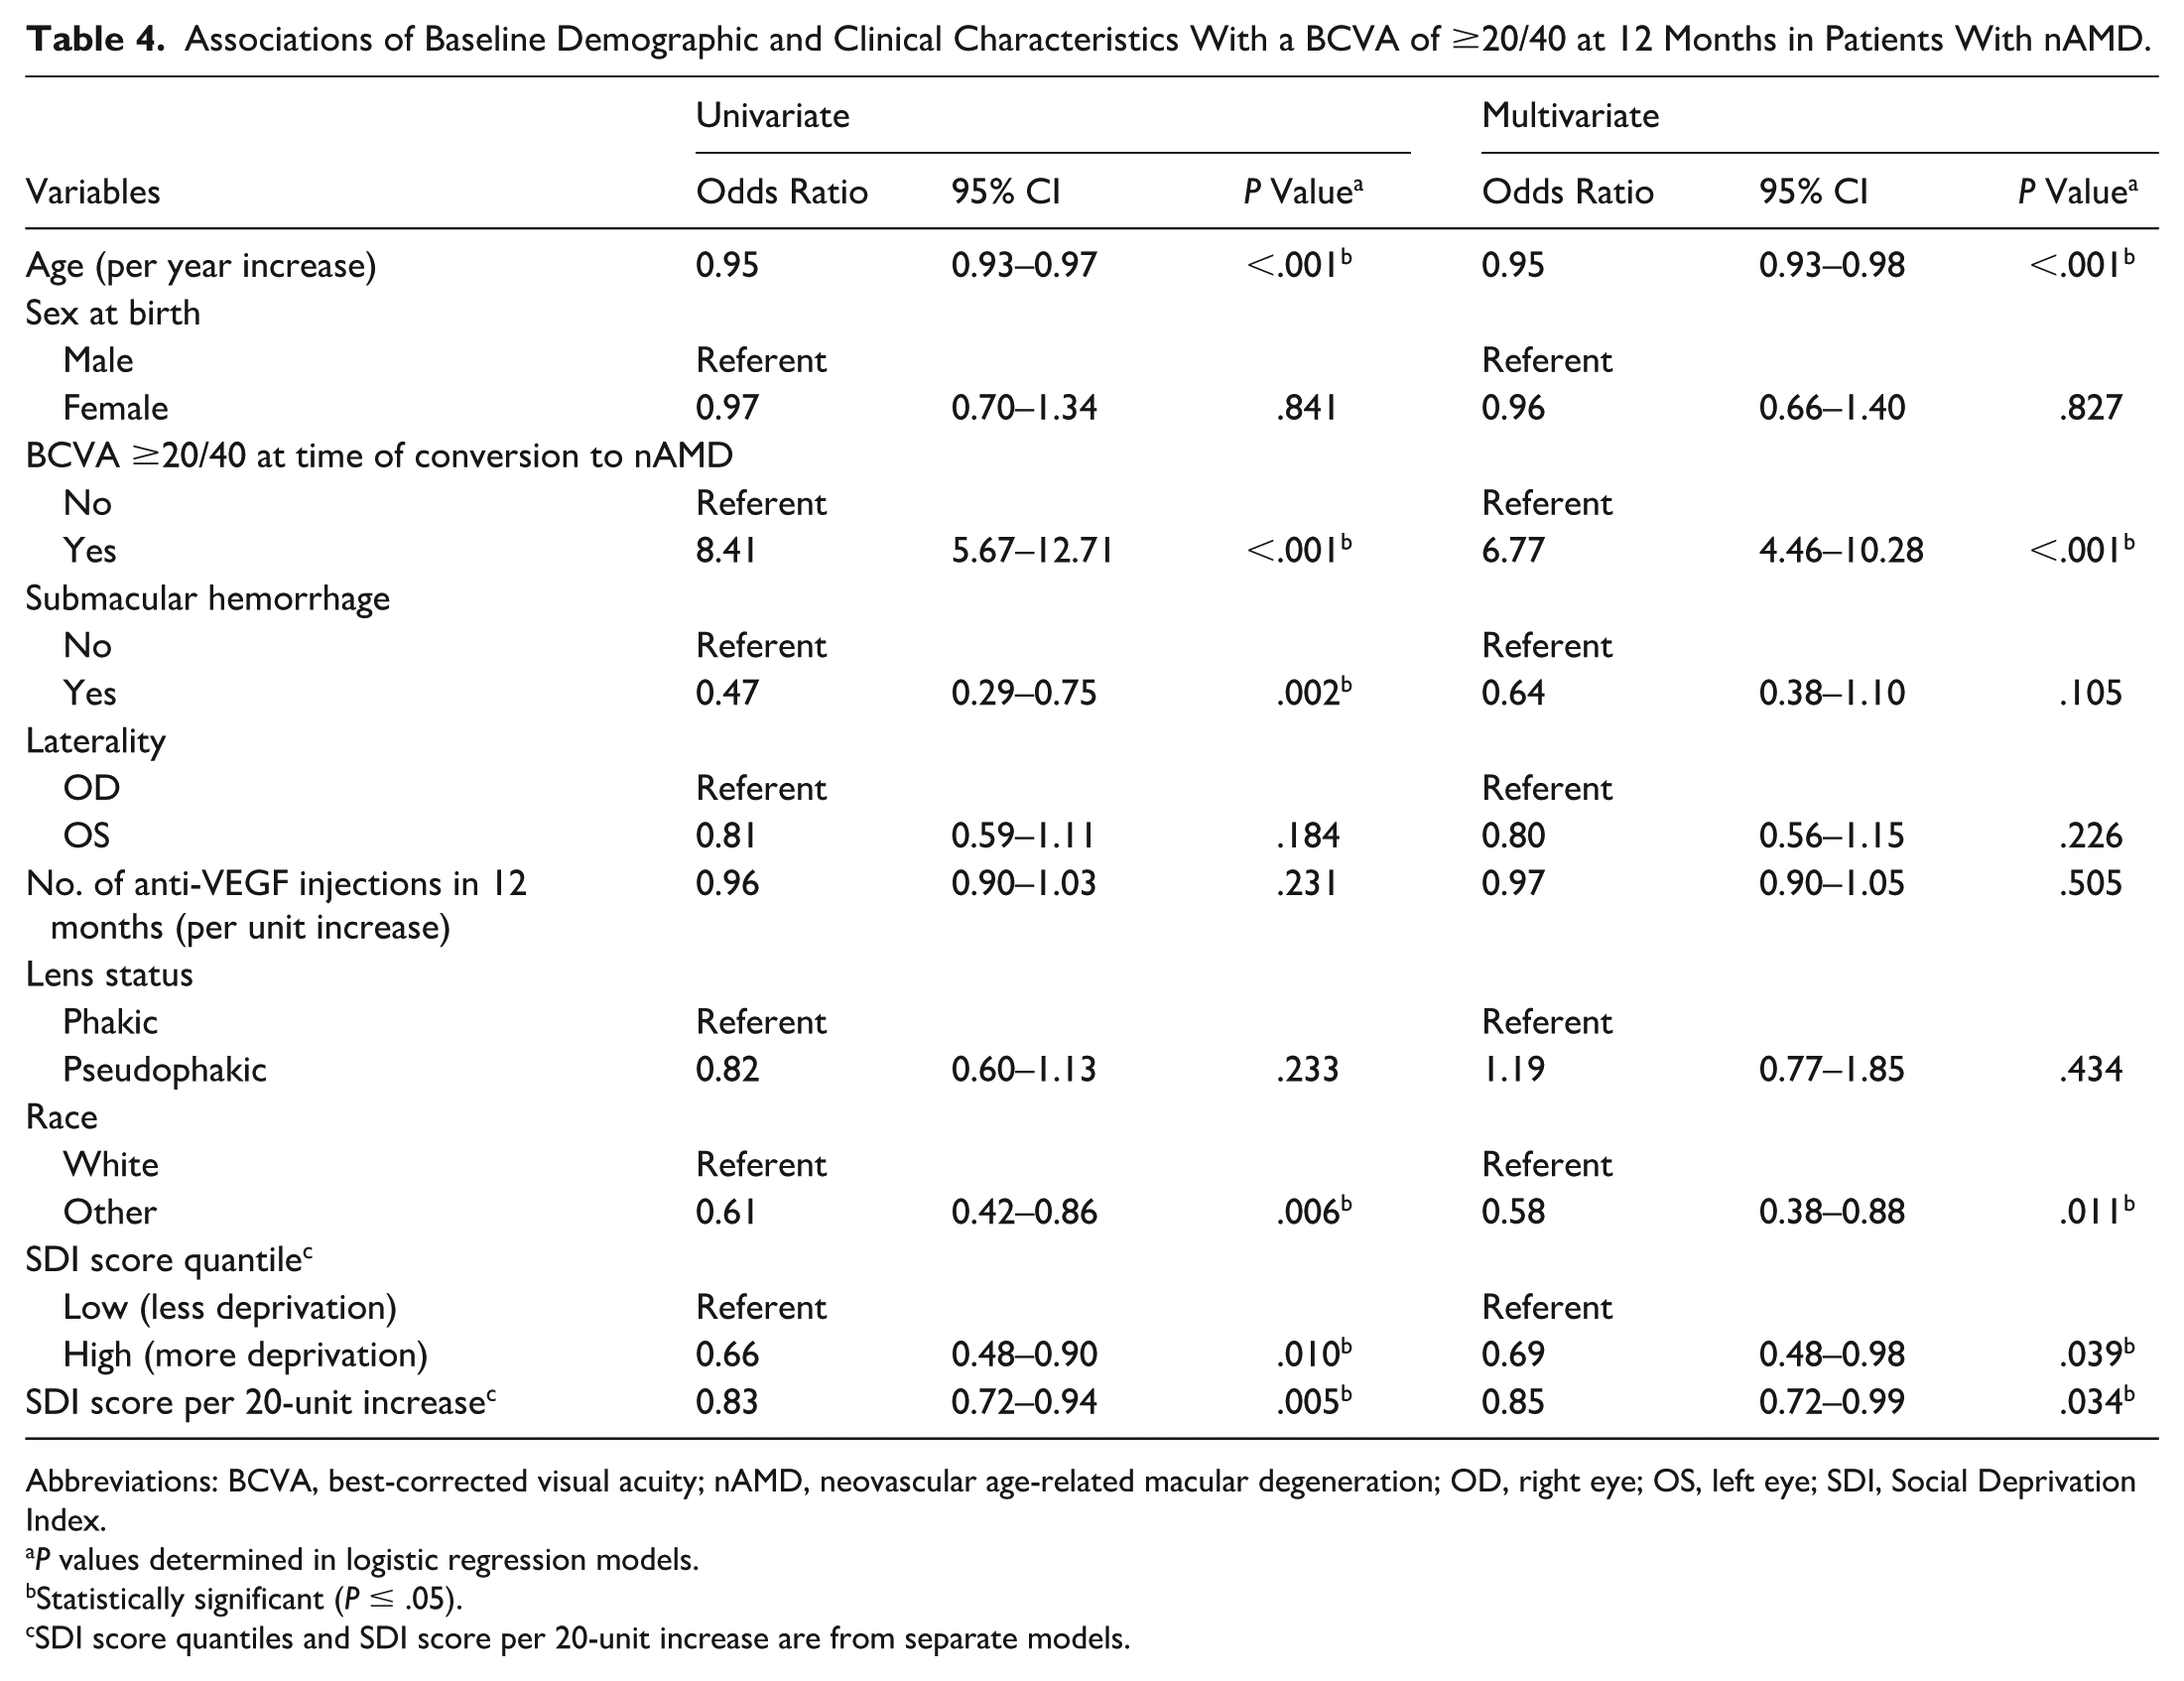
Abbreviations: BCVA, best-corrected visual acuity; nAMD, neovascular age-related macular degeneration; OD, right eye; OS, left eye; SDI, Social Deprivation Index.
P values determined in logistic regression models.
Statistically significant (P ≤ .05).
SDI score quantiles and SDI score per 20-unit increase are from separate models.
Additionally, there were no significant differences in the type or frequency of medication brands used between high and low SDI quantiles. The mean ± SD number of injections in the first 12 months was 8.8 ± 2.3 in the low SDI group and 9.1 ± 2.2 in the high SDI group (P = .053). The distribution of anti-VEGF agents was similar between the low and high SDI groups: aflibercept 2 mg (54.1% vs 55.8%; P = .621), bevacizumab (18.9% vs 18.2%; P = .787), ranibizumab (22.5% vs 22.5%; P = .976), aflibercept 8 mg (0.8% vs 0.6%; P = .572), and faricimab (3.7% vs 3.0%; P = .408).
Subgroup Analysis
In a subgroup analysis focusing solely on patients who identified as White, the SDI was not a significant predictor of achieving a BCVA of ≥20/40 at 12 months in either univariate or multivariate analysis (P = .170 and P = .424, respectively). Age and a BCVA of ≥20/40 at the time of conversion to nAMD were the only significant predictors of achieving a BCVA of ≥20/40 at 12 months in this subgroup (P < .001). For patients categorized as non-White, only a BCVA of ≥20/40 at the time of nAMD conversion and the SDI were significant predictors of achieving a BCVA of ≥20/40 at 12 months (P < .001 and P = .012, respectively). Notably, less socially deprived patients (those in the low SDI quantile) were significantly more likely to achieve a BCVA of ≥20/40 at 12 months in analyses adjusted for all other variables (OR, 2.80, 95% CI, 1.26–6.25; P = .012). No significant difference in the presenting BCVA was observed between the high and low SDI quantiles in either White or non-White subgroups.
Conclusions
The SDI was successfully utilized as an objective metric of social drivers of health for distinguishing disease outcomes in patients with nAMD. The present study found that patients treated for newly diagnosed nAMD whose SDI scores were higher (corresponding to greater socioeconomic deprivation) had a decreased likelihood of achieving a BCVA of 20/40 or better at 12 months. In analyses controlled for variables known to influence visual outcomes, such as the frequency of intravitreal injections and presenting BCVA, patients with SDI scores corresponding with greater socioeconomic deprivation were less likely to attain favorable visual outcomes at 12 months.
While the high, more socially deprived SDI quantile was predictive of poorer visual outcomes after treatment, it was not associated with poorer presenting visual acuity at the time of neovascular conversion. This is in contrast to prior reports from Israel and the UK suggesting that lower SES was associated with more advanced neovascular disease at presentation based on visual acuity at presentation, anatomic features on OCT, and treatment burden (eg, number of anti-VEGF injections received) but not visual outcomes after treatment.22,23 While these studies concluded that more socioeconomically deprived populations experience delayed diagnosis and would benefit from earlier identification of AMD and improved referral patterns, our findings emphasize that disparities may extend to treatment outcomes. Whether differences could be attributed to poorer adherence to treatment schedules or reduced ability to maintain routine visits among patients in the high SDI quantile remains unclear, as injection frequency was not different between SDI quantiles. Delayed or limited access to branded medication is another potential factor, although there were no significant differences in the proportion of ant-VEGF injection types between SDI quantiles; for example, bevacizumab use was similar between the low and high SDI groups (18.9% vs 18.2%; P = .787). Future studies conducted after the widespread availability of faricimab and aflibercept 8 mg may better evaluate this aspect. Moreover, while the SDI score may independently affect visual outcomes, other determinants, such as age and, notably, presenting BCVA (OR of 6.77), are also crucial contributory factors to a patient’s disease progression. This underscores the importance of timely diagnosis, as delays can significantly compromise the effectiveness of initial treatment and potentially lead to worsened long-term visual outcomes.
The lack of a significant effect of SDI on visual outcomes in the subgroup of White patients could be attributed to the distribution of our study population. Notably, this distribution was heavily skewed, as the median SDI score among White patients was 18, with only 41 in the 75th percentile of SDI scores, and just 76 in the 97.5th percentile of SDI scores, barely touching the bottom quintile. This indicates an underrepresentation of patients at the lower end of the spectrum of socioeconomic disadvantage, likely limiting our ability to observe significant effects. Conversely, in the non-White subgroup, the SDI distribution was less skewed, with a median SDI score of 29.5 among non-White patients, with 61 in the 75th percentile of SDI scores, and 89.7 in the 97.5th percentile of SDI scores. This broader range of socioeconomic backgrounds likely allowed for the observation of a significant relationship between the SDI score and visual outcomes.
Although not statistically significant, our study found that the high SDI quantile had a higher proportion of patients (16.2%) presenting with submacular hemorrhage at the time of nAMD diagnosis. Thus, delayed diagnosis and greater disease severity prior to treatment initiation should be considered risk factors for submacular hemorrhage in patients with a higher SDI score, in the context of other reports in the literature. 19 Similarly, the more socioeconomically deprived high SDI quantile had a lower proportion of patients (26.7% vs 31.1% in the low SDI quantile) presenting with a BCVA of 20/40 or better. While not statistically significant, such a difference could still influence the final outcome, as a better initial BCVA has almost 7 times the odds of resulting in a better BCVA at 12 months. The similarity in comorbid disease burden between SDI groups in our cohort likely reflects the constrained SES range represented in this single-practice population, rather than true equivalence in health status. It is also possible that patients in the low SDI quantile may have improved means of maintaining overall medical health, including managing other chronic conditions that could directly or indirectly affect their vision.
Prior studies on the relationship between SES and either incident AMD or disease severity have employed diverse SES metrics. Some analyses, similar to ours, use multiple weighted domains such as the Index of Multiple Deprivation, Townsend Deprivation Index, or area income estimates.18,22,23 Other research has relied on individual SES indicators, including education, income, housing, and occupation.10,19,24 Although indices like the Index of Multiple Deprivation and Townsend have demonstrated important associations with AMD severity, they were developed for UK populations and rely on census constructs that do not translate directly to US neighborhoods. The US Area Deprivation Index, although widely used, is built for block-group resolution; because only zip-code identifiers were available in our EHR, the Area Deprivation Index would have introduced substantial geographic misclassification. Recent comparative work has shown that the Area Deprivation Index and SDI are not interchangeable, correlating only modestly and capturing distinct socioeconomic dimensions, thereby reinforcing the need to select an index suited to the available geographic resolution and relevant clinical context. 25 In contrast, the SDI is validated for US zip-code–level use and captures multiple social determinants, including poverty, education, housing burden, transportation access, and employment, that are particularly relevant to adherence and visit frequency in outpatient retina care. For these reasons, SDI provided the most appropriate and consistently applicable SES measure in our dataset, offering a broader perspective on socioeconomic deprivation than individual SES markers alone.
Limitations of our study should also be considered. The focus on a single practice limits the applicability of our findings to other geographic regions within the US. Our sample size of 643 patients, while comparable to prior studies, represents a limitation and may reduce generalizability. Given a retrospective study design, the direction or causality of the associations described in our report cannot be determined. The design of our study also carries the risk of selection bias, as only patients receiving anti-VEGF treatment were included. This may have excluded a population facing a higher degree of barriers in seeking care, potentially skewing our results toward the lesser extreme of disparity. In addition, demographic data collected were limited to what was available in the EHR. The Other category for race includes a diverse group of patients, making it difficult to draw specific conclusions about racial or ethnic differences in visual outcomes. Additionally, our study is limited by the lack of consistent OCT imaging data to assess anatomic differences in pathology, including the presence of intraretinal or subretinal fluid, which may indicate more severe disease and impact treatment response. Without standardized imaging, we cannot determine whether differences in anatomic disease severity contribute to the observed SES-related disparities in visual outcomes, highlighting the need for future studies incorporating detailed OCT analysis. The type, location, and severity of choroidal neovascularization exudation are vision-impacting factors that were not assessed in this study. Furthermore, while the SDI is a composite measure that considers multiple demographic characteristics and serves as a useful neighborhood-level measure of social determinants of health, it remains a proxy for individual-level factors. Because individual SES indicators such as insurance type, income, and educational attainment were inconsistently documented in the EHR, we were unable to quantify how closely SDI aligned with actual patient-level socioeconomic circumstances. This ecologic limitation should be considered when interpreting the association between SDI and visual outcomes.
Additional studies may also help in identifying a definitive explanation for worse vision, given the similarity in baseline BCVA and annual injection frequency between high and low SDI quantiles. A larger cohort may be necessary to confirm our findings and appropriately power certain subgroup analyses, allowing for a more precise characterization of the relationship between SDI scores and visual outcomes.
The results of our study indicate that a higher SDI score is associated with poorer 12-month outcomes among patients with newly diagnosed nAMD, particularly among non-White patients. This suggests that the impact of socioeconomic deprivation may be magnified when combined with racial or structural barriers to care. Retina specialists and referring providers should be aware that the SDI may be one component of visual morbidity associated with nAMD. Identifying and addressing barriers to effective education, timely diagnosis, and adherence to therapy should be priorities at both the individual patient and population level. The substantial OR for worse vision outcomes among those with worse presenting vision further underscores the importance of these interventions. Implementing effective strategies to overcome these barriers is crucial for preventing disproportionate long-term visual impairment among lower socioeconomic groups. Additional studies with larger sample sizes are needed to validate these findings and explore potential solutions.
Footnotes
Authors’ Note
R. Dasan and M.Y. Chen contributed equally to this work.
Ethical Approval
This study adhered to the tenets of the Declaration of Helsinki and was approved by the Institutional Review Board (IRB) at the Retina Group of Washington.
Consent to Participate
The requirement for informed consent was waived due to the retrospective nature of the study, in accordance with IRB guidelines.
Funding
The authors received no financial support for the research, authorship, and/or publication of this article.
Declaration of Conflicting Interests
The authors declared no potential conflicts of interest with respect to the research, authorship, and/or publication of this article.