
Abstract
Purpose:
To evaluate the relationship between macular retinal thickness on optical coherence tomography (OCT) and retinal sensitivity on microperimetry in children, adolescents, and young adults with sickle cell disease.
Methods:
This cross-sectional study included 63 eyes of 34 patients with sickle cell disease. Data included demographics, macular retinal thickness determined by OCT, and retinal sensitivity on Macular Integrity Assessment (CenterVue) using a 68-point, 10-degree grid under mesopic conditions. Total retinal thickness was measured in the central, parafoveal, and perifoveal regions. The relationship between OCT macular thickness and retinal sensitivity on mesopic microperimetry was assessed in specific macular regions, including differences by peripheral sickle cell retinopathy status.
Results:
The median age of the 34 patients (63 eyes) was 14.6 years, and the median best-corrected visual acuity (BCVA) at the time of testing was 0 logMAR (Snellen 20/20). Of the 63 eyes, 55 (87.3%) had ≤30% fixation loss and thus were considered for the primary analysis. In multivariate regression analyses adjusted for patient age, BCVA, sickle cell genotype, sex, and race and ethnicity, decreased retinal sensitivity measured by microperimetry was associated with a decrease in OCT macular thickness (β = 0.06, 95% CI, 0.015–0.104; P = .009). Moreover, eyes with peripheral sickle cell retinopathy had lower temporal perifoveal retinal sensitivity on mesopic microperimetry compared with eyes without retinopathy (β = −6.3, 95% CI, −10.9 to −1.7; P = .008). BCVA at the time of testing was not associated with decreased macular sensitivity (P = .817) or with decreased OCT macular thickness (P = .086).
Conclusions:
Children, adolescents, and young adult patients with sickle cell maculopathy demonstrated reduced visual function, which was correlated with the degree of retinal thinning. Eyes with peripheral sickle cell retinopathy had lower temporal macular sensitivity compared with eyes without peripheral retinopathy. There was no difference in visual acuity between the groups, suggesting that functional tests are required to assess vision in sickle cell disease comprehensively.
Keywords
Introduction
Sickle cell disease affects more than 7 million individuals worldwide and leads to systemic complications, including retinopathy, through retinal ischemia and neovascularization. In addition to peripheral retinal changes, a growing area of concern is sickle cell maculopathy, which is characterized by macular thinning and may occur even in the absence of peripheral retinopathy.1,2 The macular region is key in central vision, serving as the most sensitive and essential area for fine visual tasks. While traditional visual acuity tests have been the standard for assessing foveal function, they are insufficient for capturing the broader functional impact of macular diseases. 3 Recognizing this limitation, advanced techniques, including retinal microperimetry, have been developed to evaluate macular function. Microperimetry combines retinal sensitivity mapping with real-time eye tracking, enabling precise and repeatable assessments of the macula. 3 Coupled with optical coherence tomography (OCT), microperimetry allows a detailed understanding of the structure–function relationship in macular disorders and offers insights into disease progression.4–7
Limited studies in adults have evaluated the role of microperimetry in sickle cell retinopathy, assessment. It has been suggested that, when compared with healthy individuals and despite similar levels of visual acuity, retinal sensitivity is significantly decreased in patients with sickle cell disease who have focal macular thinning evident on spectral-domain OCT.8,9 However, the impact of sickle cell maculopathy on visual acuity, as evaluated using functional testing, has not been studied in pediatric patients. Early identification of subtle visual dysfunction may offer opportunities to support visual development and overall functioning during a critical period of growth. Although feasibility remains a potential challenge in this population, advances in testing technologies have made such assessments more accessible. To build on these insights, this study aimed to assess the structure–function relationship in children, adolescents, and young adult patients with sickle cell disease using macular OCT and microperimetry.
Methods
Patients
This retrospective, cross-sectional study included 63 eyes of 34 children, adolescents, and young adults with a diagnosis of sickle cell disease (International Classification of Diseases [ICD], Tenth Revision codes H36 and H35, and ICD-9 codes 282.60–282.69 and D57.0–D57.8). Included patients were ages 8 to 22 years and had an ophthalmic examination at Boston Children’s Hospital between January 2023 and July 2024. The study was determined to be exempt by the Boston Children’s Hospital Institutional Review Board, and the requirement for informed consent was waived because of its retrospective design. All data analyzed in this study were collected at the patients’ clinic appointments as part of the Department of Ophthalmology’s standard of care for sickle cell disease. All research adhered to the tenets of the Declaration of Helsinki.
Baseline demographics (sex, race, and ethnicity), sickle cell disease genotype (sickle cell anemia, hemoglobin sickle cell disease, hemoglobin S thalassemia, and sickle cell trait), and sickle cell retinopathy status were extracted from the patient’s medical records. Best-corrected visual acuity (BCVA) from the same date as the mesopic microperimetry testing was reported in logMAR units (with Snellen equivalents; M&S Technologies). Total macular thickness was extracted from each patient’s OCT volume scans (30 degrees; HRA + OCT Spectralis, Heidelberg Engineering), centered on the fovea and measured in the central, parafoveal, and perifoveal regions using the built-in 9-region Early Treatment Diabetic Retinopathy Study (ETDRS) grid. 10 The most recent mesopic microperimetry examination findings were analyzed using the 4-2 visual field method and a 68-point, 10-degree Macular Integrity Assessment grid (CenterVue).
Inclusion/Exclusion Criteria
Patients with sickle cell disease were included in the study if they had mesopic microperimetry, OCT, and BCVA data collected on the same date, to ensure temporal alignment. To assess the robustness of our findings and account for challenges associated with visual function testing in the pediatric population, we performed both a primary analysis excluding eyes with fixation loss of >30% and a secondary subanalysis including all eyes regardless of fixation loss. Eyes with fixation loss of >30% were excluded from the primary regression analyses in accordance with the CenterVue mesopic microperimetry testing manual, which designates such results as nonreliable. 11 Given the known difficulties of maintaining fixation in younger patients and the relatively novel use of mesopic microperimetry in sickle cell maculopathy, we included a broader, secondary subanalysis that included all eyes regardless of fixation status to maximize data use and reflect the feasibility of real-world functional assessments in pediatric and young adult populations.
Mesopic Microperimetry
In accordance with the clinic protocol, mesopic microperimetry assessments were mostly completed before patients were exposed to lights used for imaging, to ensure correct measurement of retinal sensitivity. If patients were exposed to light (as in OCT or fundus photography), patients then waited 10 minutes prior to completing the mesopic microperimetry testing.12,13
The participants were tested monocularly. In cooperative patients, the right eye was completed first, followed by the left eye. In less cooperative patients, the worse eye, as deemed by the doctor or according to the BCVA measurements in each eye, was completed first or was the sole eye tested. If both eyes were tested, mesopic microperimetry was completed in both eyes within a single testing session. Testing was done with the room lights off. Pupil dilation was not consistently used. Prior to the retinal sensitivity testing, each patient completed a fixation test (30 seconds per eye) to ensure they understood where to fixate during the testing. Patient and eye data of interest were exported from the mesopic microperimetry system. The 68 sensitivity data points were generated using custom MATLAB codes (R2021a; MathWorks) to determine each sensitivity point based on retinal eccentricity and location.
Association Analyses of Mesopic Microperimetry Retinal Sensitivity and OCT Macular Thickness
To evaluate the relationship between retinal sensitivity on mesopic microperimetry and total macular thickness on OCT, we implemented a structured approach incorporating spatial mapping and regional analysis. To align these datasets, we calculated eccentricity values and multiplied them by 0.3 mm, assuming a normal emmetropic axial length. 14 Total retinal thickness was measured across the central, parafoveal, and perifoveal regions (9 total ETDRS regions). This conversion allowed analysis of spatial correlations of mesopic microperimetry retinal sensitivity values with OCT-derived macular thickness values (Figure 1, A and B).
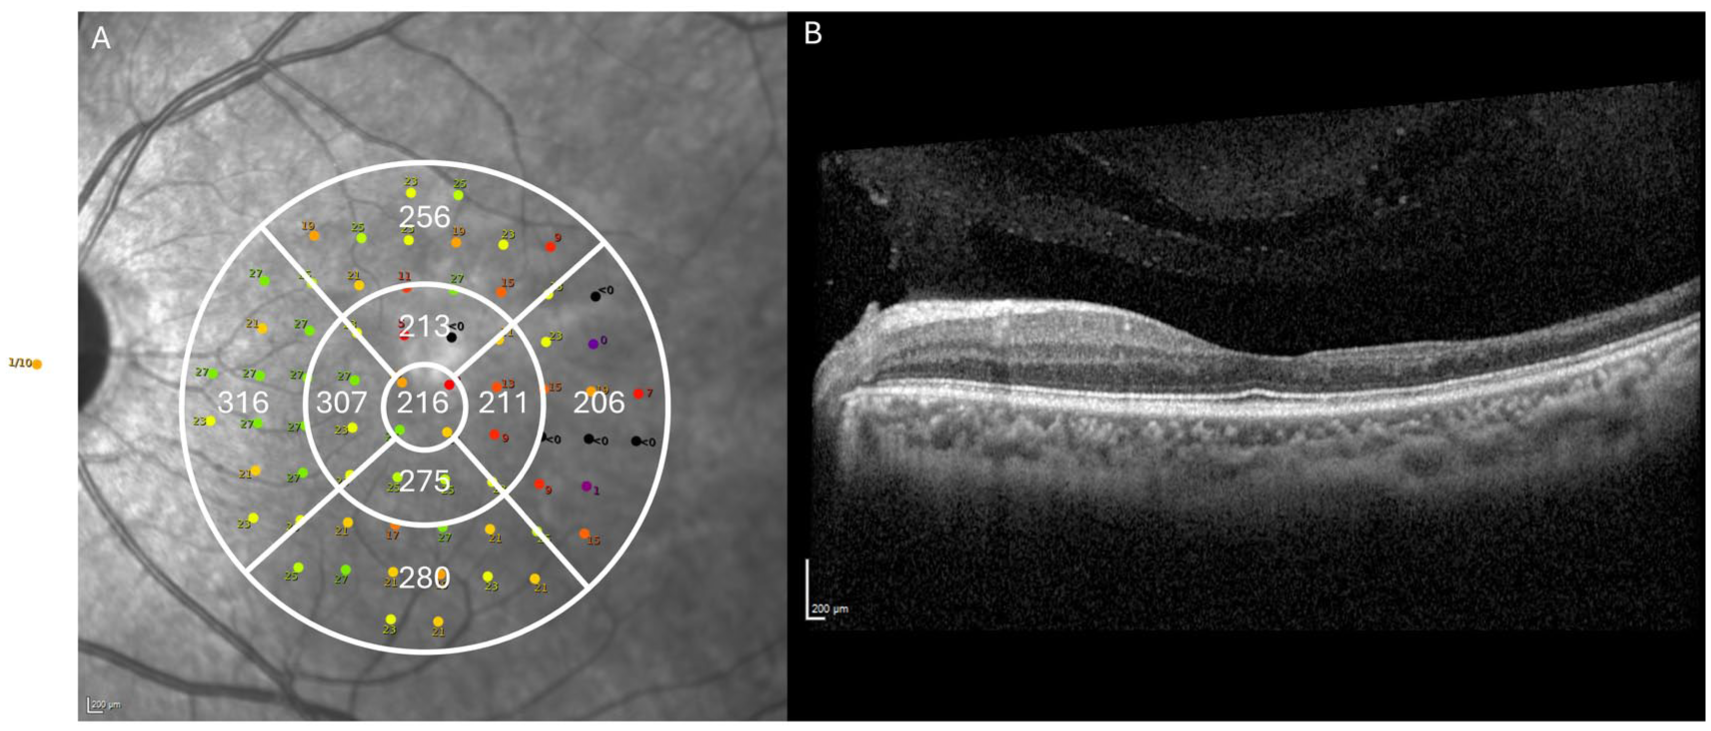
Mesopic microperimetry and optical coherence tomography (OCT) assessments in eyes of children, adolescents, and young adults with sickle cell disease. (A) Mesopic microperimetry macular integrity assessment using 68-point image of the left eye of a representative patient, overlaid with the OCT total retinal thickness measurements (expressed in micrometers), illustrating the spatial relationship between microperimetry-assessed retinal sensitivity and OCT-determined retinal structure. (B) Corresponding OCT B-scan of the same left eye, demonstrating temporal retinal thinning.
The 68 microperimetry points were distributed across the ETDRS radius, at 1 mm, 3 mm, and 6 mm radii, with the fovea serving as the center. 14 Based on ETDRS radius and eccentricity multiplication values, locations from the center fovea within 0 mm to ≤0.5 mm were classified as foveal, those within >0.5 mm to ≤1.5 mm as parafoveal, and those >1.5 mm as perifoveal. Additionally, to ensure accurate spatial alignment between functional (microperimetry) and structural (OCT) data, we mapped and matched superior, nasal, inferior, and temporal quadrants within the 0 to 360-degree range using degree coordinate–based mapping in Excel software (Microsoft Corporation). Angular coordinates were then used to localize each point to a quadrant: superior for angles ≥45 degrees and <135 degrees; nasal for angles ≥135 degrees and <225 degrees; inferior for angles ≥225 degrees and <315 degrees; and temporal for angles <45 degrees or ≥315 degrees.
For each patient, the 68 microperimetry points corresponded to specific macular subregions. The distributions of the 4 foveal points, 3 parafoveal points, and 13 perifoveal points per quadrant were determined based on the number of stimuli that fell within each eccentricity range. Median values for each macular region (for the fovea, parafovea, and perifovea) were calculated, and a single median value for the 9 ETDRS grid regions was derived to facilitate standardized comparisons of retinal sensitivity and OCT macular thickness.
Statistical Analysis
All statistical analyses were performed using SPSS software (version 29, SPSS Inc.). Continuous variables were summarized using medians and interquartile ranges (IQRs), while categorical variables were reported as frequencies and percentages. Spearman’s rank correlation was used to assess the relationship between OCT-derived macular thickness and mesopic microperimetry–assessed retinal sensitivity across different regions. Correlation analyses were considered exploratory; no formal adjustments for multiple comparisons were made in order to balance the risks of type I and type II errors.
Because measurements for some patients were obtained from both eyes, we fit 3 generalized linear mixed models, each incorporating a patient-level random intercept to account for within-subject correlation, with adjustments for relevant covariates. The first model evaluated OCT total macular thickness as the fixed effect, with mesopic microperimetry retinal sensitivity as the outcome. The second model used peripheral sickle cell retinopathy (a binary variable) as the fixed effect, and mesopic microperimetry retinal sensitivity (median value for 9 regions and by each ETDRS region) as the outcome. The third model used BCVA (in logMAR) as the fixed effect, with OCT macular thickness as the outcome. The fourth model used BCVA (in logMAR) as the fixed effect, with mesopic microperimetry retinal sensitivity as the outcome. Statistical significance was set at a 2-tailed P value of <.05.
Results
Baseline Characteristics
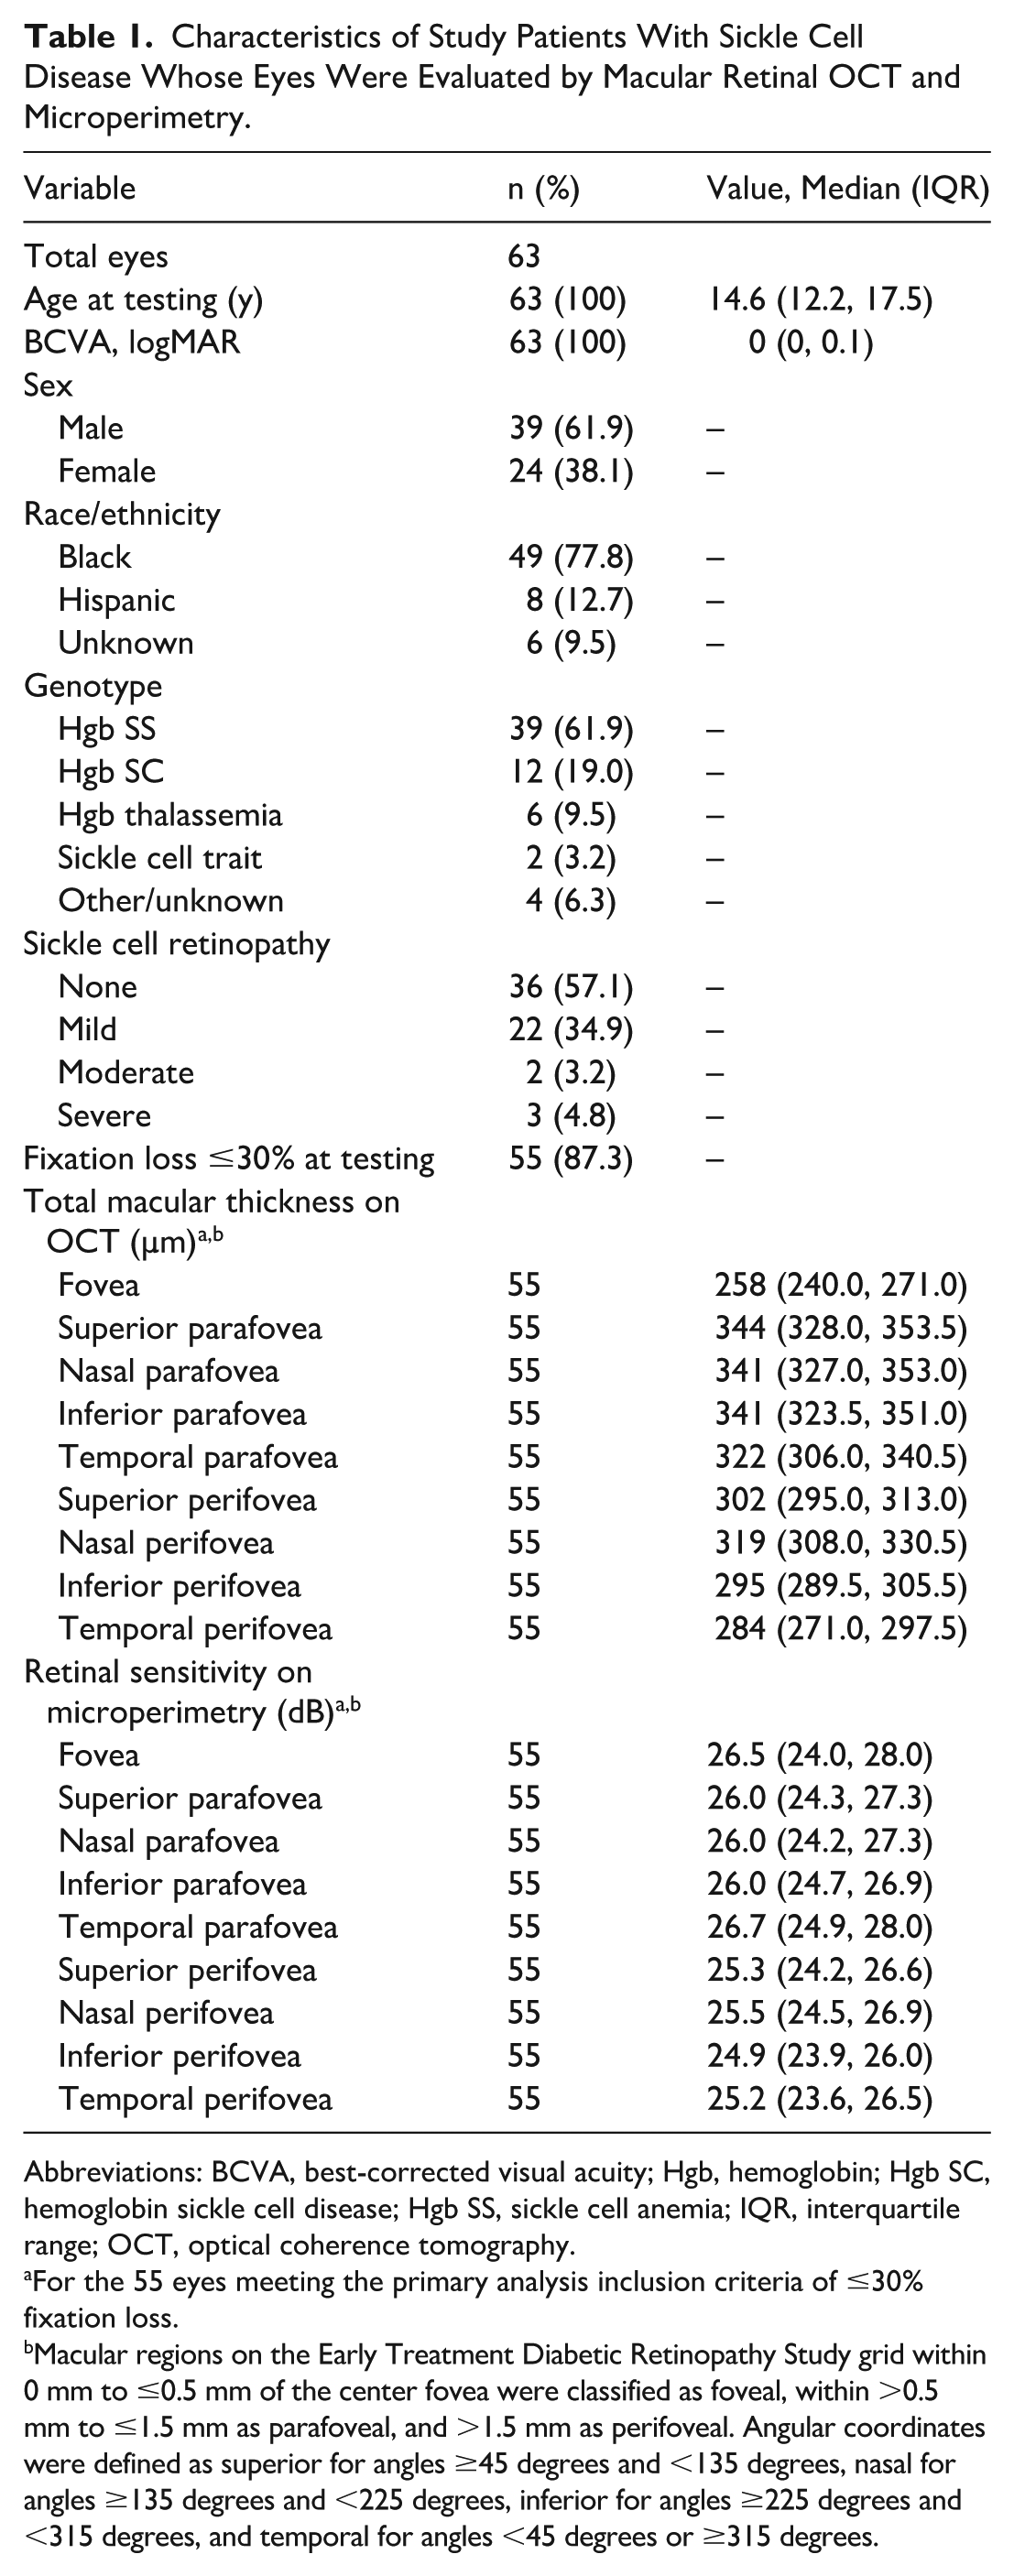
A total of 63 eyes of 34 patients were included in this study (Table 1). The study cohort was mostly male (61.9%), and the majority (77.8%) reported Black non-Hispanic race and ethnicity. The distribution of sickle cell genotypes was as follows: sickle cell anemia 61.9%, hemoglobin sickle cell disease 19.0%, hemoglobin S thalassemia 9.5%, other/unknown 6.3%, and sickle cell trait 3.2%. The median age at the time of testing was 14.6 years (IQR, 12.2–17.5 years). The median BCVA at the time of testing was 0 logMAR (IQR, 0–0.1), corresponding to Snellen 20/20. The percentage of eyes diagnosed as having sickle cell maculopathy on the basis of subjectively characterized temporal thinning on OCT was 54.0%. A total of 27 eyes (42.9%) had any degree of sickle cell retinopathy.
Characteristics of Study Patients With Sickle Cell Disease Whose Eyes Were Evaluated by Macular Retinal OCT and Microperimetry.
Abbreviations: BCVA, best-corrected visual acuity; Hgb, hemoglobin; Hgb SC, hemoglobin sickle cell disease; Hgb SS, sickle cell anemia; IQR, interquartile range; OCT, optical coherence tomography.
For the 55 eyes meeting the primary analysis inclusion criteria of ≤30% fixation loss.
Macular regions on the Early Treatment Diabetic Retinopathy Study grid within 0 mm to ≤0.5 mm of the center fovea were classified as foveal, within >0.5 mm to ≤1.5 mm as parafoveal, and >1.5 mm as perifoveal. Angular coordinates were defined as superior for angles ≥45 degrees and <135 degrees, nasal for angles ≥135 degrees and <225 degrees, inferior for angles ≥225 degrees and <315 degrees, and temporal for angles <45 degrees or ≥315 degrees.
Associations of OCT Macular Thickness With Mesopic Microperimetry Retinal Sensitivity
A total of 55 eyes (87.3%) had a fixation loss of ≤30% and were thus considered in the primary regression analyses. The median retinal sensitivity assessed by mesopic microperimetry was 25.4 dB (IQR, 23.8–26.5 dB), with a median minimum range of 19 dB (IQR, 12–21 dB) and a median maximum range of 30 dB (IQR, 29–32 dB). The median fixation loss at testing was 11% (IQR, 0%–17.5%). The median macular thickness on OCT and median retinal sensitivity on mesopic microperimetry by ETDRS grid quadrant are summarized in Table 1.
In multivariate regression analyses, OCT total macular thickness was associated with mesopic microperimetry retinal sensitivity, both in the primary analysis of eyes with ≤30% fixation loss (β = 0.06, 95% CI, 0.015–0.104; P = .009) (Table 2) and in the secondary subanalysis of all eyes regardless of fixation loss (β = 0.06, 95% CI, 0.024–0.095; P = .001), indicating that greater retinal thickness predicted higher retinal sensitivity (and vice versa).
Associations of OCT Macular Thickness (as the Predictor Variable) With Retinal Sensitivity on Mesopic Microperimetry, in Total and by Macular Region, in Univariate and Multivariate Regression Analyses. a
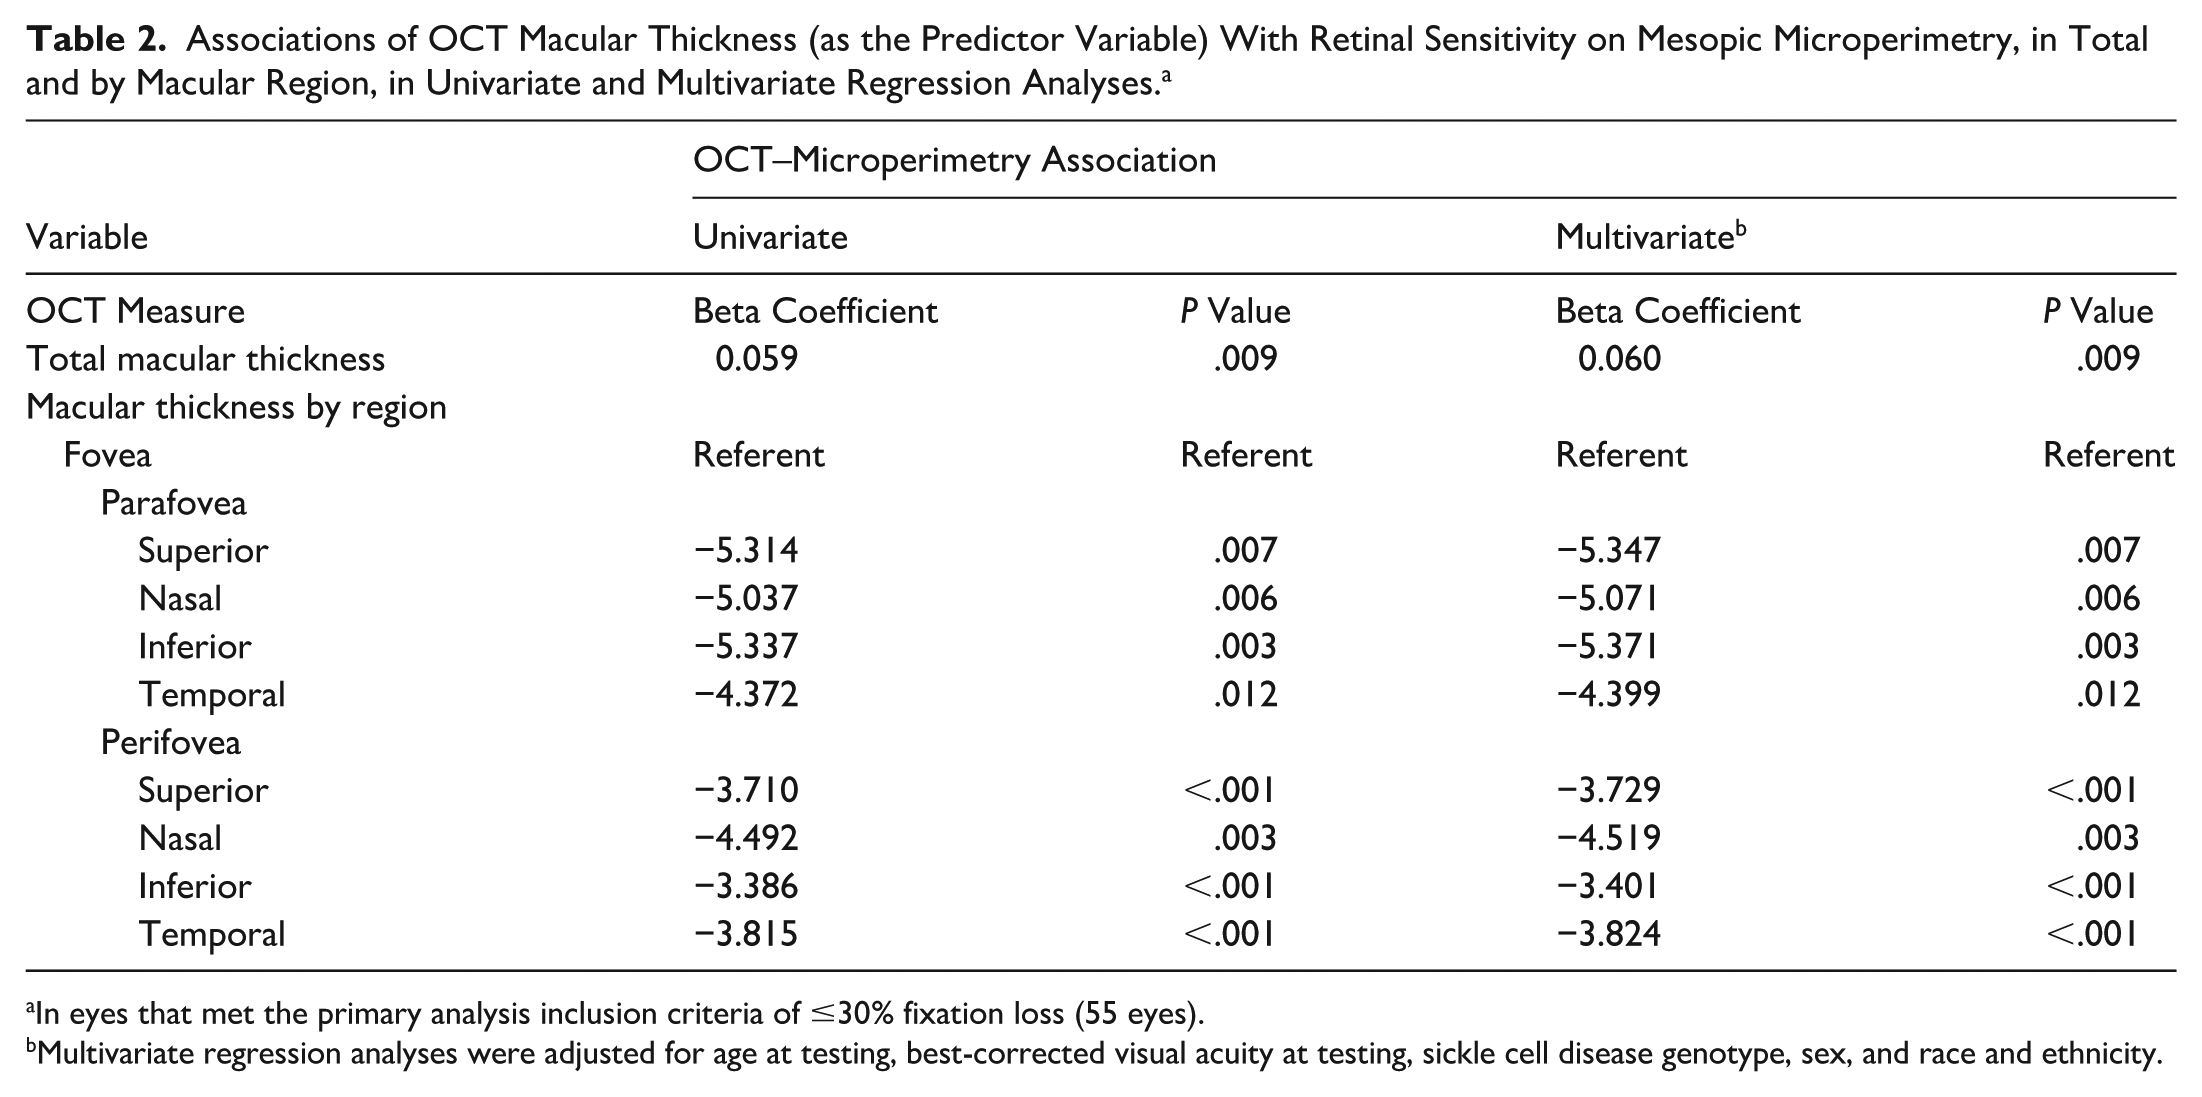
In eyes that met the primary analysis inclusion criteria of ≤30% fixation loss (55 eyes).
Multivariate regression analyses were adjusted for age at testing, best-corrected visual acuity at testing, sickle cell disease genotype, sex, and race and ethnicity.
Retinal sensitivity on mesopic microperimetry varied across macular regions, with all parafoveal and perifoveal locations demonstrating lower median sensitivity values compared with that in the fovea. In primary multivariate regression analyses, and among the parafoveal regions, the inferior parafovea exhibited the highest association of reduced OCT macular thickness with reduced mesopic microperimetry retinal sensitivity (β = −5.40, 95% CI, −8.92 to −1.82; P = .003). Associations of OCT macular thickness with reduced retinal sensitivity were slightly lower in the perifoveal regions, including in the nasal perifovea (β = −4.519, 95% CI, −7.45 to −1.59; P = .003), followed by the temporal perifovea (β = −3.824, 95% CI, −5.86 to −1.79; P < .001).
Correlations Between OCT Macular Thickness and Mesopic Microperimetry Retinal Sensitivity
In the Spearman’s correlation primary analysis, none of the regions showed statistically significant correlations between OCT macular thickness and retinal sensitivity. In the secondary subanalysis that included all eyes with fixation loss, retinal sensitivity demonstrated a positive correlation with OCT macular thickness in the temporal perifovea (ρ = 0.283, 95% CI, 0.30–0.502; P = .025). Additionally, trends toward positive correlations were observed in the superior perifovea (ρ = 0.213; P = .093) and temporal parafovea (ρ = 0.159; P = .214), though these correlations were not statistically significant.
Associations of Peripheral Sickle Cell Retinopathy With Mesopic Microperimetry Retinal Sensitivity
The presence of peripheral sickle cell retinopathy was not associated with median retinal sensitivity on mesopic microperimetry (P = .174 by primary analysis; P = .053 by secondary subanalysis). However, in analyses by ETDRS region, eyes with peripheral sickle cell retinopathy demonstrated lower temporal perifoveal retinal sensitivity on mesopic microperimetry compared with eyes without retinopathy, both in the primary analysis (β = −6.3, 95% CI, −10.9 to −1.7; P = .008) and in the secondary subanalysis (β = −5.4, 95% CI, −9.1 to −1.7; P = .005). Associations with peripheral sickle cell retinopathy were not significant in any of the other regions evaluated (all P > .05).
Associations of BCVA With OCT Macular Thickness and Mesopic Microperimetry Retinal Sensitivity
By primary analysis, and after adjusting for age at testing, sickle cell genotype, sex, and race and ethnicity, regression models showed that the median BCVA (in logMAR) was not associated with macular sensitivity on mesopic microperimetry (P = .817), nor was the BCVA associated with OCT macular thickness (P = .086). On secondary subanalysis (including all eyes), adjusted models similarly showed that BCVA was not associated with decreased macular sensitivity (P = .756) or with decreased OCT macular thickness (P = .053).
Conclusions
In this cross-sectional evaluation of the relationship between OCT-measured macular thickness and macular retinal sensitivity assessed by mesopic microperimetry in children and young adults with sickle cell disease, we found that (1) a decrease in retinal thickness measured by OCT was associated with a concurrent decline in retinal sensitivity measured by mesopic microperimetry; (2) eyes with peripheral sickle cell retinopathy demonstrated lower temporal perifoveal sensitivity compared with eyes without retinopathy; and (3) BCVA at the time of testing was not significantly associated with OCT macular thickness or microperimetry retinal sensitivity. These findings underscore the limitations of traditional acuity testing in detecting subtle visual changes in the macula in pediatric and young adult patients with sickle cell disease.
Mesopic microperimetry has been widely used in studies of retinal disease, offering a sensitive measure of functional examination of the macula,3,8,15 including in diabetic macular edema, 16 inherited retinal diseases,17,18 and age-related macular degeneration14,19–21; however, pediatric-specific applications remain limited.22–24 Unlike visual acuity tests, which test central retina function, microperimetry provides precise measurements of localized sensitivity deficits within the broader macular region. This is particularly important in sickle cell maculopathy, where retinal damage may be focal or develop before overt structural abnormalities are apparent. This has also led to the increased usage of microperimetry as a clinical trial endpoint measure in recent years.25,26
In this study, we found that a decrease in OCT-measured macular thickness was associated with reduced macular retinal sensitivity in children and young adults with sickle cell disease. The median decibel value (25.4 dB) in our cohort was lower than normative mesopic microperimetry thresholds in children (with anomalous defined as <26 dB). 24 Due to the inherent challenges in pediatric microperimetry testing, including difficulty in maintaining steady fixation and variable patient cooperation, we conducted a secondary subanalysis that included all 63 eyes regardless of fixation loss, to maximize data use. In this broader analysis, only the temporal perifovea showed a significant correlation between decreased OCT macular thickness and reduced retinal sensitivity. This pattern is consistent with previous reports of localized thinning in the temporal macula of patients with sickle cell disease,2,8 and supports the hypothesis that chronic, localized ischemia contributes to focal neurodegeneration. The temporal macula is considered a vascular watershed zone with terminal arteriolar supply, making it particularly vulnerable to repeated vaso-occlusive episodes.8,27 These events can lead to chronic ischemia across both the retinal and choroidal circulations, with resulting structural atrophy involving inner and outer retinal layers.
Although a greater reduction in retinal sensitivity was observed in the nasal perifovea compared with the fovea, the change in this region did not significantly correlate with change in macular thickness. The lack of correlation in other macular regions may be attributed to compensatory mechanisms, such as an increase in vessel density, as suggested by recent research. 2 These adaptive responses might help preserve macular function, expressed as a BCVA in the normal range in some patients. However, on primary analysis, we excluded eyes with fixation loss of >30%; by applying this exclusion criterion, results showed that the overall association between OCT macular thickness and mesopic microperimetry retinal sensitivity remained significant, though the correlation seen in the temporal perifoveal region did not persist, presumably due to sample size limitations.
Additionally, we observed that eyes with peripheral sickle cell retinopathy demonstrated lower temporal perifoveal retinal sensitivity on microperimetry compared with eyes without retinopathy. In our prior work, macular retinal thinning was observed to progress over time both in pediatric eyes with peripheral retinopathy and in those without peripheral retinopathy, suggesting that structural changes alone may not fully capture functional impact. 2 The present findings raise the possibility that microperimetry may be more sensitive than OCT in detecting early or subclinical functional deficits associated with peripheral disease, particularly in vulnerable macular regions.
The absence of an association between BCVA and OCT macular thickness or retinal sensitivity on microperimetry suggests that children with sickle cell disease may maintain excellent visual acuity (20/20 Snellen in this cohort) while experiencing measurable functional deficits. This highlights the limitations of relying solely on visual acuity testing in this population, as subclinical visual function loss may remain undetected. Such deficits can have implications for the patient’s scholastic performance and overall development, where educational delays may be erroneously attributed to intellectual disabilities rather than unrecognized vision challenges. Such challenges may necessitate low-vision aides, test-taking accommodations, and awareness from educators. The ability of mesopic microperimetry to detect functional deficits demonstrates its potential as a more sensitive tool compared with visual acuity testing. Currently, many pediatric patients with sickle cell disease are not routinely screened with OCT or microperimetry, despite showing evidence of early macular changes.2,28 Further larger studies would be beneficial to determine whether incorporating these tests into routine care could facilitate the detection of subtle visual changes and how these relate to visual function in daily life. 29
As we have now established a structure–function correlation in pediatric and young adults with sickle cell disease and maculopathy, there could be a role integrating advanced functional testing, like mesopic microperimetry, into future investigations of sickle cell disease. From an ophthalmologic standpoint, this could represent an evaluation of the relationship of decreased sensitivity to vascular abnormalities on OCT-angiography or fluorescein angiography. There may additionally be value in the use of functional testing and retinal thinning as biomarkers for systemic disease activity and response to new-generation treatments, including gene therapy.
This study has several limitations. The assumption of emmetropia, which facilitated mesopic microperimetry test point localization, may introduce variability, as differences in axial length among patients could impact measurements. Additionally, the challenges of testing pediatric populations, including variability in cooperation and fixation, may have influenced the accuracy of mesopic microperimetry testing. The exclusion of patients with more than 30% fixation loss, albeit necessary for data reliability and analysis, introduces potential selection bias by removing individuals who may have had worse visual function. The small sample size and cross-sectional design limit the ability to draw broader conclusions, and the absence of age-matched or healthy controls precludes direct comparative analysis. Yet, to our knowledge, this is the only investigation to date comparing OCT and mesopic microperimetry macular retinal assessments in a pediatric, adolescent, and young adult population with sickle cell disease. This study’s strengths include using a 68-point mesopic microperimetry protocol, providing a higher spatial resolution and allowing for a more precise assessment of macular sensitivity across different regions.
In conclusion, visual function loss correlating to the degree of retinal thinning was established in pediatric, adolescents, and young adult patients with sickle cell disease, with eyes affected by peripheral sickle cell retinopathy showing reduced temporal macular sensitivity. The patients in this study retained excellent visual acuity, which was not a sensitive indicator. OCT and microperimetry may provide complementary noninvasive assessments that help characterize maculopathy and subtle visual changes in this population.
Footnotes
Author Note
Presented at the ARVO Annual Meeting, May 2025, Salt Lake City, UT, USA, Advances in Pediatric Retina 2025.
Ethical Considerations
This study was conducted in accordance with the tenets of the Declaration of Helsinki. The collection and evaluation of patient health information was performed in a 1996 Health Insurance Portability and Accountability Act–compliant manner.
Consent to Participate
The study was determined to be exempt by the Boston Children’s Hospital Institutional Review Board, and the requirement for informed consent was waived because of its retrospective design.
Funding
The authors received no financial support for the research, authorship, and/or publication of this article.
Declaration of Conflicting Interests
The authors declared the following potential conflicts of interest with respect to the research, authorship, and/or publication of this article: Dr. Patel is a consultant for Alcon, Alimera, Allergan, Apellis, Biogen, Dorc, Eye Point, Genentech, Regenx Bio, and Regeneron. None of the other authors declared potential conflicts of interest with respect to the research, authorship, and/or publication of the article.