
Abstract
This study presents the application of the Taguchi design method for optimizing the surface roughness of St 52-3 mild steel in a vertical knee-type milling operation. Spindle speed (SS), depth of cut (DoC), and feed rate (FR) were considered as input parameters to evaluate the surface roughness response values using nine experimental specimens measured using the TR100 roughness tester. In the Taguchi method, an L9 orthogonal array, supported with Minitab 18 analysis, was arranged based on a 3-level design and column array. Signal-to-noise ratio analysis, analysis of variance, regression analysis, and conformity test were the four Taguchi-based analytical tools used to validate the simulated effectiveness, thereby reinforcing a stable machining operation. The overall results consequently reveal that the parameter with the greatest effect is SS, followed by DoC and FR. They highlight their established theoretical sensitivity in the milling operation by contributing 50.89%, 34.95%, and 11.98% to the surface roughness optimization respectively.
Introduction
Milling operation is essential in machining processes, where a rotating multi-point cutting tool cylindrically removes material from a workpiece to create flat and complex shapes. 1 Unlike other machining processes, such as turning, milling requires a unique relative motion and spindle axis alignment between a workpiece and cutting tool. typically facilitated either using a vertical milling machine or a horizontal machine. The horizontal milling machine is suitable for performing peripheral milling on work parts that are roughly cube-shaped, while the vertical machine is more suitable for end milling, surface contouring, etc. 2 Products produced using either of them are consequently being used to serve for various applications across different industries—aerospace, automotive, and manufacturing industries. 3
On the other hand, in the existing bulk manufacturing scenario, surface roughness, material removal rate (MRR), and chip thickness ratio are showing their significant importance in component machining, both using non-conventional and conventional machining processes. 4 Surface roughness in milling operations is a critical process to assess the quality of a particular product, especially that of mild steel, and consequently, it has received great attention from many researchers in the last three decades. 5 It directly influences the performance, operational efficiency, reliability, durability, and aesthetic appeal of a product produced as presented in Nurhaniza et al., 6 as well as increasing the productivity and competitiveness of companies. Creep life, fatigue behavior, friction, lubrication, wear, heat transmission, etc. of the milled product are mainly influenced by the surface finish. 7 In line with this, spindle speed (SS), feed rate (FR), and depth of cut (DoC) are among the core input parameters prompting for such possessions, demanding proper and effective optimization. 8 This is because achieving optimal surface finish is critical for ensuring performance and service life in the existing manufacturing process.
However, some practitioners are still often relying on traditional experiences to arrange these core parameters, leading to inefficient practices that result in material wastage, excessive tool wear, and subpar product quality. They, meanwhile, intend to use traditional optimization methods instead of utilizing to-date methods such as the Taguchi method, favorable for milling operations due to its ability to optimize multiple parameters. 9
This study is organized to address the need for the Taguchi design method for optimizing the surface roughness of a specific St 52-3 mild steel in a specific vertical knee-type milling operation. The aim is to conduct a comprehensive investigation and optimization of three core milling parameters that affect the surface roughness of a specific material, and to make analysis of experimental and predicted results using Taguchi-based design and analytical tools.
Review of related materials
Many researchers including10–14 have argued that milling parameters could systematically be arranged to optimize surface roughness of a given material. Their consensus shows optimization of different milling parameters, using different decision algorithms such as the Taguchi method, is important in terms of providing high product quality and efficient productivity. Most researchers consider parameters such as cutting speed, FR, DoC, temperature, buildup edge, and tool length as key input parameters to obtain reliable products with high surface quality. However, significant challenges remain in identifying and optimizing influential input parameters, defining the desired output responses, and selecting an appropriate optimization algorithm, which require further investigation. To address these issues and identify the existing research gap, empirical, qualitative, and notable studies conducted between 2014 and 2025 are systematically reviewed as follows, taking into account variations in workpiece types, input parameters, and applied analytical methods.
Satyanarayana et al. 15 investigated the optimization of surface roughness and MRR in CNC milling processes for EN24 steel alloy using the Taguchi method. The study examined the effects of cutting speed, FR, and DoC on machining outcomes. The results indicated that the FR and DoC were the most influential parameters affecting surface roughness. In contrast, cutting speed and FR have emerged as key determinants in improving the MRR. The study highlights the importance of carefully selecting machining parameters to enhance productivity and surface quality in practical industrial applications.
Shabbir and Survase 16 examined the vertical milling of EN24 steel alloy using two analytical tools—Analysis of variance (ANOVA) and artificial neural network (ANN). It focused on evaluating the effects of SS, FR, and DoC on surface roughness. The findings revealed that cutting speed was the most significant parameter influencing the surface roughness. Furthermore, the study emphasized the role of optimizing machining parameters to improve surface quality, offering valuable insights for manufacturing practitioners.
The study conducted by Wu and Lin 17 examined the milling of Inconel 718 using ANN techniques. It focused on evaluating the effects of the cutting speed, FR, and DoC on surface roughness. The findings demonstrated that significant improvements in surface quality could be achieved, with average roughness (Ra) values reduced to as low as 0.4 µm. This surface finish was obtained by increasing the FR by 24% while applying higher cutting speeds. The effectiveness of utilizing ANN for optimizing the milling parameters was highlighted to provide valuable insights for improving the machining performance of Inconel 718.
The study by Lee et al. 18 investigated the optimization of CNC milling operations using Nadler–Mead Simplex Method. It specifically analyzed the effects of cutting speed and FR on operational profitability, achieving a notable profit improvement of 30%. It highlights the critical role of FR as a significant parameter affecting profitability. This study furthermore emphasized the importance of optimizing machining parameters not only to improve operational efficiency but also to enhance the overall financial performance of manufacturing processes.
The study by Son and Rung 19 examined the face milling operation of C45 steel using the response surface method (RSM) to optimize the parameters. The influence of cutting speed, FR, and DoC on surface roughness was investigated. The optimal parameter combination for achieving a superior surface finish was identified as a cutting speed of 230 m/min, a FR of 0.23 mm/tool path, and a DoC of 0.888 mm. These findings provided valuable insights into improving surface quality and emphasized the significance of parameter optimization in enhancing machining performance. Kumar et al. 20 investigated the performance of a CNC milling machine equipped with a TiN-coated tool insert to machine IS 2062 mild steel. The Taguchi method was utilized to analyze the effects of cutting speed, FR, and DoC on the key performance output metrics, including MRR and surface roughness. The findings then indicated that FR was the most significant factor influencing both surface roughness and the MRR.
A study contributed by Ramya et al. 21 focused on CNC vertical face milling of aluminum alloy 6061. The Taguchi parameter design approach was utilized to optimize SS, DoC, and FR, in order to improve surface roughness and MRR. The optimal parameters’ arrangement was then found to be with a SS of 1200 rpm, a FR of 250 mm/min, and a DoC of 1.5 mm to result in enhanced machining efficiency and surface quality in milling of the aluminum alloys.
The milling process of AISI 304 stainless steel, using the Taguchi method, was, on the other hand, investigated by Pratyusha et al. 22 focusing on the effect of SS, FR, and DoC both on MRR and surface roughness. The findings revealed that FR has significantly contributed to the MRR, indicating its critical role in enhancing machining efficiency. DoC was also identified as the key parameter affecting the surface roughness.
Abbas et al. 23 examined the CNC face milling of steel using carbide inserts, using the Taguchi method. The study focused on the effects of SS, DoC, and FR on surface roughness. The findings indicated that FR has a significant effect on surface roughness, highlighting its critical role in achieving desired surface quality during the milling process. Kumar and Sreenivasulu 24 similarly focused on CNC end milling of aluminum alloy 6082 using the Taguchi method to optimize the key parameters. The effects of SS, DoC, and FR on both surface roughness and MRR were the aim targeted. The findings consequently revealed that the DoC emerged as the most influential parameter affecting the surface roughness and MRR.
The work by Naidu et al., 25 closely related to a study by Londhe, 26 was the last study surveyed for the comparative analysis in this study. It focused on the end milling process of EN-31 steel using the Taguchi method to validate the effects of SS, FR, DoC, and coolant flow on surface roughness. The findings indicated that the DoC was the most significant factor influencing surface roughness in the milling process. This highlights the importance of carefully optimizing the DoC to improve surface quality during machining operations on EN-31 steel, providing valuable insights for enhancing manufacturing processes.
Research gap
Numerous studies have extensively investigated the influence of various input parameters on different output responses in milling operations. Studies mainly published after 2020, for instance, have increasingly highlighted the combined effect of statistical and computational approaches for advanced machining optimizations. However, a critical gap remains in the integration of these tools within a unified experimental framework, particularly in the case of milling operations.
Recent studies on alloy steels, for example, suggest that the influences of cutting parameters on workpiece surface roughness and, more broadly, on the overall machining performance have not yet been comprehensively investigated. Although they potentially presented the impact of the Taguchi method for optimizing the parameters to result in quality products, they do not adequately integrate different factors, including orthogonal array design, ANOVA, signal-to-noise (S/N) ratio, regression model, and conformity testing during their unified statistical analysis. They gave limited attention to machine-specific machinability analysis, particularly involving conventional machines such as the vertical knee-type milling machine. This situation, consequently, may create a gap between academic findings and their practical applicability in small and medium-scale manufacturing enterprises, where such machines are extensively utilized.
The limitation of those studies lies not only in their limited focus on machine-specific configuration, but also in their limitations in thoroughly examining material-specific optimization, particularly in the milling arrangement of St 52-3 mild steel, a material with extensive industrial and academic applications. To the best of the author’s knowledge, no studies have examined an optimized milling arrangement for this material, despite a predominant focused on high-carbon steels, stainless steels, and composite materials.
Additionally, many prior studies do not provide comprehensive experimental validations using different workpiece specimens and quantitative evaluation of parametric contributions, although some of them have reported optimal parameter settings. The studies similarly do not explicitly establish an optimal arrangement of input parameters nor provide comprehensive statistical validation, which may limit confidence in the reported optimal conditions. As evidence of this, Table 1 provides a comparative overview of selected studies, highlighting the materials and machining processes investigated, methods and machines employed, as well as the key findings alongside the remaining gaps that require further attention.
A comparative analysis of sampled studies.
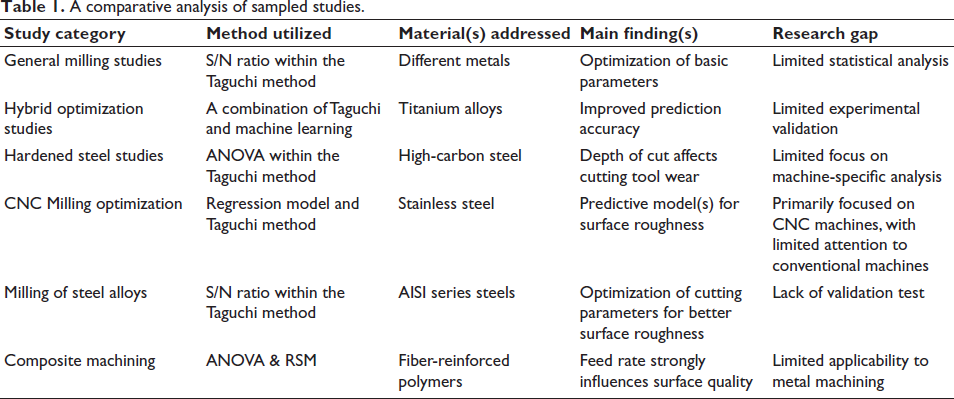
The identified gaps, therefore, highlight the need for a systematic, experimentally validated, and statistically integrated investigation that simultaneously applies Taguchi orthogonal array design, ANOVA, S/N ratio analysis, regression modeling, and confirmation testing. A focused study is required to determine the optimal machining parameters—cutting speed, FR, and DoC—in relation to the surface finish of St 52-3 mild steel.
Materials and methods
Materials selected
Workpiece
The workpiece chosen for this study is a St 52-3 mild steel. 27 This low carbon (C ≤ 0.22%) manganese steel (St 52-3) is known for its toughness, high strength, and good—approximately 70% of AISI 1112—machinability index. 28 It offers excellent weldability and dimensional stability, making it suitable for structural and mechanical applications where surface integrity is critical. Construction of bridges, buildings, mechanical components, manufacturing, beverage, and automotive sectors are some of its application areas. 29
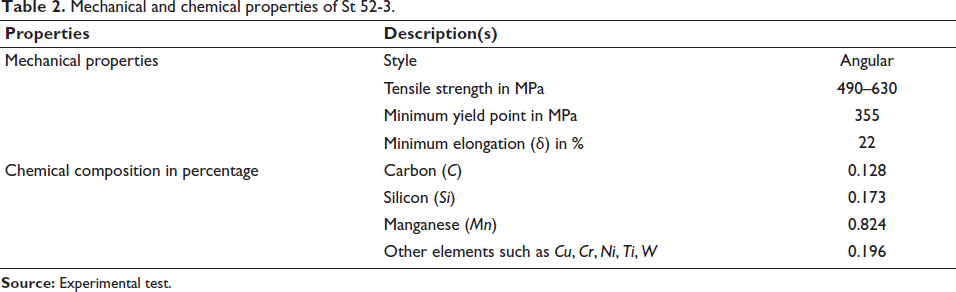
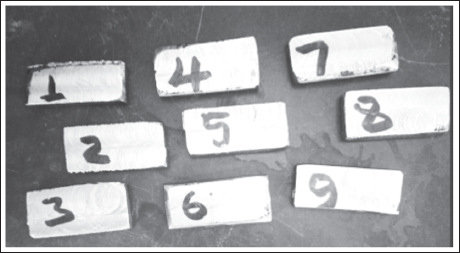
In line with the characteristics mentioned above and the mechanical and chemical properties shown in Table 2, nine specimens of St 52-3 were prepared to conduct nine experimental trials, each with dimensions of 50 mm length × 20 mm width × 10 mm thickness (Figure 1).
Mechanical and chemical properties of St 52-3.
Nine St 52-3 specimens prepared for nine experimental trials.
Cutting tool material and geometry
The cutting material selection was made considering the surface finish level of the workpiece to be milled. End mill operation was considered because it is versatile and most common milling operation applicable in die, automotive, machinery design, and in other similar industries. 30 M-type and single-point high-speed steel (HSS) cutter, with cutting speed ranging from 30 to 50 m/mm, is subsequently selected over tungsten carbide type of cutter due to its availability, wear resistance, versatility, hardness up to a temperature of 600°C, and its durability. 31 This cutting material, designed for effective chip formation and achieving desired surface finishes, was constructed considering different geometrical angles and features. Cutter diameter, cut length, thread length, flute, edge angle, helix angle, relief angle, cutting edge angle, heel, end teeth, end teeth gash, end teeth clearance, end recess, nose radius, and primary and secondary clearance land are among the geometrical angles and features that determine the cutting tool nomenclature.
Core cutting parameters
SS, FR, DoC, and emulsion coolant—a mix of water and oil for better surface finish and hence to increase productivity—are the core cutting and/or input parameters selected to enhance the required machining quality. SS is the rotational speed of a machine tool spindle measured in revolutions per minute (rpm) to determine how fast a cutting tool or workpiece spins to result in a good surface finish. 32 These parameters have been selected because they reflect both theoretical and practical dominances in controlling and governing surface finish, cutting mechanics, MRR, and tool wear. 33 They, meanwhile, are compatible with the Taguchi method and define productivity and economy of the milling operation.
Milling machine
X5040 vertical knee-type milling machine, featuring longitudinal and cross operation and vertical table feeds, has been utilized for experimental purposes. It has versatile and powerful machining operations that range up to 11kW, a rigid structure for heavy-duty milling, variable SS—ranging from 30 up to 1,500 rpm and with a spindle tapper of ISO50, and a large working table at 1,700 × 400 mm. It has the capacity to mill complex parts of materials such as wood, plastics, and metals precisely. 34 It is mainly made to incorporate a vertically adjustable knee to support the saddle for vertical movement and a saddle to enable lateral movement along the working table’s length.
Methods employed
Experimental design
The study employed a fractional experimental design using the three parameters to analyze and optimize their effects on the measured dependent variable, surface roughness. 4 For this purpose, the Taguchi method9, 35, 36 was employed using an L9 orthogonal array supported with the application of Minitab 18. The Taguchi method is selected over the other optimization methods because it defines optimal decision parameters focusing on robust orthogonal array design and on experimental-driven techniques. On the other hand, ‘smaller the better’ 37 Taguchi quality criterion was selected over the ‘nominal the best’ and ‘larger the better’ because it appropriately analyzes tool wear, surface roughness, tire wear, etc.
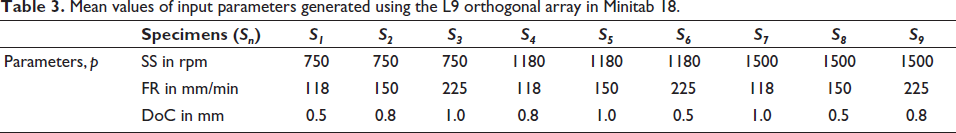
The Taguchi design method in Minitab 18 was therefore arranged based on a 3-level design with 2–13 factors and with a specified column array. The target was to systematically examine the influence of the three input parameters, their Minitab 18-generated values shown in Table 3, on the surface roughness. It also analyzes response values resulting from the nine experimental setups carried out based on the orthogonal array.
Mean values of input parameters generated using the L9 orthogonal array in Minitab 18.
Data collection
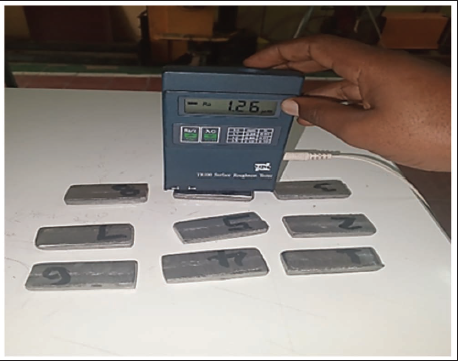
Each of the nine specimens shown in Figure 1 was milled according to an L9 orthogonal array design. Surface roughness measurements of these specimens were performed using a precise TR100 surface roughness tester, Figure 2, each with three iterated readings. The TR100 roughness tester was selected because it satisfies key calibration standards presented in,38, 39 including a precision specimen standard plate with a Ra measuring range of 0.05–10 µm, adjustable calibration capability, and suitability for flat, cylindrical, and curved surfaces.
TR-100 surface roughness tester.
Data analysis
After recording the mean surface roughness values in each experiment, the data were analyzed using the Taguchi S/N ratio approach, ANOVA, regression analysis, and conformity test. The aim was to identify the statistically significant factors and establish the optimal milling parameter combination for minimizing surface roughness.
Results
Results of the experimental milling operations show that variations in SS, FR, and DoC have produced statistically noticeable differences in the surface roughness. Subsequently, considering the influence of these parameters on the milling performance, the TR-100 tester has generated average surface roughness response values (Ra) of the nine specimens as presented in Table 4. The goal is to result in a measured mean response of 1.131.
Surface roughness response values using the TR-100 tester.
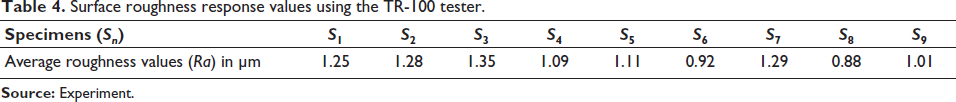
As shown in Table 4, the Ra values range from 0.88 µm in specimen-8 to 1.35 µm in specimen-3, indicating the sensitivity of the milling process to parameters’ adjustment. Notably, lower surface roughness values associate to smoother finishes, which are critical for both aesthetic and functional aspects of milled components, whereas rougher surface values indicate subordinate finishes that may negatively affect the performance of the component. 40 In line with this, optimizing the combinations of SS, FR, and DoC is most effective to obtain the optimal surface finish of the selected material.
The Taguchi analysis in this study then systematically investigated the influence of these three parameters on the overall process optimization through analyzing the mean response value of surface roughness of each parameter. Table 5 gives the process parameters’ mean values obtained using Minitab 18 analysis, where the mean value represents the average surface roughness of each parameter across three levels Lijk (with Li to denote L1, Lj to denote L2, and Lk to denote L3). Delta (δ) indicates the difference between the highest and the lowest mean response values in each parameter, and rank shows the importance of each parameter by highlighting its critical role in optimizing the milling processes, with a value of ~1 being the most significant one.
Parameters’ mean surface response values.
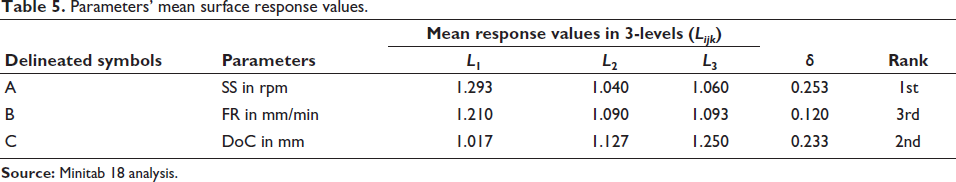
The overall results in the table reveal that the parameter with the greatest effect is SS with a δ value of 0.253, suggesting its significant contribution to a smoother surface finish and its critical role in optimizing milling operation. The parameter with the least effect is FR, with a δ value of 0.120, suggesting the variations have the least effect on surface roughness compared to the other two parameters, whereas the DoC has a medium effect with a δ value of 0.233, indicating that while affecting the quality, its impact is slightly less pronounced than that of SS.
Subsequently, considering the least mean response values of each parameter, the possible arrangement that gives better surface roughness of the specimens is A2B2C1. This arrangement shows an average reaction of the milling operation across various levels of each parameter while maintaining a constant value for the remaining parameters. In addition to analyzing the surface roughness using mean response values, the study has employed four Taguchi-based analytical tools to validate the optimal milling operation as detailed in the following sub-sections.
S/N ratio analysis
S/N ratio analysis indicates robustness and quality of a process response. A positive S/N ratio indicates the signal is stronger than the noise, while a negative S/N ratio indicates the noise is greater than the signal.
41
Within this framework and ‘the smaller the better’ criterion chosen, the mathematical model used to compute the S/N ratio in the Minitab 18 analysis is presented in Equation (1), where n is the number of samples, and yi are individual samples.
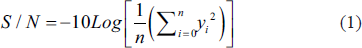
The computed results, rounded to two decimal places and shown in the last row in Table 6, then indicate that the highest S/N mean value, 0.72 from experiment #6, represents the stronger signal, whereas the lowest S/N mean value, –2.61 from experiment #3, reflects the highest level of noise. This confirms that the maximum mean of the S/N ratio is obtained at a SS of 1180 rpm, a FR of 225 mm/min, and a DoC of 0.5 mm. In contrast, the minimum mean of the S/N ratio occurred at an SS of 750 rpm, a FR of 225 mm/min, and a DoC of 1 mm.
The S/N mean values obtained using Minitab 18 analysis.
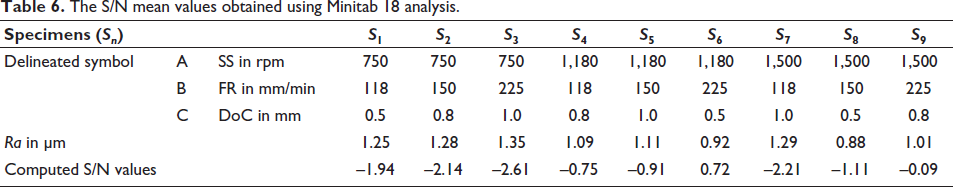
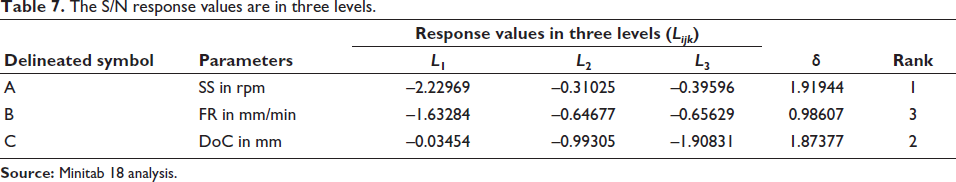
Table 7, on the other hand, presents the S/N response values in three levels generated using the Minitab 18 analysis. The δ values were used to define the ranking of the S/N responses. SS subsequently exhibits the largest δ value (1.91944) to be ranked first, followed by DoC with a δ value of 1.87377. FR had the least effect with a δ value of 0.98607. These results indicate that, for minimized surface roughness of the specimens, the optimal parameters’ arrangement is A2B2C1, to confirm that SS and DoC are the most influential parameters, with optimal values of 1180 rpm and 150 mm/min, respectively.
The S/N response values are in three levels.
Analysis of variance
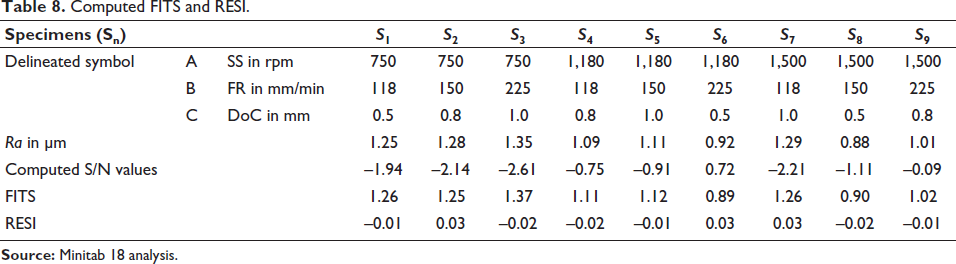
ANOVA is utilized to analyze the statistical significance of the three parameters in relation to variations in the surface roughness using the nine experimental trials. In the Minitab 18 supported experimental output, FITS (fitted values, Fijk, computed using Equation (2)) and RESI (residual values computed using Equation (3)) have served as diagnostic comparison tools. The computed results, rounded to two decimal places, are presented in the last two rows in Table 8.


Computed FITS and RESI.
The aim is to quantify the relative percentage contribution of the three parameters to the variation in surface roughness using the nine experimental trials and to evaluate their significance through the corresponding p values by representing the probability of observing an F-value as extreme as the one calculated from existing data. Table 9 summarizes all the calculated values, rounded to two decimal values, computed using Equations (4) to (9).

Where m is the parameters 1 up to p, k is the number of decision parameters, 3 in our case.

Where Seq SS(A) is variation explained by parameter A alone, Seq SS(B) is variation explained by parameter B after parameter A is included, and Seq SS(C) is variation explained by parameter C after parameter A and parameter B are included.
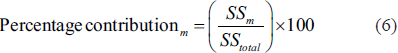
Where SSm is the sum of squares of parameter m, SStotal is the total sum of squares in the ANOVA.
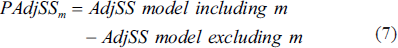
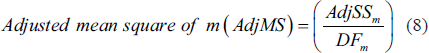
Where AdjSSm is the adjusted sum of squares of parameter m.
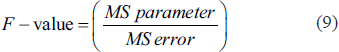
Where, MS parameter is the mean square for the parameter m, and MS error is the mean square for the error (residual).
Computed percentage contributions and p values.
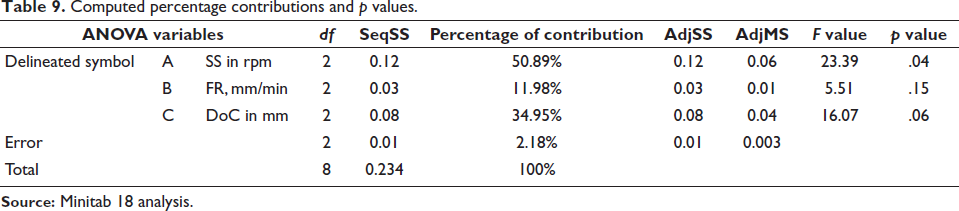
The results in Table 9 indicate that SS is the most significant parameter contributing 50.89% to the variation in surface roughness, followed by DoC and FR contributing 34.95% and 11.98%, respectively. The low p value (<.05) associated with SS further confirms the significant influence of the parameter on achieving the desired surface roughness during the milling operation.
Regression analysis
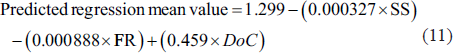
Regression analysis, baselined using Equation (10) below, is executed based on the mean value of surface roughness of each parameter and corresponding S/N ratio results.

Where, y is the predicted response (the surface roughness), b1 =m are the coefficients estimated by the regression analysis, and p1 =m are the input parameters.
The aim is to determine how the S/N ratio results are impacted by variations in surface roughness. High regression value shows a strong association between two variables, whereas a low regression value indicates a weaker association. 9
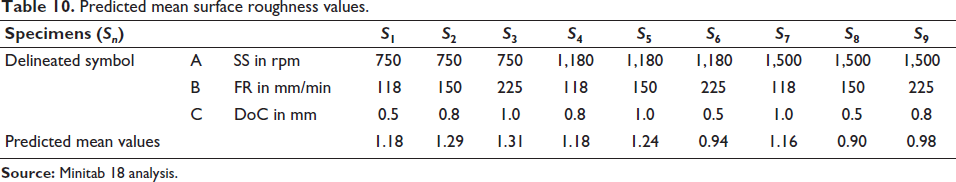
The regression equation for the mean value of the surface roughness generated using Equation (10) and Minitab 18 analysis is subsequently presented in Equation (11), followed by computed results, rounded to two decimal places, summarized at the last row in Table 10. In line with this, from the A2B2C1 arrangement presented earlier, the optimal values are 1180 rpm, 150 mm/min, and 0.5 mm for SS, FR, and DoC, respectively. This arrangement gives a predicted regression mean surface roughness value of 1.094.
Predicted mean surface roughness values.
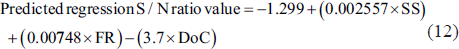
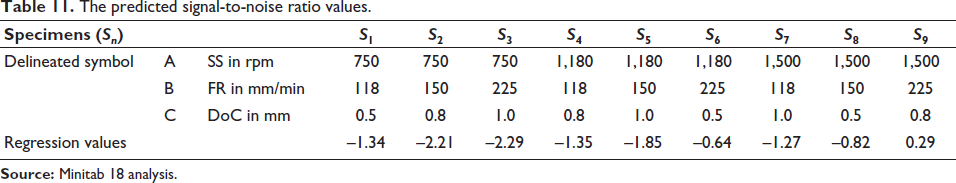
Similarly, the regression equation for the S/N ratio value of the surface roughness, generated using Equation (10) and Minitab 18 analysis, is presented in Equation (12), followed by computed results—rounded to two decimal places—summarized at the last row in Table 11. Consequently, for the A2B2C1 arrangement, the optimal regression S/N value gives –0.9657.
The predicted signal-to-noise ratio values.
Conformity testing
This is the last step, in the Taguchi design method, utilized to validate the predicted performance improvement of the surface roughness optimization with that of the experimentally measured mean surface responses. Recall from Table 4 that the experimentally measured mean response value was 1.131, and the regression model in Equation (11) resulted in a predicted mean surface roughness value of 1.094 µm for the optimal milling arrangement. These two mean values are closely aligned with each other to show that the predicted response and the experimentally measured response are complementary with each other and hence to indicate predictive accuracy.
This in turn confirms that the experimental mean surface roughness value and the predicted surface roughness value fall within the 95% confidence interval (CI), values of [1.0588, 1.2035], to validate that the prediction error is statistically accepted. The values are generated in the Minitab 18 analysis, considering the estimated effect (Coef) and the standard error of the estimated effect (SE Coef) as input variables. This subsequently presents the input parameters as the best combinations for the required surface roughness, and its consistency reinforces the reliability of the optimization process and the applicability of the Taguchi design method during the milling operation.
The conformity test results and the regression model adequacy in combination confirm the positive effectiveness of the proposed framework. The regression model developed was found to be statistically adequate and reliable, whereas the conformity results demonstrate the inclusion of both the predicted and experimental values in the 95% CI, to indicate a higher coefficient of determination and statistically significant ANOVA results.
Discussion
A rigorous explanation of the results starts with the selection of surface roughness as a response variable. It was used as the primary output variable to measure and analyze the quality influence of three decision parameters in machining a St 52-3 mild steel. As shown in Table 12, SS, DoC, and FR were identified as key optimal parameters, although each parameter exerts a different level of influence, which indicates consistency with the established machining theory. These parameters particularly play a critical role in optimizing the overall milling process. They significantly reduce milling time, enhance cost-efficiency through lower resource consumption, and allow for the precise achievement of customized performance requirements.
Process parameters and their influence on surface roughness, machining efficiency, and associated trade-offs.
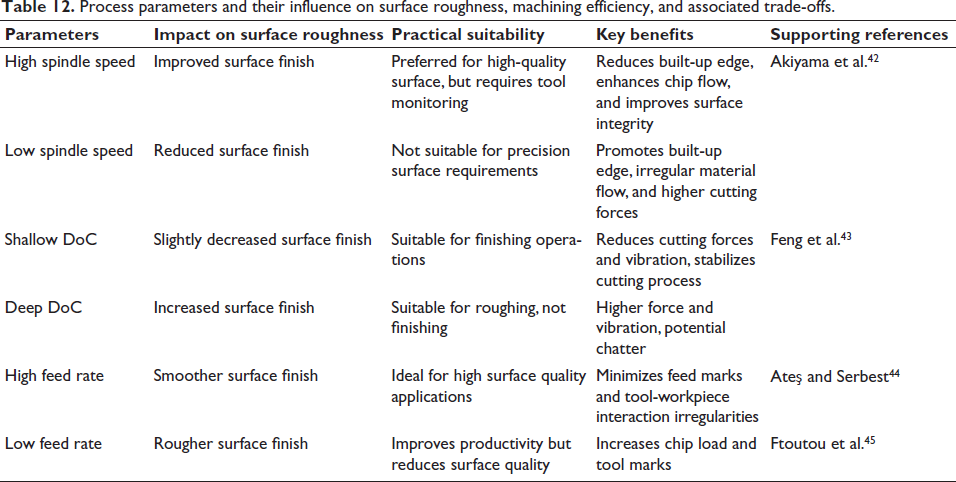
Key tribological and thermal considerations inherent in metal cutting processes have rigorously supported the discussion on SS. It is theoretically sound that higher SS reduces built-up edge formation and promotes smoother chip flow, as increased temperature at the cutting zone softens the material and reduces adhesion. These attributes improved the accuracy of surface topography and surface veracity. On the contrary, lower SS typically associates with important trade-offs, most notably accelerated tool wear resulting from thermal softening of the cutting edge.
Although the DoC appears to have a relatively minor contribution, this observation warrants a more nuanced and context-sensitive interpretation. Within the investigated range, the limited influence of a shallow DoC likely reflects its role in reducing cutting forces and suppressing process-induced vibrations. This stabilizing effect, in turn, facilitates the attainment of a smoother and higher-quality surface finish. From another perspective, DoC is widely recognized as one of the most influential parameters governing MRR and overall productivity. 33 Therefore, the conclusion should clearly emphasize the context-dependent nature of this finding, rather than presenting it as a universally applicable trend.
The role of FR is appropriately emphasized in terms of its dual influence; however, incorporating a multi-objective optimization perspective would further strengthen the discussion by shifting it from a purely descriptive analysis to a more prescriptive and decision-oriented framework. Its lower value minimizes tool marks on the surface topography through achieving smoother interaction between the workpiece and the cutting tool, as the feed directly determines the theoretical surface roughness profile. At the same time, the trade-off between increased MRR and accelerated tool wear at higher FRs was correctly identified. Hence, it was found that achieving an appropriate balance between high and controlled FRs was crucial for the effective machining performance.
Spindle running error was also identified as an important issue that has received considerable attention, as it strengthens the surface roughness trends. In the practical milling operations, the spindle does not rotate perfectly due to factors such as dynamic vibrations, imbalances, bearing imperfections, orbiting motion, radial eccentricity, etc.46, 47 These factors introduce radial and axial errors, which in turn lead to circularity deviations. Such deviations become more pronounced at low SSs and excessive depths of cut, conditions that were effectively investigated in our experiment. From the experimental results, it was found that spindle errors altered the cutter trajectory, causing the cutting tool to generate non-uniform scallops, irregular feed marks, and localized material smearing on the machined surface, ultimately resulting in a rough surface topography. Accordingly, the observed surface roughness trends in this study can be interpreted not only from a tribological perspective but also in terms of machine-tool dynamics. This suggests that surface roughness served as an indirect indicator of spindle rotational accuracy, circularity control, and dynamic cutting stability during the milling of the St 52-3 mild steel.
The novelty of this study, therefore, lies in specifically reducing the surface roughness of St 52-3 mild steel in a vertical knee-type machine configuration. It positioned itself around material-machine specificity and methodological integration by recognizing that parameter optimization using Taguchi methods is well established. It meanwhile offered a coherent and practically relevant optimization of machining parameters for St 52-3 mild steel, with strong alignment to machining theory. Its main strengths lie in contextual specificity, structured experimentation, and integrated analysis. The purpose is to ensure the structured machining process is operationally efficient.
Unlike many earlier studies, the study has principally integrated four Taguchi-based analytical tools for comprehensive statistical validation and hence for pledging a robust optimization solution. This is a strong aspect of the study, as it enhances confidence in the results and the methodological depth by discussing potential interaction effects among SS, FR, and DoC. The provision of a predictive model and a structured decision-making guide represents a meaningful step toward industrial applicability. Yet, the practical utility of these tools depends on validation under real production conditions, where variability in material properties, tool wear, and machine conditions can significantly affect outcomes. Without such validation, the proposed framework remains promising but not fully proven for widespread adoption.
Conclusion and future works
The study was designed to determine the effect of three milling parameters—SS, DoC, and FR—for optimizing surface quality of an St 52-3 mild steel in a vertical knee-type milling operation. The aim was to systematically examine the influence of these parameters on the surface roughness of the selected mild steel through organizing nine experimental setups. The application of the Taguchi method was utilized for this purpose, believing in its robust effectiveness to improve the surface roughness. It was investigated using an L9 orthogonal array supported by the application of Minitab 18 analysis. The Taguchi design in the Minitab 18 was meanwhile arranged based on a 3-level design, 2–13 factors, and a specified column array to analyzes the response values resulting from the experimental setups.
S/N ratio analysis, ANOVA, regression analysis, and conformity test were employed as Taguchi-based analytical tools to ensure the optimal parameters’ setting for creating enhanced machining performance. Four of them collectively have validated the simulated effectiveness of the Taguchi method, thereby reinforcing a stable and reliable machining process. Results, presented in the response tables, from ANOVA, for instance, show that SS is the most pronounced parameter by contributing 50.89% to the optimal surface roughness, followed by DoC with 34.95% contribution, and FR with 11.98% contribution. The TR100 tester measured surface roughness values of the nine specimens, which ranged from 0.88 to 1.35 µm, while highlighting the established theoretical sensitivity of the decision parameters in the milling operation.
The four Taguchi-based analytical methods have finally validated that, to achieve better surface roughness, the optimal parameters’ values are attained at a SS of 1180 rpm, a FR of 150 mm/min, and a DoC of 0.5 mm. A strong correlation between the experimentally measured surface roughness values and the predicted results likewise confirms the positive effectiveness of the proposed framework. It demonstrates its capability to provide valuable insights for both industrial and academic professionals by serving as a robust predictive tool for minimizing surface roughness in milling operations. It is also highlighted that spindle runout errors significantly contribute to circularity deviations, which subsequently deteriorate the surface finish quality during the milling operation.
However, the experimental setup was defined only to generate a single performance metric and a deterministic milling process. The cutting tool to workpiece combination was limited to encompass only three input parameters, which may influence surface roughness levels in industrial-scale operations. The study, meanwhile, is limited to satisfying multi-function performance responses and stochastic patterns to offer application-oriented insights for precision machining and industrial manufacturing in the existing dynamic and real industrial competitiveness. Future researchers and practitioners are therefore encouraged to further investigate and refine the proposed framework by addressing the identified limitations, thereby ensuring their continued relevance and practical applicability. Future investigation could include generating surface profilometry images using a non-contact optical profilometer to evaluate surface roughness, as well as producing a plot of Ra versus sample number to better characterize surface variability and improve data interpretation.
Footnotes
Acknowledgments
The authors gratefully acknowledge Mekelle University for its experimental and administrative contributions to apprehend the study.
Declaration of Conflict of Interests
The authors declared no potential conflicts of interest with respect to the research, authorship, and/or publication of this article.
Funding
The authors received no financial support for the research, authorship, and/or publication of this article.