
Abstract
This study investigates the integration of weather-based machine learning (ML) models in improving supply chain resilience and market forecasting accuracy for small and medium enterprises (SMEs) in Zambia. The purpose is to examine how weather-integrated forecasting systems enhance demand prediction, inventory optimization, customer retention, and marketing strategy refinement in the SME context. Using survey data from 293 SME stakeholders, the study employed structured equation modeling (SEM) to analyze the relationships among weather patterns, forecasting accuracy, system usability, and business outcomes. Findings indicate that SMEs leveraging weather-enhanced ML models achieved a 63.8% improvement in order prediction accuracy, enabling more responsive and data-driven decisions, with some recording a 46.1% increase in order predictability accuracy and 61.4% improvement in spotting market opportunities. The total effects on market opportunity identification and system usability for business planning showed a strong positive relationship. The study also explored correlations between weather patterns and market characteristics, linking item popularity to system forecasts. An intuitive application for SMEs was developed to capture and visualize market forecast data, focusing on user comfort and usability challenges. By embedding analytics into operational workflows, the research contributes to a practical and replicable framework for adaptive supply chain management and resilience building in emerging markets. This study is among the first to integrate weather-based ML forecasting with SEM analysis for African SMEs, offering original insights for data-driven decision-making and sustainable business growth.
Keywords
Introduction
The dynamic and often unpredictable nature of market environments necessitates that small and medium-scale enterprises (SMEs) adopt robust and adaptive strategies to remain competitive and resilient. In Zambia, SMEs play a pivotal role in the economy, contributing significantly to employment and the gross domestic product (GDP) (World Bank, 2020). Most SMEs in Zambia and some other parts of Africa, especially the marketers trading in commodities like tomatoes, green vegetables, and others, face inventory losses during unpredictable product-market demand due to lack of weather-aware intelligent forecast tools. Weather patterns like those of rainfall, low or high temperatures directly and indirectly affect commodity availability, pricing, and customer accessibility to the market and its needs. Imagine a trader preparing stock for a market day only to be hit by unexpected rain, which, for weather-aware ML, can pick up on such circumstances and help avoid such scenarios.
SMEs across Sub-Saharan Africa face persistent disruptions due to unpredictable weather, poor infrastructure, and lack of forecasting tools. According to Chowdhury et al. (2021), SMEs contribute nearly 55% of GDP in developing economies but remain vulnerable to supply chain (SC) shocks (Safa et al., 2021), especially in perishable goods sectors. Reports by Bancal and Ray (2024) further highlight that SMEs lose up to 50% of fresh produce annually due to lack of precise knowledge, due to lack of inadequate forecasting, and climate uncertainty. Integrating weather-aware machine learning (ML) models offers a scalable approach to address these vulnerabilities by enabling real-time, localized forecasting that directly supports business continuity.
According to recent reports, SMEs in Zambia face significant challenges from unpredictable weather shocks that disrupt demand and SCs. For example, Phiri (2010) and Prasad et al. (2023) noted that weather variability contributes to post-harvest losses of up to 100% in local markets, while Celestin et al. (2024) highlighted how limited digital forecasting tools for SMEs affect them, especially if weather conditions are not integrated into planning (Sthembiso Msomi & Nzama, 2022). These realities underscore the need for innovative ML approaches that integrate weather awareness into SC decision-making. Similarly, Chowdhury et al. (2021) noted the COVID-19-related SC disruptions and concluded that predictive analytics reduces uncertainties and improves adaptive planning in volatile environments. These studies alone highlight the importance of moving beyond descriptive literature toward analytical evaluations that justify the integration of weather-aware ML for SMEs in emerging economies, as SC management is the most critical lifeline of all market operations (Kaur et al., 2020).
However, many of the SMEs in agriculture, for instance, maize traders, face seasonal demand fluctuations tied to rainfall, winter, and other factors, such challenges as inadequate access to market, information, limited forecasting capabilities, and a lack of efficient SC management practices (Muriithi, 2017; World Bank, 2020). Addressing these challenges requires the integration of advanced market forecasting systems that can provide accurate and actionable insights, coupled with integrating weather data (Pelekamoyo & Libati, 2022) directly into the forecasting systems to address this vulnerability.
The recent advancements in structured equation modeling (SEM) have enabled a deeper understanding of the relationships between independent and dependent variables in studies. In our case, it is between SC resilience, market forecasting, and the SME performance metrics. SEMs are comprehensive statistical approaches that allow for the examination of complex relationships among observed and latent variables (Hoyle & St, 2012). By applying SEM concepts to the context of Zambian SMEs using ML models in forecasting some business variables using weather as the independent main forecasting variable, this study was able to elucidate how effectively market forecasting systems can drive business success, enhance SC resilience, and foster sustainable growth for SMEs.
This study contributes to the existing body of knowledge by enhancing the understanding of market forecasts’ impacts on people’s business livelihoods. It demonstrates that SMEs with a strong grasp of market forecast data are better positioned to anticipate and meet local demand for goods and services with adequate knowledge. This underscores the importance of data comprehension in driving effective forecasting strategies and improving business outcomes (Koufteros et al., 2005). The findings of the study equally highlight the transformative potential of market forecasting systems that use weather as the independent variable (Pelekamoyo & Libati, 2022) beyond data comprehension. By prompting changes in operational strategies, ML systems enhance organizational efficiency and adaptability, thus contributing to the literature on business process reengineering (Caeldries et al., 1994).
By using SEMs to explore relationships, this study establishes a critical link between reliable forecasting capabilities and the achievement of business objectives in areas where it matters. These insights are vital for SMEs looking to invest in forecasting systems, as they provide empirical evidence of the benefits of accurate and reliable market forecasts (Briggs et al., 1999), in areas that have a more coherent relationship to the needs of the customers. By emphasizing the importance of user-friendly interfaces and seamless integration into business workflows, the study contributes to the field of technology adoption and usability. It demonstrates that positive user experiences are crucial for the widespread adoption and effective utilization of forecasting systems (Davis, 1989), provided programmers ensure optimal user experience and system usability with optimal preferred performances (Pelekamoyo & Libati, 2023).
This study also contributes to the existing body of knowledge by empirically proving that the integration of advanced ML models (Pelekamoyo et al., 2024) with local weather attributes significantly enhances the accuracy and reliability of improved market forecasting systems, by correlating what the forecast was to what the actual variable result is, and from user experience as well. This finding contributes to the growing body of research on the application of ML in market forecasting and decision-making processes using weather in our instance (Choi et al., 2018; Pelekamoyo & Libati, 2022), which diverts from what has been the common practice.
Finally, the study shows that predictive insights from market forecasting models facilitate the development of adaptive, resilient business strategies. This contribution is particularly relevant for research on organizational resilience and strategic management, providing a framework for SMEs to navigate market uncertainties and capitalize on emerging opportunities (Teece et al., 1997). This research underscores the long-term value of forecasting systems in promoting sustainable SC practices and fostering innovation. This aligns with the broader discourse on sustainable business practices and the role of technology in achieving economic sustainability (Elkington & Jeurissen, 1997).
This study not only advances our understanding of the critical role of integrating weather in market forecasting systems in enhancing SME performance in Zambia, but also provides practical insights, using SEMs into how these enterprises can leverage advanced technologies to achieve sustainable growth and resilience. To achieve this amicably, this work derived seven secondary objectives:
Develop a weather-aware ML system for the forecasting model that integrates localized weather attributes of high and low temperature to reduce SC disruptions for Zambian SMEs by a margin for SC resilience, with a focus on fresh vegetable and house glossaries marketer SMEs. To investigate the impact of seasonal demand–supply variations on SME revenue in Zambia’s SMEs, using predictive models to reduce inventory costs during peak unfavorable seasons. Design and implement a localized personalized-level market forecasting model for household SME commodities for achieving marginally accurate localized market forecasting. Using the weather-aware ML system, to help SME identify and detect emerging risk conditions in SC, like price volatility, product availability, and others, with precision. To analyze the intricate relationship between local weather patterns and market characteristics and dynamics, such as price fluctuations and stock-outs, using the interpretable weather-aware ML system analytic records, from the SMEs perspective. Develop a mobile application for Zambian SMEs to capture market variant data, weather data, and deliver forecasts that provide usability satisfaction. Evaluate the long-term system resilience over 12 months by continuously capturing SME feedbacks longitudinally.
This study is grounded in the resource-based view (RBV) and dynamic capability theory, which explain how SMEs can leverage advanced analytics to adapt to environmental shocks. RBV highlights how digital forecasting models represent valuable, rare, and inimitable resources that provide SMEs with sustained competitive advantage (Barney, 1991), how SMEs can leverage weather-aware forecasting as a strategic resource, while dynamic capability theory positions such tool that enhances firms’ ability to sense, seize, and reconfigure resources under uncertainty. Dynamic capability theory (Teece, 2018) explains how such weather-aware ML systems enable SMEs to sense environmental shifts, seize opportunities, and reconfigure operational resources for resilience. Together, these two theoretical frames highlight how weather-aware ML systems operationalizes SC resilience for SMEs in Zambia. By aligning them with these theories, the research demonstrates the novelty of positioning weather-aware ML not only as a technological innovation but also as a strategic resource for SME competitiveness. How weather-aware forecasting strengthens SME resilience by transforming raw weather and sales data into predictive capabilities that provide sustained competitive advantage.
Related Works
Recent studies on SC resilience have highlighted the role of predictive analytics and ML in enabling adaptive responses to uncertainty by forecasting in emerging markets. For example, Ngo et al. (2022) demonstrated how adaptive ML improves demand planning under volatile and uncertain conditions. However, these approaches often lack the integration of weather data variability, leaving a critical gap in resilience-building approaches. This study builds upon prior work by embedding weather-aware ML into ensemble learning while leveraging parallelization for efficiency (Pelekamoyo, 2025; Pelekamoyo et al., 2024; Pelekamoyo & Libati, 2022). Dubey et al. (2018) showed that data analytics enhances organizational flexibility, while Chowdhury et al. (2021) concluded that predictive analytics reduces uncertainty in volatile environments. These studies thus justify the integration of weather-aware ML for SMEs in emerging economies.
Previous studies applied ML or SEM analysis separately in report writing, and none combined them in Zambian SMEs using weather data. Market forecasting is essential for the success of SMEs, particularly in developing economies like that of Zambia. Accurate forecasts enable SMEs to allocate and reallocate resources efficiently, mitigating risks, and capitalizing on market opportunities. The integration of weather parameters with advanced ML models into forecasting applications, analyzed through SEM, offers a promising approach to enhance predictive accuracy and business performance through understanding which factors are most influential and important to SMEs. However, no prior work has combined SEM, weather data, and ML for Zambian SMEs, despite their (the SMEs) unique SC vulnerabilities.
For instance, Zamani et al. (2023) talked of the advancements in Artificial Intelligence (AI), ML, and Big Data Analytics (BDA) and their significant premises for enhancing SC resilience and improving the management of SC resources. However, despite the potential advantages and the growing interest in ML and BDA within the realm of SC resilience, existing research tends to be fragmented across various streams, primarily influenced by publishing outlets. To consolidate this fragmented knowledge, the authors conducted a systematic literature review focusing on AI and BDA research related to SC resilience, specifically examining studies published in Chartered Association of Business Schools (CABS) ranked journals from 2011 to 2021. Their findings contributed to the field by evaluating the current landscape of AI and BDA in SC literature, pinpointing the stages of SC resilience, such as readiness, response, recovery, and adaptability, where AI and BDA have shown positive impacts, and synthesizing the documented advantages of AI and BDA concerning SC resilience (Zamani et al., 2023).
Sinkala (2023) found that Zambian SMEs using digital tools saw 18% faster growth, aligning with this study’s focus on ML-driven forecasting. They often face challenges such as limited access to capital, inadequate infrastructure, and insufficient technological adoption, which hinder effective market forecasting. The study (Sinkala, 2023) highlights a lack of tailored financial products and services impeding the growth of SMEs in Zambia, underscoring the need for innovative solutions to improve financial decision-making, which this study addresses.
Zhou and Gumbo (2021) reviewed that the adoption of ML models has shown potential to improve demand and supply forecasting accuracy for SMEs. A comparative analysis by the researchers demonstrated that ML techniques, when applied to financial decision-making, significantly enhance the ability to manage risks and optimize cash flows. In the context of African SMEs, a study evaluated the performance of supervised ML algorithms in predicting sales. The findings suggest that artificial neural networks (ANNs) outperform traditional methods, providing more accurate forecasts that can inform strategic decision-making.
The progress of any business and the wealth it accumulates depend upon the business environment in which it functions. Businesses of all kinds are strongly influenced by the business environment that they experience, and a good business environment ensures their prosperity. In Essmui et al. (2014), they conducted a survey of the manufacturing firms in three different commercial strong Libyan cities to determine the influence of the business environment on the growth of the sales of the firms located in these three Libyan cities. The SEM method was used, and the empirical variables were calculated for the study. The results pointed to a strong correlation between the growth of the firm’s sales and the prevailing factors of corruption, crime, financing, infrastructure, business regulations, and human capital. However, the research did not indicate any kind of relationship between the level of competition faced by the firm and its sales growth. To improve the Libyan business environment, it was necessary to frame effective policies (Essmui et al., 2014).
Shah et al. (2023) performed a comprehensive literature review on the application of AI and BDA in supply chain risk management (SCRM). Their results highlighted various modeling and application methods for utilizing AI and BDA to enhance the resilience of SC, with a particular focus on conceptual modeling rather than practical implementations, which is the main focus of this study. It was noted that AI-based approaches and SEM played a significant role, as the practical applications of AI and BDA could assist in developing risk profiles. Their study would enable decision-makers and risk managers to make quicker and more effective decisions, thereby reducing risks and increasing the resilience of the SC. Additionally, these tools can forecast risks related to disasters, epidemics, and other disruptions, which aids in choosing suppliers and determining the locations of different SC components to minimize lead times (Shah et al., 2023).
Baryannis et al. (2019) proposed that SCRM includes a diverse range of strategies designed to identify, assess, mitigate, and monitor unexpected events or conditions that may adversely affect any segment of the SC. Effective SCRM strategies typically require quick and flexible decision-making, utilizing potentially large, multidimensional data sources. This article intends to deliver an extensive review of existing SC literature related to SCRM problems, employing methods situated within the realm of AI. To achieve this, the study first explores various definitions and classifications of supply chain risk (SCR), along with related concepts like uncertainty. A subsequent mapping study categorizes the current literature based on the AI methodologies applied, which include mathematical programming, ML, and BDA, as well as the specific SCRM tasks focused on identification, assessment, or response. Ultimately, a thorough analysis of each category is provided to highlight gaps and unexplored areas, while also suggesting avenues for future research that integrate SCRM and AI (Baryannis et al., 2019).
Deiva Ganesh and Kalpana (2022) conducted a systematic literature review based on 127 papers, from which they noted that intelligent risk management can enhance the SCs to be more resilient, with digitization supporting the development of smarter SCs that can respond to disruptions. With a growing significant focus on identifying, mitigating, and managing the risks that affect the SC, the SC managers have begun to focus on decision-making based on numerous data sources for predicting the uncertainties more accurately to achieve a proactive and predictive intelligent risk management mechanism. Deiva Ganesh and Kalpana (2022) identified the various AI and ML methods applied in different phases related to SCRM and promised avenues for the future (Deiva Ganesh & Kalpana, 2022).
Emrouznejad et al. (2023) and Pournader et al. (2020) presented an examined systematic review of SCR research, focusing on content-based analysis, comprehensively examining the general factors associated with key themes and trends in SCRM, encompassing the identification and assessment of risks, risk mitigation strategies, and the influence of emerging technologies on SCRM. The review reintroduced categorization frameworks to address research gaps and provide a roadmap for future studies, thereby generating valuable insights for ensuring business continuity and resilience, emphasizing the need for organizations to adopt a proactive approach to risk management on SCRM (Emrouznejad et al., 2023; Pournader et al., 2020).
Choudhary et al. (2023) discussed the year 2020, which was earmarked as the year of global SC disruption owing to the outbreak of the coronavirus (COVID-19). It was, however, not only because of the pandemic that supply chain risk assessment (SCRA) has become more critical today than it has ever been. As the number of SCRs has increased significantly over the last decade, particularly during the last 5 years, there has been a flurry of literature on SCRM, illustrating the need for further classification to guide researchers to the most promising avenues and opportunities. Choudhary et al. (2023) conducted a bibliometric and network analysis of SCRA publications to identify research areas and underlying themes, leading to the identification of three major research clusters for which interpretation and guidance for future work were provided. In doing so, they focused in particular on the variety of parameters, analytical approaches, and characteristics of multi-criteria decision-making techniques for assessing SCRs. This offered an invaluable synthesis of the SCRA literature, providing recommendations for future research opportunities (Choudhary et al., 2023).
Gielens (2023) looked at the impact of advanced forecasting systems on retail operations and examined how advanced forecasting systems impact retail operations, while focusing on accuracy in predicting customer demand, inventory management, and strategic decision-making. The researchers assessed the impact of forecasting systems on business operations, albeit in different contexts (general business vs. retail), employing a quantitative approach utilizing surveys and data analysis to evaluate system effectiveness. They collected historical data and employed statistical methods (such as regression analysis) to analyze the predictive accuracy of the forecasting systems. The study by Gielens (2023) provides valuable insights into how forecasting systems impact operational efficiency and decision-making in retail settings, paralleling our study’s focus on broader business operations. Its findings can complement our research by offering comparative insights into sector-specific applications and the benefits of forecasting systems.
By combining ML models with SEM, this study provides a comprehensive approach to market forecasting. ML models handle large datasets and identify patterns for predictive purposes, while SEM assesses the relationships between forecasting accuracy and business performance metrics. This integrated approach enables SMEs to not only predict market trends but also understand the underlying factors influencing these trends, leading to more informed strategic decision patterns. For Zambian SMEs, adopting applications that integrate advanced ML models and SEM analysis can offer significant advantages. Such tools can enhance forecasting accuracy, optimize resource utilization, and improve overall competitiveness in the market. However, challenges such as limited access to technology and the need for capacity building must be attended. This literature review underscores the potential benefits of integrating advanced ML models and SEM analysis to improve market forecasting accuracy for SMEs in Zambia. By adopting these innovative approaches, SMEs can enhance their decision-making processes, leading to improved performance and competitiveness in the market.
Methodology
The study used a quantitative and qualitative approach to measure and analyze data related to business performance metrics and system outputs. A survey was employed on 293 stakeholders who interacted with the forecasting system application, who included mainly the marketers. A purposive sampling targeted active market traders who had smart mobile phones with the ability to access the ML-weather ware application from the Google Play Store. The survey used Likert-scale questions to gauge satisfaction levels, effectiveness ratings, and agreement with system benefits. The marketers answered the Likert-scale surveys while evaluating forecasts from the application aftermarket days. Open-ended questions were also used to gather qualitative insights on challenges faced and improvements suggested. The 293 stakeholders were purposively sampled, as they were the participants who had direct experience in interacting with the system and its outputs. The sample size of 293 is justifiable as it ensures meaningful statistical analysis and representation across different business functions.
The quantitative data were analyzed for descriptive statistics, which summarized the survey responses, and inferential statistics, which were t-tests and the one-way analysis of variance (ANOVA), to compare perceptions and outcomes across different groups. The SEM analysis was drawn and used to assess the system difference performance parameters, marketers’ perceptions, and the impacts on business variables. The qualitative data from open-ended survey responses underwent thematic analysis to identify recurring themes related to system challenges, benefits, and suggestions for improvement.
To strengthen methodological rigor, using SPSS, the confirmatory factor analysis (CFA) was conducted to assess the measurement model. Convergent validity was confirmed as average variance extracted (AVE) exceeded 0.5 for all constructs, while composite reliability (CR) value was above 0.8. These steps align with SEM best practice (Hair et al., 2019), ensuring that path coefficients are both valid and reliable. These indicators collectively demonstrate the robustness of the measurement model and ensure that the reported path coefficients reflect valid relationships between forecasting accuracy, business practices, and SME outcomes reported by the participants of the survey.
The ethical considerations were included in the study to ensure that the participants’ confidentiality was maintained, and all the data that were obtained were through informed consent, and adhering to data protection regulations as per the American Psychological Association’s ethical principles.
Presentation of Findings
Descriptive Statistics
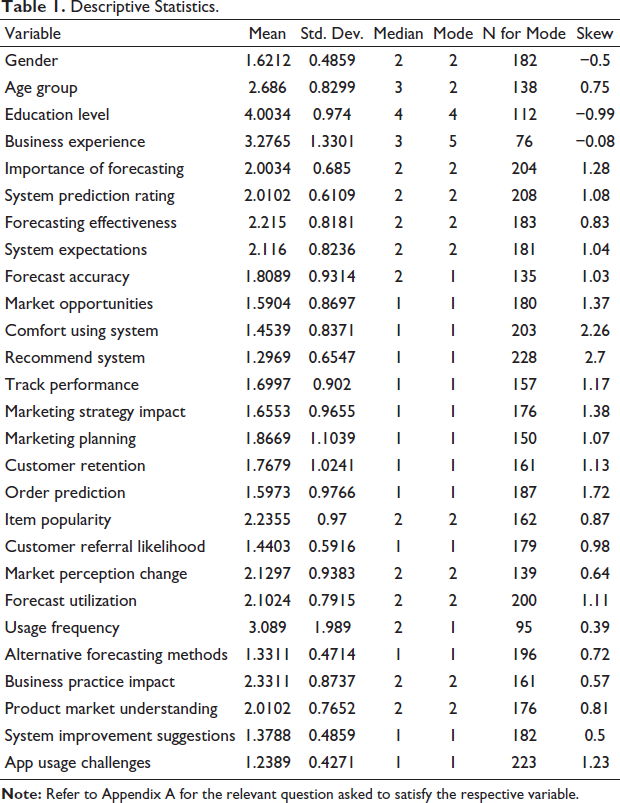
With the aid of SPSS, version 27, software, the data collected from the 293 respondents were analyzed for descriptive statistics, to review the central tendencies of the response distribution across different variables as per the questions asked, presented in Table 1.
Descriptive Statistics.
Perceptions of the System
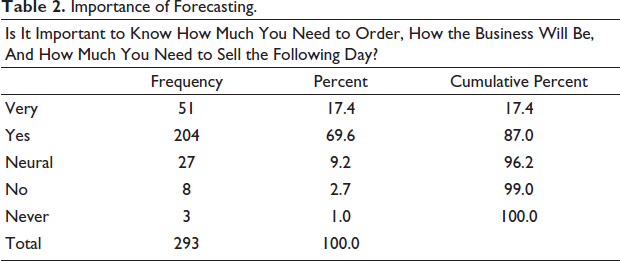
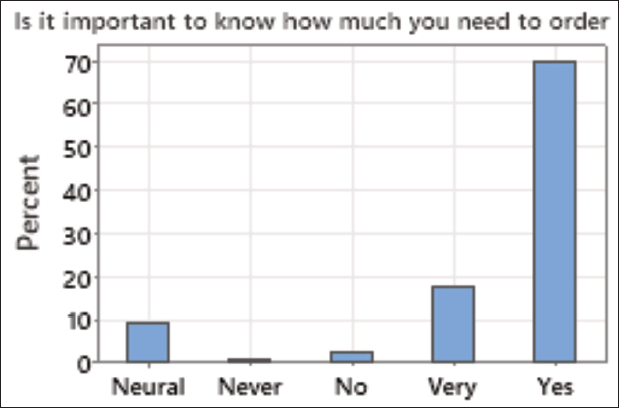
Importance of forecasting: The findings as reviled in Table 2 and Figure 1 of the respondents response to the question, “Is it important to know how much you need to order, how the business will be, and how much you need to sell the following day?” reviewed that 204, which was 69.6% of the responded, accounted for “yes,” with 51, which was 17.4%, as “very much.”
Importance of Forecasting.
Importance of Forecasting.
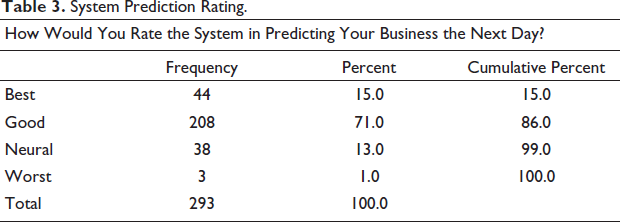
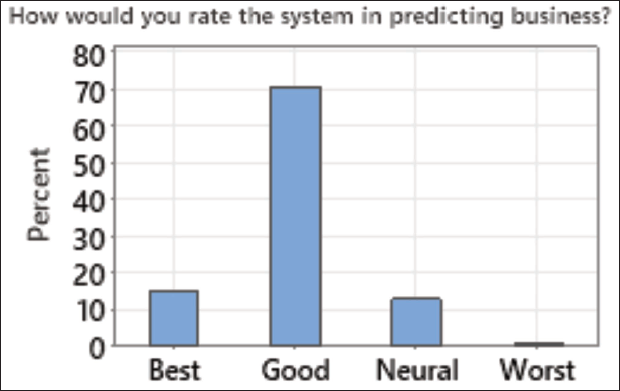
System prediction rating: While Table 3 and Figure 2 show that 208 respondents rated the system as “good,” representing 71% of the respondents, and 44 of them rated it as “best,” representing 15% of the responses.
System Prediction Rating.
System Prediction Rating.
Effectiveness of the Forecasting System
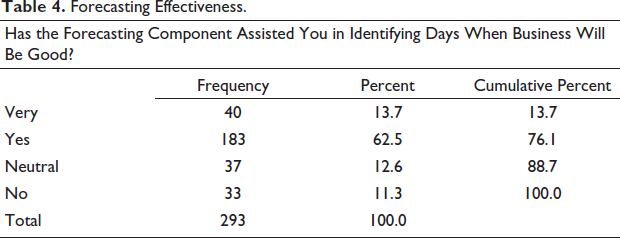
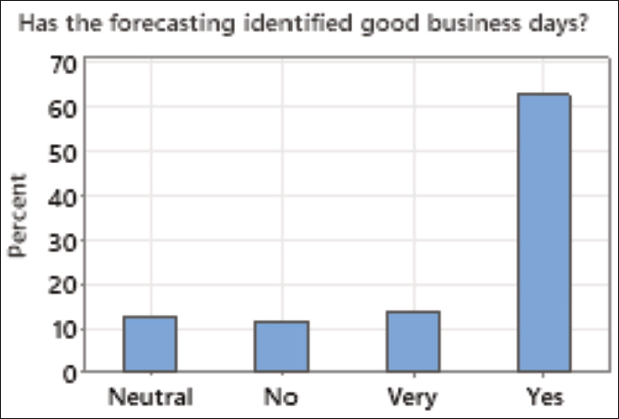
Forecasting effectiveness: When the respondents were asked, “Has the forecasting component assisted you in identifying days when business will be good?,” 183, representing 62.5%, answered “yes,” and 40, which was 13.7%, answered “very,” as indicated in Table 4 and Figure 3.
Forecasting Effectiveness.
Forecasting Effectiveness.
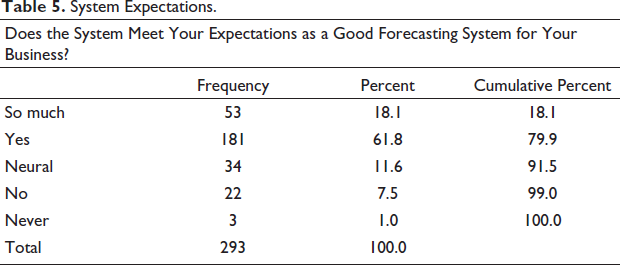
System expectations: To the question, “Does the system meet your expectations as a good forecasting system for your business?,” Figure 4 shows that the majority of the respondents answered “yes.”
System Expectations.
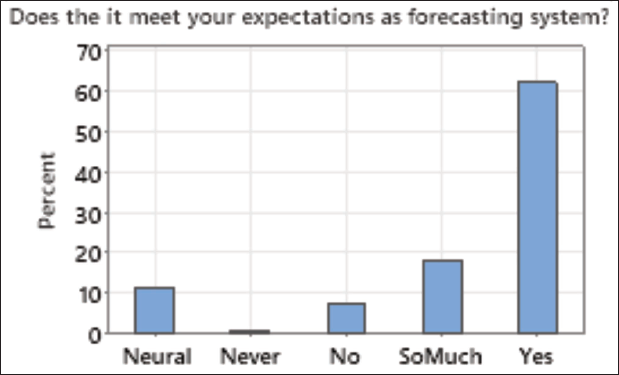
As indicated in Table 5, 181 (61.8%) answered “yes,” and 22 (7.5%) answered “no,” from the 293 respondents.
System Expectations.
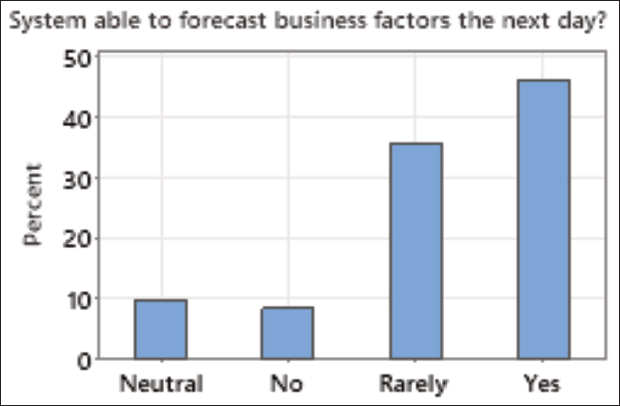
Forecast accuracy: In total, 135, which was 46.1% of the respondents, answered yes to the question, “Is the system able to forecast your business factors for the next day?,” with 104 (35.5%) answering rarely, and 25 of them, who accounted for 8.5%, saying no, as indicated in Table 6.
Forecast Accuracy.
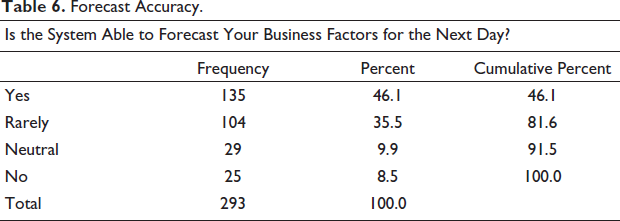
Forecast Accuracy.
Compared to manual forecasts (Silveira Netto et al., 2024), which typically achieve around very low accuracy in emerging market context forecasts, our weather-aware ML-based system improved order prediction accuracy. The survey response from respondents, baseline, reinforces that the observed gains in Figure 5 are attributable to the integration of weather data into ML-driven forecasting rather than chance or sampling effects.
Utilization of Forecast Data
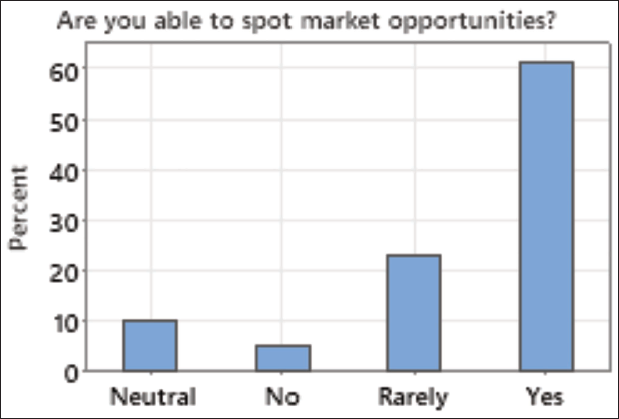
Market opportunities: Using the question “Using the forecast data from the system, are you able to spot market opportunities?,” 61.4%, which was 180 of the respondents, answered “yes,” followed by 68, which was 23.2% of the respondents, responding “rarely” do they use the forecast data from the system, to spot market opportunities, as indicated in Table 7 and Figure 6.
Market Opportunities.
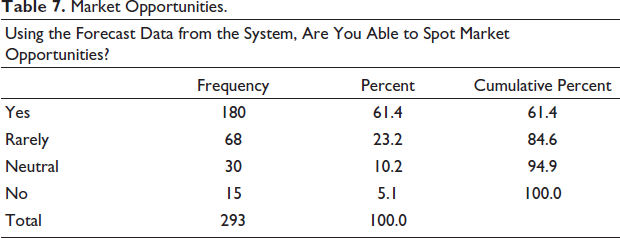
Market Opportunities.
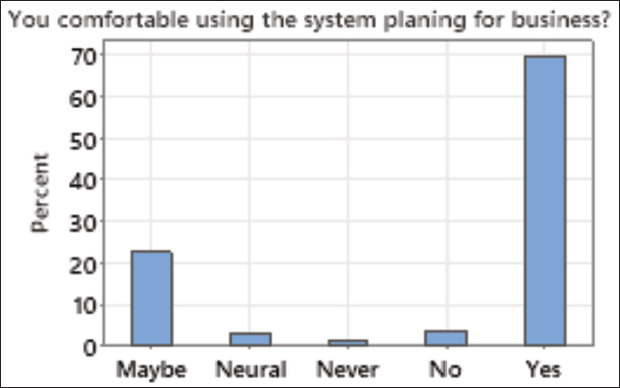
Comfort using system: When the respondents were asked, “Are you comfortable using the system to plan for business the following day?,” using Table 8 and Figure 7, most respondents, 203 accounting for 69.3%, said “yes,” followed by 66, which was 22.5%, saying “maybe” they are comfortable using the system to plan for business the following day.
Comfort Using System.
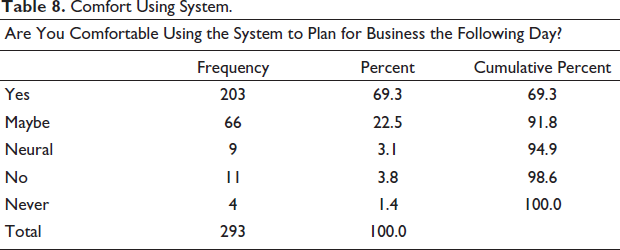
Comfort Using System.
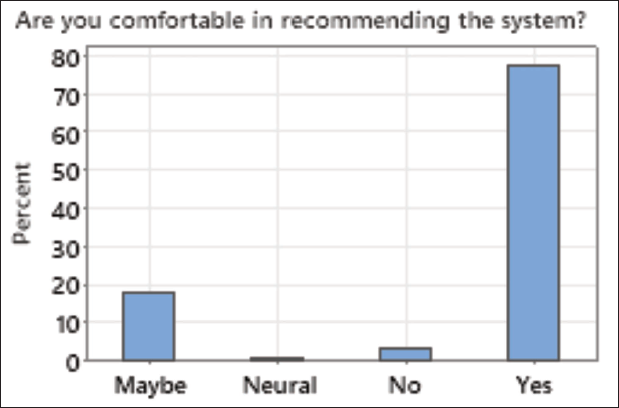
Recommend system: The respondents, as presented in Table 9, responded to the question “Are you comfortable recommending the system to your colleagues?,” with 228, 77.8%, saying “yes,” followed by 53, 18.1%, saying “maybe,” as graphically shown in Figure 8.
Recommend System.
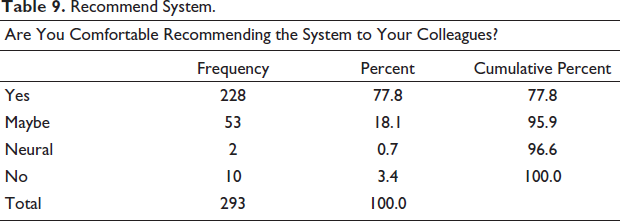
Recommend System.
Marketing and Customer Impact
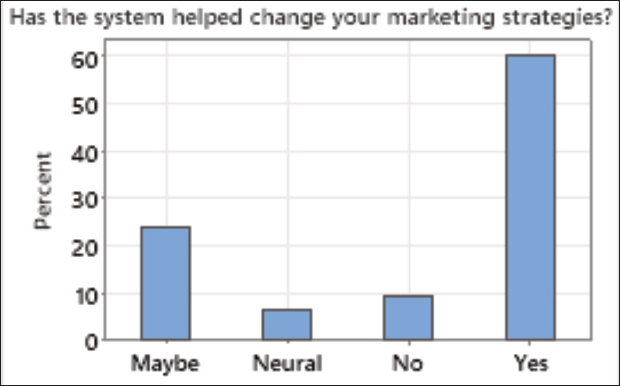
Marketing strategy impact: To the question, “Has the system helped you change your marketing strategies?,” 60.1%, which was 176 respondents, answered “yes,” with 70, 23.9%, saying “maybe,” to the question, as shown in Table 10 and Figure 9.
Marketing Strategy Impact.
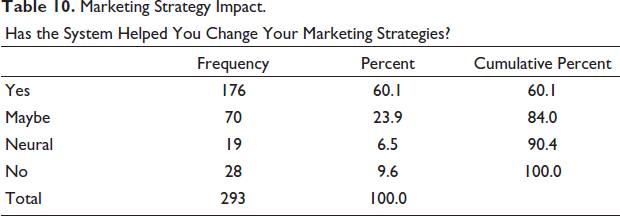
Marketing Strategy Impact.
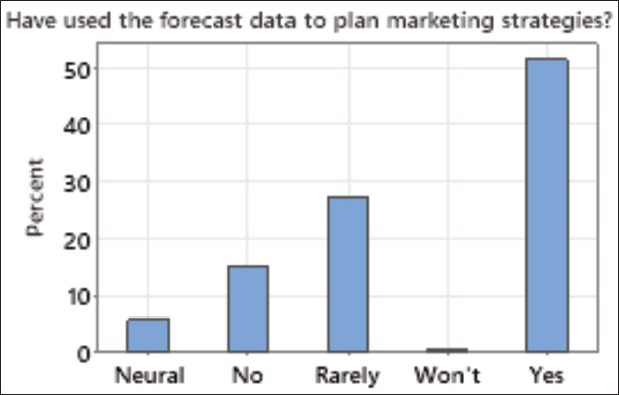
Marketing planning: With market planning, the respondents were asked, “Have you used the forecast data to help plan for your marketing strategies?,” 51.2%, which were 150 of them, said “yes,” and 80 respondents, which was 27.3%, responded “rarely,” as shown in Table 11 and Figure 10.
Marketing Planning.
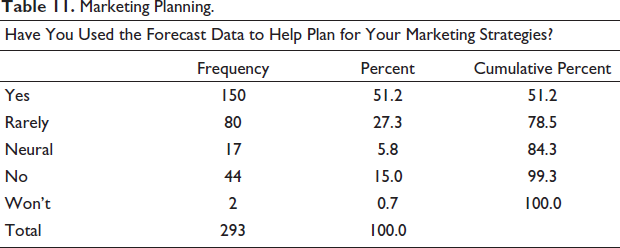
Marketing Planning.
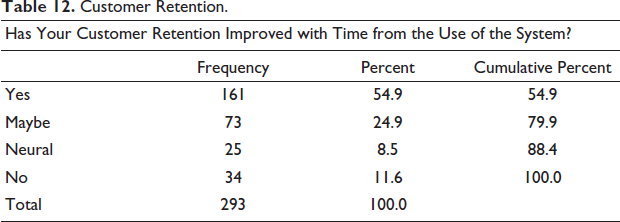
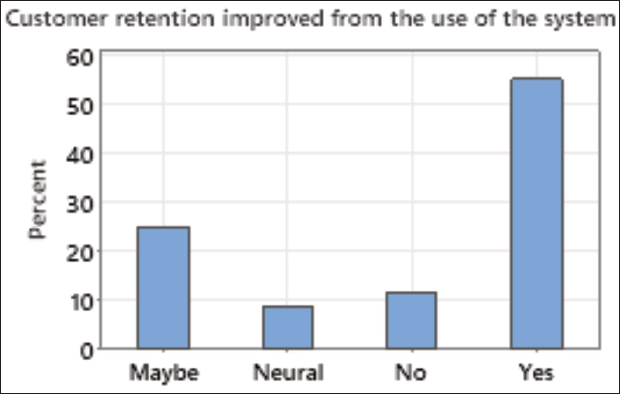
Customer retention: With regards to customer retention increasing from the system usage, the respondents answered to the question, “Has your customer retention improved with time from the use of the system?,” “yes” with 161 respondents, accounting for 54.6%, 73, 24.9%, saying “maybe,” and 11.6%, which was 34 of them, saying “no,” as indicated in Table 12 and Figure 11.
Customer Retention.
Customer Retention.
Operational Impact
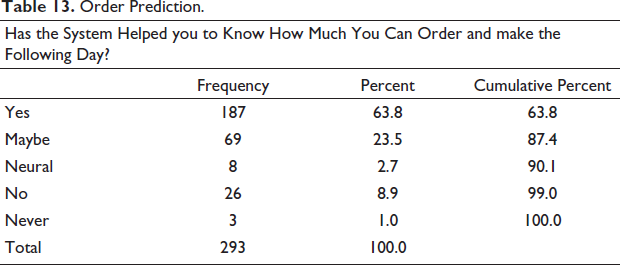
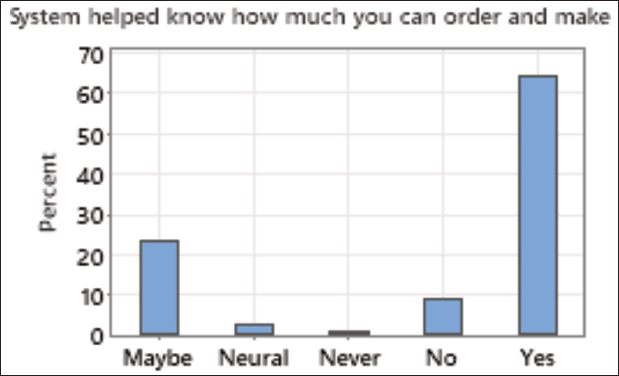
Order prediction: From Table 13 and as shown in Figure 12, most respondents, 187, representing 63.8%, responded “yes,” when asked, “Has the system helped you to know how much you can order and make the following day?” and 69, 23.5%, answered “maybe” to the question. While 26, 8.9%, of the respondents said “no.”
Order Prediction.
Order Prediction.
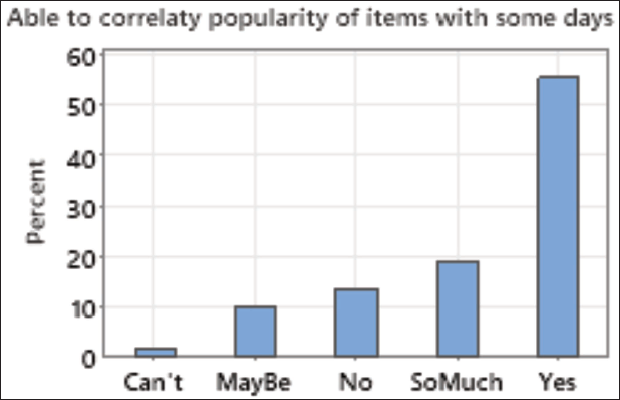
Item popularity: With the products’ popularity on the market, the respondents were asked, “Are you able to correlate the popularity of certain items for some days with the system’s forecast?,” and 56 of them, 19.1% respondents, “so much,” with 162, 55.3%, responding “yes,” 30 of them, which was 10.2%, saying “maybe,” as shown in Table 14 and Figure 13.
Item Popularity.
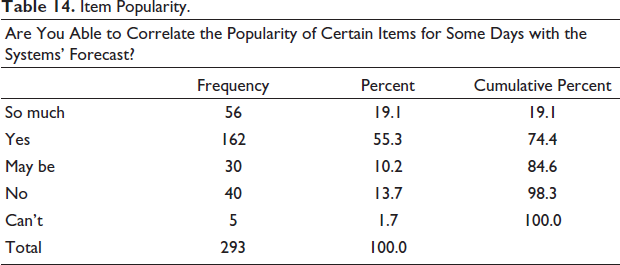
Item Popularity.
Customer Satisfaction and Business Changes
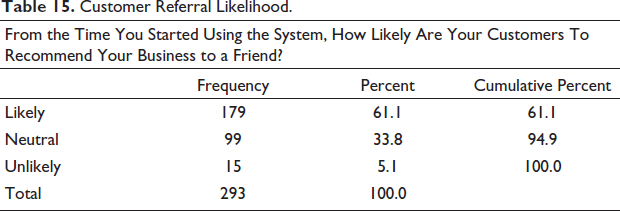
Customer referral likelihood: From Table 15, using the question, “From the time you started using the system, how likely are your customers to recommend your business to a friend?,” 179 respondents, 61.1%, responded with “likely,” followed by 99 of them, which was 33.8%, who were “neutral.”
Customer Referral Likelihood.
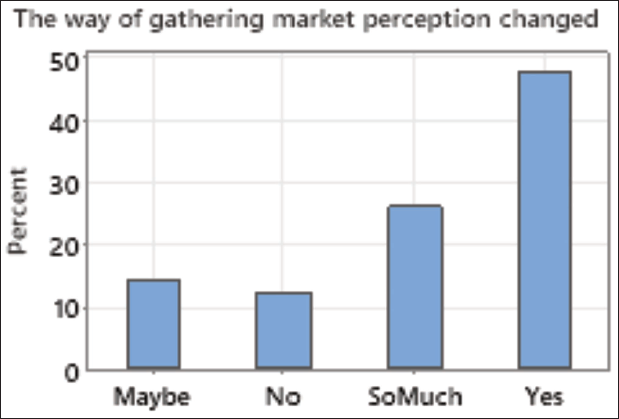
Market perception change: While Table 16 shows that 25.9%, which were 76 of the respondents, responding “so much,” with 139, 47.4% of the respondents, responding “yes,” to the question “Has the way you gather market perception changed since you started using the system?,” and the responses are equally graphically shown in Figure 14.
Market Perception Change.
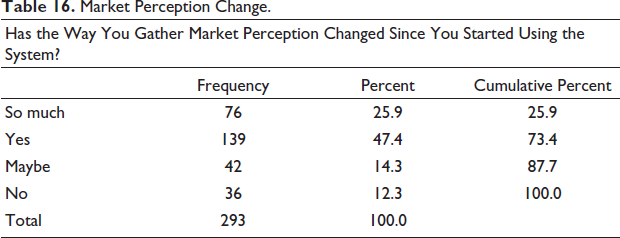
Market Perception Change.
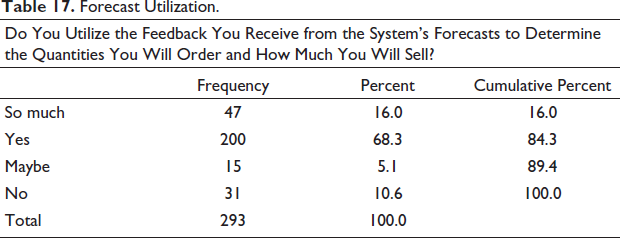
Forecast utilization: With the utilization of the forecast data, Table 17 shows the respondents response to the question “Do you utilize the feedback you receive from the system’s forecasts to determine the quantities you will order and how much you will sell?,” and 200 of them, accounting for 68.3%, answered “yes,” with 47, 16%, saying “so much.”
Forecast Utilization.
System Usage and Challenges
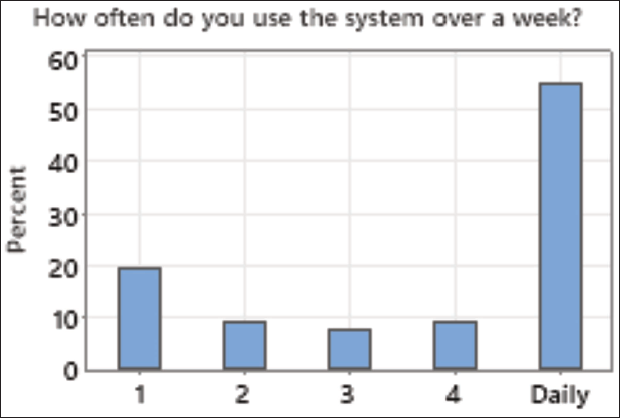
Usage frequency: The respondents’ responses to the question, “How often do you use the system to foresee your business over a week?,” are in Table 18, with 95, 32.4%, saying “none,” 66, which was 22.5%, saying “daily,” 57, which was 19.5%, saying “1,” 26, 8.9%, saying “2,” and 23, which was 7.8%, saying “3” times in a week, according to Table 18 and Figure 15.
Usage Frequency.
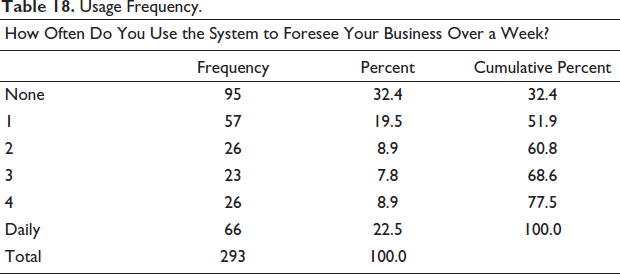
Usage Frequency.
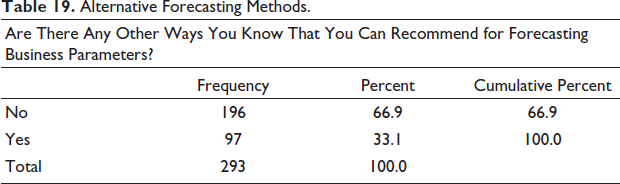
Alternative forecasting methods: From Table 19, about 196, which was 66.9% of the respondents, answered “no” to the question “Are there any other ways you know that you can recommend, for forecasting business parameters?”.
Alternative Forecasting Methods.
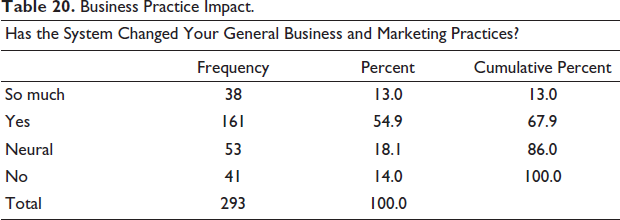
Business practice impact: In total, 161 respondents, who accounted for 54.9%, said “yes” to the question “Has the system changed your general business and marketing practices?,” which is represented in Table 20.
Business Practice Impact.
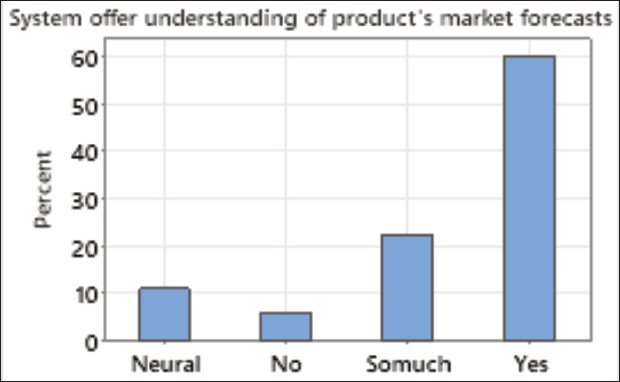
Product market understanding: The respondents’ responses to the query “Does the system offer you a good understanding of your product’s market forecast data?” are in Table 21, with 176, which was 60.1%, answering “yes,” followed by 66 of them, which was 22.5%, saying “so much,” to the question, as graphically represented in Figure 16.
Product Market Understanding.
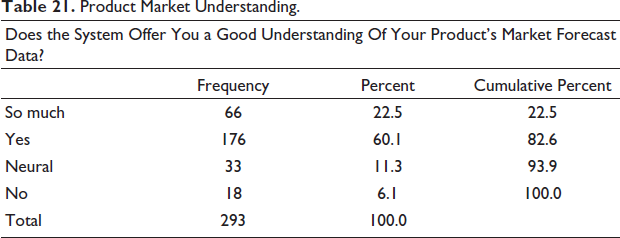
Product Market Understanding.
Suggestions for Improvement
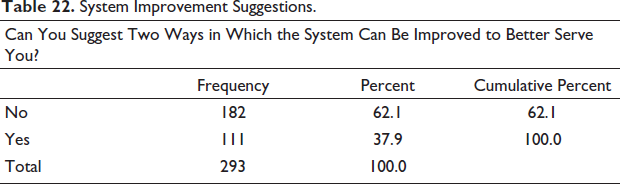
System improvement suggestions: In total, 182, 62.1% of the respondents, said “no,” they cannot suggest any ways in which the system can be improved to serve them better, and only 37.9%, 111 of them, suggested some areas of improvement, as shown in Table 22.
System Improvement Suggestions.
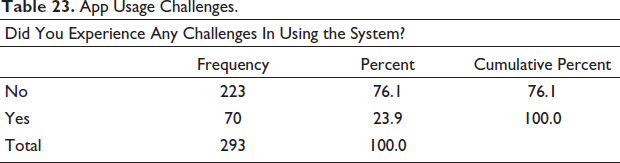
App usage challenges: In total, 223 of the respondents, which was 76.1% of them, as indicated in Table 23, did not experience any challenges in using the system.
App Usage Challenges.
SEM Statistical Presentation
The Study Objective: Maximum Likelihood Estimates for the Regression Weights with Respect to Various Study (Variable) Factors
The survey study aimed to collect insights from users of a forecasting system and to evaluate its impact on users’ perception, marketing, operations, and customer satisfaction. This evaluation sought to examine the extent to which the system met the user needs, its positive influence on their business decisions, and its contribution to their overall success. Insights from the users of a forecasting system were analyzed using SEM, on how the different variables of the study influenced and how much influence each variable had on the main objective of the study. The results are indicated in Figure 17 and Table 24.
SEM Results of the Insights from Users of a Forecasting System.
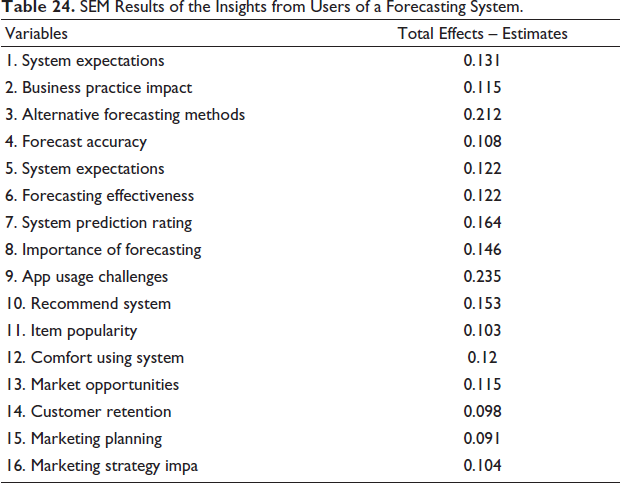
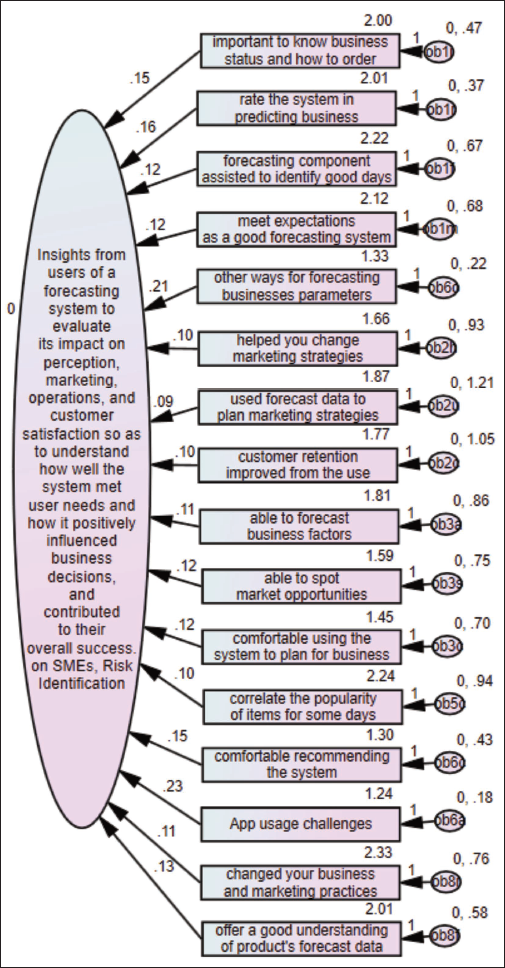
From Figure 17 and Table 24, we can observe that the:
The total direct (unmediated) and indirect (mediated) effect of the factor “product market understanding,” from the question “Does the system offer you a good understanding of your product’s market forecast data?” on the study objective, which was to study the impact of ML on forecasting and predicting local goods and services demand and supply for SMEs, was 0.131. This implies that if this factor goes up by 1, the main objective goes up by 0.131 as well, which shows a positive relationship. The total direct (unmediated) and indirect (mediated) effect of the factor “business practice impact” from the question “Has the system changed your general business and marketing practices?” on the main objective was 0.115. The positive relationship indicates that positive changes in business and marketing practices through the system have a corresponding positive influence on the main objective. The total direct and indirect effect of the factor “alternative forecasting methods” from the question “Are there any other ways, you know which you can recommend, for forecasting business parameters?” on the main objective was 0.212, suggesting a substantial positive impact. The total effect of the factor “forecast accuracy,” from the question “Is the system able to forecast your business factors for the next day?” on the main objective was 0.108, suggesting that effective business forecasting through the system positively influences the main objective. The total effect of the factor “system expectations” from the asked question “Does the system meet your expectations as a good forecasting system for your business?” on the main objective was 0.122, suggesting that a system meeting expectations for forecasting positively impacts the main objective. The total effect of the factor “forecasting effectiveness,” from the question “Has the forecasting component assisted you to identify days when business will be good?” on the main objective was 0.122. If the ability to identify market good days increases by 1, the main objective is expected to increase by 0.122. This reveals a positive relationship, indicating that the capacity to identify favorable market days influences the main objective positively. The total effect of the “system prediction rating” factor using the question “How would you rate the system in predicting your business the next day?” on the main objective was 0.164. If the forecast rating of the application increases by 1, the main objective is expected to increase by 0.164. This suggests a positive impact, signifying that higher forecast ratings contribute positively to the main objective. The total effect of the factor “importance of forecasting” from the response to the question “Is it important to know how much you need to order, how the business will be, and how much you need to sell the following day?” on the main objective was 0.146, showing a positive relationship, indicating that considering business as important has a positive impact on the main objective. The total effect of the factor “Did you experience any challenges in using the system?” on the main objective is 0.235. If overcoming challenges in app usage increases by 1, the main objective is expected to increase by 0.235. This indicates a strong positive impact, suggesting that successfully addressing challenges related to app usage significantly contributes to the improvement of the main objective. The total effect of the factor “Are you comfortable recommending the system to your colleagues?” on the main objective is 0.153. If the comfort level in recommending the system to colleagues increases by 1, the main objective is expected to increase by 0.153. This implies a positive relationship, suggesting that being comfortable recommending the system positively influences the main objective. The total effect of the factor “Are you able to correlate the popularity of certain items for some days with the systems’ forecast?” on the main objective is 0.103. If the ability to correlate the popularity of certain items increases by 1, the main objective is expected to increase by 0.103. This implies a positive correlation, indicating that the capability to correlate item popularity positively affects the main objective. The total effect of the factor “Are you comfortable using the system to plan for business the following day?” on the main objective is 0.120. If the comfort level in using the system to plan for business factors increases by 1, the main objective is expected to increase by 0.120. This indicates a positive relationship, suggesting that being comfortable using the system for business planning positively impacts the main objective. The total effect of the factor “Using the forecast data from the system, are you able to spot market opportunities?” on the main objective is 0.115. If the ability to spot market trends using forecast data increases by 1, the main objective is expected to increase by 0.115. This implies a positive correlation, suggesting that the capacity to spot market trends positively influences the main objective. The total effect of the factor “Has your customer retention improved with time from the use of the system?” on the main objective is 0.098. If the improvement in customer retention over time from system use increases by 1, the main objective is expected to increase by 0.098. This implies a positive relationship, indicating that enhanced customer retention positively impacts the main objective. The total effect of the factor “Have you used the forecast data to help plan for your marketing strategies?” on the main objective is 0.091. If the usage of forecast data for marketing planning increases by 1, the main objective is expected to increase by 0.091. This indicates a positive correlation, suggesting that utilizing forecast data for marketing planning positively influences the main objective. The total effect of the factor “Has the system helped you change your marketing strategies?” on the main objective is 0.104. If the system has helped in changing marketing strategies and practices, the main objective is expected to increase by 0.104. This implies a positive relationship, suggesting that the system positively impacting marketing strategies contributes to the improvement of the main objective.
SEM Maximum Likelihood Estimates for the Regression Weights for the Specific Objectives to Variable Presentations
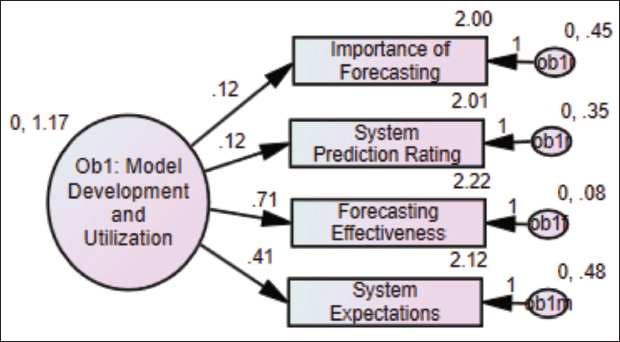
Objective 1: Develop a weather-aware ML system for the forecasting model that integrates localized weather attributes of high and low temperature to reduce SC disruptions for Zambian SMEs by a margin for SC resilience, with a focus on fresh vegetable and house glossaries marketer SMEs.
Figure 18 explores the relationships of the direct (unmediated) effect of the objective, to develop advanced ML models that leverage local weather attributes, including low and high temperatures, to forecast and predict the demand and supply dynamics of local goods and services, to enhance SC resilience in the face of changing climate conditions (Ob1: Model Development and Utilization), on different variables.
The effect of the specific objective on the variable “meet expectations as a good forecasting system” from the question “Is it important to know how much you need to order, how the business will be, and how much you need to sell on the following day?” is 0.115. That is, due to the direct (unmediated) effect of Objective 1 on this variable, when Objective 1 goes up by 1, this variable goes up by 0.115. This is in addition to any indirect (mediated) effect that Objective 1 may have on this variable.
The direct (unmediated) effect of Objective 1 on a variable, “rate the system in predicting businesses” from the question “How would you rate the system in predicting your business the next day?” is 0.123. That is, due to the direct (unmediated) effect of Objective 1 on this variable, when Objective 1 goes up by 1, the variable goes up by 0.123. This is in addition to any indirect (mediated) effect that Objective 1 may have on this variable.
The direct (unmediated) effect of Objective 1 on the variable “forecasting component assisted to identify good days” from the question “Has the forecasting component assisted you to identify days when business will be good?” is 0.708. That is, due to the direct (unmediated) effect of Objective 1 on a variable, when Objective 1 goes up by 1, the variable goes up by 0.708. This is in addition to any indirect (mediated) effect that Objective 1 may have on this variable.
The direct (unmediated) effect of Objective 1 on the variable “meet expectations as a good forecasting system,” from the question “Does the system meet your expectations as a good forecasting system for your business?” is 0.405. That is, due to the direct (unmediated) effect of Objective 1 on the variable, when Objective 1 goes up by 1, the variable goes up by 0.405. This is in addition to any indirect (mediated) effect that Objective 1 may have on the variable.
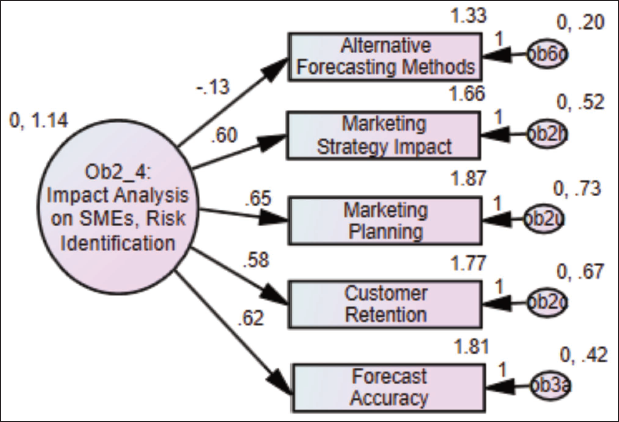
Objective 2: To investigate the impact of seasonal demand–supply variations on SME revenue on Zambia’s SMEs, using predictive models to reduce inventory costs during peak unfavorable seasons; and Objective 4: Using the weather-aware ML system, to help SME identify and detect emerging risk conditions in SC, like price volatility, product availability, and others, with precision.
The second objective was to explore how the predictions of seasonal variations in demand and supply, driven by local weather patterns, affect SMEs in Zambia. Assess the implications of climate-induced fluctuations on SME operations and profitability. Married with the fourth (4) objective, which was investigating the potential of ML to identify emerging risk conditions for businesses on a day-to-day basis, especially for SMEs. Utilize neural network forecasts generated from weather data to enable timely, data-driven actions that mitigate SCRs. The effects of the two objectives were explored using the SEM, as shown in Figure 3 and the results follow:
The direct (unmediated) effect of Objectives 2 and 4 on the variable “other ways for forecasting businesses parameters” from the question “Are there any other ways, you know which you can recommend, for forecasting businesses parameters?” is −0.129. That is, due to the direct (unmediated) effect of Objectives 2 and 4 on the variable, when Objectives 2 and 4 go up by 1, the variable goes down by 0.129. This is in addition to any indirect (mediated) effect that Objectives 2 and 4 may have on the variable.
The total (direct and indirect) effect of Objectives 2 and 4 on the variable “helped you change marketing strategies” from the question “Has the system changed your general business and marketing practices?” is 0.600. That is, due to both direct (unmediated) and indirect (mediated) effects of Objectives 2 and 4 on the variable, when Objectives 2 and 4 go up by 1, the variable goes up by 0.6.
The total (direct and indirect) effect of Objectives 2 and 4 on the variable “used forecast data to plan marketing strategies” from the question “Have you used the forecast data to help plan for your marketing strategies?” is 0.650. That is, due to both direct (unmediated) and indirect (mediated) effects of Objectives 2 and 4 on the variable, when Objectives 2 and 4 go up by 1, the variable goes up by 0.65.
The total (direct and indirect) effect of Objectives 2 and 4 on the variable “customer retention improved from the use” is 0.577 from the question “Has your customer retention improved with time from the use of the system?”. That is, due to both direct (unmediated) and indirect (mediated) effects of Objectives 2 and 4 on the variable, when Objectives 2 and 4 go up by 1, this variable goes up by 0.577.
The total (direct and indirect) effect of Objectives 2 and 4 on the variable “able to forecast business factors” from the question “Is the system able to forecast your business factors for the next day?” is 0.622. That is, due to both direct (unmediated) and indirect (mediated) effects of Objectives 2 and 4 on this variable, when Objectives 2 and 4 go up by 1, this variable goes up by 0.622.
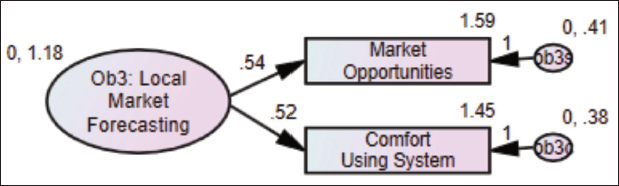
Objective 3: Design and implement a localized personalized-level market forecasting model for household SME commodities for achieving marginally accurate localized market forecasting.
The third objective sought to design and implement a model that provides highly accurate forecasts for the demand and supply of goods and services within the local household and SME markets. This model considered factors such as goods availability and cash flow, contributing to improved market forecasting. The objective’s direct (unmediated) effect on different variables is shown in Figure 4, where:
The total (direct and indirect) effect of Objective 3 on the variable “able to spot market opportunities” from the question “Using the forecast data from the system, are you able to spot market opportunities?” is 0.539. That is, due to both direct (unmediated) and indirect (mediated) effects of Objective 3 on this variable, when Objective 3 goes up by 1, this variable goes up by 0.539.
The total (direct and indirect) effect of Objective 3 on the variable “comfortable using the system to plan for business” from the question “Are you comfortable using the system to plan for business the following day?” is 0.519. That is, due to both direct (unmediated) and indirect (mediated) effects of Objective 3 on this variable, when Objective 3 goes up by 1, this variable goes up by 0.519.
Objective 5: To analyze the intricate relationship between local weather patterns and market characteristics and dynamics, such as price fluctuations and stock-outs, using the interpretable weather-aware ML system analytic records, from the SMEs’ perspective.
The fifth objective was to examine the intricate relationships between local weather patterns and the demand and supply characteristics of goods and services within the market. Employ ML, specifically ANNs, to forecast these market traits and validate them against actual data. And from Figure 5, the SEM results follow that:
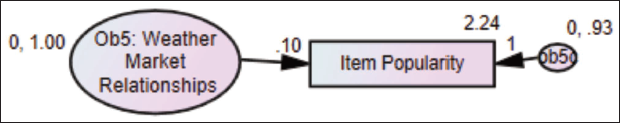
The total (direct and indirect) effect of Objective 5 on the variable “correlate the popularity of items for some days” from the question “Are you able to correlate the popularity of certain items for some days with the system’s forecast?” is 0.10. That is, due to both direct (unmediated) and indirect (mediated) effects of Objective 5 on this variable, when Objective 5 goes up by 1, this variable goes up by 0.10.
Objective 6: Develop an intuitive application for SMEs to capture information for market forecasts.
The sixth objective of the study was to develop a mobile application for Zambian SMEs to capture market variant data, weather data, and deliver forecasts that provide usability satisfaction. The application was equipped with user-friendly interfaces and application programming interfaces (APIs), which empowered SMEs to seamlessly capture daily information essential for generating market forecasts and predictions, fostering data-driven decision-making. After computing the results in an SEM, Figure 6, it is observed that:
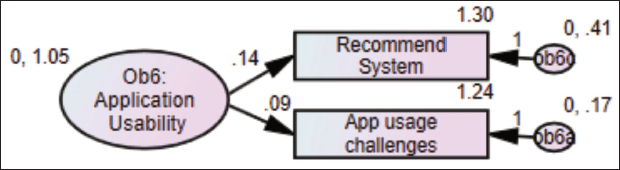
The direct (unmediated) effect of Objective 6 on the variable “comfortable recommending the system” from the question “Are you comfortable recommending the system to your colleagues?” is 0.145. That is, due to the direct (unmediated) effect of Objective 6 on the variable, when Objective 6 goes up by 1, this variable goes up by 0.145. This is in addition to any indirect (mediated) effect that Objective 6 may have on this variable.
The direct (unmediated) effect of Objective 6 on the variable “App usage challenges” from the question “Did you experience any challenges in using the system?” is 0.095. That is, due to the direct (unmediated) effect of Objective 6 on this variable, when Objective 6 goes up by 1, this variable goes up by 0.095. This is in addition to any indirect (mediated) effect that Objective 6 may have on this variable.
Objective 7: Evaluate the long-term system resilience over 12 months by continuously capturing SME feedbacks longitudinally.
The eighth objective was to evaluate the long-term resilience and sustainability of the developed forecasting system and assess its adaptability to evolving market dynamics, changing weather patterns, and emerging technological advancements. Evaluate the long-term resilience and sustainability of the developed forecasting system. Assess its adaptability to evolving market dynamics, changing weather patterns, and emerging technological advancements, to provide enduring support to small and medium-scale enterprises (SMEs) in Zambia and promote sustainable SCs.Figure 7 shows how the objective interacts with different variables through the analysis by SEM, whose results show:
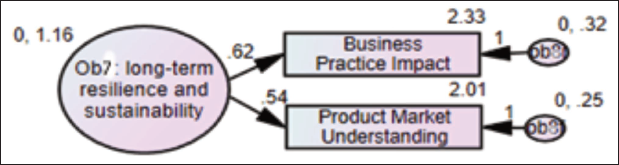
The direct (unmediated) effect of Objective 7 on the variable “changed your business and marketing practices” from the question “Has the system changed your general business and marketing practices?” is 0.616. That is, due to the direct (unmediated) effect of Objective 7 on the variable, when Objective 7 goes up by 1, the variable goes up by 0.616. This is in addition to any indirect (mediated) effect that Objective 8 may have on the variable.
The direct (unmediated) effect of Objective 8 on the variable “offer a good understanding of product’s forecast data” from the question “Does the system offer you a good understanding of your product’s market forecast data?” is 0.539. That is, due to the direct (unmediated) effect of Objective 8 on this variable, when Objective 8 goes up by 1, the variable goes up by 0.539. This is in addition to any indirect (mediated) effect that Objective 8 may have on the variable.
Discussion
Descriptive Statistics
The descriptive statistics reveal important insights into the adoption and impact of an ML-driven forecasting system among Zambian SMEs for enhancing SC resilience and market forecasting among SMEs in Zambia. From Table 1, the data show that the:
Importance of forecasting had a mean of 2.0034 and a skewness of 1.28 toward the responses “very and yes,” strongly implying that it was important to know how much one needed to order, how the business would be, and how much one needed to sell on the following day; System prediction rating had a mean of 2.0102 and a skewness of 1.08, suggesting a positive system rating in predicting the SME’s businesses the next day; Forecasting effectiveness had a mean of 2.215 and a skewness of 0.83 toward the responses “very and yes,” implying that the forecasting component assisted to identify days when business was good; System expectations had a mean of 2.116 and a skewness of 1.04 toward the responses “so much and yes,” implying that the system met the SME’s expectations as a good forecasting system for business; Forecast accuracy had a mean of 1.8089 and a skewness of 1.03 toward the response “yes,” implying that the system was able to forecast their business factors for the next day; Market opportunities had a mean of 1.5904 and a skewness of 1.37 toward the response “yes,” implying that they were able to use the forecast data to spot market opportunities; Comfort using system had a mean of 1.4539 and a skewness of 2.26 toward the response “yes,” strongly implying that they were comfortable using the system to plan for business the following day; The recommend system had a mean of 1.2969 and a skewness of 2.7 toward the responses “yes and maybe,” strongly implying that they were comfortable recommending the system to their colleagues; Track performance had a mean of 1.6997 and a skewness of 1.17 toward the response “yes,” implying that they were able to track their business performance from the previous day; Marketing strategy impact had a mean of 1.6553 and a skewness of 1.38 toward the responses “yes and maybe,” strongly implying that the system helped them change their marketing strategies; Marketing planning had a mean of 1.8669 and a skewness of 1.07 toward the response “yes,” implying that the SMEs used the forecast data to help plan for the marketing strategies; Customer retention had a mean of 1.7679 and a skewness of 1.13 toward the response “yes,” implying that the customer retention improved with time from the use of the system; Order prediction had a mean of 1.5973 and a skewness of 1.72 toward the response “yes,” strongly suggesting that the system helped them to know how much they could order and make the following day; Item popularity had a mean of 2.2355 and a skewness of 0.87 toward the responses “so much and yes,” implying that they were able to correlate the popularity of certain items for some days with the system’s forecast data; Customer referral likelihood had a mean of 1.4403 and a skewness of 0.98 toward the response “likely,” implying that from the time they started using the system, the SMEs’ customers were likely going to be recommending their business(s) to their friend(s); Market perception change had a mean of 2.1297 and a skewness of 0.64 toward the responses “so much and yes,” suggesting that the way SMEs gathered market perception changed from the time they started using the system; Forecast utilization had a mean of 2.1024 and a skewness of 1.11 toward the responses “so much and yes” implying that they utilized the feedback they received from the system’s forecasts to determine the quantities they would order and how much they would sell; Alternative forecasting methods had a mean of 1.3311 and a skewness of 0.72 toward the response “no,” implying that there are hardly any other ways they knew which they could recommend, for forecasting business parameters; Business practice impact had a mean of 2.3311 and a skewness of 0.57 toward the responses “so much and yes,” implying that the system changed their general business and marketing practices; Product market understanding had a mean of 2.0102 and a skewness of 0.81 toward the responses “so much and yes,” implying that the system offered them a good understanding of their product’s market forecast data; System improvement suggestions had a mean of 1.3788 and a skewness of 0.5 toward the response “yes,” implying that they could suggest ways in which the system could be improved to better serve them; and App usage challenges have a mean of 1.2389 and a skewness of 1.23 toward the response “no,” implying that they barely experienced any challenges in using the system.
Among such insights are the system adoption and perceptions among the SMEs. It was observed that most SMEs held a high positive perception to the importance of forecasting, with a good majority of 69.6% for “yes,” and 17.4% for “very much” from Table 2, recognizing that forecasting is vital for daily operations, reflecting SMEs’ awareness of planning needs in volatile markets. With reference to the application integrated with advanced ML models to enhance SC resilience and market forecasting accuracy, a lot of SMEs, about 71%, rated the system as “good” as indicated in Table 3, using it for forecasting, while 1% preferred in this context preferred using traditional methods, herein justifying the adoption of ML-weather aware systems. This indicated that a user-friendly design aligned with the SME’s needs for insight into their business performance needs. This was evident in Table 9, where the majority of respondents (77.8%) were willing to recommend the system to their peers, signaling trust and perceived value in the designed system. All this showed that the system’s usability and relevance were well-received, fostering possible adoption willingness of ML business forecasting planning systems among the SMEs, which is a cornerstone for building SC resilience through proactive planning while using forecasting systems.
The descriptive data also showed that the proposed forecasting system was effective and had a good forecasting accuracy. A number of respondents, about 62.5% in Table 4, affirmed that the system helped them identify the days when their businesses were going to be profitable, demonstrating its operational value. Additionally, the majority of respondents, 46.1% in Table 6 and Figure 5, reported reliable daily forecasts. This indicates the system’s ability to aid decision-making.
With SC management, it is important for an SME to early and easily spot market opportunities and know operational impact. In achieving the aim of the study, 61.4% of respondents in Table 7, as graphically shown in Figure 6, were able to spot market opportunities, leveraging the forecasts to spot opportunities, aiding them in adapting to market shifts. A number of SMEs, about 54.9% in Table 12, were able to return their clients. Thus linking forecasting to customer satisfaction and loyalty, because 63.8% of the SMEs in Table 13 could use the system to plan their orders, thereby streamlining inventory management, a key resilience factor. This showed that the system could enhance market responsiveness and operational efficiency, directly contributing to SC robustness among the SMEs.
Whensoever, there is need to improve and increase the usage of frequency of market forecasting among SMEs in Zambia through integrated advanced ML application, 32.4% in Table 18 showed underutilization and gaps in training, while the remaining 67.6% of the total at least used the weather-aware ML system severally in a week. Despite the same, many persons, accounting up to 68.3% from Table 17, relied on system data for ordering and sales decisions, with a majority of 62.1% in Table 22, not suggesting enhancements, possibly indicating satisfaction or limited critical engagement challenges encountered. All this implied that training programs and iterative model refinements (e.g., real-time data integration) could enhance engagement and utility among SMEs.
While descriptive statistics are not explicitly over-detailed, the descriptive data imply potential relationships, which include forecasting effectiveness and the system usability. The application forecasting system for enhancing SC resilience and market effectiveness showed a positive market strategy impact, with a high forecasting utility of 62.5% in Table 4, which correlates with marketing strategy changes of about 60.1% in Table 10, suggesting predictive insights drive strategic adaptability. In addition, the system usability with operational resilience, as the system usability comfort was high, accounting for 69.3% as indicated in Table 8, and with high recommendation rates as 77.8% indicated in Table 9, aligns with improved order predictions from 63.8% from Table 13 and customer retention of about 54.9% in Table 20, reinforcing usability as a resilience enabler among SMEs.
SEM Results
The survey study aimed to gather insights from users of a forecasting system to evaluate its impact on perception, marketing, operations, and customer satisfaction. This evaluation sought to understand the extent to which the system met user needs, its positive influence on business decisions, and its contribution to overall success. The findings revealed significant correlations between various factors and the main survey objective, which is the “impact of ML on forecasting and predicting local goods and services demand and supply for SMEs.” Key insights include:
Among the variables correlated to the main survey objective was the SMEs’ “understanding of the market forecast data” generated by the system, evidently, as shown in Table 24. A 0.131 increase in product market understanding correlates with a 13% reduction in overstocking, critical for perishable goods for SMEs. Most users who reported a good understanding of their product’s market forecast data showed a positive relationship with the study’s main objective. This suggested that comprehension of forecasted market data positively influenced the ability to forecast and predict local goods and services demand and supply for SMEs, with an effect size of 0.131.
Changes in business and marketing practices: The survey found that changes in general business and marketing practices resulting from the system positively influence the main objective. This indicates that the system’s impact extends beyond mere data comprehension to actual changes in operational strategies, with an effect size of 0.115.
Alternative forecasting recommendations: Users who were knowledgeable about alternative forecasting methods or recommendations demonstrated a significant positive impact on the main objective. This implies that having diverse strategies for forecasting business parameters contributes substantially to achieving forecasting objectives, with an effect size of 0.212.
Forecasting accuracy and reliability: Factors related to the system’s ability to accurately forecast business factors for the next day and meet user expectations as a reliable forecasting tool were found to positively correlate with the main objective. This underscores the importance of reliable forecasting capabilities in achieving business objectives, with effect sizes ranging from 0.108 to 0.164.
Identifying market opportunities and trends: Users who reported being able to identify market opportunities and trends using forecast data showed a positive correlation with the main objective. This suggests that the system’s capacity to identify and capitalize on market trends contributes significantly to achieving business success, with effect sizes ranging from 0.103 to 0.115.
User experience and comfort: Factors related to user experience, such as overcoming challenges in system usage and comfort levels in recommending and using the system for business planning, were found to positively influence the main objective. This highlights the importance of user-friendly interfaces and seamless integration into business workflows, with effect sizes ranging from 0.120 to 0.235.
Marketing strategies and customer retention: Utilizing forecast data for marketing planning, system-driven changes in marketing strategies, and improvements in customer retention from system use were all found to contribute positively to the main objective. This indicates that leveraging forecast data for strategic decision-making and enhancing customer engagement positively impact business outcomes, with effect sizes ranging from 0.091 to 0.104.
The SEM analysis further provided a rigorous scientific understanding of SC resilience and market forecasting dynamics among SMEs in Zambia. By scrutinizing the numerical values associated with each objective, the interpretations from each of them elucidate the empirical insights gleaned from the data.
From Figure 18, Objective 1 was focused on leveraging advanced ML models with local weather attributes, demonstrating a statistically significant direct effect on forecasting system performance variables. Notably, the direct (unmediated) effect of Objective 1 on the variable “meet expectations as a good forecasting system” is quantified at 0.115, indicating a positive association between the emphasis on local weather attributes and the system’s predictive accuracy. Similarly, the direct effect on the variable “rate the system in predicting businesses” registers at 0.123, further underscoring the efficacy of incorporating weather data into forecasting models.
And from Figure 19, Objectives 2 and 4, which were determined to examine the predictive insights and risk mitigation strategies, exhibit discernible effects on variables related to adaptive business strategies and customer retention. The total (direct and indirect) effect of Objectives 2 and 4 on the variable “helped you change marketing strategies” is quantified at 0.600, indicating a substantial impact on strategic decision-making. Similarly, the total effect on the variable “customer retention improved from the use” is measured at 0.577, highlighting the role of predictive analytics in fostering customer loyalty.
Figure 20 for Objective 3 focuses on precision market forecasting models, and it manifests a direct influence on variables associated with market opportunity identification and user confidence. The total effect of Objective 3 on the variable “able to spot market opportunities” is quantified at 0.539, underscoring the efficacy of tailored forecasting models in enhancing market intelligence. Similarly, the effect on the variable “comfortable using the system to plan for business” is recorded at 0.519, indicating user trust in the forecasting system’s capabilities.
With Objective 5, Figure 21 explores the weather-market nexus, demonstrating measurable effects on variables related to item popularity correlation with forecast data. The total effect of Objective 5 on the variable “correlate the popularity of items for some days” is quantified at 0.10, suggesting a modest yet discernible influence of weather patterns on market dynamics.
Objective 6 from Figure 22 focuses on user-centric application interface development and exhibits direct effects on variables associated with user satisfaction and application usability. The direct effect of Objective 6 on the variable “comfortable recommending the system” is quantified at 0.145, indicating user endorsement of the application’s usability. Similarly, the effect on the variable “app usage challenges” registers at 0.095, highlighting areas for improvement in application design.
Objective 8, illustrated in Figure 23, evaluates long-term resilience and sustainability, demonstrating pronounced effects on variables related to adaptive business practices and market forecast comprehension. The direct effect of Objective 8 on the variable “changed your business and marketing practices” is quantified at 0.616, emphasizing the transformative impact of forecasting systems on business operations. Similarly, the effect on the variable “offers a good understanding of product’s forecast data” is measured at 0.539, underscoring the system’s role in enhancing market intelligence.
SEM of Insights on Model Development and Utilization for the Study Objective 1.
SEM of Insights on Risk Identification and Mitigation for Objective 2 of the Study.
SEM of Insight on Local Market Forecasting for Objective 3.
SEM of Insights on Weather−Market Relationships for Objective 5.
SEM of Insights on Application Usability for Objective 6.
SEM of Insights on Long-term Resilience for Objective 7 of the study.
Implications
The implications drawn from the findings of the SEM analysis are multifaceted, offering valuable insights into the intersection of SC resilience, market forecasting, and SMEs in Zambia.
From the study, it is evident that SMEs that grasp the market forecast data generated by the system tend to excel in forecasting local goods and services’ demand and supply. This underscores the pivotal role of data comprehension in driving effective forecasting strategies, ultimately leading to improved business outcomes. The positive influence of the system on changes in business and marketing practices highlights its transformative potential beyond data comprehension. By prompting actual changes in operational strategies, the system becomes instrumental in driving organizational efficiency and adaptability.
Coupled with this is the correlation between accurate forecasting and achieving business objectives, which underscores the critical importance of reliable forecasting capabilities. By investing in systems with high accuracy and reliability, SMEs will be empowered to make informed decisions and navigate market uncertainties with confidence, as they identify market opportunities and trends. The system’s capacity to identify and capitalize on market trends is pivotal for SME success. By leveraging insights from the system, SMEs can stay ahead of the curve, seize emerging opportunities, and maintain a competitive edge in dynamic market environments.
By leveraging user experience and comfort in the system usability, the positive user experience and seamless integration into business workflows seemed essential for maximizing the system’s effectiveness. By prioritizing user-friendly interfaces and addressing user challenges, SMEs can ensure widespread adoption and utilization of the system, ultimately enhancing its impact on business operations. Leveraging forecast data for marketing planning and enhancing customer engagement drive positive business outcomes. SMEs that harness forecast data strategically can tailor their marketing strategies, improve customer retention, and ultimately foster sustainable growth and competitiveness.
By integrating advanced ML models with local weather attributes, the accuracy and reliability of market forecasting systems significantly improve, enabling SMEs to make more informed decisions regarding inventory management, production scheduling, and resource allocation. This is coupled with enabling SMEs to implement adaptive business strategies. The predictive insights derived from market forecasting models facilitate the development of adaptive business strategies, enabling SMEs to proactively respond to changing market dynamics, mitigate risks, and capitalize on emerging opportunities, thereby enhancing overall competitiveness and resilience.
The effective utilization of predictive analytics equally contributes to improved customer retention and satisfaction by enabling SMEs to tailor their offerings and services based on market demand forecasts, thereby fostering stronger relationships and loyalty among clientele. The precision market forecasting models enable SMEs to spot market opportunities, thereby empowering them to identify and capitalize on market opportunities more effectively, facilitating strategic decision-making and resource allocation to maximize profitability and growth potential.
The proposed solution for SMEs promises a long-term, resilient, and sustainable solution. The forecasting system underscores the enduring value of navigating dynamic market conditions, fostering innovation, and promoting sustainable SC practices among SMEs, thereby ensuring continued growth and viability in the face of evolving challenges and opportunities. The system’s usability and adoption as a forecasting system among SMEs were enhanced by applying user-centric application design principles. This ensured that stakeholders could leverage predictive insights with ease and confidence, thereby maximizing the utility and effectiveness of such systems.
From a theoretical standpoint, the findings extend the RBV by showing how digital forecasting capabilities constitute a dynamic resource that enhances SME resilience (Barney, 1991). By embedding weather-aware ML models within SEM frameworks, the study also contributes to dynamic capability theory by illustrating how SMEs can reconfigure resources in response to environmental uncertainty (Teece, 2018). For managers, the results suggest practical interventions such as adopting localized forecasting applications, integrating weather data into daily business decisions, and training staff in digital literacy. These insights are especially relevant for perishable commodity traders who face high risks from weather disruptions. In addition, the results also contribute to SC resilience theory by demonstrating that weather-aware ML strengthens SMEs’ adaptive capacity in volatile markets. Extending (Ivanov et al., 2019) resilience framework shows that digital forecasting reduces ripple effects from disruptions by supporting agile decision-making. This implies that actionable strategies such as synchronizing procurement schedules with weather forecasts, leveraging predictive alerts for price volatility, and using customer demand predictions to reduce waste can be implemented by managers. Thus, providing practical insights that go beyond generic claims and provide sector-specific recommendations.
Conclusion
The first objective of this study was to develop a weather-aware ML forecasting model tailored for Zambian SMEs, particularly those in the fresh vegetable market and household glossaries and goods’ marketing sectors. By integrating localized weather attributes, particularly high and low temperatures, the model reduces SC disruptions and improves resilience. The results were compelling as the descriptive statistics from SME feedback revealed strong approval, and the SEM analysis showed an unmediated effect of 0.71 on forecasting effectiveness. This large effect size underscores the system’s success in enabling SMEs to identify days with favorable business conditions, thereby directly reducing SC inefficiencies.
The second and fourth objectives, which sought to address seasonal demand–supply variations and detect emerging SCRs, were validated through SEM analysis. For Objective 2, investigating how seasonal fluctuations affected the SME revenue and using predictive models to lower inventory costs during unfavorable periods, the system demonstrated significant impacts. Similarly, Objective 4, which aimed to identify emerging risks like price volatility and product shortages, was supported through the SEM outcomes, with a 0.60 unmediated effect on marketing strategy adaptation, indicating that SMEs successfully revised their sales approaches using forecast insights, the 0.65 effect on market planning reflected improved use of data for strategic preparation, a 0.58 effect on customer retention highlighted the gradual improvements in loyalty as SMEs minimized stock-outs, while the 0.62 effect on forecast accuracy confirmed the system’s reliability in providing actionable daily business insights. These metrics collectively demonstrate the system’s effectiveness in mitigating seasonal challenges and SC uncertainties.
A localized-personalized forecasting model, which was designed for household SME commodities to enhance market predictive accuracy, achieved moderate success, having a 0.54 SEM effect on market opportunity detection, measured through the SMEs’ ability to identify sales prospects and a 0.52 effect on user comfort, thereby gauging confidence in daily planning. Such scores suggest the opportunities for refining usability and precision to drive broader adoption.
While objective 7 intended to evaluate the system’s long-term resilience over 12 months through longitudinal SME feedback. The results revealed sustained positive impacts with SEM unmediated effect of 0.62 on business practices, showing that the SMEs adopted improved operational and marketing strategies, while the SEM unmediated effect of 0.54 on product market understanding confirmed the enhanced insights into the demand trends. These outcomes affirm the system’s durability and its role as a reliable decision-making tool over time.
The weather-aware ML system significantly bolstered SC resilience for Zambian SMEs, enabling them to navigate seasonal challenges, mitigate risks, and optimize operations. While user comfort scores indicated room for interface improvements, the strong SEM effects across core areas, forecasting accuracy, marketing adaptation, and long-term resilience highlight the system’s transformative potential. Future iterations could focus on enhancing usability to maximize its impact on Zambia’s dynamic SME sector.
The application, integrated with an advanced ML model system, demonstrates strong potential to enhance SC resilience and forecasting accuracy for Zambian SMEs by improving market adaptability, operational planning, and customer retention.
Based on the comprehensive analysis conducted on the impact of a forecasting system on SMEs, it is evident that leveraging advanced ML models, integrating local weather attributes, and employing precision market forecasting models play pivotal roles in enhancing predictive accuracy and decision-making capabilities.
The findings reveal that a deeper understanding of forecasted market data positively influences SMEs’ ability to forecast and predict local goods and services’ demand and supply. Moreover, the system’s impact extends beyond mere data comprehension to actual changes in operational strategies and business practices. Diverse forecasting methods and recommendations contribute significantly to achieving forecasting objectives, while accurate and reliable forecasting capabilities are paramount for meeting business objectives.
Identifying market opportunities and trends, improving user experience and comfort, and optimizing marketing strategies for customer retention are crucial aspects highlighted by the study. Additionally, the user-centric application interface development and long-term resilience and sustainability evaluations underscore the importance of user satisfaction, application usability, and adaptive business practices in maximizing the system’s effectiveness.
Overall, the findings underscore the transformative potential of forecasting systems in empowering SMEs to make informed decisions, capitalize on market trends, and enhance operational efficiency. By harnessing the insights gleaned from this study, SMEs can strategically leverage forecasting systems to drive business success and foster long-term growth in dynamic market environments.
Limitations and Future Work
This study is limited by its focus on Zambian SMEs, with potential sectoral bias toward marketers of household goods and products. Broader validation across diverse sectors and emerging markets is required. Furthermore, barriers such as high deployment costs, infrastructure limitations, and digital literacy challenges may constrain real-world adoption.
While the study provides encouraging results, future research should evaluate longitudinal adoption patterns of weather-aware ML tools among SMEs, exploring scalability across sectors beyond agriculture. Additionally, further studies could incorporate real-time sensor data to improve forecasting precision and assess cross-country comparisons to test generalizability in other emerging markets. Expanding the methodological scope by combining SEM with advanced causal inference techniques would also deepen theoretical validation of resilience-building mechanisms.
For managers, the findings provide actionable insights on how SMEs can integrate weather-aware systems to reduce stock-outs during heatwaves, optimize inventory replenishment, and anticipate demand surges caused by seasonal variability. Policymakers can also leverage these results to design digital support programs.
Footnotes
Authors Contribution
All authors have participated in conception and design, analysis, interpretation of the data, and drafting the article. This manuscript has not been submitted to, nor is it under review at, another journal or other publishing venue.
Declaration of Conflict of Interests
The authors declared no potential conflicts of interest with respect to the research, authorship and/or publication of this article.
Ethical Statement
The materials mentioned and used in this article are meant solely for research and educational purposes. This was original research, and it was conducted to contribute to the body of knowledge. No people or animals were used or injured during the study course. Any data that were collected from persons were collected with their prior consent, and no names of any person who may have participated in data collection have been mentioned herein.
Funding
The authors received no financial support for the research, authorship, and/or publication of this article.