
Abstract
This study investigates the application of lean manufacturing principles in Bangladesh’s apparel industry, focusing on an apparel factory known for producing bottoms and trousers for major global brands. It aims to empirically analyze how lean principles can enhance productivity, reduce work-in-progress, and increase operational flexibility to better manage high-mix, low-volume orders at reduced costs. The study presents empirical evidence that lean interventions led to significant improvements in productivity and efficiency in the short term. Over time, however, sustaining these gains proved challenging due to ongoing operational and market dynamics.
Keywords
Introduction
In today’s hyper-competitive global market, manufacturers must continuously improve product quality while minimizing costs and waste. These challenges are particularly acute in the apparel manufacturing sector, where firms must balance competing demands for quality, cost-efficiency, short lead times, and operational flexibility to meet fluctuating customer requirements (Yadav et al., 2019). For manufacturers in developing countries such as Bangladesh, the difficulty is exacerbated by the widespread reliance on outdated just-in-case production strategies, contributing to poor performance and inefficiencies (Hasan et al., 2022). However, the strategic application of lean manufacturing principles offers a pathway to overcome these barriers by systematically identifying and eliminating waste, thereby enhancing productivity and operational efficiency (Shah & Ward, 2007).
Lean manufacturing, originally developed in the automotive sector, has since been adapted across various industries due to its proven ability to streamline operations and reduce non-value-added (NVA) activities. By reducing waste in areas such as overproduction, transportation, waiting times, and excess inventory, lean methodologies not only increase efficiency but also enable firms to be more flexible and responsive to market demands. This approach is especially relevant for the apparel industry, where high-mix, low-volume orders necessitate rapid changeovers and minimal work-in-progress (WIP) to meet consumer expectations.
In Bangladesh, the apparel industry plays a pivotal role in the global supply chain, producing garments for some of the world’s most recognizable brands. However, many of these companies face difficulties in sustaining competitiveness due to inefficiencies in their production processes (Hasan et al., 2022). Our study investigates how lean manufacturing principles were applied in a Bangladeshi apparel factory specializing in bottoms and trousers for major global brands such as Wrangler and Lee. The project’s primary objectives were to improve productivity, reduce WIP, and enhance flexibility to better accommodate high-mix, low-volume orders while driving down costs.
The implementation of lean principles in this case study followed a structured process, beginning with a comprehensive assessment of the existing production line, which consisted of 170 machines. Baseline data were collected to identify inefficiencies and opportunities for improvement. The production line was then restructured into two smaller, more agile lean lines to facilitate material flow and reduce waste. Key lean tools such as Sort, Set in Order, Shine, Standardize, and Sustain (5S) and Kaizen were employed to streamline operations, reduce handling motions, and minimize excess WIP, which had previously constrained the factory’s flexibility (Melton, 2005).
The results of this lean implementation were substantial. At the conclusion of the first phase of implementation, hourly output increased by 28%, and productivity per operator per hour (PPOH) improved by 29%. Following the second phase, productivity increased by 43%, even with a higher frequency of changeovers. These outcomes demonstrate the effectiveness of lean manufacturing in enhancing both efficiency and flexibility in the apparel industry.
This article details the lean tools and techniques used, the comprehensive assessment of the existing production line, and the resulting waste reductions. By offering insights into the practical application of lean methodologies, this case study provides a valuable blueprint for apparel manufacturers looking to improve operational efficiency and reduce costs.
The remainder of this article is structured as follows: “Literature Review” section presents a literature review of lean manufacturing principles and their applications in various industries. “Methodology” section outlines the methodology used in the case study. “Findings/Results” section discusses the results of the lean implementation and its broader implications. Finally, “Discussion and Conclusion” section concludes with key findings and recommendations for future research.
Literature Review
Bangladeshi Ready-made Garments Industry
Following the independence war in 1971, a group of dedicated entrepreneurs laid the foundation for Bangladesh’s ready-made garments (RMG) industry as part of efforts to rebuild the nation. The path to success was fraught with significant challenges; however, the industry has secured a prominent position in the global apparel market through perseverance and strategic advancements. Between 2019 and 2020, the sector generated $27.9 billion in exports, accounting for 83.5% of Bangladesh’s total export earnings (BGMEA, 2024). Additionally, the country’s economy has shown robust growth, maintaining an annual gross domestic product (GDP) increase of 5.7% (IMF, 2024). The RMG industry also plays a vital socio-economic role by providing direct employment to 4.4 million individuals, making it Bangladesh’s largest contributor to foreign exchange earnings (Textile Today, 2024). Consequently, the continued success of this sector and its manufacturers is crucial for the nation’s economic development.
Lean Management
Lean management, originating in the Toyota Production System (TPS), is a philosophy of maximizing customer value while relentlessly removing waste through continuous improvement (Kilpatrick, 2003). Its intellectual roots stretch to Taylor’s scientific management and Ford’s flow production, but Ohno and Toyoda’s post-war innovations of Just-in-Time (JIT) and Jidoka solidified the approach. “Lean” was formalized as a label in 1990, advancing the argument that TPS principles could transfer beyond automotive manufacturing (Kilpatrick, 2003).
Over the past four decades, several researchers have performed an extensive systematic literature review on lean management. Sundareshan et al.’s (2015) comprehensive review of literature on lean implementation identified the commonly used lean tools, along with barriers and benefits of implementing lean. The authors concluded that lean can be applied by all types of organizations, regardless of size or type. Singh et al.’s (2017) comprehensive study on lean manufacturing practice concluded that lean implementation is a continuous process and can lead to substantial benefits if implemented properly. A research study on lean in three phases, conducted by Sinha and Matharu (2019), concluded that lean has not only been successfully adopted by developed countries but also in emerging economies, and that more and more Asian countries have focused on lean implementation in recent years.
Another study conducted by Alkhoraif et al. (2019) focused on lean implementation in small and medium enterprises. In this study, the authors evaluated 25 papers and concluded that small and medium-sized enterprises’ (SMEs) lean research was focused predominantly on single case studies and survey research methods and was concentrated in Western countries. Dorval et al.’s (2019) comprehensive analysis of 1,066 references concluded that there were 103 different definitions of culture, of which only 13 focused on lean culture. Last, in a more recent literature survey entitled “From Lean Production to Lean 4.0: A Systematic Literature Review with a Historical Perspective,” the authors researched the origin of the term lean in both the manufacturing and service settings, how lean has evolved over the years, and how Lean 4.0 blends lean principles and tools with Industry 4.0 technologies (Gil-Vilda et al., 2021).
Most syntheses of the literature converge on five core principles: define value from the customer’s viewpoint; map the value stream to expose NVA steps; create uninterrupted flow; establish pull to prevent overproduction; and pursue perfection via Kaizen (Gupta & Jain, 2013). Mastery of foundational terms of value, waste, value-added (VA), and NVA is essential (Maware et al., 2022). Lean’s cost-reduction engine is its systematic attack on the seven classic wastes (overproduction, waiting, transportation, overprocessing, excess inventory, unnecessary motion, and defects), thereby stripping out NVA activities (Chiarini, 2013; García-Alcaraz et al., 2014; Sigma, 2016).
Implementation research highlights recurring obstacles: cultural resistance, skill gaps, limited leadership commitment, and an overly tool-centric focus that ignores the broader mindset (Alkhoraif et al., 2019; Bertram et al., 2021). Successful transformations hinge on visible, sustained top-management sponsorship to embed and sustain a lean culture (Elbert, 2012). Integrating pull/JIT into legacy systems and dedicating adequate financial and human resources remain persistent hurdles.
Lean’s applicability is demonstrably cross-sectoral. Healthcare, services, and public agencies report gains in cost, quality, lead time, customer satisfaction, and employee morale, underscoring lean’s industry-agnostic character (Habib et al., 2022). Current scholarship explores “Lean 4.0”—the convergence of lean with digitalization and Industry 4.0 to leverage advanced technologies without abandoning lean’s human-centric ethos (Naciri et al., 2022). In short, while lean’s core remains stable, its methods and contexts continue to evolve in response to technological and societal shifts.
Lean Tools Identified and Applied to Case Study
We chose to focus on these specific tools in our case study because they aligned most directly with the operational realities we observed and offered clear levers to eliminate waste and stabilize flow.
First, we decided to focus on the analysis of VA or NVA tasks. From a customer-value standpoint, every task in production is either VA or NVA (Trent, 2008). VA activities physically transform the product in ways the customer recognizes and is willing to pay for. Some NVA work is “necessary” (e.g., mandated inspections or unavoidable transport), but pure waste should be targeted for removal (Trent, 2008). Clarifying this distinction enables firms to channel improvement energy toward steps that drive customer value and to redesign or eliminate the rest (TPS, 2016).
Lean crystallizes NVA into seven classic wastes: overproduction, waiting, transportation, overprocessing, excess inventory, unnecessary motion, and defects (Chiarini, 2013; Sigma, 2016). These wastes inflate WIP, extend lead times, and erode quality—often invisibly to managers lacking lean literacy (Soliman, 2017). Systematically identifying and shrinking these losses can materially lift throughput and efficiency (Rahmanasari et al., 2020); therefore, we decided to identify waste as a part of our analysis.
Once waste is visible, lean tools provide the “how.” We decided to focus on the following lean tools:
5S establishes the disciplined workplace foundation on which other improvements rest (Michalska & Szewieczek, 2007). Takt time, net available time divided by customer demand, sets the production cadence and exposes imbalances (LEI, 2024). Line balancing or Heijunka level workloads across stations; bottlenecks (processes exceeding Takt) are pinpointed with Yamazumi charts, which stack cycle times to highlight overloads (Altomonte, 2024; Asana, 2024; Masters, 2024; Wrike, 2024).
Lastly, we decided to focus on the following performance metrics for sustaining momentum.
Efficiency (produced minutes/available minutes) translates standard minute value (SMV)-based output into a clear productivity ratio (Sarkar, 2020).
PPOH offers a practical operator-level gauge widely used in Bangladeshi apparel plants.
Changeover time, which is often bundled within setup, must be minimized to protect flow (Banna, 2022).
We emphasized these measures and events because they produce quantifiable improvements and were immediately applicable in our study context.
Methodology
Company Selection: Arunima Group
With a workforce of approximately 5,000 employees, Arunima Group is a prominent garment manufacturer based in Zirabo, Dhaka, specializing in bottoms. The company collaborates with globally recognized brands such as Wrangler, Lee, The North Face, Walmart, Nautica, and GAP (Arunima Group, 2024). The production of these garments involves woven fabrics and follows a mass production system, with each production line comprising 170 sewing machines. The workflow begins with a loading area at the start of the line and concludes at a finishing area. Cut fabric panels are transported from the cutting section to the production floors using elevators and trolleys. Most garment styles are washed after sewing and are then transferred to a separate floor for packaging. Once packed, the garments are sent to the finishing warehouse in preparation for shipment.
The company’s reliance on a mass production system, progressive bundle flow, and large bundle sizes (60 pieces per bundle) results in significant WIP at the line and floor levels. Operators do not pass bundles to the next workstation until all 60 pieces in the bundle are completed, contributing to substantial WIP accumulation. Furthermore, Arunima Group employs a piece-rate compensation system, where operators receive bonuses based on individual performance. This system undermines teamwork and exacerbates the WIP issue as operators prioritize personal output over collective efficiency.
However, global market trends have shifted, with companies worldwide increasingly adopting fast fashion and changing their order quantity patterns. This shift has led to smaller, high-mix, low-volume orders, presenting a unique challenge for manufacturers like Arunima Group. The frequent changeovers required for such orders have caused a notable decline in production efficiency. To remain competitive, a production system must be flexible and capable of rapid response to varying order demands (Ali et al., 2024).
In response to these challenges, Arunima Group’s top management initiated a lean project aimed at enhancing production efficiency and improving flexibility. The author, serving as a continuous improvement professional, was tasked with facilitating this lean implementation. One production line was chosen as the focus for the lean project to test and refine the new approach. The factory operates with a product layout structure that follows a progressive bundle system, where machines are arranged sequentially according to the production process. Inputs are introduced at the start of the line, and each operator performs their designated task before passing the work to the next station. This arrangement continues until the final garments are completed and ready for output at the end of the line.
Throughout the production line, in-line quality controllers (QCs) are positioned to monitor and verify the quality of the work at various stages, ensuring that each process meets the required standards. Additionally, end-line QCs conduct final inspections on completed products, preparing them for either the washing or packing sections, depending on the specific style and customer requirements.
Research Method: Line Selection and Data Collection
The Arunima factory maintains comprehensive daily reports covering output, manpower, and work time. The data for these reports are captured from workers’ card punches. The factory is supported by a dedicated Industrial Engineering (IE) team, responsible for conducting time studies and calculating the SMV for each product style. The IE team also calculates weekly efficiency based on these SMV assessments. Changeover times are meticulously recorded for each style transition, ensuring accurate data collection.
For this lean project, the authors collected data from daily and weekly reports by the factory’s IE and operations teams. Line 4B, located on floor TW4 of the factory, was chosen for this project based on a decision made by factory management. To enhance productivity and efficiency, line 4B was restructured and divided into two smaller, more streamlined production lines: lines 4B1 and 4B2. The performance of these new lines was then compared to the original line 4B, and the data were analyzed before and after restructuring.
Importantly, the project maintained consistent manpower, the same number of machines, and identical working hours before and after the reconfiguration. The entire project spanned 3 months and 10 days, providing ample time for data collection and analysis of the implemented changes.
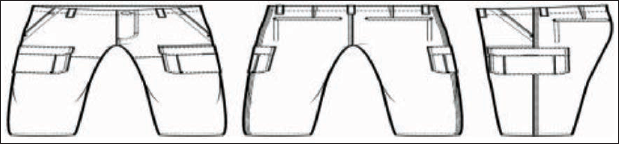
The products chosen are different styles of bottoms or pants made of woven fabric, which have different types of features such as cargo pockets, flaps, and others. A common bottom style is shown in Figure 1.
A Standard Bottom Style in the Factory.
A three-phased approach was used for this study. In the first phase, also referred to as the baseline phase, data pertaining to efficiency, changeover times, and PPOH were collected from October 10 to November 2. Other activities performed during this phase included:
WIP and bundle size assessment: The current WIP levels and bundle sizes were measured, using data maintained by the factory’s daily floor records. Changeover data for different styles were also collected. Takt time calculation and time study: Takt time was determined, and a detailed time study was conducted for all processes within line 4B to evaluate the line’s balance and identify bottleneck processes. Baseline data verification and goal setting: All collected baseline data were verified and validated in collaboration with factory management. Target goals for the Kaizen event were established. Team formation: A cross-functional team was assembled, including production management, the IE team, and the floor maintenance team, to facilitate the Kaizen event. Improvement opportunities were identified and documented. Idea generation and planning: Solutions for each identified problem were brainstormed with the team, and an implementation plan was formulated to leverage these opportunities for improvement. Line layout redesign: The production layout was redesigned to create two leaner lines, 4B1 and 4B2, with resources from the original line 4B distributed accordingly.
In the second phase, referred to as “Initial Implementation,” a Kaizen event was conducted in which lean tools and the concept of waste reduction were applied. Data were collected from November 4 to November 27, and the results were then compared to the baseline data and later shared with the factory management. In the last phase, referred to as the “Improvement Phase,” additional enhancements that focused on reducing changeover risks were implemented. For this phase, the data were collected from November 28 to January 20, and the results were presented to all project stakeholders, and recommendations were provided to management for future improved projects in order to sustain and expand upon the gains already achieved.
Findings/Results
Phase 1: Baseline Phase
The baseline analysis revealed that line 4B had an output capability of 150 pieces per hour, with an average PPOH of 0.93. These data are visually represented in Figure 2.
Baseline Study at 4B Line, 150 pcs/h.
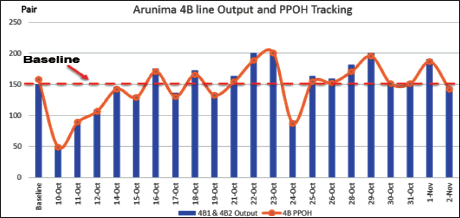
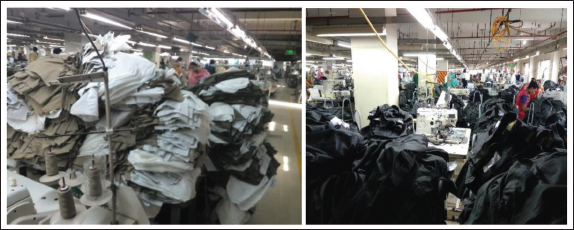
The line maintained an average of 6 days’ WIP (about 30,000 units) at the floor TW4 at any given time, thus causing lots of waste in terms of over-transportation and motion. Figure 3 shows the big size bundles and the overwhelmed WIP level in line 4B.
Big Size Bundles and Large Work-in-Progress (WIP) Level in the Line 4B.
The Takt time, the excess transportation waste, and the changeover time were also computed and are discussed below.
Takt time and line balancing: A time study was done to record the cycle time of each process in line 4B; the Takt time was calculated as 15 s for the running bottom style. A Yamazumi chart was then drawn to identify the bottleneck operations in the extensive line 4B.
Yamazumi Chart for Line Balancing of Line 4B (Before Improvement).
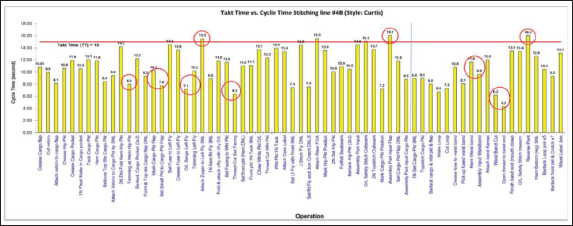
Figure 4 shows the Yamazumi chart for line 4B before applying line balancing techniques and converting to smaller lean lines. Three bottleneck processes were identified and marked with red circles, which were taking more time than the Takt time. On the contrary, besides bottlenecks, six workers were identified as underutilized. The study is shown in Appendix A.
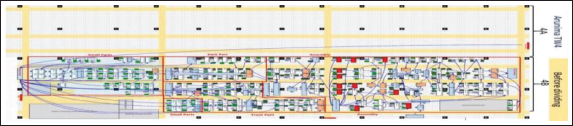
Excess transportation waste: Next, the current layout of line 4B, along with each machine and workstation location, with process details, was first drawn; the workflows were then identified, and the distances were later measured for each material flow and worker movement. The current layout with all the flows is shown in Figure 5. The total traveling distance was calculated to be 5,264 feet.
Current Line Layout and Material Flows (Before Improvement) in Line 4B.
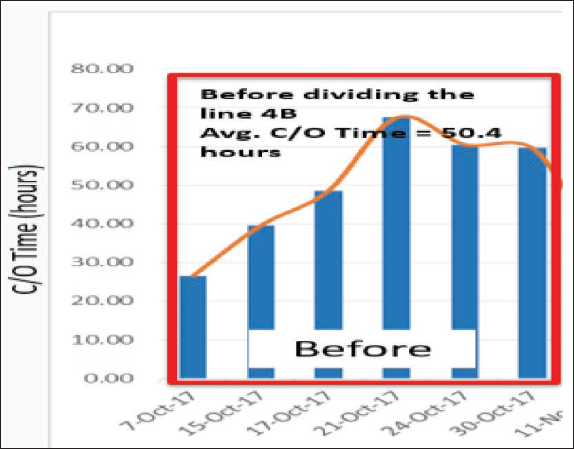
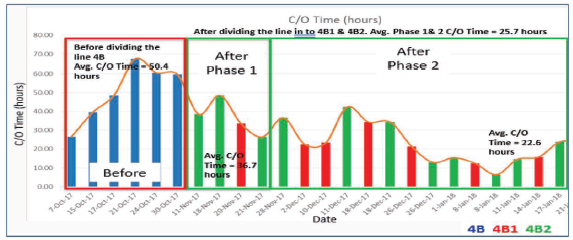
Changeover time: In line 4B, the average changeover time was 50.4 h, which denotes a very long changeover time for an apparel factory. The changeover data graph is shown in Figure 6.
Changeover Time Baseline Study in Line.
Phase 2: Initial Implementation
The whole implementation and improvement project was done in two phases. Two Kaizen events were run at the beginning of each phase. In phase 2, focus was given to designing the layouts of two smaller lean lines, 4B1 and 4B2, applying line balancing techniques to solve the bottlenecks, reducing transportation wastage, and ultimately improving the productivity and efficiency of the line. The steps below were taken to bring about the improvements.
Redesign the layout and reduce transportation waste: The current layout of line 4B was redesigned into two smaller lean lines, 4B1 and 4B2, with improved line balancing and material flow. Machines and workstations were placed sequentially so that the operators needed minimum or no material handling and excess motions in the improved layout. The total travel distance was reduced to 2,664 feet, which is 50% less than the baseline.
Apply line balancing: Line balancing techniques were applied to the smaller lines 4B1 and 4B2 to bring better productivity compared to line 4B jointly. Takt time was recalculated (27.7 s) based on the divided manpower in lines 4B1 and 4B2. All three bottlenecks and underutilized workers identified during the baseline study were solved. The improved line balancing Yamazumi chart is shown in Figure 7. The line balancing study is shown in Appendix B.
Yamazumi Chart of Lines 4B1 and 4B2 (After Improvement).
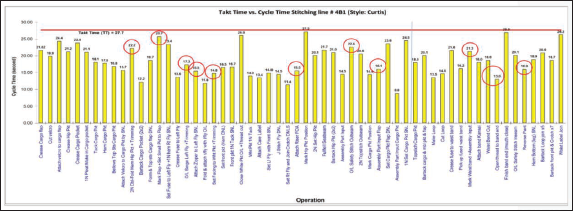
Figure 7 shows the potential bottlenecks based on the Takt time. However, improvement opportunities existed to utilize the underutilized manpower in the workstations identified in the red circle. The following actions were taken in the line to achieve balance:
Merged double-fold hem, hip pocket, and trimming at hem operations. Merged the mark cargo pocket flap and set the small pocket to cargo flap operations. Merged set fuse, merged O/L (overlock) serge left fly, and trimming operations. Merged set facing to the white pocket and trimming. Merged close white pocket O/L (overlock) and thread trimming. Merged the mark waistband and input waistband to the left fly and single needle hem right fly.
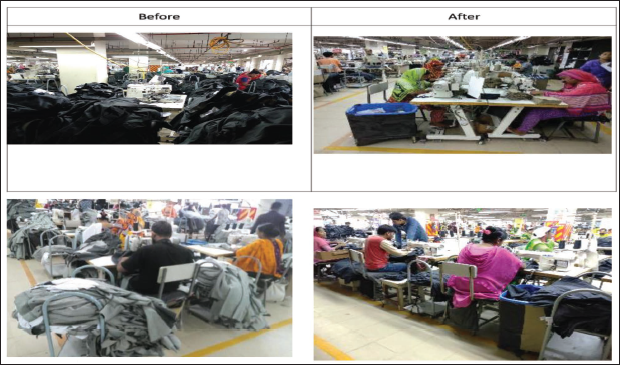
The redesigned line with improved workflow and reduced transportation is shown in Figure 8 as a before–after comparison.
Improved Line Layout.
Phase 2: Results and Comparison
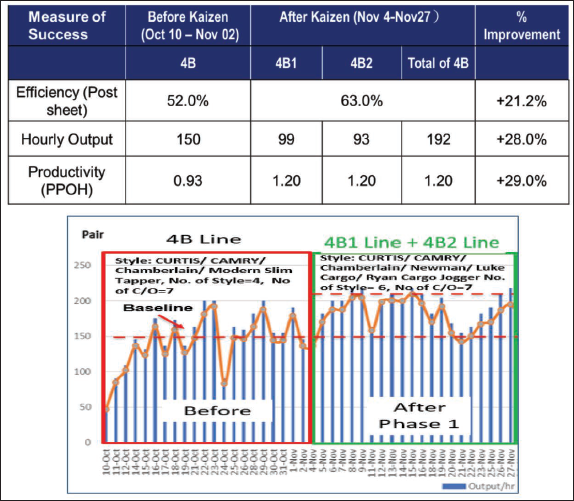
The improvements achieved in phase 1 after applying all the steps above can be summarized as follows (see Figure 9):
Hourly output increased from 150 pieces/h to 192 pieces/h with a 28% improvement. The number of changeovers was the same (number of C/O = 7) in the baseline and improvement periods.
Excess transportation wastage was reduced from 5,264 to 2,664 feet, with 50% improvement.
PPOH improved from 0.93 to 1.20, with a 29% improvement.
The line’s efficiency improved from 52% to 63%, with a 21% improvement.
Summary of Pre- and Post-Kaizen Improvements.
Phase 3: Improvement Phase
In phase 3 of the project, the focus shifted from improving productivity and line balancing to enhancing line flexibility by reducing WIP levels and changeover times.
Reducing WIP: The initial daily WIP level stood at 30,000 pieces per line, equivalent to 6 days’ worth of WIP. To manage and reduce WIP, the bundle size was decreased from 60 to 20 pieces. Implementing line balancing further helped eliminate excess WIP and overproduction waste. Consequently, the WIP level was significantly reduced, from 30,000 pieces in line 4B to 6,800 pieces across lines 4B1 and 4B2. This reduction in WIP contributed to improved flexibility and facilitated shorter changeover times.
Reducing changeover time: The following measures were implemented to reduce changeover time in lines 4B1 and 4B2:
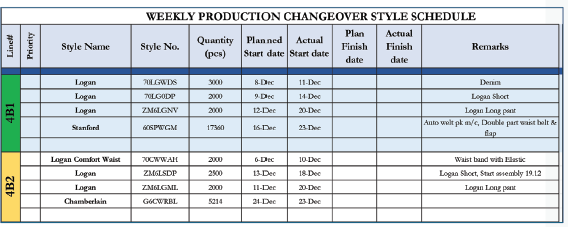
Advanced planning: Emphasis was placed on thorough advance preparation to minimize time losses during changeovers. Style grouping was performed based on similarities to ensure minimal preparation was required before inputting styles into the line. To support this, a planning board was installed on the production line (as shown in Figure 10). This board displayed upcoming changeover styles and highlighted critical preparation needs, facilitating better readiness and efficiency.
Changeover Scheduling Board for TW4 Floor.
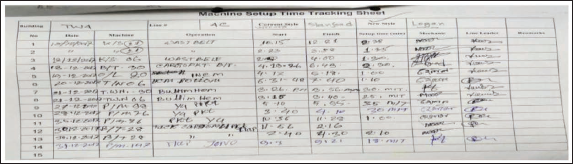
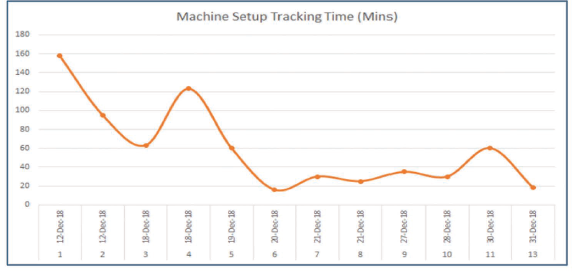
Implement a machine set-up tracking sheet to monitor and control machine set-up time during the changeover to control the downtime and reduce the overall changeover times. The machine set-up tracking sheet implemented is shown in Figure 11. By closely monitoring and controlling, the machine set-up time was reduced from 158 to 30 min only, which is shown in Figure 12.
To sustain the result, all the staff members on floor TW4 were trained on lean wastes, the line balancing concept, quick changeover, and hosting a Kaizen event.
Machine Set-up Time Tracking Sheet.
Machine Set-up Time Tracking Graph.
Phase 3: Result Briefly and Comparison
After incorporating all the initiatives above, the result can be summarized as follows:
Daily WIP level was reduced from 30,000 pieces to 6,800 pieces with a 77% reduction.
Machine set-up time per changeover was reduced from 158 to 30 min.
Average changeover time per style change was reduced from 50.4 to 22.6 h, with a 55% improvement (Figure 13).
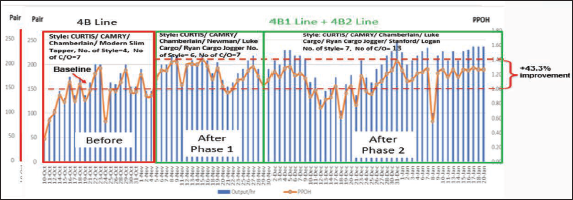
Despite having 13 changeovers, hourly output improved from 150 pieces/h (baseline) to 215 pieces/h with a 43.3% improvement.
Efficiency improved from 52% (baseline) to 67%; a 28.8% improvement.
Changeover Time Tracking (Before and After).
The productivity improvement tracking graph is shown in Figure 14 and the comparison table below.
Productivity Improvement Tracking for 3 Months.
Discussion and Conclusion
Analysis of Results and Implications for Manufacturing
The comprehensive data collected from both phases of the improvement project demonstrated significant enhancements across key performance indicators (KPIs). The implementation of lean tools during the Kaizen events and the redesign of the production line layout yielded notable results. Hourly output increased from 150 pieces per h to 215 pieces per h, reflecting a 43.3% improvement. Similarly, line efficiency rose from 52% to 67%, marking a 28.8% improvement.
Additionally, excess transportation waste was reduced by 50%. At the same time, the WIP level dropped from 30,000 pieces to 6,800 pieces, showcasing the effectiveness of lean principles in optimizing workflow and minimizing waste. The reduction in changeover times, from an average of 50.4 to 22.6 h, underscores the value of implementing quick changeover methodologies to enhance production flexibility and responsiveness.
The findings of this case study highlight the significant potential for lean manufacturing to drive performance improvements, particularly in complex, high-mix, low-volume production environments where variability and frequent changeovers pose operational challenges. The case demonstrates that manufacturing facilities can achieve notable efficiency gains and greater operational flexibility with the thoughtful application of lean principles such as line balancing, waste reduction, and quick changeovers (Bhandari et al., 2022; Melton, 2005).
Line balancing ensures that work is distributed evenly across all workstations, preventing bottlenecks and underutilization of resources. By aligning cycle times with Takt time, manufacturers can maintain a steady flow that minimizes idle time and enhances overall productivity. Research has shown that effective line balancing not only improves throughput but also reduces waiting time and excess WIP, which are common challenges in traditional mass production settings (Shah & Ward, 2007; Yadav et al., 2019).
Waste reduction is another key aspect of lean manufacturing that contributes to performance enhancement. The case study revealed that by implementing waste-reducing practices, Arunima Group was able to cut down excess transportation and reduce WIP significantly. This finding aligns with previous studies that demonstrate cost savings, better space utilization, and improved workflow efficiency when waste is minimized (Bhasin, 2012). Additionally, lowering WIP levels accelerates the production cycle, allowing for quicker responses to changes in customer demand and reducing the risks of obsolescence or quality degradation over time (Womack & Jones, 1996).
The concept of quick changeovers is particularly vital for high-mix, low-volume production environments where frequent product changes are the norm. The study’s results show a dramatic reduction in changeover time from 50.4 to 22.6 h, demonstrating how systematic planning and preparation can greatly enhance flexibility. Similar findings in the literature confirm that quick changeover methodologies, such as Single-Minute Exchange of Dies (SMED), contribute significantly to operational agility and reduced downtime (Powell et al., 2017).
The restructuring of line 4B into two smaller, leaner lines (4B1 and 4B2) serves as a powerful example of how breaking down larger production units into smaller, more agile segments can optimize operations. This structural change facilitated better resource allocation, minimized workflow disruptions, and allowed for more precise management of production activities. Smaller lines are inherently more adaptable, making it easier to implement changes and maintain a consistent flow, which is crucial for meeting the evolving demands of fast fashion and similar industries (Maware et al., 2022).
The practical insights from this case study suggest that the methods applied at Arunima Group can be adapted and scaled to other manufacturing settings, regardless of the industry. Lean manufacturing principles are universal, and their successful application can lead to sustained improvements in productivity, cost efficiency, and customer satisfaction. By focusing on strategic line balancing, reducing NVA activities, and employing efficient changeover techniques, other manufacturers can replicate these results and enhance their competitiveness in the market (Bhasin, 2012; Melton, 2005).
Challenges and Limitations
Despite the positive outcomes, the project encountered several challenges, including resistance to change from the workforce, the need for extensive training, and initial disruptions to production caused by the implementation of new processes. Such challenges are common when introducing lean methodologies, as they often necessitate a cultural shift within the organization. The reluctance of employees to adopt new practices highlights the importance of effective change management strategies and the role of leadership in fostering a culture that embraces continuous improvement (Bhasin, 2012).
The requirement for comprehensive training further underscores the significance of building knowledge and skill sets to support lean initiatives. Without sufficient training, employees may struggle to adapt to new procedures, resulting in slow adoption and temporary setbacks in productivity (Hines et al., 2004). Additionally, the initial phase of implementing new processes can lead to production disruptions as workflows are restructured and stabilized.
An important limitation of this study is its focus on a single production line, which restricts the generalizability of the findings. To strengthen the applicability of these results, future research should investigate the long-term impacts of lean implementation, including sustained productivity gains, workforce adaptability, and cost efficiency. Expanding studies to include multiple production lines and diverse manufacturing settings would also provide deeper insights into the scalability and transferability of lean methodologies across different industries and production environments (Shah & Ward, 2007).
Recommendations
Manufacturers striving to enhance their operational performance should strongly consider adopting lean manufacturing principles and conducting Kaizen events as a structured approach to identify and mitigate inefficiencies. These initiatives help streamline processes, reduce waste, and boost overall productivity. Key to the successful implementation of such projects is the active participation of employees at all organizational levels. Engagement and involvement create a sense of ownership, fostering a culture of continuous improvement and collaboration.
Proper training is another fundamental component, as it equips employees with the knowledge and skills necessary to implement lean practices effectively. This training should include the technical aspects of lean tools, problem-solving techniques, and change management skills required to adapt to new processes seamlessly.
Crucially, support from top management is essential for these efforts to thrive. Leadership commitment ensures that resources are allocated appropriately, goals are aligned with organizational strategy, and momentum is maintained throughout the implementation phase. Management must actively endorse the lean philosophy and champion the cultural shift it entails to overcome resistance to change and sustain long-term improvements.
To maximize the potential of lean projects, manufacturers should also invest in a systematic review process to measure progress and refine strategies. Continuous feedback loops that incorporate data-driven insights can help identify areas for further refinement and innovation.
Future Work
Future research should focus on evaluating the long-term sustainability of the improvements realized through lean implementation. While short-term results can be impressive, understanding whether these gains can be maintained over time is critical. Long-term studies should examine factors such as employee adaptation, changes in operational efficiency, and ongoing waste reduction.
Expanding the study’s scope to include multiple production lines and different manufacturing environments will enhance the robustness and generalizability of findings. This broader approach would allow a better understanding of how lean practices can be adapted to different production scales and product mixes.
Furthermore, integrating advanced manufacturing technologies alongside lean principles can produce even more significant results. For example, automation can support repetitive tasks, reduce human error, and accelerate production cycles, while data analytics can provide real-time feedback, enabling proactive decision-making and predictive maintenance. Internet of Things (IoT) solutions can facilitate continuous monitoring and enhance visibility across the production line, ensuring that lean processes remain efficient and responsive.
Exploring the intersection of Industry 4.0 technologies with lean methodologies can open up new avenues for innovation, combining traditional lean principles with digital transformation capabilities. Future studies should investigate how these technologies can seamlessly integrate with lean practices to optimize workflow, enhance quality control, and improve adaptability to market fluctuations.
Last, it is recommended that future research also focus on the cultural and organizational change management aspects of lean adoption. Understanding how to foster a sustained commitment to lean practices across various levels of the organization can be instrumental in achieving enduring success and embedding continuous improvement as a core part of the business culture.
Footnotes
Declaration of Conflict of Interests
The authors declared no potential conflicts of interest with respect to the research, authorship, and/or publication of this article.
Funding
The authors received no financial support for the research, authorship, and/or publication of this article.