
Abstract
Calcification in cerebral infarcts has been reported as an uncommon finding. CT hyperdensity in an infarct can also be due to hemorrhagic transformation and in MRI can be mimicked by cortical laminar necrosis seen as gyriform T1 hyper and T2 hypointensities. Susceptibility-weighted imaging (SWI) with phase image has been reported to differentiate calcification and hemorrhage. We report 2 cases of cerebral infarcts with a review of the literature. The first patient showed early gyriform calcification 10 days after the onset and showed partial resolution of the calcification on follow-up. The second patient showed plaque-like calcification within perisylvian infarct that was confirmed by SWI phase imaging.
Introduction
Brain infarcts usually follow predictable changes of CT density or MRI signal intensity leading to changes of gliosis in the late subacute and chronic stages. Occasionally there may be changes due to hemorrhagic transformation as a result of reperfusion either spontaneous or therapeutic and still rarely calcifications or cortical laminar necrosis. Such changes may be a cause of secondary development of seizures. Though the imaging features of such are well-described, they may be overlooked or mistaken. We report two cases of unusual calcifications in two patients of cerebral infarcts, the first of which revealed early calcifications and partial resolution in 2-months follow-up and the second showed late calcification and subsequently confirmed by MR susceptibility-weighted imaging (SWI) phase imaging.
Case Details
Case 1
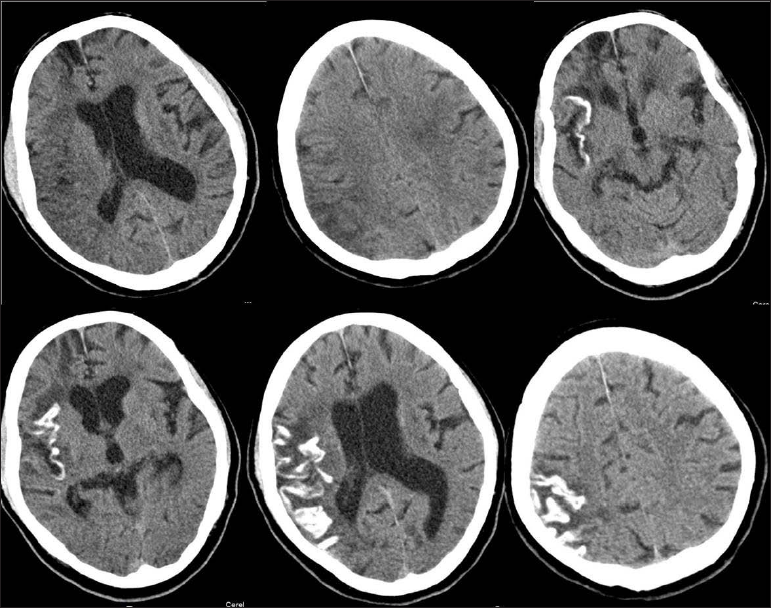
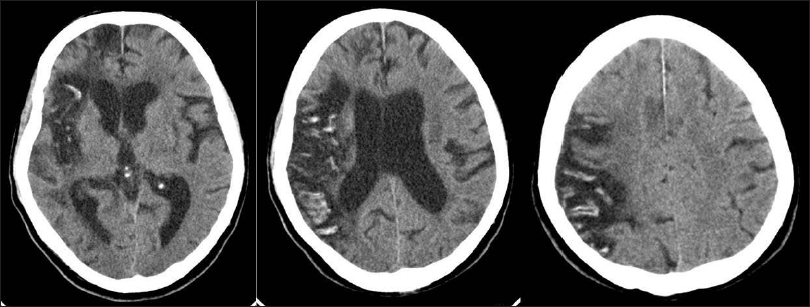
A 42-year-old male patient, who is a known hypertensive on medication since 2 years, now presented with complaints of acute onset left hemiplegia. He had no history of diabetes mellitus, smoking, or alcohol intake. Initial lab investigation showed random blood sugar of 183 mg/dL and rest of the parameters (including serum calcium 9.3 mg/dL, phosphorus 4.9 mg/dL, and magnesium 2.2 mg/dL) were normal. CT brain showed a large ill-defined hypodensity with loss of grey-white matter differentiation and average HU of 23 involving the right fronto-temporo-parietal and ganglio-capsular regions with mild effacement of right lateral ventricle, suggestive of acute right MCA territory infarct. No areas of hemorrhagic foci were noted. Chronic infarcts were noted in right frontal pole and left thalamic region. No midline shift was noted. Patient was managed conservatively. Follow-up CT brain was done after 10 days and it showed gyriform hyperdensities in the right frontoparietal region with average attenuation of about 110 HU indicative of calcification with subcortical hypodensity (Figure 1). Repeat CT brain after 2 months showed partial reduction in the gyral hyperdensities with encephalomalacia changes in the right frontoparietal region and ex-vacuo dilatation of right lateral ventricle (Figure 2).
Case 1. Right Frontoparietal and Perisylvian Ill-defined Hypodensity of Acute Infarct in MCA Territory (A & B). CT Done after 10 Days (C – F) Showed Gyriform Calcifications in the Same Infarct with Mild Ventriculomegaly and Prominent Sylvian Fissure.
Repeat CT (A – C) Done after 2 Months Showed Partial Resolution of Gyriform Calcifications with Pronounced Volume Loss and Gliosis.
Case 2
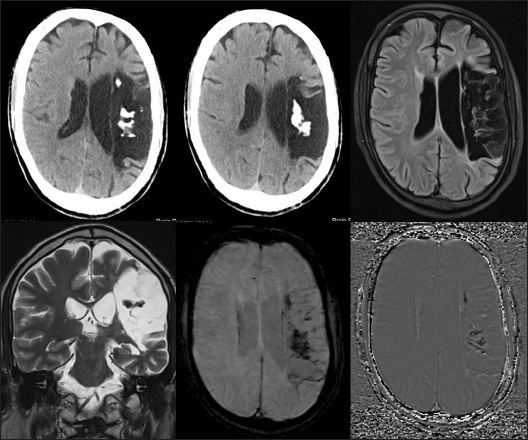
A 43-year-old male who had poorly controlled hypertension on multiple medications presented with motor aphasia and right hemiplegia since 18 months. Patient had a past history of left MCA territory infarct 18 months ago which was conservatively managed in a different hospital. CT brain at admission showed chronic left MCA territory infarct with plaque-like hyperdense calcifications in the left frontoparietal region (of around 160 HU). MRI brain showed gliosis of chronic left MCA territory infarct. Multiple SWI hypointensities noted in the left frontoparietal region which appeared hypointense on SWI phase images confirming them as calcifications (Figure 3).
Case 2. CT Axial Sections (A & B) Showing Left MCA Territory Chronic Infarct with Calcification in the Centre. MRI (C & D) Showed the Gliosis of Chronic Infarct. SWI Image (E) and Phase Image (F) Showing the Hypointensity due to Calcifications.
Discussion
Cerebral infarct can undergo secondary changes and evolve over the period of time usually as volume loss and gliosis. In the subacute phase, infarcts may undergo luxury perfusion or hemorrhagic transformation which may be seen in CT as hyperdensity. Usually these are seen as subtle gyriform hyperdensity which resolve spontaneously in CT or may be seen as hemosiderin rim in MRI. Sometimes infarcts also undergo cortical laminar necrosis which may be partly due to hypoxic component of the injury mainly involving the cortical gray matter.
Calcification of the cerebral infarcts as seen in CT was first reported by Kapila 1 in 3 different cases after 4, 12, and 41 months after the initial ischemic insult. Of these, 2 patients had low calcium levels. They hypothesized this is due to coagulative necrosis causing intracellular calcium accumulation. Kuzuhara et al 2 reported 3 cases with similar radiological findings which showed calcification of the cerebral infarcts after 2, 5, and 13 years of the initial insult. Parisi et al published a case report of a patient with left MCA territory infarct who developed calcification in the infarct region as early as 18 days from the stroke. His autopsy showed intracytoplasmic calcium deposition within the dead neurons of the infarcted cortex. 3 Another case of uremic patient with high-grade right internal carotid artery stenosis showed calcification in the grey and white matter region of right ACA and MCA territory, 6 weeks after the stroke. 4 In this case, the altered blood brain barrier permeability due to uremia and elevated calcium-phosphate cross product deposition was postulated as the cause for calcification. Our patient had normal levels of serum calcium and did not have uremia.
Begeer et al 5 reported a case of vanishing cerebral calcification in a 6-month old child who underwent cardiopulmonary bypass surgery for correction of tetralogy of Fallot. Child later developed renal failure due to severe leaky capillary syndrome for which patient underwent peritoneal dialysis and calcium supplement. NCCT brain showed cortical calcification distributed in bilateral parietooccipital region along with severe hydrocephalus. Repeat NCCT brain after 2 months showed near-complete resolution of cortical calcifications. They opined this phenomenon could be due to cerebral hypoperfusion as a consequence of capillary leakage syndrome and calcium supplementation. Similar case was described by Demaerel 6 of a 5-month old female child with cyanotic heart disease who underwent cardiopulmonary bypass surgery. Immediate postoperative period was complicated by dense left MCA territory ischemic infarct. NCCT head on the 29th day showed dense gyriform calcification in the infarct region and later at 120th day, NCCT showed partial resolution. Sener 7 described a case of early gyral calcification in a two-and-half year-old child with cyanotic heart disease who had middle cerebral artery infarct. CT showed solid gyral calcification 45 days after the stroke and such plaque-like calcification was considered more likely to persist longer.
Chuang et al 8 reported a 59-year old male with primary hyperparathyroidism who had acute left MCA territory infarct and underwent t-PA administration within 3 hours after acute infarction. Immediate post-thrombolysis CT did not show any features of hemorrhagic transformation. Patient had seizures after 4 months and CT showed extensive gyral calcification in the left MCA territory. Duncan et al 9 reported a case of 61-year old female who had mitral valve replacement due to severe mitral regurgitation. Patient developed cardioembolic infarct in the right frontal region as an immediate postoperative complication. Follow-up NCCT head 18-months later showed gyriform calcification in the chronic infarct area. The previous reports are summarized in Table 1.
Patient Demographics of Previously Reported Cerebral Infarct Calcification Cases.

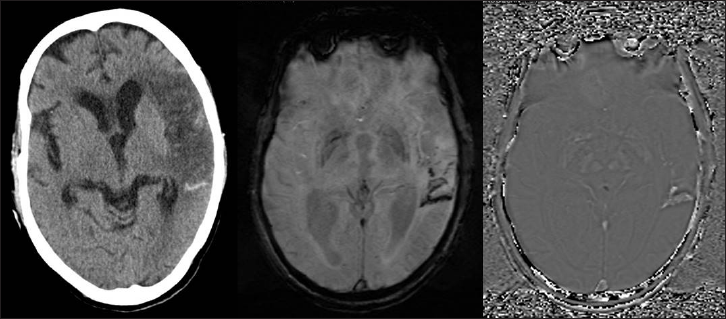
Our case showed very early development of gyral calcification in the infarct region at 10 days. But patient had normal calcium, phosphorus, and magnesium levels. As he had normal renal parameters, parathormone, and vitamin D levels were not done. Apart from our case, there are only 2 other reports which demonstrated the partial resolution of the gyral calcification, both of which were seen in children. Susceptibility-weighted imaging has been shown to differentiate calcification and hemorrhage using the phase information. 10 We found our second patient had phase hypointensity suggestive of calcification. This can be easily differentiated by phase (image of SWI) hyperintensity that is shown in hemorrhagic transformation of an infarct (Figure 4).
Another Case with Left MCA Territory Infarct in CT (A) with Hemorrhagic Component. SWI (B) and Phase (C) Image Showing Hypo- and Hyperintensity, Respectively, Suggestive of Hemorrhage.
In cerebral neuroparenchyma, tissue damage results in liquefactive necrosis leading to gliosis and CSF-like contents rather than coagulative necrosis that occurs in rest of the other tissues in the body. It is possible that an altered local metabolic milieu or some predisposition like calcium imbalance or acidosis may have a role in few patients developing calcifications in the infarct necrosis. However, definite pathogenesis is yet to be elucidated.
Footnotes
Declaration of Conflicting Interests
The authors declared no potential conflicts of interest with respect to the research, authorship, and/or publication of this article.
Ethical Approval
For retrospective isolated reports, institutional ethical review was not necessary and patient images are de-identified to ensure anonymity.
Funding
The authors received no financial support for the research, authorship, and/or publication of this article.
Informed Consent
The participant has consented to the submission of the article to the journal.