
Abstract
Background
Early biomarker-based diagnosis of Alzheimer's disease (AD) is essential, particularly with the increasing availability of new therapeutic options. However, the relationship between imaging and cerebrospinal fluid (CSF) biomarkers, especially in the context of 18Fluorine-fluorodeoxyglucose positron emission tomography (18F-FDG-PET), remains insufficiently understood.
Objective
The aim of this study was the evaluation of the relationship between 18F-FDG-PET and other common fluid and imaging AD-biomarkers in a clinical cohort of patients with cognitive decline and suspected AD.
Methods
We included n = 90 patients with cognitive decline and clinically suspected AD that underwent 18F-FDG-PET imagining at our facility. Clinical and imaging data including patient characteristics, CSF biomarkers, Mini-Mental State Examination (MMSE), 18F-FDG-PET and 18F-Florbetaben-PET were retrospectively analyzed. PET images were quantified in several brain regions.
Results
18F-FDG uptake correlated with CSF amyloid-β (Aβ)40, Aβ42, and the Aβ42/40 ratio in several brain regions, but not with regional 18F-Florbetaben uptake. 18F-FDG uptake inversely correlated with t-tau and p-tau in CSF. Furthermore, a correlation between MMSE and 18F-FDG uptake was also detected in several brain regions. 18F-FDG-PET and its combination with CSF markers showed the highest predictive power for disease severity.
Conclusions
The study highlights the potential of integrating 18F-FDG-PET with CSF biomarkers to improve the diagnosis, prognosis, and monitoring of AD, emphasizing the complexity and regional specificity of biomarker interactions in neurodegeneration.
Introduction
Alzheimer's disease (AD) is the most prevalent form of dementia, with a growing number of affected individuals due to the aging global population. To ensure early and accurate diagnosis, the use of biomarkers for AD is essential.
AD biomarkers can be categorized based on the core pathological features of the disease into three groups: amyloid biomarkers (A), tau biomarkers (T), and neurodegeneration biomarkers (N). The “A/T/N model,” proposed by the National Institute on Aging and Alzheimer's Association (NIA-AA), offers a framework for defining AD through a patient's specific biomarker profile. This model enables a more comprehensive and personalized evaluation of biomarkers in the diagnosis, prognosis, and monitoring of AD. 1
Available biomarkers include fluid biomarkers for amyloid and tau, which is mainly measured in cerebrospinal fluid (CSF), as well as imaging biomarkers for amyloid, tau, and neurodegeneration, which can be assessed using magnetic resonance imaging (MRI) or positron emission tomography (PET).
In clinical practice, commonly assessed CSF biomarkers include amyloid-β 1-42 (Aβ42), amyloid-β 1-40 (Aβ40), the Aβ42/40 ratio, total-tau (t-tau), and phosphorylated tau-181 (p-tau). Additionally, 18Fluorine-fluorodeoxyglucose positron emission tomography (18F-FDG-PET) imaging is a well-established biomarker for neurodegeneration that can detect patterns of regional cortical hypometabolism. AD is particularly characterized by pronounced hypometabolism in the posterior cingulate cortex, the precuneus, and the posterior temporoparietal cortex. 2 Furthermore, cortical amyloid load can be evaluated using amyloid-PET with various tracers, such as 18F-Florbetaben, which detect cortical amyloid deposition. Although tau PET shows great potential for enhancing the accuracy of AD diagnosis, it has yet to become a standard component of clinical AD assessments.
With the emerging availability of novel therapeutic options, a biomarker-based diagnosis of AD becomes even more important as suitable patients have to be selected properly and therapies have to be started as early as possible. Furthermore, biomarkers can support the probability estimation of patients with mild cognitive impairment (MCI) converting to AD, track disease progression, and assess treatment effects.
With the advent of new therapeutic options, biomarker-based diagnosis of AD is becoming increasingly important, as it is crucial to accurately select appropriate patients as early as possible. Moreover, biomarkers play a key role in estimating the likelihood of patients with MCI progressing to AD, tracking disease progression, and evaluating the effects of treatments.
However, the relationships between these biomarkers and their combined use in clinical practice require further exploration.
Therefore, the aim of this study was the evaluation of the relationship between 18F-FDG-PET and other common fluid and imaging AD-biomarkers in a clinical cohort of patients with cognitive decline and suspected AD.
Methods
Patients
All patients with a clinically detected memory decline (Mini-Mental State Examination (MMSE) < 27 points) and a common AD phenotype that underwent 18F-FDG-PET/computed tomography (CT) in our facility between January 2013 and January 2023 were included in this retrospective study. Clinical and imaging data including patient characteristics, CSF biomarkers, MMSE, 18F-FDG-PET, and 18F-Florbetaben-PET were assessed according to the patients’ medical records and examination results in all patients.
All procedures were in accordance with the ethical standards of the institutional and/or national research committee and with the 1964 Helsinki declaration and its later amendments or comparable ethical standards. The institutional review board approved this retrospective study. All patients signed an informed consent.
18F-FDG-PET/CT
All PET scans were acquired on a Philips Vereos PET/CT scanner (Philips Medical Systems, Cleveland, OH, USA). A 128 × 128 matrix and a slice thickness of 2 mm was used. Prior to tracer injection all patients fasted at least six hours and blood sugar levels were measured in order to exclude for hyperglycemia (blood glucose >150 mg/dl). All patients rested for 20 min in a quiet and dimmed room prior to and for 10 min after the intravenous injection of a mean activity of 214.1 MBq (± 22 MBq) 18F-FDG and scans were acquired 60 min after tracer injection. The scan duration was 10 min. Images were reconstructed with the ordered subset-expectation maximization (OSEM) algorithm with 3 reconstruction iterations and 15 subsets and attenuation correction was performed with a low-dose CT scan (CTAC-SG algorithm).
Semi-quantitative analysis was performed using the CortexID® software (GE Healthcare, Chicago, Illinois, USA) as described before.3,4 Briefly, PET images were spatially normalized, processed and co-registered automatically to the MRI-based ICBM152 Atlas (Montreal Neurological Institute/International Consortium for Brain Mapping). Using the brain atlas template, volumes of interest (VOI) were defined in 4 cortical regions that are mainly affected in AD: a posterior cingulate cortex/precuneus region, a temporal cortex region, a parietal cortex region, and a frontal cortex region. Standard uptake values (SUV) within the VOIs were measured. The pons region was used for image normalization.
18F-Florbetaben PET/CT
Amyloid-PET using the tracer 18F-Florbetaben PET/CT (Life Molecular Imaging GmbH, Berlin, Germany) was available in n = 29 patients. A mean activity of 315.7 MBq (± 20 MBq) 18F-Florbetaben was used. PET scans were acquired 90 min post-injection with an acquisition time of 20 min according to the manufacturer's protocol. Acquisition parameters and image reconstruction were used as described above.
Semi-quantitative analysis was performed using CortexID® as described above assessing the tracer uptake in the whole brain region as well as in the 4 cortical regions as described above. Standardized uptake value ratios (SUVR) were calculated using the whole cerebellum as reference region.
CSF biomarkers
Aβ42, Aβ40, total tau, and phosphorylated tau-181 in CSF were measured in the Neurochemistry Laboratory of the University Medical Center Göttingen using commercially available ELISA kits (INNOTEST® β-AMYLOID1-42 (Innogenetics, Gent, Belgium), IBL AMYLOID BETA 1-40 (IBL, Hamburg, Germany), INNOTEST hTAU Ag (Innogenetics, Gent, Belgium), and INNOTEST PHOSPHO-TAU 181P (Innogenetics Gent, Belgium), and the Aβ42/40 ratio was calculated (Aβ42/Aβ40) x10).
Statistical analysis
Statistical analysis was performed using GraphPad Prism version 9 (GraphPad Software, San Diego, CA, USA) and SPSS Statistics version 29 (IBM, Armonk, NY, USA) using unpaired t-test or univariate analysis of variance (ANOVA) followed by Bonferroni multiple comparison as indicated. Pearson's correlation and simple linear regression were used for the evaluation of the relationship between variables. Predictive power of individual biomarkers and their combinations was evaluated using multiple linear regression.
Data is presented as mean ± standard deviation (SD). Significance levels are given as follows: *p < 0.05; **p < 0.01; ***p < 0.0001.
Results
Patients
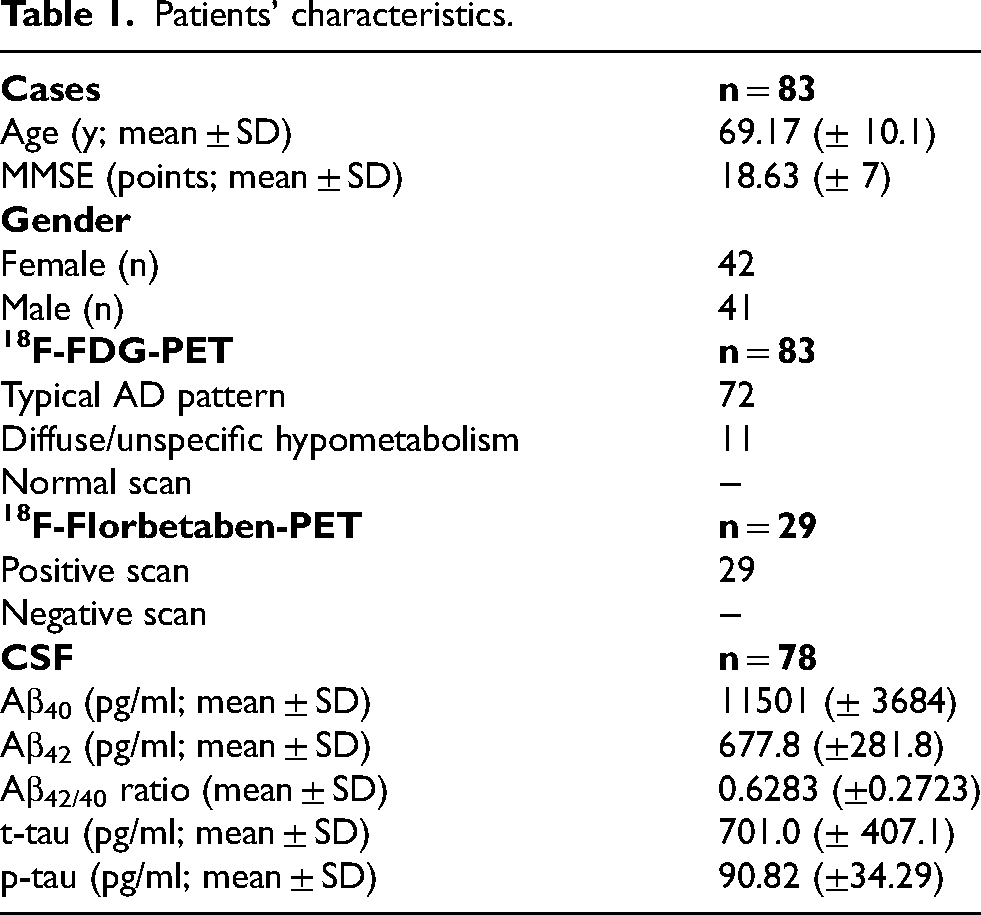
A total of n = 90 patients with objective memory decline and clinically suspected AD underwent 18F-FDG-PET between January 2013 and January 2023 in our facility. All patients showed a common AD phenotype. N = 7 patients had to be excluded due to missing CSF- or PET- data. Patients’ characteristics are shown in Table 1.
Patients’ characteristics.
Imaging biomarkers
18F-FDG-PET
18F-FDG-PET was available in all patients. N = 72 patients showed an AD-typical visual pattern with distinct hypometabolism in the posterior cingulate cortex, the precuneus, and the temporal cortex and n = 11 patients showed an unspecific or diffuse cortical hypometabolism. 18F-FDG uptake was semi-quantitatively analyzed in AD-typical regions of hypometabolism including the frontal cortex, posterior cingulate cortex/precuneus, temporal cortex, and parietal cortex. FDG-uptake in the temporal cortex was significantly lower compared to the frontal cortex, posterior cingulate cortex/precuneus, and parietal cortex (p < 0.0001; ordinary one-way ANOVA, Figure 1). The parietal cortex showed significantly lower SUV compared to the prefrontal frontal cortex and posterior cingulate cortex/precuneus region (p < 0.0001; ordinary one-way ANOVA, Figure 1).

Regional 18F-FDG uptake. FDG-uptake in the temporal cortex was significantly lower compared to the frontal cortex, PCC/precuneus, and parietal cortex region. The parietal cortex also showed significantly lower SUV compared to the prefrontal frontal cortex and PCC/precuneus region. Ordinary one-way ANOVA; ***p < 0.0001. FDG: Fluorodeoxyglucose; PCC: posterior cingulate cortex; SUV: standard uptake value.
18F-FDG uptake did not show significant differences between male and female patients (p > 0.51 in all areas; unpaired t-test). 18F-FDG uptake correlated with the patient's age in the posterior cingulate cortex/precuneus (p = 0.0009, r = 0.3581) and the parietal cortex (p = 0.0015, r = 0.3427; Pearson's correlation).
Amyloid-PET
18F-Florbetaben-PET was available in n = 29 patients. All patients showed a pathological 18F-Florbetaben uptake pattern in visual analysis. Semi-quantitative analysis did not show any significant differences in regional 18F-Florbetaben uptake (p = 0.221; ordinary one-way ANOVA, Figure 2).

Regional 18F-Florbetaben uptake. No regional differences in the 18F-Florbetaben uptake could be detected. Ordinary one-way ANOVA. PCC: posterior cingulate cortex; SUVR: standard uptake value ratio.
Whole brain 18F-Florbetaben uptake did not show significant differences between male and female patients (p = 0.5141; unpaired t-test). 18F-Florbetaben uptake did not correlate with the patient's age (p = 0.2555, r = -0.2182; Pearson's correlation).
Correlation between 18F-Florbetaben and 18F-FDG
Regional 18F-Florbetaben uptake did not correlate with the corresponding 18F-FDG uptake in the prefrontal cortex (p = 0.4719, r = 0.1446), the posterior cingulate cortex/precuneus (p = 0.1745; r = 0.2692), the parietal cortex (p = 0.4044, r = 0.1672), nor the temporal cortex (p = 0.9530; r = 0.01189; Pearson's correlation, Figure 3).
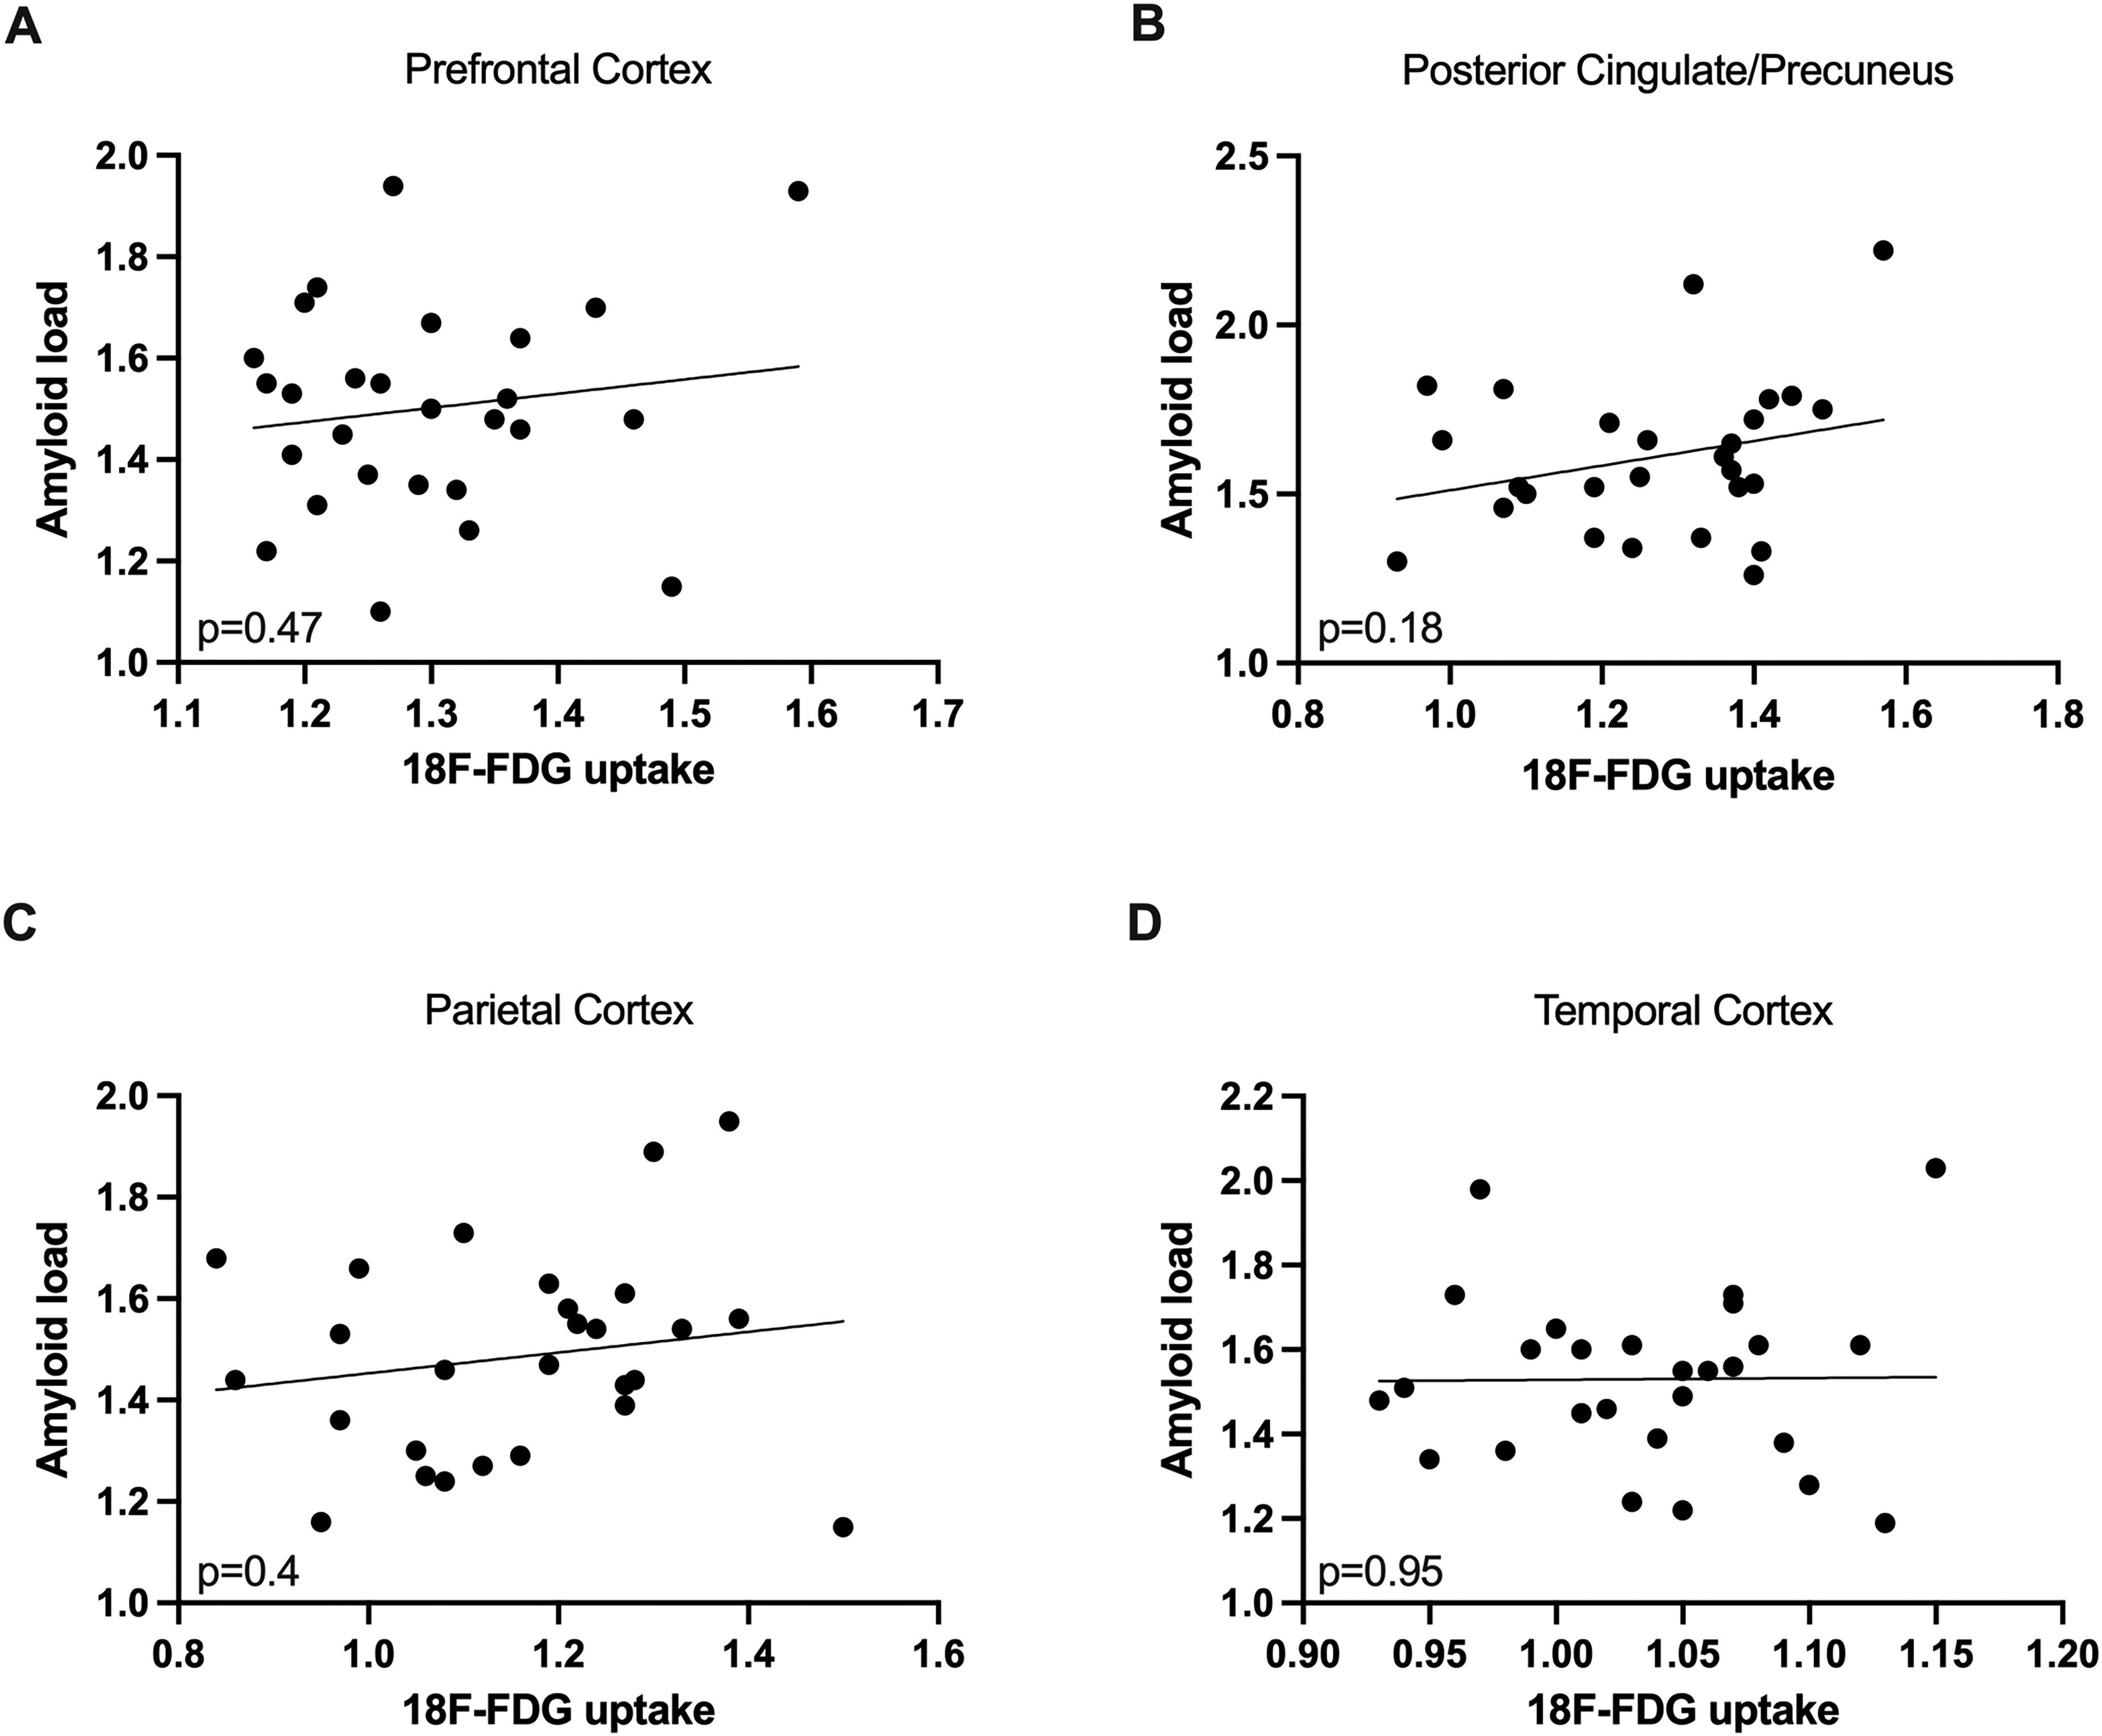
Correlation of regional Amyloid load and 18F-FDG uptake. Regional uptake of 18F-Florbetaben did not correlate significantly with regional 18F-FDG uptake (A-D). Pearson's correlation. FDG: Fluorodeoxyglucose.
CSF biomarkers
CSF biomarkers Aβ40, Aβ42, Aβ42/40 ratio, t-tau and p-tau were available in n = 78 patients. N = 72 patients showed pathological results in CSF markers (both amyloid and tau: n = 30; amyloid only: n = 3; tau only: n = 39). Mean CSF biomarker results are shown in table 1. CSF biomarkers did not correlate with the patient's age (p > 0.1 in all biomarkers; Pearson's correlation). Female patients showed significantly higher Aβ40 values compared to male patients (p = 0.0471; unpaired t-test). All other CSF biomarkers did not show significant differences between male and female patients (p > 0.1; unpaired t-test).
Correlation between 18F-FDG-PET and CSF biomarkers
CSF amyloid biomarkers
18F-FDG uptake correlated with Aβ40 in the posterior cingulate cortex/precuneus (p = 0.0169; r = 0.2697) and the temporal cortex (p = 0.0083; r = 0.2971; Pearson's correlation, Figure 4). 18F-FDG uptake correlated with Aβ42 in the posterior cingulate cortex/precuneus (p = 0.0006; r = 0.3789), the parietal cortex (p = 0.0004; r = 0.3896), and the temporal cortex (p < 0.0001; r = 0.4665; Pearson's correlation, Figure 4). 18F-FDG uptake correlated with the Aβ42/40 ratio in parietal cortex (p = 0.0004; r = 0.3356; Pearson's correlation, Figure 4). All other regions did not show significant correlations between 18F-FDG uptake and CSF amyloid markers (p > 0.07; Pearson's correlation, Figure 4).
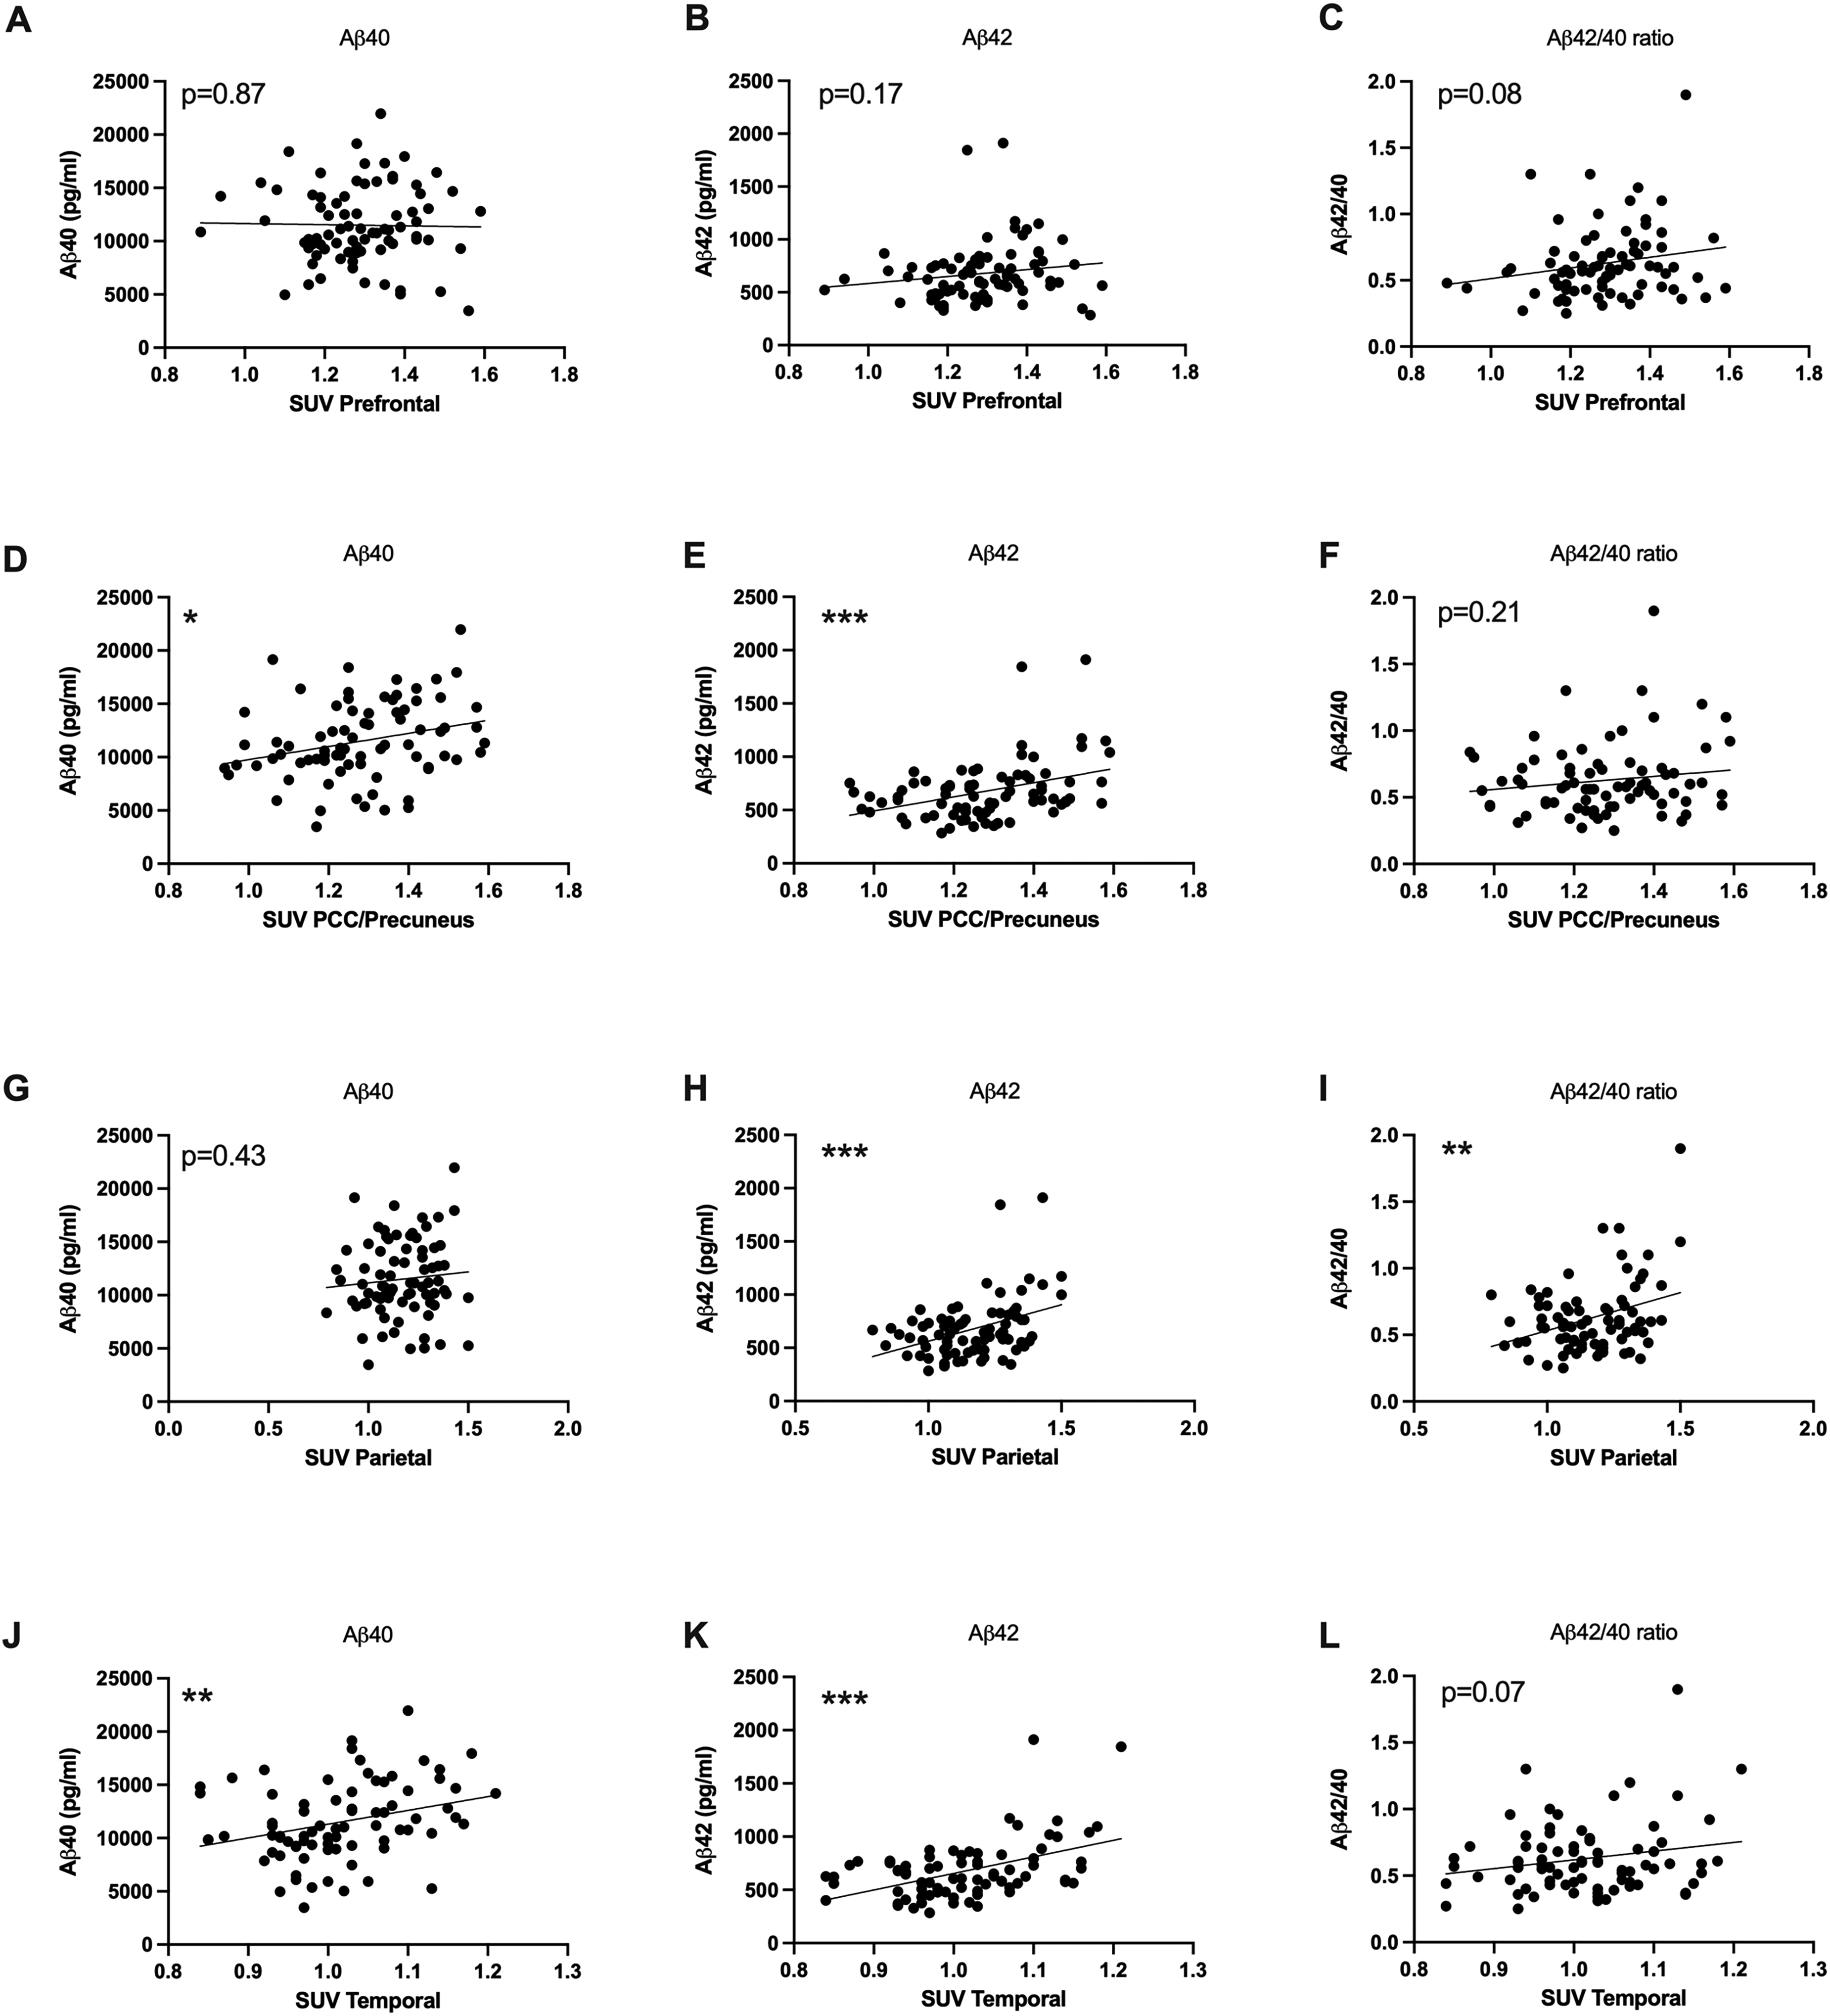
Correlation of CSF amyloid biomarkers and 18F-FDG uptake. 18F-FDG uptake correlated with Aβ40, Aβ42, and the Aβ42/40 ratio in several, but not all, tested brain regions. Pearson's correlation; *p < 0.05, **p < 0.001, ***p < 0.0001. FDG: Fluorodeoxyglucose; PCC: posterior cingulate cortex; SUV: standard uptake value.
CSF tau biomarkers
18F-FDG uptake correlated negatively with t-tau in the prefrontal cortex (p = 0.0002; r = -0.4079), the posterior cingulate cortex/precuneus (p = 0.0382; r = -0.2352), and the parietal cortex (p = 0.0144; r = -0.2761; Pearson's correlation, Figure 5). 18F-FDG uptake correlated negatively with p-tau tau in the prefrontal cortex (p = 0.0011; r = -0.3626) and the parietal cortex (p = 0.0171; r = -0.2693; Pearson's correlation, Figure 5).

Correlation of CSF tau biomarkers and 18F-FDG uptake. 18F-FDG uptake inversely correlated with t-tau and p-tau in the prefrontal cortex (A, B), the PCC/precuneus (C, D), and the parietal cortex (E, H). Pearson's correlation; *p < 0.05, **p < 0.001, ***p < 0.0001. FDG: Fluorodeoxyglucose; PCC: posterior cingulate cortex; SUV: standard uptake value.
All other regions did not show significant correlations between 18F-FDG uptake and CSF results (p > 0.1; Pearson's correlation, Figure 5).
Correlation between 18F-Florbetaben uptake and CSF biomarkers
Whole brain 18F-Florbetaben uptake correlated inversely with the Aβ42/40 ratio (p = 0.0218; r = -0.4566). Furthermore, 18F-Florbetaben uptake correlated with t-tau (p = 0.0209; r = 0.4592; Pearson's correlation; Figure 6). From the available n = 29 patients that underwent 18F- Florbetaben-PET, n = 16 patients (55%) showed normal results in CSF Aβ40, Aβ42, and the Aβ42/40 ratio. However, amyloid uptake between CSF-positive and CSF-negative groups did not show significant differences in 18F- Florbetaben uptake (p = 0.1288; unpaired t-test).
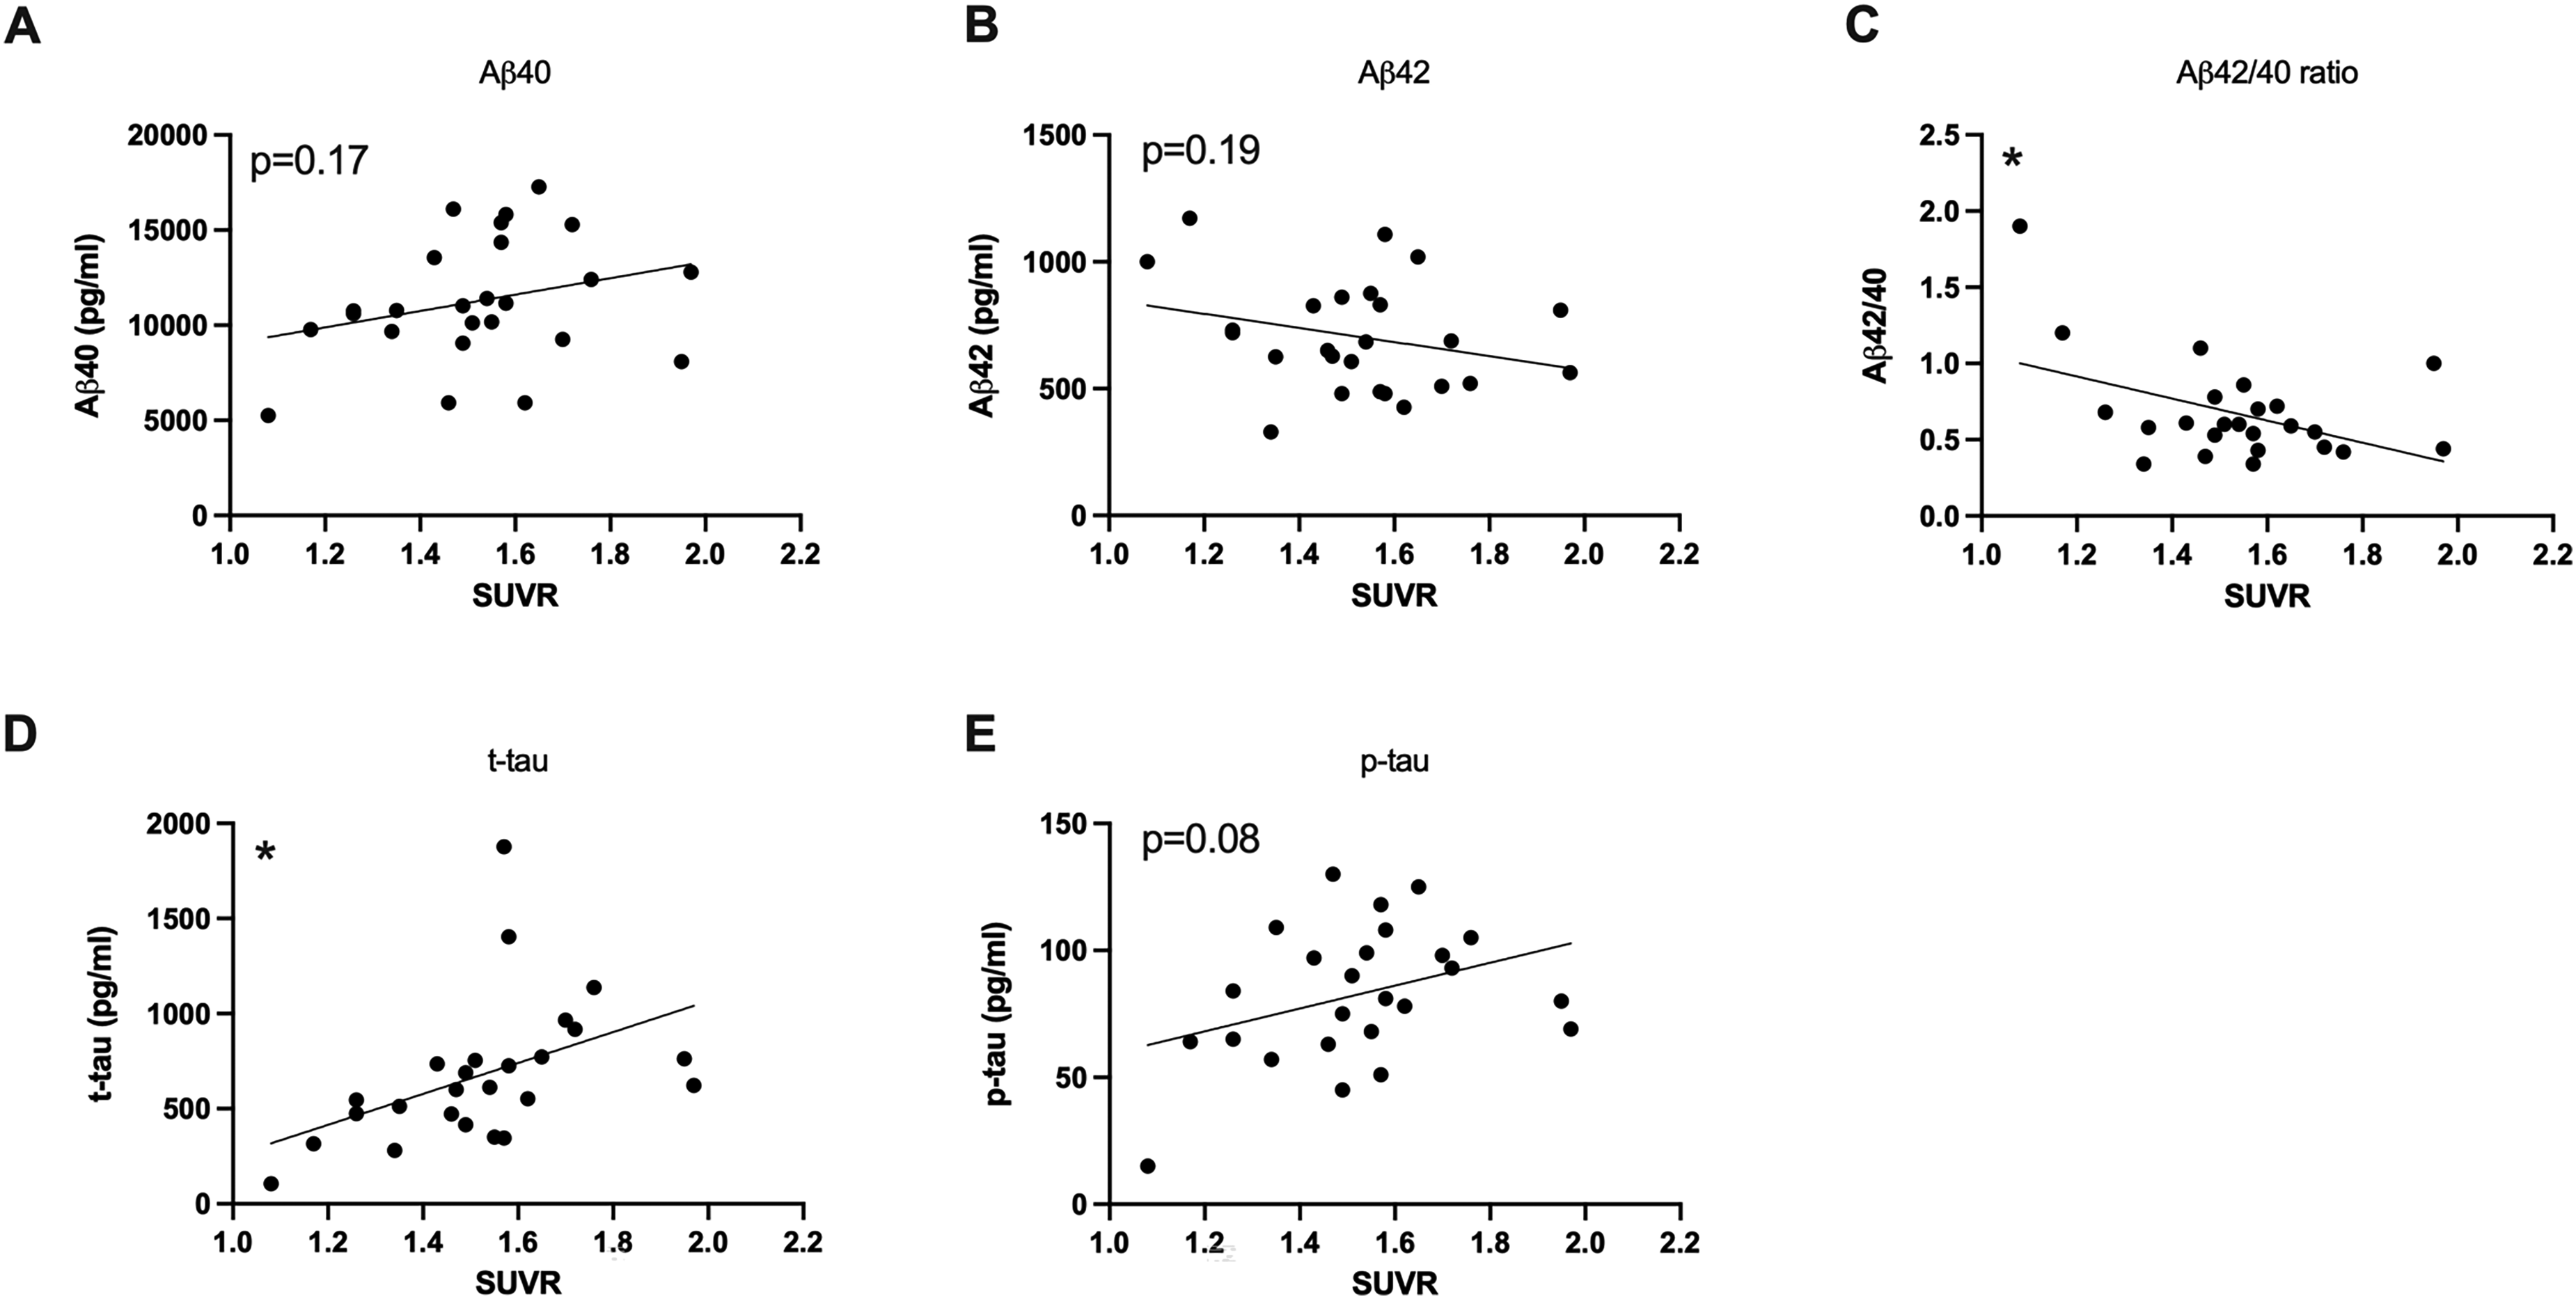
Correlation of CSF biomarkers and amyloid load. Whole brain 18F-Florbetaben uptake correlated inversely with the Aβ42/40 ratio. Furthermore, 18F-Florbetaben uptake correlated significantly with t-tau. Pearson's correlation; *p < 0.05. p-tau: phosphorylated tau; t-tau: total tau; SUVR: standard uptake value ratio.
Cognition
Mean MMSE score was 18.63 (± 7) points. There were no significant differences between MMSE in male and female patients (p = 0.4957; unpaired t-test). MMSE did not correlate with the patient's age (p = 0.1365, r = 0.1679; Pearson's correlation).
Correlation between 18F-FDG-PET and MMSE
18F-FDG uptake correlated with the MMSE the posterior cingulate cortex/precuneus (p = 0.0009; r = 0.3638), the parietal cortex (p = 0.0091; r = 0.2897), and the temporal cortex (p = 0.0042; r = 0.3171), while there was no correlation between MMSE and the 18F-FDG uptake in the prefrontal cortex (p = 0.6627; r = 0.0495; Pearson's correlation; Figure 7).
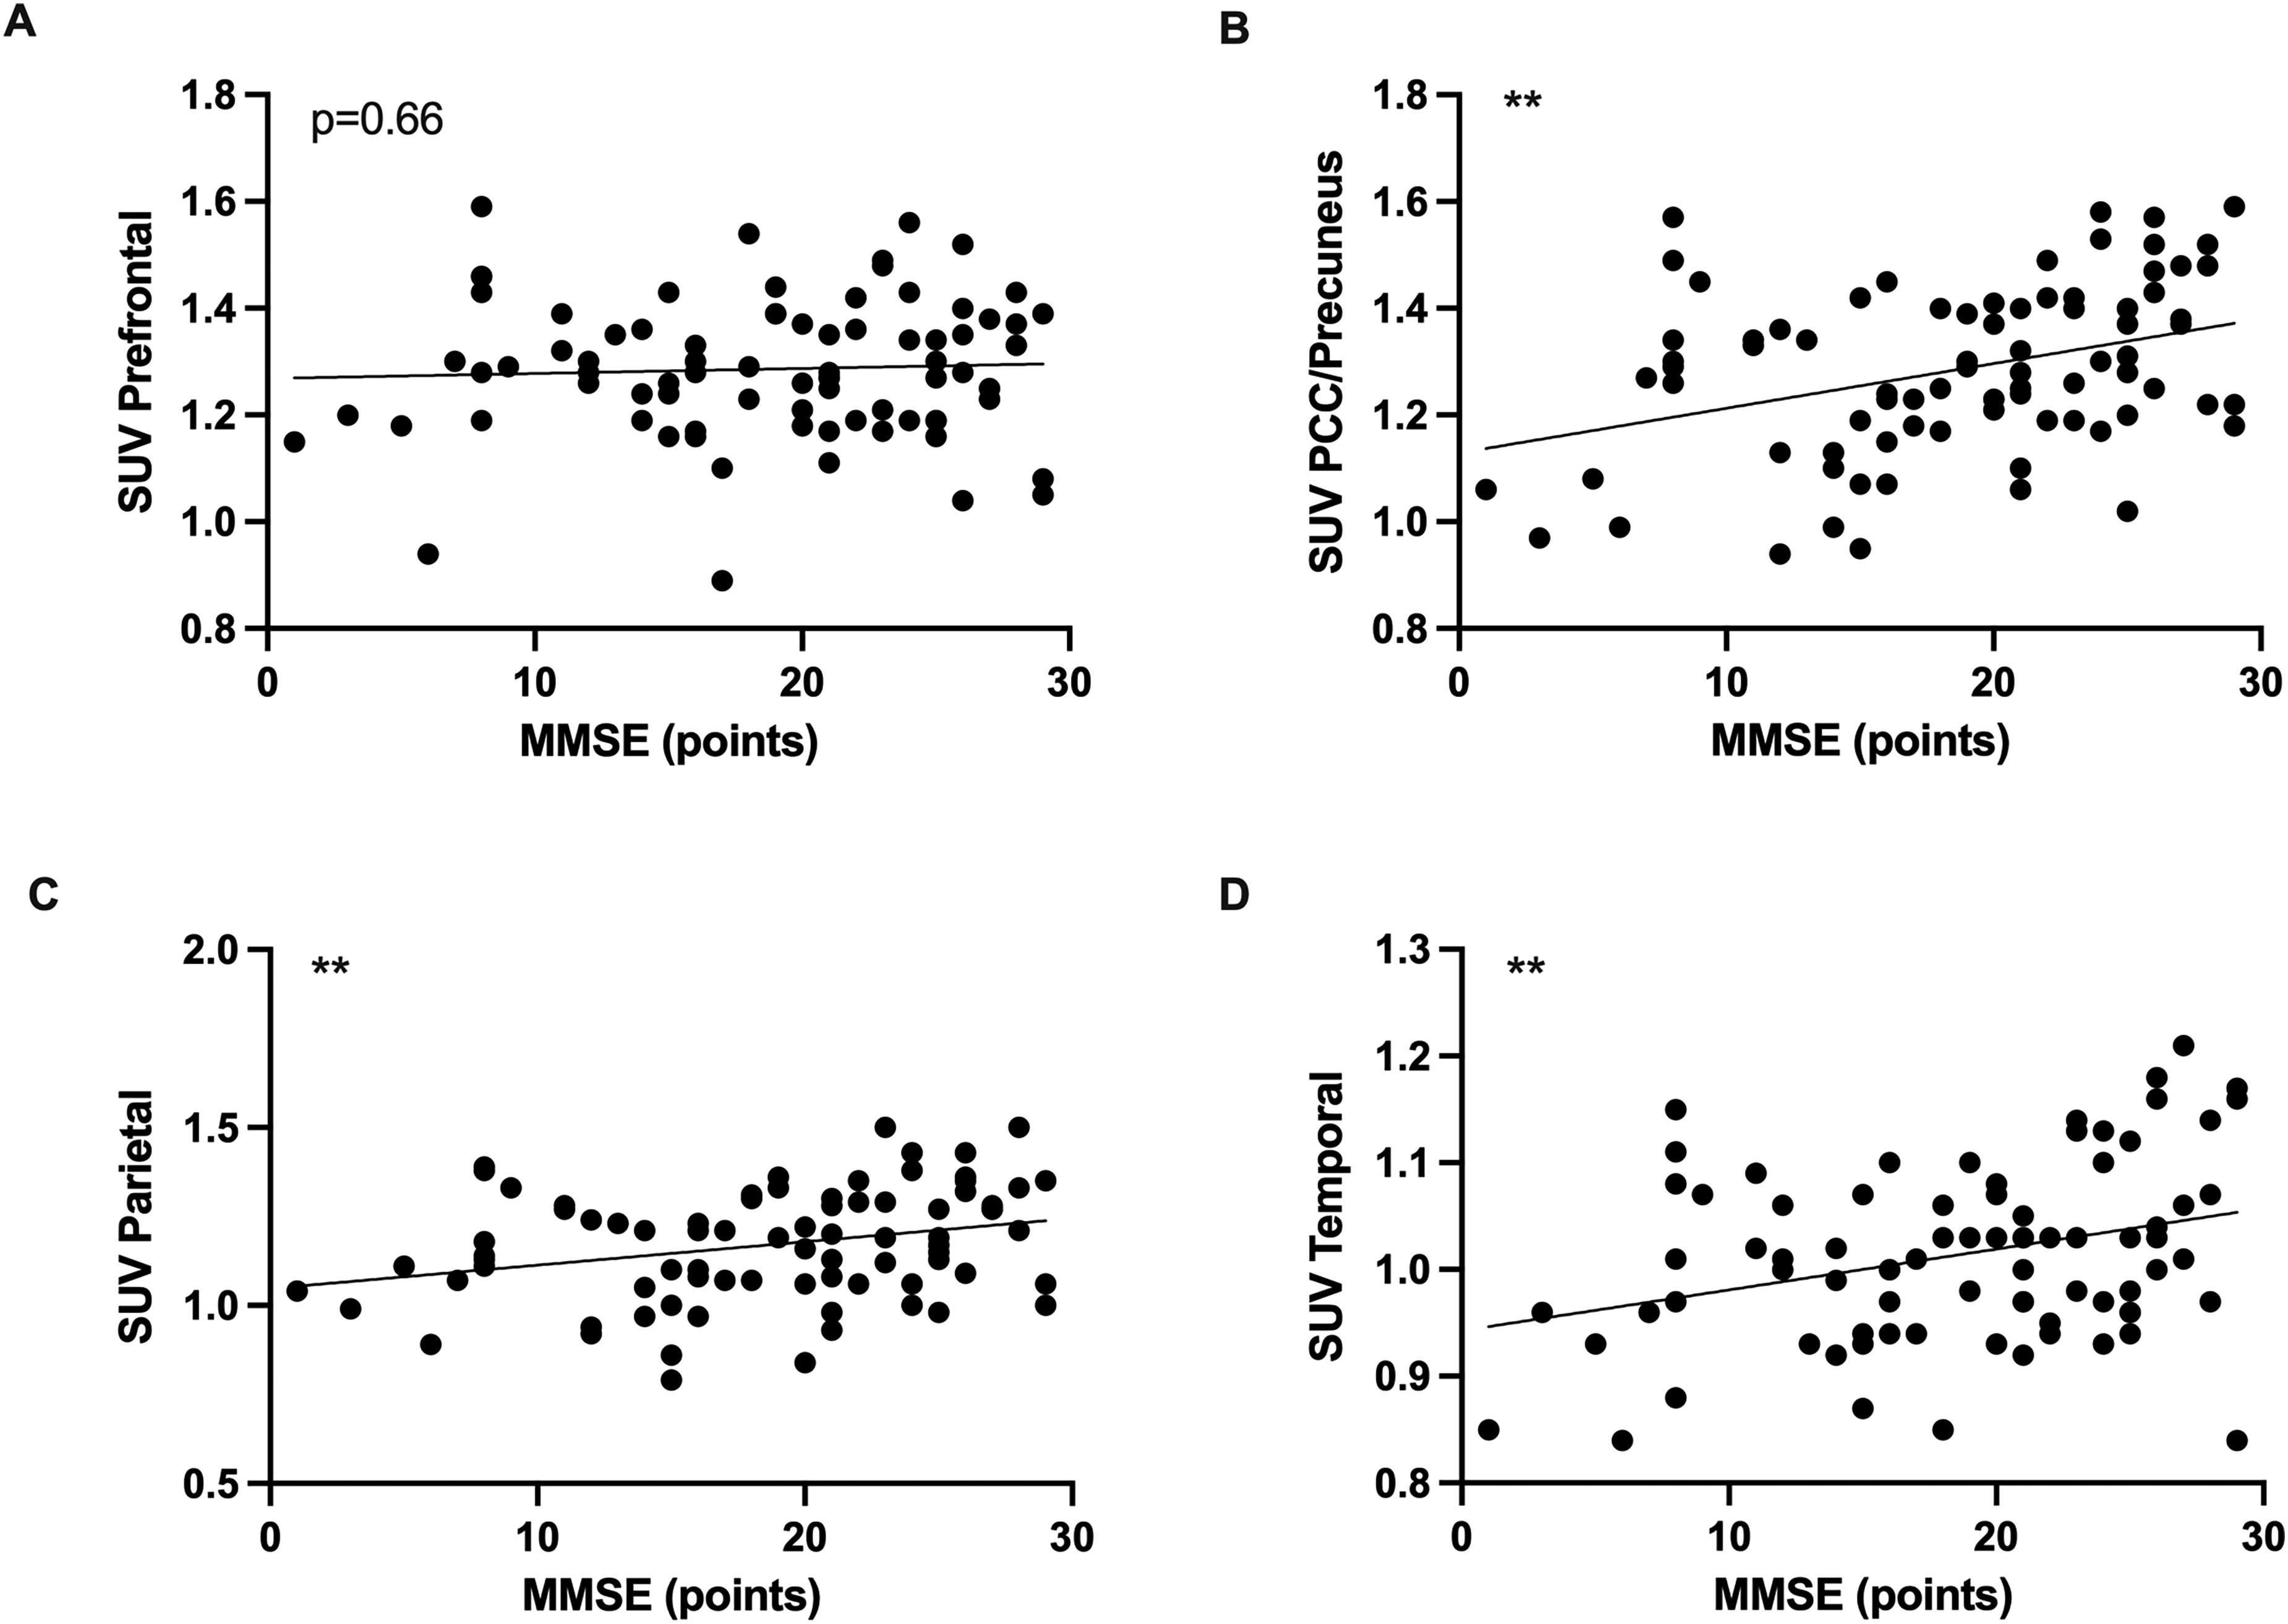
Correlation of 18F-FDG uptake and MMSE. 18F-FDG uptake correlated with MMSE in the PCC/Precuneus (B), the parietal cortex (C), and the temporal cortex (D). Pearson's correlation; **p < 0.01. FDG: Fluorodeoxyglucose; MMSE: Mini-Mental State Examination; PCC: posterior cingulate cortex; SUV: standard uptake value.
Correlation between Amyloid load and MMSE
18F-Florbetaben uptake did not correlate with MMSE (p = 0.0899; r = -0.3394; Pearson's correlation; Figure 8).
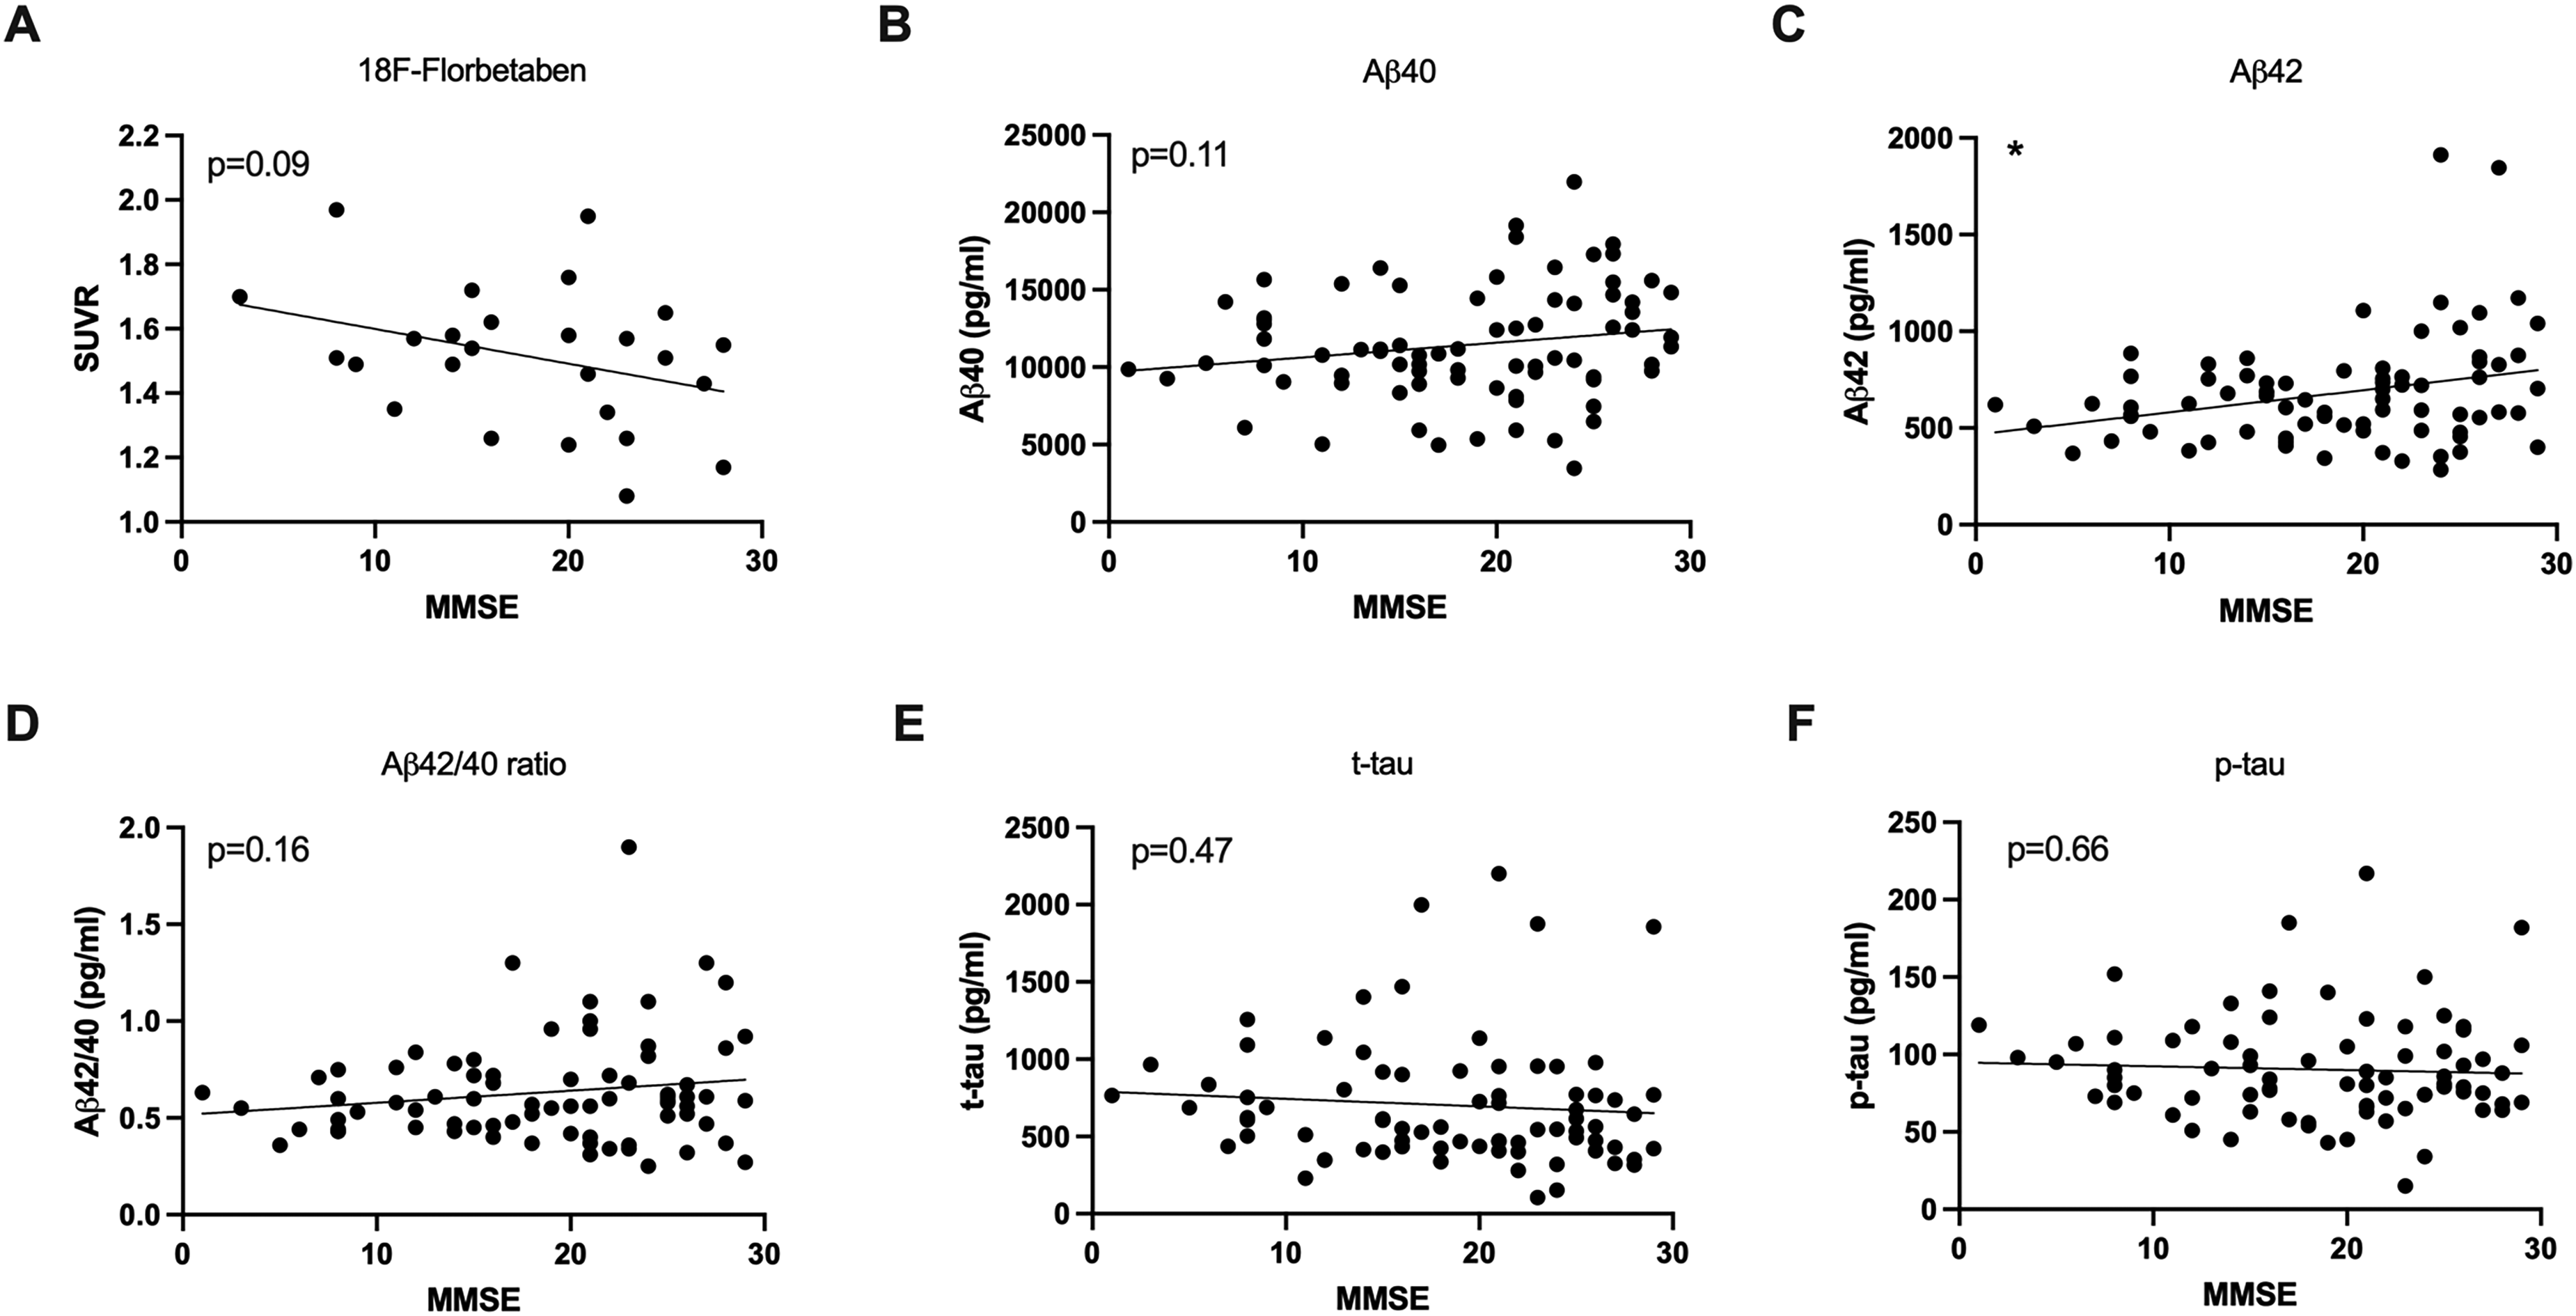
Correlation of Amyloid load and CSF biomarkers with MMSE. Aβ42 correlated significantly with MMSE (C). All other CSF markers and whole brain 18F-Florbetaben uptake did not correlate significantly with MMSE. Pearson's correlation; *p < 0.05. MMSE: Mini-Mental State Examination; SUVR: standard uptake value ratio.
Correlation between CSF and MMSE
MMSE correlated with CSF Aβ42 (p = 0.0121; r = 0.2848) while all other biomarkers did not correlate with MMSE results (p > 0.11; Pearson's correlation).
Predictive power of various biomarkers and their combinations for MMSE
To evaluate the accuracy of combined biomarkers in predicting disease severity using MMSE scores as a marker for cognitive decline, we applied multinomial linear regression models (Table 2).
Predictive power of various biomarkers and their combinations for the MMSE score.
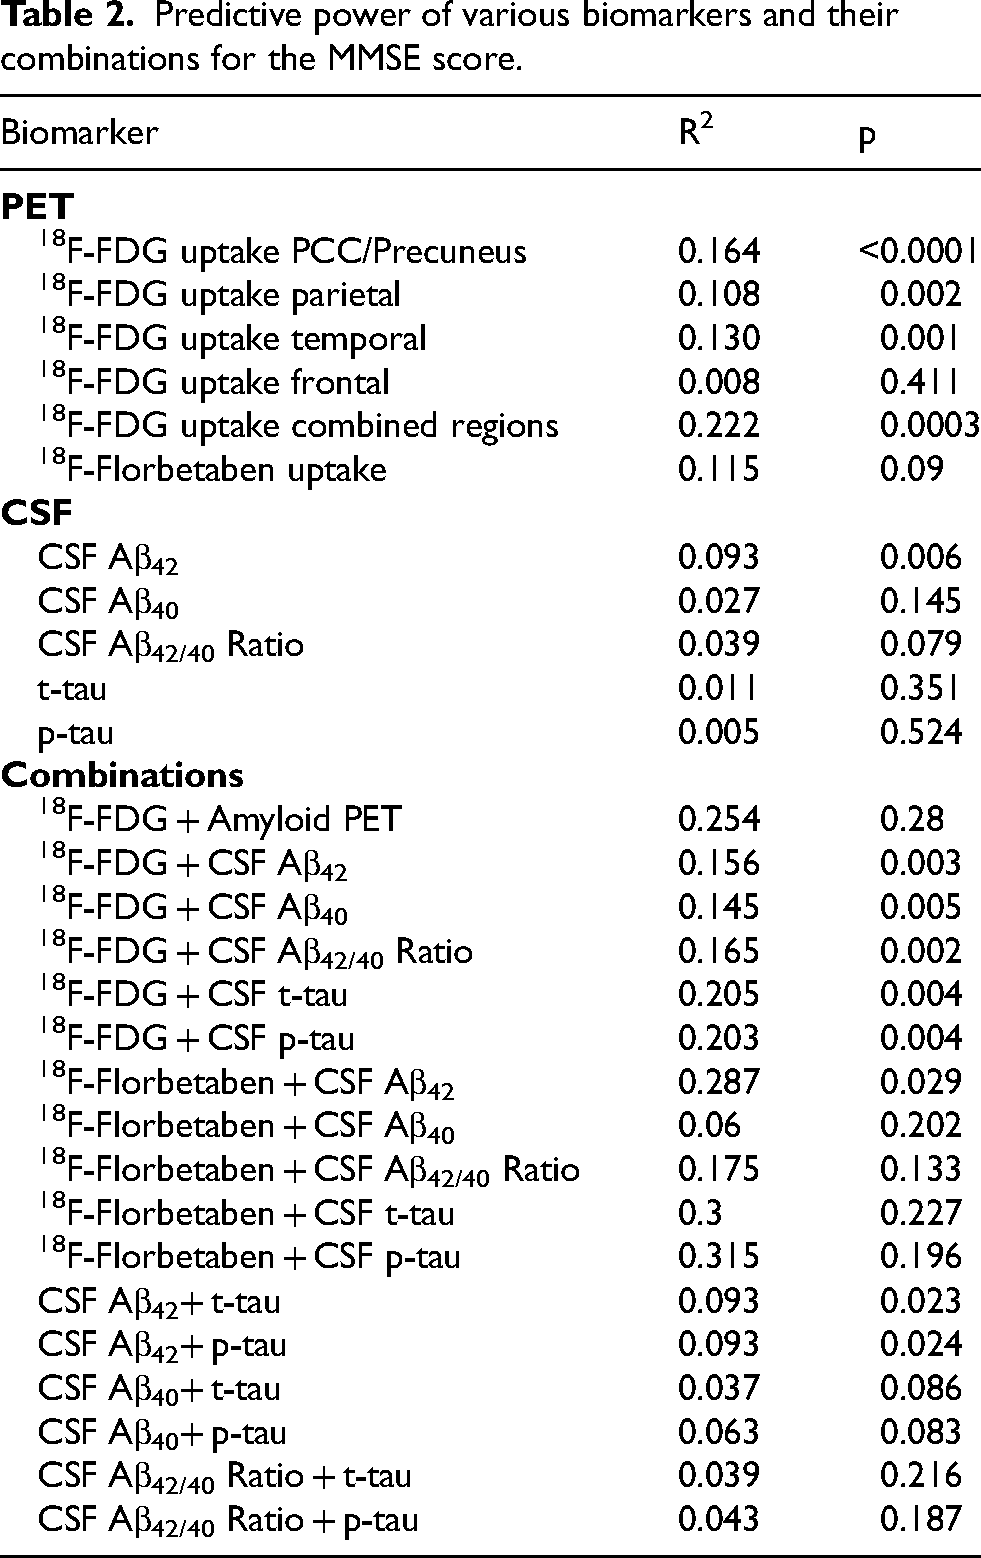
Regional 18F-FDG uptake in the PCC/Precuneus showed the highest predictive power of single regions (R2 = 0.164; p < 0.0001) while the combination of the PCC/Precuneus, parietal, temporal and frontal region provided the strongest prediction of MMSE (R2 = 0.222; p = 0.0003).
18F-Florbetaben uptake showed weaker predictive power (R2 = 0.115; p = 0.09) while CSF Aβ42 showed moderate predictive power (R2 = 0.093; p = 0.006). Other individual CSF biomarkers (CSF Aβ40, Aβ42/40 Ratio, t-tau, and p-tau) showed limited predictive utility when considered alone (R2 < 0.04; p > 0.79). However, combining CSF biomarkers with 18F-FDG improved the predictive power (18F-FDG + CSF Aβ42: R2 = 0.181; p = 0.004; 18F-FDG + CSF Aβ42/40 Ratio: R2 = 0.165; p = 0.002; 18F-FDG + CSF t-tau: R2 = 0.205; p = 0.004; 18F-FDG + CSF p-tau: R2 = 0.203; p = 0.004). Combinations among CSF biomarkers alone generally offered lower predictive power and were less reliable results for predicting MMSE scores.
Discussion
Given the increasing prevalence of AD and the emerging therapeutic opportunities, early and accurate diagnosis of the disease is becoming increasingly crucial. In addition to clinical assessment and neuropsychological testing, biomarkers capable of identifying different aspects of the disease in vivo are essential for establishing an AD diagnosis and identifying probable therapy responders.
According to the A/T/N model, the imaging biomarker 18F-FDG-PET is classified as a marker for neurodegeneration, offering insights into cerebral glucose metabolism across various brain regions. This imaging technique can reveal patterns of cortical hypometabolism, with AD being characterized by significant hypometabolism in the posterior cingulate cortex, precuneus, and posterior temporal cortex.2 Nevertheless, the role of 18F-FDG-PET in the clinical evaluation of AD patients and its relationship with other biomarkers remains uncertain. In the current study, we evaluated the relationship between 18F-FDG-PET and other common AD biomarkers including CSF Aβ40, Aβ42, Aβ42/40 ratio, t-tau, and p-tau as well as amyloid-PET results and cognition in a clinical cohort of patients with memory deficits and suspected AD.
18F-FDG-PET and amyloid biomarkers
Cortical amyloid deposition is a key pathological hallmark of AD. The accumulation of Aβ plaques begins more than 20 years before the onset of AD symptoms and is believed to impact synaptic function, neuroinflammation, synaptic destruction, and white matter integrity.5–7 Amyloid biomarkers, CSF and PET, enable the in vivo assessment of amyloid pathology. Amyloid PET imaging with 18F-Florbetaben or other available tracers allows direct visualization of cortical amyloid plaques, whereas CSF amyloid biomarkers measure the concentration of Aβ peptides, reflecting their production, clearance, and aggregation in the brain. The direct impact of amyloid plaque deposition on neuronal activity, neuron loss, and subsequent reduced glucose metabolism observed in 18F-FDG-PET remains unclear. Our current data did not show a direct correlation between regional 18F-FDG and 18F-Florbetaben uptake in our cohort. While there are no available studies on the relationship of regional 18F-Florbetaben uptake compared to 18F-FDG uptake, two studies showed an inverse correlation between regional amyloid tracer uptake and 18F-FDG uptake using 18F-Florbetapir and 11C-PiB.8,9 Contrary to our findings, a study by Edison et al. (2007) identified an inverse correlation between 11C-PiB uptake and the relative regional cerebral metabolic rate of glucose in the temporal and parietal cortex in a small cohort of 12 AD patients. Similarly, Newberg et al. (2012) demonstrated a negative correlation between 18F-Florbetapir and 18F-FDG uptake in the frontal, parietal, and temporal lobes in a cohort comprising AD patients and cognitively normal controls. Both studies suggest that areas with higher amyloid burden exhibit lower glucose metabolism, indicating a link between amyloid pathology and neuronal dysfunction. However, these findings could not be repeated in our cohort of AD patients. However, in the study by Newberg et al. (2012) the effect was only detectable for the whole group including cognitive normal subjects, but not in the analysis of the subgroup of AD patients only. Therefore, the disease specific correlation might be too subtle within the AD groups, especially as subjects with cognitive decline are typically in the later stages of AD when Aβ levels often plateau. Amyloid deposition may not always correspond directly with metabolic changes in the same brain regions. The two PET tracers assess different biological processes—neuronal metabolism versus amyloid deposition—and Aβ plaques might accumulate without immediately causing significant neuronal dysfunction or hypometabolism. Temporal dissociation could explain the lack of correlation in later stages. Amyloid pathology often appears in brain regions long before clinical symptoms arise or neuronal damage is detectable. Furthermore, neuronal dysfunction and hypometabolism may occur even in regions where amyloid plaques are not as prominent, potentially due to other downstream neurodegenerative mechanisms. In the early stages of AD or in preclinical AD, amyloid deposition may be significant without much neuronal damage or hypometabolism. As the disease progresses, hypometabolism may become more pronounced in regions where amyloid has already accumulated, but this might not happen uniformly across all brain regions. Additionally, the progression of AD involves complex interactions between amyloid pathology, and neurodegeneration, as well as other factors as tau pathology or vascular contributions, which may manifest differently across regions and stages of the disease.
Furthermore, the sheer presence of amyloid plaques might disrupt neuronal function, rather than the number of amyloid plaques influencing the quantitative impairment of neurons.
Understanding these differences reinforces the importance of using multiple biomarkers to capture the full spectrum of pathological changes in AD integrating different neuroimaging, laboratory, and genetic tools.10,11 Therefore, in clinical practice a multimodal approach to a diagnosis of AD, where different biomarkers can provide complementary information should be emphasized.
In our study, the predictive ability of 18F-FDG-PET was higher compared to 18F-Florbetaben results. Results are in line with earlier studies showing 18F-FDG-PET as a superior indicator of cognitive decline in AD and MCI patients compared to amyloid imaging. 12 Therefore, the role of amyloid imaging in the diagnostic workup of patients with suspected AD might be redefined in the future, especially regarding emerging anti-amyloid therapies. 13 18F-FDG-PET should be emphasized as an essential tool, especially in early stages of the disease.
However, high costs and limited availability is a major problem for implementing widespread PET scanning for all AD patients. Therefore, a diagnostic framework is needed, which incorporates CSF/serum biomarkers as accessible and economical “first line” tools, reserving PET imaging for more complex or uncertain cases, or for assessing disease progression at later stages.
CSF biomarkers
We demonstrated a correlation between 18F-Florbetaben uptake and CSF amyloid markers in a clinical cohort with memory deficits in an earlier study by our group. 14 Consistent with that study, our current data also show an inverse correlation between 18F-Florbetaben uptake and the Aβ42/40 ratio. Contrary to those findings, we did not detect a correlation between 18F-Florbetaben and Aβ42 in our current cohort. 18F-Florbetaben-PET and the Aβ42/40 ratio seem to provide complementary information about amyloid pathology. Other recent studies were able to demonstrate that the Aβ42/40 ratio in CSF or plasma may be a more accurate predictor of amyloid-PET positivity than Aβ42 alone.15–17 Additionally, combining 18F-FDG-PET with the Aβ42/40 ratio has been proposed as the most accurate predictor of a positive amyloid scan. 16
Despite these insights, data on the direct relationship between regional 18F-FDG uptake and CSF amyloid markers remains limited. In our current study, 18F-FDG uptake correlated primarily with Aβ42 in several brain regions commonly affected by AD, while the Aβ42/40 ratio only correlated with 18F-FDG uptake in the parietal cortex. A study on the indirect effect of cortical hypometabolism on the association of CSF and cognitive decline described that low baseline levels of Aβ42 were associated with low initial glucose metabolism, aligning with our results. 18 Conversely, one study reported an unexpected inverse correlation between Aβ42 in CSF and 18F-FDG uptake in the precuneus/posterior cingulate, suggesting an increase of Aβ42 during the clinical phase of AD. 19 The inconsistent results on the relationship between CSF Aβ42 levels and glucose metabolism across studies may be explained by methodological differences, such as variations in participant selection or the stage of AD. Aβ42 deposition and metabolic changes may follow a different pattern in different stages of the disease or compensatory metabolic activity or regional neuroinflammation might lead to such findings. Furthermore, fluid biomarkers provide a comprehensive overview of disease pathology but do not provide information about region-specific changes in the brain.
18F-FDG-PET and tau biomarkers
Although there is evidence of a direct association between tau deposition and neuronal dysfunction, data on the relationship between regional 18F-FDG uptake and CSF tau markers remain limited.20,21 In this study, 18F-FDG uptake was inversely correlated with both forms of CSF tau, t-tau and p-tau, across several brain regions. Similarly, a study by Leuzy et al. (2019) demonstrated a negative association between 18F-FDG uptake and CSF tau levels. These findings align with our results, supporting the notion of a direct relationship between tau pathology, synaptic integrity, and neurodegeneration. 22
Cognition
Various studies demonstrated the correlation of MMSE and cerebral 18F-FDG uptake indicating a direct relationship between cognitive function and cerebral glucose metabolism.8,23,24 Findings are in line with our results that also show a correlation of MMSE scores and regional 18F-FDG uptake in different brain regions.
18F-Florbetaben uptake did not correlate with MMSE in our current cohort. Findings are in line with earlier studies using different amyloid tracers that could not show a correlation between amyloid load and MMSE.25,26 Furthermore, histological studies could not demonstrate a relationship between amyloid plaque density and cognitive impairment, either.27,28 Assuming that cerebral glucose metabolism is linked to cognitive decline, those findings also fit the above-mentioned results of a missing correlation between 18F-Florbetapir and 18F-FDG-uptake.
In our study, only CSF Aβ42 showed a correlation with MMSE scores. These findings are consistent with earlier research from our group, which also demonstrated a correlation between Aβ42 levels and MMSE scores in a clinical cohort of patients with memory deficits. 14 However, the existing data do not conclusively support a direct linear relationship between Aβ42 levels and MMSE scores. While some studies have reported correlations between CSF markers and cognitive tests that assess verbal and visuospatial episodic memory, others have found no significant relationship between CSF markers and the degree of cognitive impairment in AD.29–31
Regional FDG uptake and age
Interestingly, FDG uptake correlated with age in our cohort of patients with memory deficits. This finding seems counterintuitive as studies on the effect of aging on 18F-FDG-uptake shows a decrease in brain metabolism during aging in healthy subjects.32–35 To our knowledge, there is no published data on the correlation of regional 18F-FDG uptake and aging in dementia patients. Unpublished data from our group on regional 18F-FDG uptake in AD patients from the ADNI cohort did not show a correlation between age and 18F-FDG uptake in the PCC and parietal cortex, while the MCI and cognitive normal groups did show a significant negative correlation between age and regional 18F-FDG uptake in these regions. While decreased 18F-FDG uptake in the PCC and parietal cortex is a typical finding in AD compared to cognitively normal subjects, relatively increased or stable FDG uptake within the AD group within these areas may reflect some kind of compensatory mechanisms or regional neuroinflammation in the course of the disease. However, these results remain unclear and need further investigation in future studies.
Limitations
Limitations of our study include the retrospective design. Due to this study design, the data collection relied on the patients’ medical records and clinical examinations, without a standardized protocol. Therefore, the assessment of different biomarkers relied on the clinical decision for each patient individually and not all necessary data were available for all patients as not all underwent lumbar puncture or additional amyloid imaging and other demographic data as years of education or marital status or additional cognitive assessment were not available. Furthermore, the patients’ characterization as patients with suspected AD was based on clinical data, histopathologic proof was not available. Although the patient data were obtained from a reputable source and thoroughly reviewed, variations in clinical settings and documentation practices could introduce biases or inconsistencies.
Furthermore, comparison to MRI techniques as quantitative susceptibility mapping or blood-brain barrier function were not included in our study. However, earlier studies were able to show associations between 18F-FDG uptake and both, brain iron status and blood brain barrier dysfunctions, in MRI.36–39 Therefore, further exploration of the relationship between the results especially in regards of underlying mechanisms would be an interesting approach in future studies.
Furthermore, the use of the MMSE as the sole cognitive assessment tool limits the ability to fully characterize the severity of cognitive impairment. We will note that more comprehensive cognitive testing, such as the use of the Alzheimer's Disease Assessment Scale or Montreal Cognitive Assessment could provide a more detailed picture of cognitive decline.
In order to overcome these limitations prospective studies using a combination of different biomarkers following a standardized protocol in larger cohorts are needed.
Overall, different fluid and imaging biomarkers of AD provide important information on AD pathologies. 18F-FDG-PET provides information on regional neuronal function and shows direct links to common biomarkers in CSF and cognition, while there was no correlation to regional amyloid deposition in 18F-Florbetaben-PET. It remains that a combination of biomarkers seems most accurate in the diagnostic workup of AD patients. Our data suggests that 18F-FDG PET alone and its combination with CSF biomarkers are the most effective predictors of MMSE scores. These findings highlight the value of 18F-FDG PET and combined PET and CSF biomarker models over single use of CSF biomarkers or amyloid PET for assessing cognitive performance in the context of dementia diagnostics.
The suitability of invasive methods as lumbar puncture and the use of imaging modalities should be considered for each patient on the individual level. Furthermore, novel amyloid and tau measurements in blood plasma samples should be considered in future studies as measurement techniques have been improved. Biomarkers can also be used to feed larger databases in future studies focusing on big data analysis of larger cohorts aiming for a larger information gain and the creation of suitable databases for deep learning strategies to optimize a multi-biomarker approach on the individual patient level.
Biomarkers are crucial for diagnosing AD as they reflect various aspects of AD pathology. Regional 18F-FDG-uptake and the combination of fluid and imaging biomarkers appears to provide the most accurate characterization of AD and disease severity. As an independent biomarker of neurodegeneration, 18F-FDG-PET can directly detect regional changes in neuronal function and effectively complement CSF biomarkers within the A/T/N framework, enhancing the differentiation between AD and other forms of dementia.
Footnotes
Acknowledgments
We acknowledge support by the Open Access Publication Funds of the Göttingen University.
Author contributions
Katharina Woyk (Data curation; Investigation); Niels Hansen (Data curation; Investigation); Jens Wiltfang (Writing – review & editing); Claudia Lange (Data curation; Investigation; Writing – review & editing); Caroline Bouter (Conceptualization; Data curation; Formal analysis; Investigation; Methodology; Project administration; Supervision; Validation; Visualization; Writing – original draft).
Funding
The authors received no financial support for the research, authorship, and/or publication of this article.
Declaration of conflicting interests
The authors declared no potential conflicts of interest with respect to the research, authorship, and/or publication of this article.
Data availability
The data supporting the findings of this study are available on request from the corresponding author. The data are not publicly available due to privacy or ethical restrictions.