
Abstract
Background
Alzheimer's disease (AD) is the most common type of dementia, and early screening is crucial for intervention.
Objective
Currently, early screening for older adults without dementia primarily rely on cognitive scale. This study aims to explore a more feasible approach.
Methods
Plasma biomarkers (Aβ42/40, p-tau181 and p-tau217) and Gaussian mixture models (GMM) were utilized for stratifying risk levels in older adults without dementia from the Alzheimer's Disease Neuroimaging Initiative. Linear mixed effects model was employed to compare subsequent pathological and cognitive changes, alongside a comparison with traditional scale-based screening methods. Cox regression model was used to assess the risk of progression to dementia across different biomarker status groups.
Results
Plasma Aβ42/40 and p-tau217 effectively predicted Aβ PET pathological progression, while p-tau217 also predicted tau PET changes. All three biomarkers could forecast the progression of FDG PET and cognitive function. P-tau217 and p-tau181 significantly modulated pathology-related cognitive impairment. All three biomarkers could predict dementia risk. The screening method combining GMM with plasma biomarkers demonstrates superior predictive ability compared to traditional scale-based approaches.
Conclusions
Our study indicated that the combination of GMM and plasma biomarkers for community screening shows promising potential in monitoring brain health among older adults without dementia. P-tau217 exhibited the best predictive value among the three plasma biomarkers.
Introduction
Alzheimer's disease (AD), the most common cause of neurodegenerative dementia, poses a substantial global health challenge, affecting millions of people across the world. The central neuropathological hallmarks of AD include the presence of amyloid-β (Aβ) and tau pathology. 1 The diagnosis of AD primarily relies on clinical manifestations, with symptoms evident in the later stages, when the treatment effectiveness is limited. 2 The inability to effectively intervene the progression of AD leads to a continued increase in the number of patients, placing a significant burden on both the families of the patients and the social healthcare system. In recent years, advancements in biomarkers have facilitated a shift in the diagnosis of AD from the late dementia stage to the early stages, offering the potential for pre-symptomatic detection. 3
When the focus shifts towards early diagnosis and intervention, the target population for health management naturally transitions to older adults without dementia. These individuals typically do not display symptoms, or only exhibit mild cognitive decline detectable through screening tests, which does not impact their daily living. When conducting biomarker testing among these populations, several factors (i.e., less trauma, lower costs, and the ability for repeated measurements) determine the feasible application on a large scale. Fortunately, the emergence of a large number of blood biomarkers has brought hope to researchers who are dedicated to conquering AD.4–9
The robustness of blood biomarkers in practical applications is susceptible to factors such as population heterogeneity. 10 Establishing specific cutoff values for biomarkers based on different population characteristics carries significant clinical implications. However, the commonly used method for determining cutoff values based on receiver operating characteristic (ROC) curves primarily relies on supervised learning algorithms, which require a large amount of clearly labeled sample data. 11 This not only increases research costs but also necessitates the support of specialized research teams, thus limiting the application of blood biomarkers in grassroots medical institutions. It is noteworthy that cutoff value determination based on disease labels may obscure the unique information inherent in the biomarkers themselves. In contrast, the Gaussian Mixture Model (GMM), as an unsupervised learning method, can automatically identify underlying patterns in data without requiring explicit disease labels.12,13 This approach is particularly well-suited for handling the common multimodal distribution characteristics of blood biomarker data within community populations, enhancing the accuracy of disease screening. Given the statistical properties of GMM and its adaptability to data distributions, this method may represent an optimal choice for establishing biomarker cutoff values in community screenings.
Therefore, we combined GMM and plasma biomarkers to predict brain health status. We conducted a systematic assessment to determine whether baseline biomarker status can predict future pathological changes and subsequent cognitive alterations. Additionally, we evaluated the potential of baseline biomarker status to identify individuals who are at a heightened risk for developing dementia. To validate the efficacy of this approach, we compared biomarker-based screening method with the traditional scale-based screening methods.
Methods
Participants and data source
Data used in the preparation of this article were obtained from the Alzheimer's Disease Neuroimaging Initiative (ADNI) database (adni.loni.usc.edu). The ADNI was launched in 2003 as a public-private partnership, led by Principal Investigator Michael W. Weiner, MD. The original goal of ADNI was to test whether serial magnetic resonance imaging (MRI), positron emission tomography (PET), other biological markers, and clinical and neuropsychological assessment can be combined to measure the progression of mild cognitive impairment (MCI) and early AD. The current goals include validating biomarkers for clinical trials, improving the generalizability of ADNI data by increasing diversity in the participant cohort, and to provide data concerning the diagnosis and progression of AD to the scientific community. For up-to-date information, see adni.loni.usc.edu. Participants underwent baseline and a series of longitudinal assessments. Calculated the cutoff using populations that had undergone plasma biomarker testing. Conducted longitudinal studies in populations with follow-up clinical diagnoses, PET scans, and cognitive assessments. Our study exclusively included participants who were either cognitively normal (CN) or experiencing MCI (Figure 1).

Summary of the study's structure. The research overview outlines the procedures for selecting and analyzing the study population. qCPs: quantified cognitive processes; CN: cognitively normal; MCI: mild cognitive impairment.
Plasma biomarkers acquisition
Plasma concentrations of phosphorylated tau (p-tau) 181 and p-tau217 were assessed using the highly sensitive single molecule array (SIMOA) technology platform.14,15 An in-house plasma p-tau181 assay was performed utilizing two monoclonal antibodies for accurate quantification. Quantifying pTau-217 levels in plasma samples using ALZpath Quanterix Simoa® pTau-217 v2, a digital immunoassay method.
Plasma Aβ42/40 ratio was measured as previously reported. 16 Briefly, immunoprecipitation of Aβ isoforms from human plasma was conducted with minor adjustments. The immunoprecipitation process utilized a monoclonal anti-Aβ antibody, and samples were supplemented with labeled Aβ isoforms serving as reference standards. Following enrichment, proteins were digested into peptides, treated with performic acid, and purified. Then, LC-MS/MS was performed on a mass spectrometer.
PET acquisition
Aβ PET imaging used 18F-Florbetapir in ADNI. 17 The FreeSurfer tool was used to analyze MRI scans of participants, focusing on a defined cortical area that encompasses the lateral parietal, cingulate (both anterior and posterior), frontal, and lateral temporal. In addition, a comprehensive reference area was created, comprising the brainstem/pons, the full cerebellum, and the subcortical white matter. Following this, the florbetapir scans were synchronized with the MRI scans that were closest in timing. By dividing the specified cortical area by the composite reference areas, the florbetapir standardized uptake value ratios (SUVRs) were calculated.
Tau was quantified and staged using 18F-flortaucipir (AV1451), with interest regions defined based on Braak stages (Braak1, Braak3/4, and Braak5/6). 18 The reference region was designated as the grey matter of the inferior cerebellum. To reduce the effects of non-specific binding of flortaucipir, a partial volume correction technique was employed. The ADNI Braak2 region, affected by non-specific binding contamination, was subsequently removed from further analysis.
FDG PET images underwent preprocessing, which involved averaging counts across temporal, angular, and posterior cingulate areas to minimize variability between scanners. This preprocessing aimed to standardize the spatial resolution and intensity range of FDG PET data for subsequent analyses. This preprocessing included dynamically co-registering images from successive time frames, averaging these images, reorienting them along the anterior-posterior commissure line, and applying a filter function specific to each scanner.
Cognitive and clinical measures
Quantified cognitive processes (qCPs) offer a quantitative assessment of cognitive function in ADAS-Cog Word Recall tests (WLM). 19 The method is based on a Hierarchical Bayesian Cognitive Processing (HBCP-2) model to quantify the recall of each word, accounting for shuffled presentation, participant-specific parameters, and improved adjustments for ADAS-Cog WLM test features. HBCP-2 produced seven base qCPs (Supplemental Figure 1), representing the probabilities for information processing through distinct encoding (N1, N2, N3, and N4) and retrieval pathways (R1, R2, and R3).
Standardization of cognitive composite scores, which include memory (MEM), executive function (EF), and language (LAN), was carried out as described in previous reports. 20 This process involved meticulous documentation and mapping of neuropsychological battery items onto specific cognitive domains. To ensure data quality, initial checks, recoding, and consistent handling of missing data were performed. Confirmatory factor analyses using single factor and bifactor models were performed, employing both fit statistics and comparisons of loadings and scores among various models to finally identify the most appropriate model for each cognitive domain.
Calculation of plasma biomarker cut-off values
The cutoff values for plasma biomarkers were established using a GMM. The calculations were performed using the R package available at https://github.com/choisy/cutoff. Briefly, a fitted Finite Mixture Model (FMM) was employed to compute the probability for each distribution based on the data, allowing the identification of the cutoff value according to the type-I error probability. Confidence intervals for the cutoff were determined via Monte Carlo simulations, sampling FMM parameters to fit a normal distribution through maximum likelihood estimation. 21 Before the calculation, the median absolute deviation method was applied to filter out outliers, which were set as beyond 3 times the standard deviation from the median.
Statistical analysis
Descriptive statistical analyses were conducted on the baseline data of the participants included in the study. Descriptive data analysis of continuous variables was conducted using a two-tailed t-test, while descriptive data analysis of categorical variables was performed using the χ2 test. Linear mixed effects (LME) model was employed to model longitudinal cognitive and PET alterations, using fundamental model parameters such as age, sex, educational background, and APOE ε4 genotype. Incorporating an interaction term involving the biomarker status and follow-up duration was used to ascertain significant disparities in cognitive and PET alterations between the two groups. The LME model accounted for both random intercepts and slopes of time, unique to each participant. To investigate the moderation effects of biomarker status, interactions between longitudinal PET data and biomarker status, as well as random effects of longitudinal PET data, were added into the model2. In order to compare the predictive abilities of biomarker status and phenotypic diagnosis on future cognitive and PET changes, we further constructed model3 based on biomarker status, follow-up time, phenotypic diagnosis, and the interaction terms among these factors. Cox regression model was used to investigate significant variations in the future risk of dementia among populations with distinct biomarker statuses. Included parameters were the status of biomarkers and the fundamental model parameters as mentioned before. By independent application of cox regression model to the CN and MCI populations, we comparatively evaluated the risk of progressing to dementia in populations with the same phenotype but different biomarker status. Statistical analyses were conducted with the aid of the R language, version 4.2. FDR correction was applied to all statistical analyses with a two-tailed significance level set at 0.05.
Results
Study population characteristics
The detailed features of the study population were provided in Table 1 and Supplemental Tables 1 and 2. A total of 989 non-demented individuals (464 women and 525 men; average 74 ± 7 years old) were included in the study, including 423 CN and 566 MCI. The mean duration of follow-up was 70 months. At baseline, the MCI participants showed significant lower in cognitive-related scores. The SUVR measurements for Aβ PET and Tau PET were elevated in participants with MCI relative to those in the CN group, while the FDG PET SUVR was lower than CN. The cutoff values calculated for p-tau181, p-tau217, and Aβ42/40 reached 21.93, 0.42, and 0.13, respectively (Supplemental Figures 2–4). Values above the cutoff suggests normal levels of Aβ42/40 and abnormal levels for p-tau181 and p-tau217. No notable differences were observed in the status of Aβ42/40 between CN and MCI, while MCI individuals tended to show abnormal p-tau181 and p-tau217 levels.
Study participant baseline characteristics.
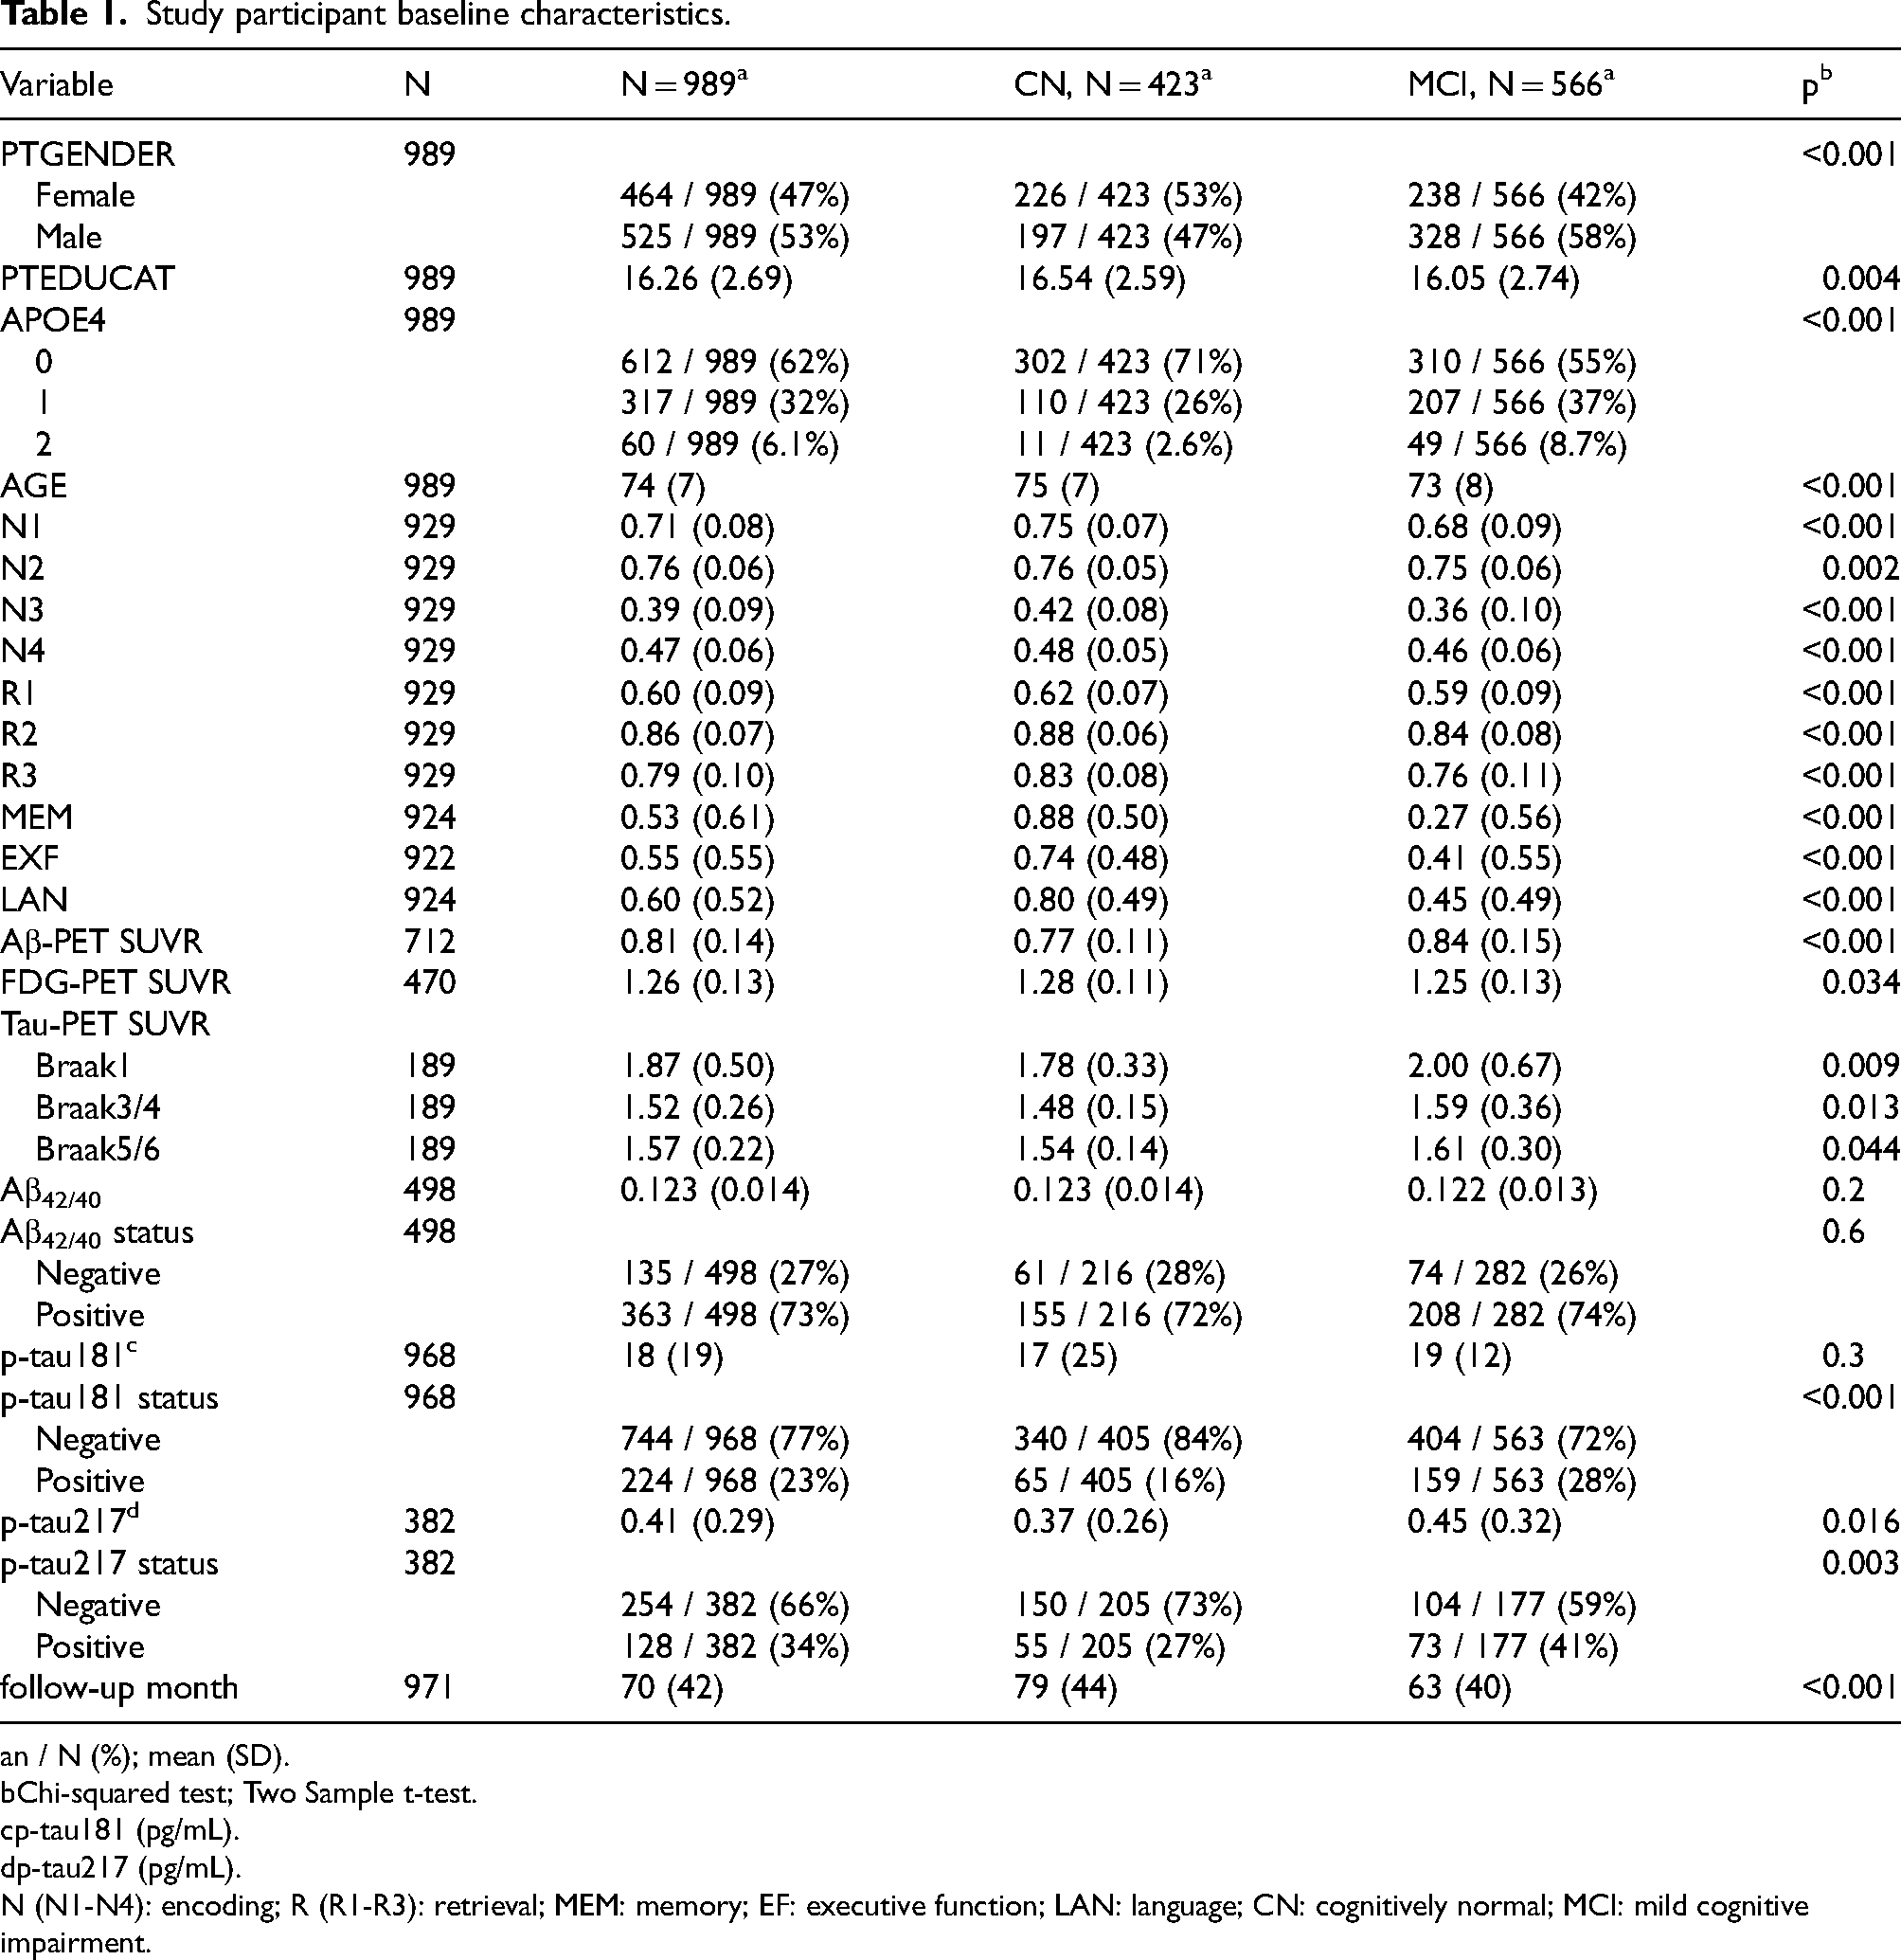
n / N (%); mean (SD).
Chi-squared test; Two Sample t-test.
p-tau181 (pg/mL).
p-tau217 (pg/mL).
N (N1-N4): encoding; R (R1-R3): retrieval; MEM: memory; EF: executive function; LAN: language; CN: cognitively normal; MCI: mild cognitive impairment.
Baseline biomarker status predicts future changes in PET imaging
In FDG PET, the positive group for any of the three biomarkers showed a faster rate of decline in glucose metabolism compared to the negative group (Figure 2; Supplemental Table 3). For Aβ PET, the baseline Aβ42/40 ratio showed the strongest predictive power (β = 0.14; p = 2.16E−10), followed by p-tau217 (β = 0.14; p = 1.95E−13) (Figure 2; Supplemental Table 4). Unexpectedly, p-tau181 did not exhibit the ability to predict future Aβ PET changes (β = 0.03; p = 0.0704). For tau PET, the baseline Aβ42/40 positive group showed an accelerated accumulation of tau in Braak3/4 regions (β = 0.25; p = 0.0009). P-tau217 positive group showed an accelerated accumulation of tau in Braak1 (β = 0.26; p = 0.0002), Braak3/4 (β = 0.31; p = 3.35E−06), and Braak5/6 regions (β = 0.26; p = 0.0002) (Figure 2; Supplemental Table 5). Compared to scale-based diagnosis, the interaction of biomarker status with time exhibited a stronger significant association with PET values, reinforcing the advantage of using biomarkers for the prediction of molecular pathology (Table 2 and Supplemental Tables 6–8).

The correlation between longitudinal changes of PET and the interaction between plasma biomarker status and time. The interaction term β and its corresponding 95% CI are obtained based on the calculation of LME model. The β coefficient represents the estimated effect size of the interaction. CI: confidence interval; LME: linear mixed effects.
Comparison of β between biomarker status and time interaction and between phenotypic diagnosis and time interaction.
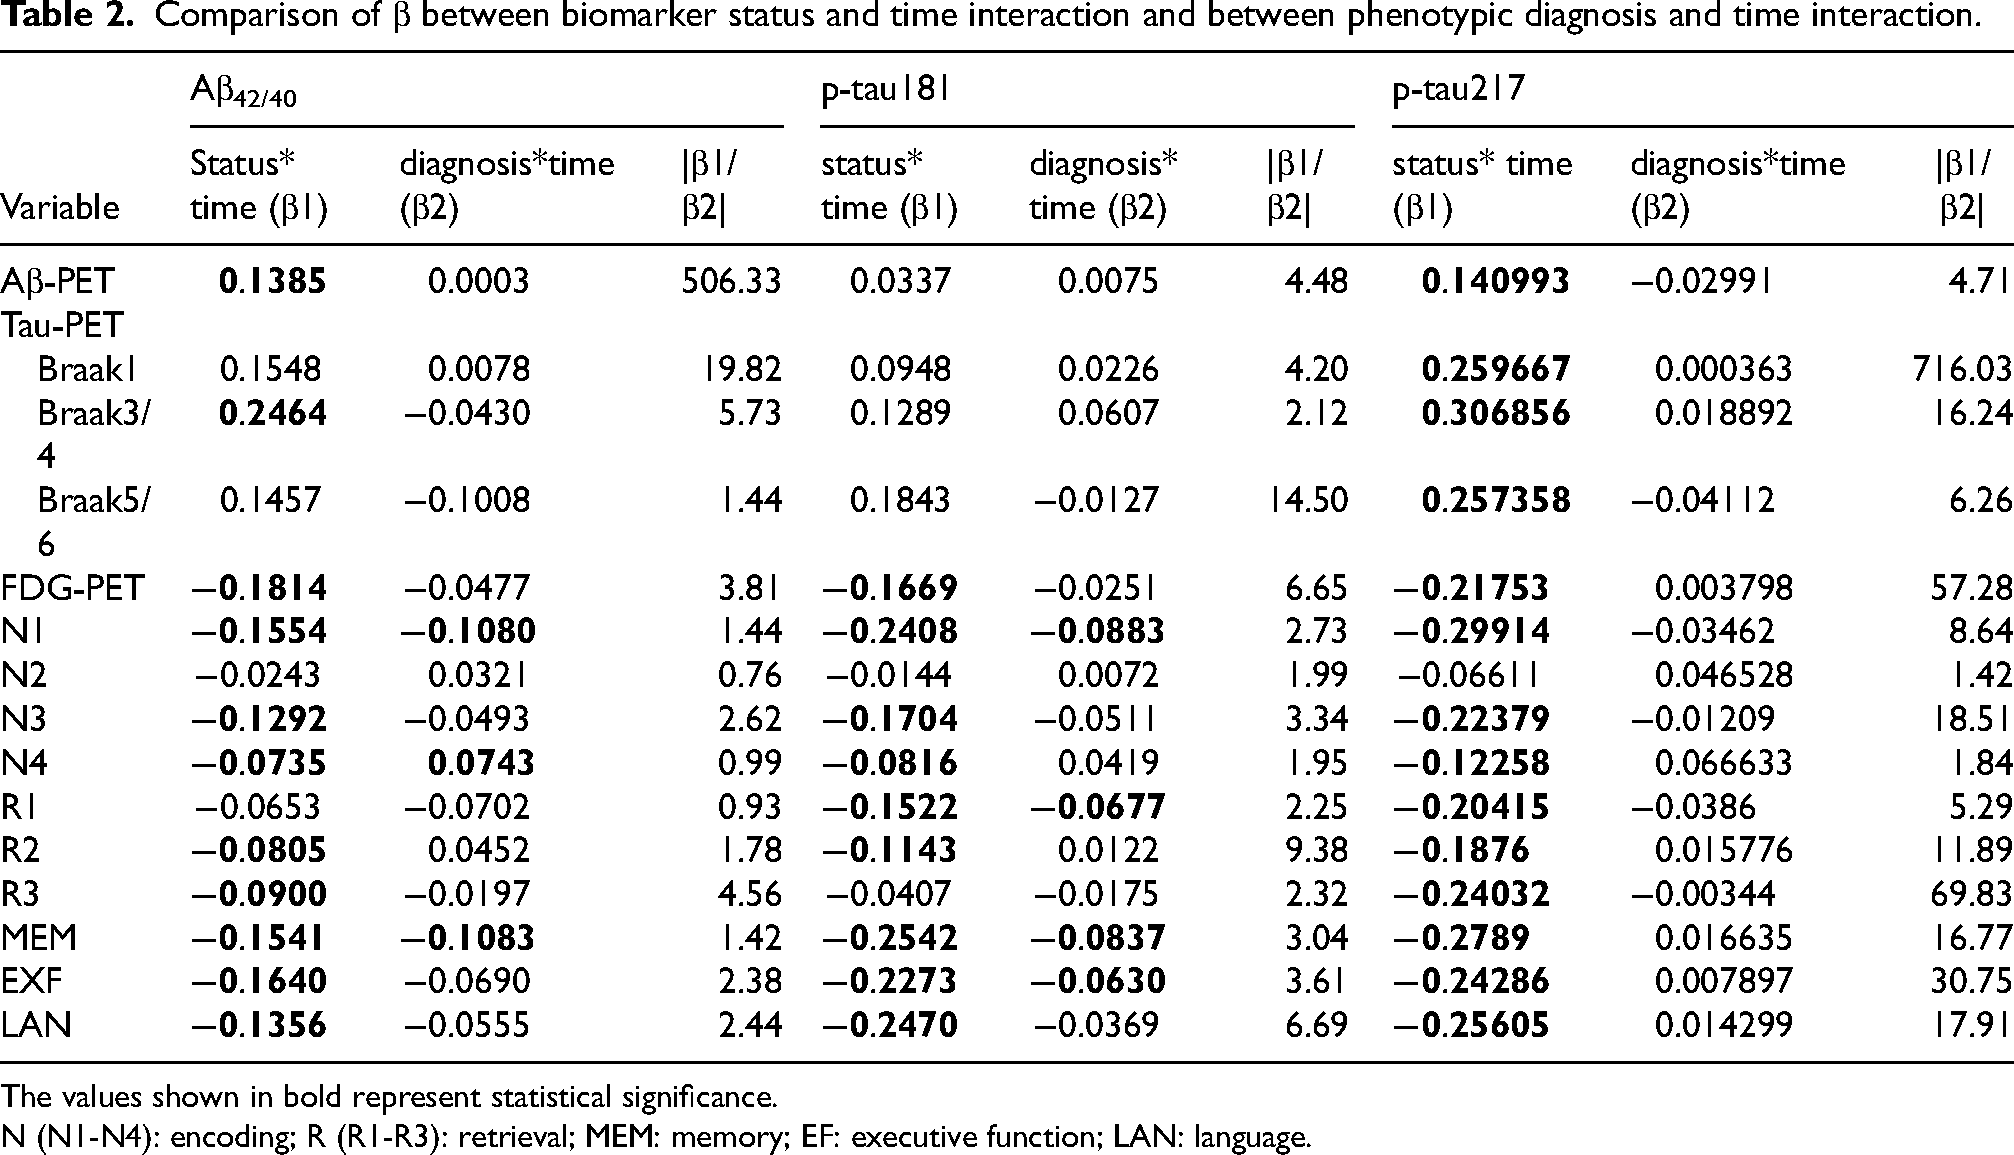
The values shown in bold represent statistical significance.
N (N1-N4): encoding; R (R1-R3): retrieval; MEM: memory; EF: executive function; LAN: language.
Baseline biomarker status predicts future cognitive changes
The baseline populations with different biomarker status showed significant differences in the changes of qCPs (Figure 3; Supplemental Table 9). Notably, the positive groups for all three biomarkers showed a more rapid decrease in N1, N3, N4, and R2. However, they did not demonstrate a quicker decline in N2. For R1 and R2 scores, only individuals positive for p-tau217 exhibited a faster decline. In contrast, those positive for p-tau181 experienced a more rapid decline in R1 scores (β = −0.16; p = 6.30E−05), while individuals positive for Aβ42/40 demonstrated a faster decline in R3 scores (β = −0.09; p = 0.0344). Regarding the cognitive composite scores, positive groups for all three biomarkers showed more pronounced declines in MEM, EF, and LAN (Figure 3; Supplemental Table 10). Furthermore, the interaction effects of biomarkers over time, as indicated by beta values in various cognitive domains, were more significant compared to risk stratification based on scale, further confirming the superiority of using biomarkers for predicting cognitive changes (Table 2 and Supplemental Tables 11 and 12).
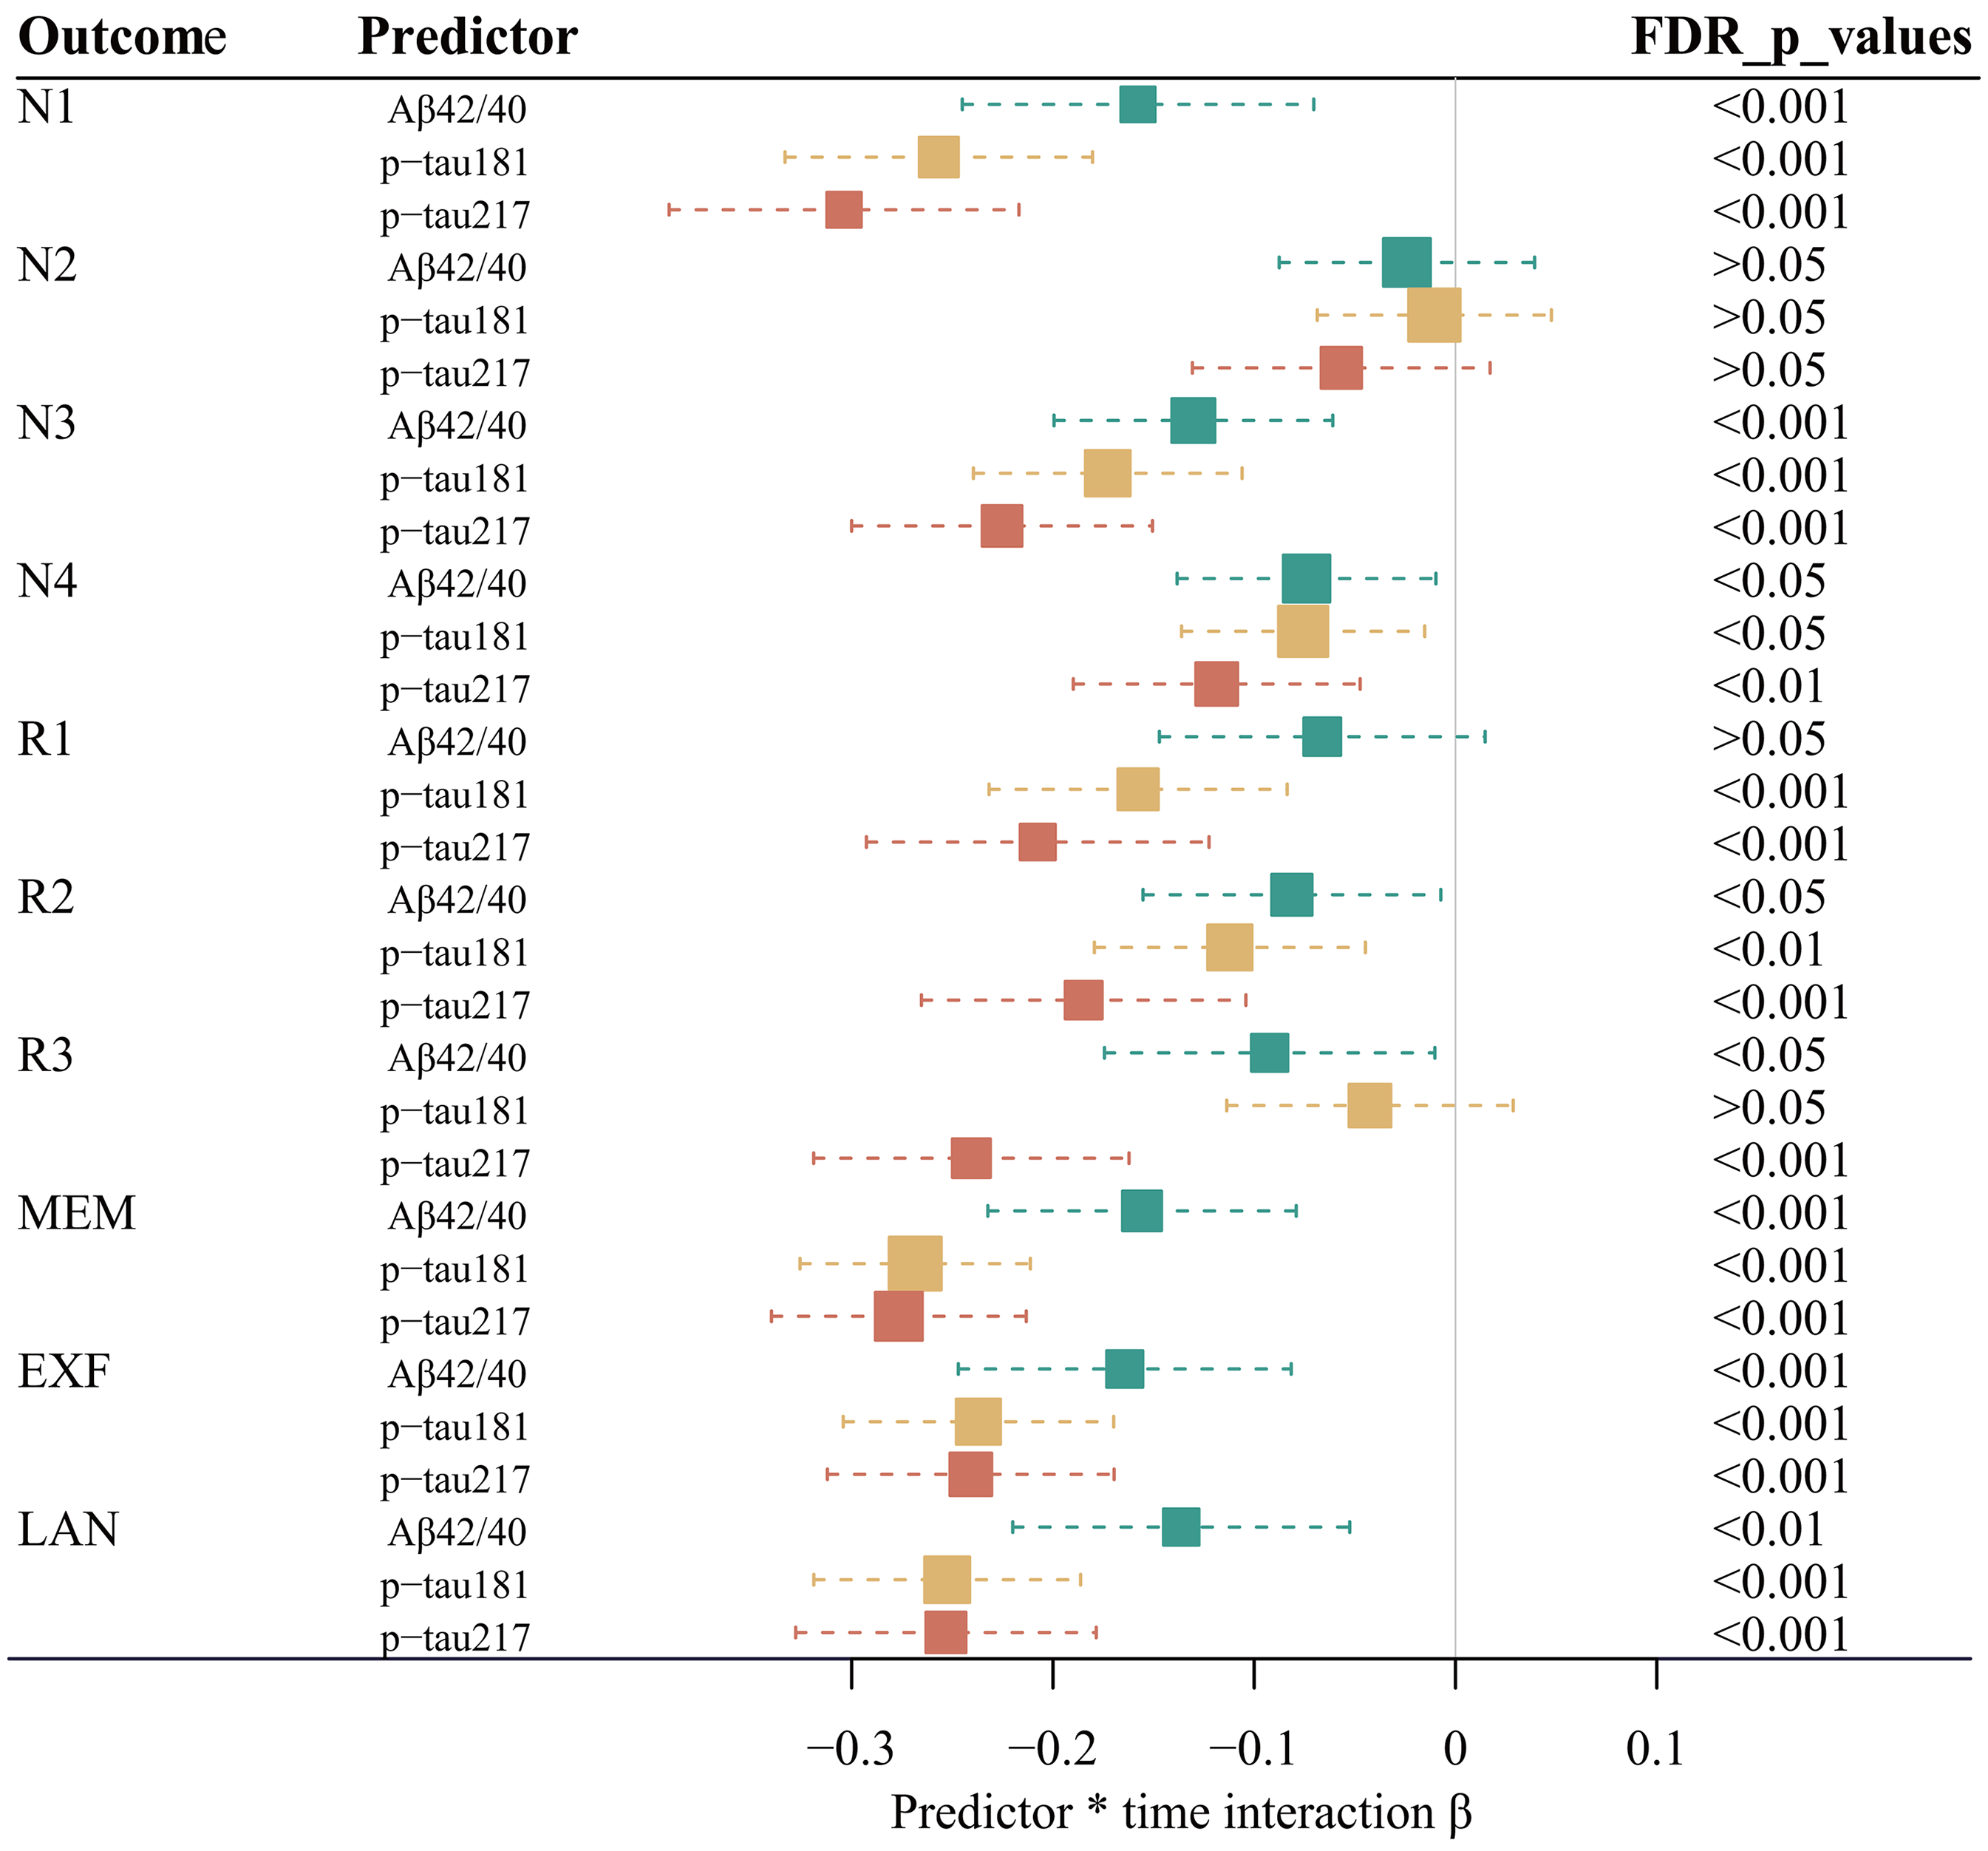
The correlation between longitudinal changes of cognitive function and the interaction between plasma biomarker status and time. The interaction term β and its corresponding 95% CI are obtained based on the calculation of LME model. The β coefficient represents the estimated effect size of the interaction. CI: confidence interval; LME: linear mixed effects; N (N1-N4): encoding; R (R1-R3): retrieval; MEM: memory; EF: executive function; LAN: language.
Baseline status of p-tau181 and p-tau217 modulates pathology-related cognitive impairment
Among the three biomarkers, p-tau181 and p-tau217 demonstrated modulatory effects on pathology-related cognitive impairment (Figure 4; Supplemental Tables 13–15). P-tau181 positive individuals exhibited a more rapid Aβ-dependent cognitive decline in the MEM (β = −0.33; p = 4.91E−05), EXF (β = −0.20; p = 0.0212), and LAN (β = −0.28; p = 0.0013). Positive p-tau181 accelerated FDG-related cognitive impairment in MEM (β = 0.19; p = 0.0405) and EXF (β = 0.27; p = 0.0023). In addition, p-tau181 modulated the associated between Braak3/4 tau accumulation with the impairment of EXF (β = −0.36; p = 0.0470). P-tau217 positive individuals exhibited a more rapid Aβ-dependent cognitive decline in the MEM (β = −0.40; p = 0.0014), EXF (β = −0.40; p = 0.0022), and LAN (β = −0.28; p = 0.0477). Positive p-tau217 accelerated FDG-related cognitive impairment in MEM (β = 0.32; p = 0.0175) and EXF (β = 0.32; p = 0.0175).

The moderating effect of p-tau181/p-tau217 on pathology-mediated cognitive impairment. The interaction term β and its corresponding 95% CI are obtained based on the calculation of LME model. The β coefficient represents the estimated effect size of the interaction. CI: confidence interval; LME: linear mixed effects; MEM: memory; EF: executive function; LAN: language.
Application of biomarkers in identifying high-risk dementia populations
Result showed that positive populations for all three biomarkers were revealed to have a higher risk of developing dementia (Figure 5 and Supplemental Figures 5–7; Supplemental Table 16). Further investigations were performed to determine whether biomarkers could better differentiate individuals at high risk of dementia within the same clinical phenotypes. In CN populations, p-tau181 (HR = 3.14; p = 0.0170) and p-tau217 (HR = 24.91; p = 0.0001) showed higher sensitivity in identifying individuals at high risk for dementia, while Aβ42/40 was not detected with the same level of recognition ability in this group (HR = 2.78; p = 0.1844) (Figure 5 and Supplemental Figures 8–10; Supplemental Table 16). Conversely, in populations with MCI, all three biomarkers were effective in distinguishing individuals at high risk for dementia (Figure 5 and Supplemental Figures 11–13; Supplemental Table 16).
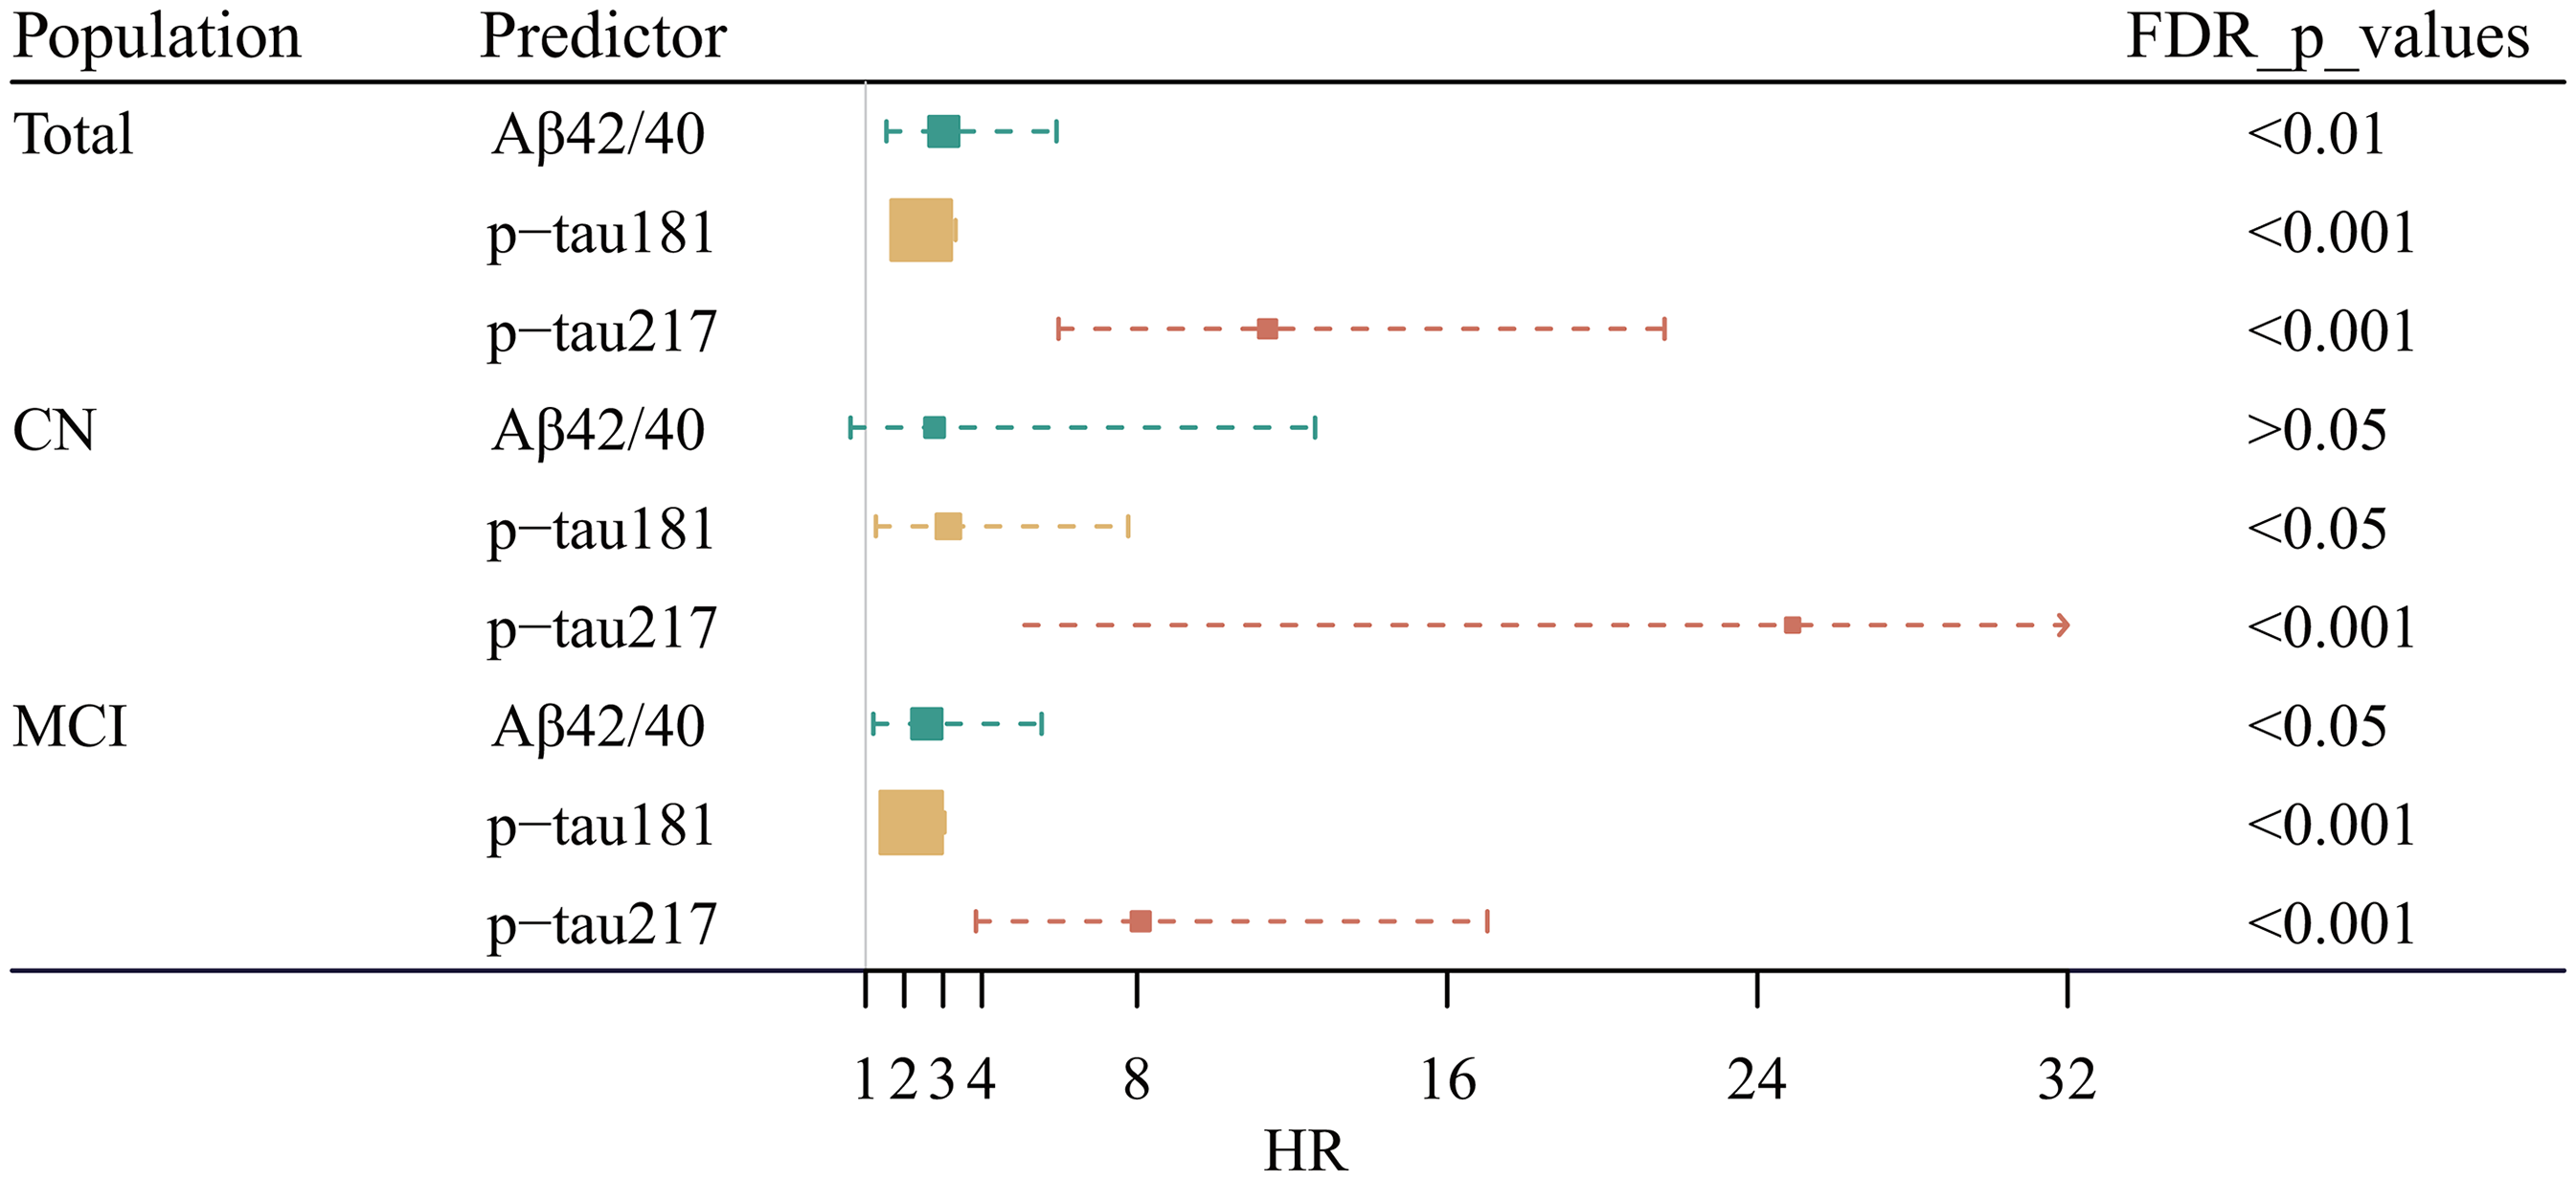
Relationship between plasma biomarkers and conversion to dementia. HR and 95% CI are derived from Cox regression models with conversion to dementia as outcome. The HR represents the relative risk of converting to dementia between the biomarker-positive group and the biomarker-negative group. CI: confidence interval; HR: hazard ratio; CN: cognitively normal; MCI: mild cognitive impairment.
Discussion
Our study demonstrated the effectiveness of combining GMM with blood biomarkers in predicting future AD pathological changes and cognitive decline in non-demented older adults. This approach outperformed traditional scale-based brain health screenings for community-dwelling seniors. The plasma biomarker risk stratification method accurately identified community-dwelling seniors at risk for dementia. Among the three biomarkers, p-tau217 showed the best predictive performance. Overall, the GMM-based plasma biomarker risk stratification method held significant promise for community screening applications.
In our study, the Aβ42/40 and p-tau217 showed statistical significance in predicting the progression of Aβ PET, while p-tau181 was not demonstrated with a significant performance. The results align with outcomes reported in prior studies, showing the widespread acceptance of the Aβ42/40 and p-tau217 consistency with Aβ PET.15,22 Furthermore, the Aβ42/40 demonstrated the ability to predict the deposition of tau at Braak3/4. This association may be attributed to the close association between these specific brain regions and Aβ deposition. 23 Our study indicated that p-tau217 can predict tau deposition in all staged brain regions, highlighting its superiority over the other two biomarkers in forecasting tau pathology. Several cross-sectional studies support our findings.15,24–26 Building on previous research, our longitudinal study further validates the reliability of p-tau217 in predicting tau pathology.
The findings of our study indicated that individuals displaying any positive biomarkers demonstrated a more rapid deterioration in MEM, EXF, and LAN. Memory analysis revealed that individuals with positive biomarkers demonstrated rapid deterioration of N1, N3, N4, and R2. The decline of these scores suggests an impairment in long-term memory, consistent with previous findings of early-stage AD-related impairment in long-term memory. 27 The formation of long-term memories typically involves more complex cognitive processes, whereas the short-term memory is relatively simple and may be more readily preserved. This may account for the absence of an accelerated decline in N2 scores within the biomarker-positive group. In our study, p-tau217 predicted changes in all cognitive abilities except for N2. For R1 score, short-term memory retrieval is an important foundation for decision-making, 28 which is a decisive factor in determining the quality of life and medical burden of dementia patients. 29 For R3 score, research indicated that a decrease in delayed recall serves as one of the most sensitive indicators for the early detection of AD.30,31 P-tau217 can predict changes in R1 and R3 scores. This finding holds significant implications for the early management of the disease.
Our study suggested that p-tau217 and p-tau181 could modulate pathology-related cognitive impairment. Individuals with abnormal p-tau217 or p-tau181 exhibited a more rapid cognitive decline associated with pathology, primarily Aβ pathology. Previous studies have found that p-tau181 and p-tau217 were enriched in pathological synapses or axons.32–36 Additionally, p-tau217 was the only form found in vesicular structures that can be transmitted between neurons, a characteristic that allows it to readily enter the bloodstream.35,36 Based on our study, we hypothesized that p-tau217 not only reflects pathological states but also indicates the health status of brain neurons. This could explain the superiority of p-tau217 in predicting cognitive outcomes. Furthermore, individuals with abnormal p-tau217 levels have decreased neuronal resilience, rendering them more vulnerable to pathological factors that contribute to cognitive deterioration.
Neurodegenerative diseases typically presented subtle symptoms in their early stages, and by the time symptoms became apparent, the neural damage was usually irreversible. Therefore, it was crucial to identify brain health risks in older adults at an early stage. Our research indicated that methods of stratification based on biomarkers were more effective than scale-based approaches in predicting AD pathology and tracking cognitive changes. It is important to note that within CN, individuals with positive p-tau217 faced a risk of progressing to AD that was 24 times greater than those with negative results. Similarly, in the MCI, the risk for the p-tau217 positive group was 8 times higher compared to the negative group. Moreover, p-tau217 demonstrated a significantly superior ability to predict dementia risk when compared to Aβ42/40 and p-tau181.
Early identification of individuals at risk of dementia in community settings is critical for effective intervention. It is recommended that regions leverage local health examination centers to systematically screen aging populations for biomarkers. By applying GMM, high-risk individuals can be efficiently identified and referred to dementia specialists for further clinical evaluation, 37 enhancing the precision of disease detection and optimizing healthcare resource allocation. For identified high-risk groups, communities should implement multi-level, multidimensional non-pharmacological interventions, including: (1) regular physical exercise programs; (2) personalized nutritional guidance; (3) systematic chronic disease management; (4) mental health support and counseling; and (5) standardized cognitive training. 38 Where feasible, personalized intervention plans tailored to individual risk profiles should be developed to achieve precision prevention.
It is noted that this study has a number of limitations. First, the focus of our study was on the non-AD population in the real world. However, the CN and MCI individuals in the ADNI database underwent stringent selection processes, potentially introducing bias into the results. Second, the robustness of the conclusions requires further validation with additional datasets in the future. Third, the inconsistency in the population sizes for the three biomarkers may affect the reliability of the results.
Conclusions
In conclusion, our research findings indicated that the combination of GMM with plasma biomarkers effectively predicted AD pathology and cognitive changes. Plasma Aβ42/40 and p-tau217 effectively predicted Aβ PET pathological progression, while p-tau217 also predicted tau PET changes. All three biomarkers were able to forecast the progression of FDG PET and cognitive function. P-tau217 and p-tau181 significantly modulated pathology-related cognitive impairment. Moreover, the GMM-based biomarker approach was more effective in identifying brain health risks compared to traditional scale-based screening methods. Notably, p-tau217 demonstrated the best predictive ability across multiple dimensions.
Supplemental Material
sj-docx-1-alr-10.1177_25424823251331110 - Supplemental material for Predicting brain health in community-dwelling elderly populations by integrating Gaussian mixture model and plasma biomarkers
Supplemental material, sj-docx-1-alr-10.1177_25424823251331110 for Predicting brain health in community-dwelling elderly populations by integrating Gaussian mixture model and plasma biomarkers by Yue Wang, Tianshu Zhu, Qian Cheng, Xiaolin Cui, Pengfei Zhang, Zhiming Lu and in Journal of Alzheimer's Disease Reports
Footnotes
Acknowledgments
The authors express their gratitude to all participants and staff involved in ADNI for their valuable contributions to data collection. Data collection and sharing for the Alzheimer's Disease Neuroimaging Initiative (ADNI) is funded by the National Institute on Aging (National Institutes of Health Grant U19AG024904). The grantee organization is the Northern California Institute for Research and Education. In the past, ADNI has also received funding from the National Institute of Biomedical Imaging and Bioengineering, the Canadian Institutes of Health Research, and private sector contributions through the Foundation for the National Institutes of Health (FNIH) including generous contributions from the following: AbbVie, Alzheimer's Association; Alzheimer's Drug Discovery Foundation; Araclon Biotech; BioClinica, Inc.; Biogen; Bristol-Myers Squibb Company; CereSpir, Inc.; Cogstate; Eisai Inc.; Elan Pharmaceuticals, Inc.; Eli Lilly and Company; EuroImmun; F. Hoffmann-La Roche Ltd and its affiliated company Genentech, Inc.; Fujirebio; GE Healthcare; IXICO Ltd; Janssen Alzheimer Immunotherapy Research & Development, LLC.; Johnson & Johnson Pharmaceutical Research & Development LLC.; Lumosity; Lundbeck; Merck & Co., Inc.; Meso Scale Diagnostics, LLC.; NeuroRx Research; Neurotrack Technologies; Novartis Pharmaceuticals Corporation; Pfizer Inc.; Piramal Imaging; Servier; Takeda Pharmaceutical Company; and Transition Therapeutics.
Ethical considerations
The collection and sharing of data within the ADNI were sanctioned by the institutional review boards at each participating institution.
Consent to participate
All participants or their legal guardians provided written informed consent in line with the principles outlined in the Declaration of Helsinki.
Consent for publication
Not applicable.
Author Contributions/CRediT
Funding
The authors disclosed receipt of the following financial support for the research, authorship, and/or publication of this article: This study was supported by the National Natural Science Foundation of China (82272414) and the Key Research and Development Program of Shandong Province, China (2022CXGC010507).
Conflicting interests
The authors declared no potential conflicts of interest with respect to the research, authorship, and/or publication of this article.
Data availability
The data and codes supporting this article can be shared upon reasonable request.
Supplemental material
Supplemental material for this article is available online.
References
Supplementary Material
Please find the following supplemental material available below.
For Open Access articles published under a Creative Commons License, all supplemental material carries the same license as the article it is associated with.
For non-Open Access articles published, all supplemental material carries a non-exclusive license, and permission requests for re-use of supplemental material or any part of supplemental material shall be sent directly to the copyright owner as specified in the copyright notice associated with the article.