
Abstract
Background
Type 2 diabetes mellitus (T2DM) and Alzheimer's disease (AD) a growing concern in low- and middle-income countries, including Pakistan. The relationship between T2DM and AD is complex and concerning, as more older adults with T2DM are experiencing cognitive impairment.
Objective
The study aimed to investigate the relationship between T2DM and AD in a Pakistani population. Through transcriptomic analysis, this research explored shared molecular mechanisms, genes, and pathways between T2DM and AD.
Methods
Our main cohort includes 820 participants, including individuals with T2DM, AD, T2DM + AD, and controls, from regional hospitals. Gene expression profiling and Ingenuity Pathway Analysis (IPA) were implemented in a subgroup of 18 participants to identify overlapping gene networks and canonical pathways implicated in both diseases. A TLDA array was used to identify genes associated with Amyloid processing and selected pathways.
Results
Our findings indicate a significant (p-value 0.05) overlap in 58 dysregulated genes linked to neuroinflammation, mitochondrial dysfunction, and amyloid processing, suggesting shared pathogenic mechanisms in T2DM and AD. Notable genes, such as CXCL5 and APP, were differentially expressed in both conditions, highlighting inflammation's role in neurodegeneration. CAPNS2 and CAPN1 showed the maximum relative expression differences in the TLDA array, providing potential targets for further investigation.
Conclusions
The study provides insights into the complex interplay between T2DM and AD, revealing common molecular pathways, including neuroinflammation and mitochondrial dysfunction. Despite the small sample size, our findings underscore the importance of exploring these shared mechanisms, as they could play a potential role in future studies to identify early biomarkers.
Introduction
Type 2 diabetes mellitus (T2DM) is a major global public health issue, responsible for approximately 90% of all diabetes cases worldwide.
1
According to the World Health Organization (WHO), the prevalence of T2DM is rising more rapidly in developing countries compared to developed ones, with a projected increase of over 70% of new T2DM cases in these regions within the next two decades.2,3 In Pakistan, the International Diabetes Federation (IDF) estimates that 26.7% of adults are affected by T2DM
The relationship between T2DM and cognitive decline, particularly AD, is complex and concerning, as more older adults with T2DM are experiencing cognitive impairment.7–9 T2DM is associated with a variety of comorbidities, e.g., hypertension, insulin resistance, dyslipidemia, and obesity, which can negatively impact brain function. Studies have demonstrated that individuals with T2DM exhibit higher rates of cognitive impairment and brain atrophy compared to non-diabetic individuals with T2DM patients being twice as likely to develop AD.10,11
In South Asian populations, including those in Pakistan, the connection between chronic T2DM and an increased risk of AD is influenced by a combination of genetic, metabolic, and socio-environmental factors. 12 Genetic predispositions in South Asians, such as insulin resistance-linked genetic variants and beta-cell dysfunction, combined with phenotypic traits like central obesity and metabolic syndrome contribute to the higher prevalence of T2DM in these populations.13,14 Chronic hyperglycemia and insulin resistance in T2DM are also linked to neuroinflammation and the accumulation of advanced glycation end-products (AGEs), which contribute to neuronal damage and the deposition of amyloid plaques, a key features of AD pathology. 15 These amyloid plaques impair synaptic function and activate microglial cells, leading to persistent neuroinflammation and accelerating cognitive decline.16,17
Earlier, our epidemiological studies have suggested that the risk of developing both T2DM and AD in Pakistani populations is associated with socio-demographic and environmental factors. Variables such as residential areas, educational level, and age have been linked to higher risk for developing both diseases. 18 Furthermore, genetic markers and pathways associated with T2DM, and AD were identified through microarray analysis of blood samples in our recent studies. In T2DM patients, we reported altered expressions of genes such as APOC1, APOC2, CYP1B1, SLC2A13, and SLC33A1. Meanwhile, genes such as CAPNS2 and CAPN1 were significantly differentially expressed in AD patients. In AD, we also observed alterations in key pathways related to amyloid processing, neuroinflammation signaling, and ErbB4 signaling. 19 However, previous studies have not explicitly explored the shared gene expression between T2DM and AD.19,20
In this study, we hypothesize that while certain genes are differentially expressed in T2DM and AD, others may exhibit overlapping expression patterns that contribute to shared pathological mechanisms in both diseases. Specifically, we aimed to analyze transcriptomic data from our previously published studies.19,20 Using global gene expression analysis and Ingenuity Pathway Analysis (IPA), we aimed to identify the genes that overlapped in expression patterns in both diseases, which may provide insights into the common pathogenic mechanisms underlying T2DM and AD.
Methods
Study population
Our original study included 820 study participants who were recruited from outpatient departments of regional hospitals across various cities in Pakistan (Islamabad, Rawalpindi, Lahore, and Abbottabad), including individuals with T2DM (n = 450), AD (n = 100), T2DM + AD (n = 20), and healthy controls (n = 250) between 2015 and 2020. In the present study, we selected only severe and clinically confirmed patients with T2DM (n = 5), AD (n = 5), T2DM + AD (n = 3), and healthy controls (n = 5). Details of the recruitment process were described previously [18–20]. Ethical approval for this research was granted by the Institutional Review Board (IRB) of the National University of Sciences and Technology (NUST) (IRB 28/IRB; dated April 20, 2016) and by the Howard University, USA, Institutional Review Board (IRB-17-MED-43). Detailed medical interviews were also conducted, with the consent of the participant's family members, friends, or caregivers, to gather information on changes in the patient's cognitive skills, in accordance with the AD Diagnostic Guidelines from the National Institute on Aging and the National Institute on Aging-Alzheimer's Association workgroups on diagnostic guidelines for AD. 19 We also collected demographic and residential information of each patient.
Clinical profile, blood collection, RNA extraction, and cDNA synthesis
The clinical diagnosis of the participants was conducted by physicians: endocrinologists for T2DM patients and neurologists for AD patients at the collaborating hospitals. Hematological investigations, including fasting blood glucose levels (mg/dl) and HbA1c %, were recorded for each participant. 20 For diagnosing AD patients, neurological assessments such as the Mini-Mental State Examination (MMSE), along with neurological examinations, magnetic resonance imaging (MRI), or computed tomography (CT), were administered at the hospital. Blood samples were collected in PAXgene® Blood RNA Tubes (BD, Cat # 762164) by phlebotomists and shipped to the Department of Biology at Howard University, Washington, DC, USA. RNA was extracted using the PAXgene Blood RNA kit (Qiagen, Cat. # 762164, PreAnalytiX GmbH, Germany) following the manufacturer's instructions. DNA contamination (if any) was removed by the Invitrogen DNA-free kit (ThermoFisher, CA, USA Cat. # AM 1906). RNA extraction and cDNA synthesis were carried out by using same protocol. 19
Transcriptomes for global gene expression
Although this study utilized participants from the same overall cohort as our previous transcriptomic analyses, the specific RNA samples selected for microarray in this study were distinct.18–20 The selection was based on updated clinical criteria, including MMSE scores and HbA1c values, to ensure representation of severe disease states. Therefore, this analysis was conducted on a new subset of the cohort to explore overlapping gene expression patterns in T2DM and AD.
Oligonucleotide microarray experiments were performed by EpigenDx (Boston, MA, USA) using the Affymetrix U133 Plus 2.0 Array platform, which provides comprehensive coverage of the entire transcribed human genome on a single array. The chips were run in triplicate for each individual subject. Expression profiling data were obtained for each sample following standard operating procedures and the quality control protocols as was mentioned elsewhere.19–21
In this study, a total of six subjects were selected for microarray gene expression analysis: two from each group (one male and one female per group), with no significant differences in average age or BMI within groups. The groups included individuals with T2DM, AD, and healthy subjects (control).
Identification of cellular processes and gene networks
From the differential gene expression datasets described above, the identification of cellular processes and pathways by IPA (Ingenuity® Systems) was performed according to the method described in our earlier study.19,20 Briefly, datasets comprising gene identifiers and corresponding expression values (differential expression with significant fold change at p < 0.05) from the microarray experiment were imported into IPA. Differentially expressed gene identifiers were mapped to related changes in biofunctions. The networks were generated algorithmically based on their connectivity. Using IPA, we identified the top network by incorporating a large set of differentially expressed genes with the goal of uncovering the most extensive array of relationships among the focus genes. Networks were “named” on the most prevalent functional group(s) present. Canonical pathway (CP) analysis identified function-specific genes that were significantly present within the networks. The comparison analysis function in IPA was employed to assess the similarity and difference among the enriched pathways and upstream regulators. A heatmap was generated to visualize the canonical pathways and upstream regulators that correlate with the original experimental dataset. The analysis helped us to identify common pathways and upstream regulators whose activity may increase or decrease based on activation z-scores. Activation z-scores of ≥2 or ≤ −2 are considered significant, and they are used to determine the activation states (“increased” or “decreased”) of implicated biological functions. 19
High-throughput TaqMan® Low-Density Array (TLDA)
A total of 12 participants with chronic disease conditions were included, with three participants in the AD group, three in the T2DM group, and three participants with both T2DM and AD condition compared with three in the control group. For the study, we selected participants with no significant differences in average age or BMI within groups. Participants with HbA1C levels >6.5 were classified into the T2DM group, while those with MMSE scores <10 were considered part of the Alzheimer's disease group. In this experiment we similarly collected the whole blood from the participants and isolated RNA like the process before microarray analysis. To investigate gene expression profiles related to the amyloid hypothesis in AD, we conducted a TLDA card-based profiler array analysis using the TaqMan® Array (FAST Plate) from Applied Biosystems (Catalog # 4418715, Santa Clara, CA, USA) on the ABI 7900HT-Fast Real-time PCR system for quantification. These 96-well plates are pre-configured with the most appropriate TaqMan® Gene Expression Assays for a specific biological process, pathway, or disease state. Each plate contains predefined assays and endogenous controls dried-down in the wells, ready for accurate assessment of an entire gene signature in one simple experiment. The panel of assays in the TaqMan® Array 96-well Human Alzheimer's Disease Plate is based on the ‘amyloid hypothesis’. The 92 genes are involved in APP processes that generate amyloid-β and included genes implicated in multiple secondary steps of amyloid-β aggregation, tau hyperphosphorylation, excitotoxicity, inflammation, oxidation and microglial activation, including a reference gene (GAPDH (Hs99999905_m1) and a manufacturer control (18s rRNA (Hs99999901_s1)) [19]. The TLDA data was analyzed and compared to the control using SDS Ver. 2.4 software (ABI, CA).
Statistical analysis
For the TLDA (qPCR) data presented in Figure 3, comparative gene expression analysis was performed using the ΔCt method. Ct values of each gene were normalized to the housekeeping gene GAPDH. Relative expression was calculated using 2−ΔCt method. One-way Anova was used to determine statistical significance between each disease group (T2DM, AD, T2DM + AD) and the control. A p-value of <0.05 was considered statistically significant. Post-hoc comparisons were performed using Tukey's Honestly Significant Difference (HSD) test at a 95% confidence interval with a significance threshold of p < 0.05. All reactions were run in triplicate, and data are reported as mean ± SEM. Graphs were generated using GraphPad Prism version 8. Differentially expressed gene sets were analyzed with microarray results through a one-way ANOVA model using Partek Genomic Suites (GS-V.4.1; Partek Inc., St Louis, MO, USA). To account for multiple testing, the global expression dataset was corrected using the false discovery rate (FDR) with an alpha level < 5% and a p-value of < 0.05 was considered statistically significant. Pearson correlation coefficients were calculated using RMA-normalized gene expression data in the target data matrix. In the IPA analysis, Fisher's exact test was employed to assess the p-value, indicating the likelihood that associations between molecules in our dataset and a related disease or function were due to chance.
Results
Demography and clinical status of the population
The mean age for our study population was 58.2 ± 12.85, 76.2 ± 7.95, 74.34 ± 7.76, and 64.6 ± 2.30 years, in T2DM, AD, T2DM + AD, and control group respectively. The average HbA1c (%) level in T2DM participants was 11.1 ± 2.93%, which was higher than that of the AD (5.62 ± 0.27%) and control groups (4.76 ± 0.55%) but very similar to the level in participants with both T2DM + AD (10.3 ± 1.83%). The MMSE score for AD was 9.24 ± 1.23, and for participants with both T2DM + AD was 9.12 ± 1.93. Medical history variables like hypertension, cardiovascular disease and family history of the disease condition were found to not significantly differ between each studied group (Table 1).
Study participants demography.
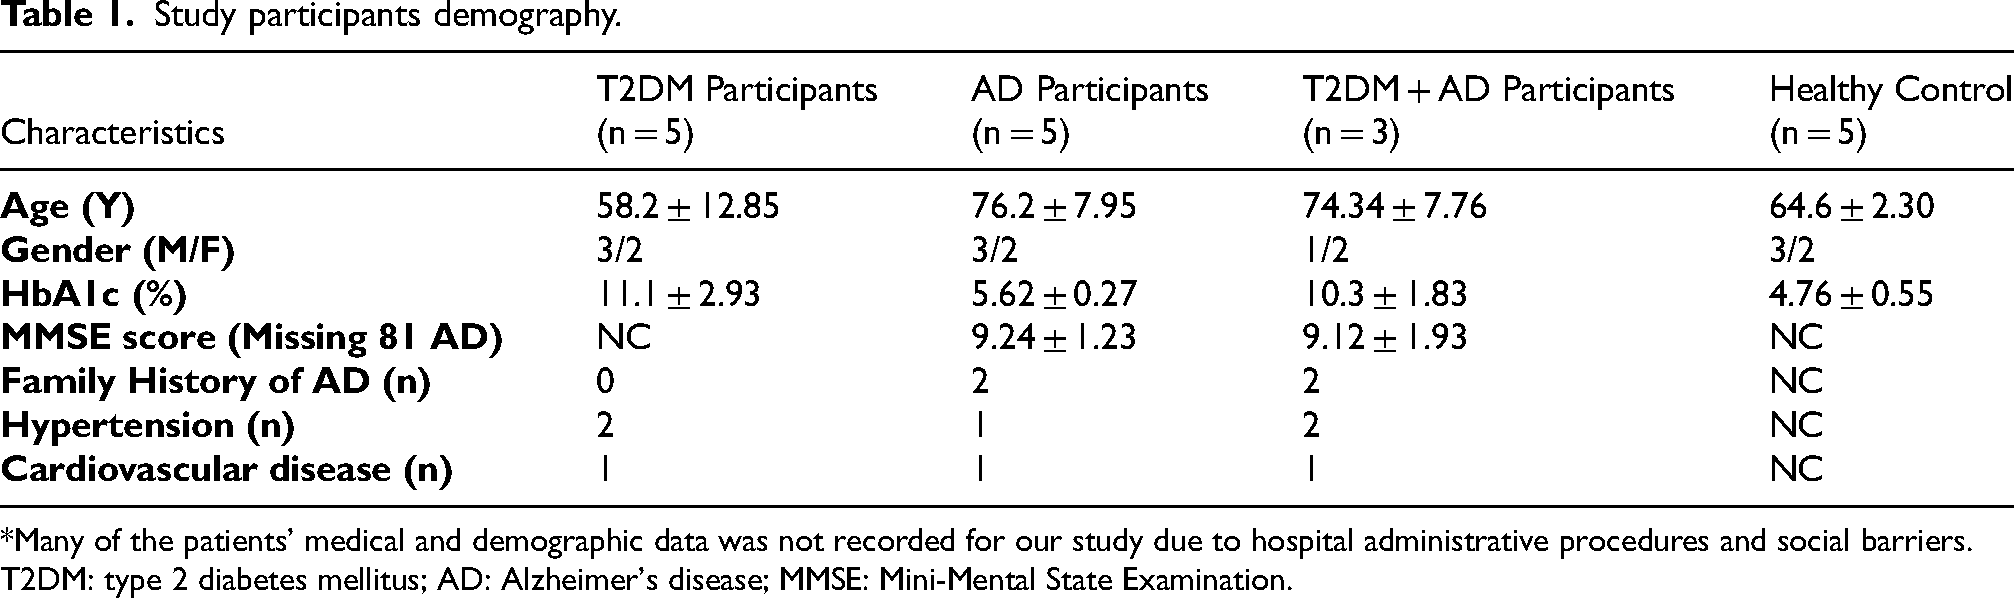
*Many of the patients’ medical and demographic data was not recorded for our study due to hospital administrative procedures and social barriers.
T2DM: type 2 diabetes mellitus; AD: Alzheimer's disease; MMSE: Mini-Mental State Examination.
Differential gene expression in T2DM and AD
The global gene expression study identified a total of 265 and 583 genes that are significantly expressed in T2DM and AD participants, respectively, compared to the control group (Figure 1A). Among the 265 genes in T2DM, 142 were upregulated, and 123 were downregulated. In AD patients, of the 583 significantly expressed genes, 238 were upregulated, and 345 were downregulated. The top 10 upregulated (+) and downregulated (-) genes in T2DM included TRAV16, CD40LG, IGHD, ANKRD20A5P, CXCL5, SNORA12, CCNA2, HIST1H3G, DEFA4, and RNU5E-1 (Figure 1B). gene TRAV16 showed the highest downregulation (−5.6-fold), while DEFA4 and RNU5E-1 exhibited the highest upregulation (+14.2-fold) in all T2DM. In AD, the top 10 upregulated (+) and downregulated (-) genes were GH2, CXCL5, GK3P, MRRFP1, CYP1A1, KLRC3, SCARNA11, TRGV3, SNORD3D, and ARL17A (Figure 1B). GH2 was the most downregulated gene (−2.8-fold), and ARL17A showed the greatest upregulation (+7.7-fold) in all AD patients. Based on the global gene expression results from both disease conditions, we observed that only 58 genes (7.4%) were common in all patients compared to the controls group (Figure 1C).

Global gene expression comparison between T2DM and AD participants: (A) The bar diagram represents the number of significantly (p-value < 0.05) expressed genes (up- or downregulated) in T2DM and AD patients. The experiment was performed by EpigenDx (Boston, MA, USA) using the Affymetrix U133 Plus 2.0 Array platform, which provides comprehensive coverage of the entire transcribed human genome on a single array. Differentially expressed gene sets were analyzed from the microarray results using a one-way ANOVA model by Transcriptome Analysis Console (TAC) (version 4.0.1, ThermoFisher Scientific). Probe summarization and probe set normalization were performed using the GC-RMA algorithm, which included GC-RMA background correction, quantile normalization, log2 transformation, and median Polish probe set summarization. The study outcomes maintained a false positive (FDR) percentage <5% and a significant level. (B) The heatmap represents the top 10 up- and downregulated genes (expression status) from the global gene expression data. (C) The Venn diagram represents the number of overlapping genes in the global gene expression data for each disease condition. (D) Network of differentially expressed genes in the global gene expression data in the T2DM participants, relative to control subjects. The network was generated using Ingenuity Pathway Analysis (IPA) from QIAGEN, USA, and incorporated the relative gene expression levels measured in the patients’ group. The construction of the network relied on information stored in the Ingenuity Pathways Knowledge Base (IPKB), along with actual expression data. Connections between differentially expressed genes were analyzed, focusing on those exhibiting a fold change of ≥1.5 and p-value < 0.05. The network includes canonical pathways (CP) associated with the analyzed genes, which were represented within an oval-shaped circle. Genes that are upregulated are represented by geometric figures in red, while downregulated genes are depicted in green. The intensity of the red and green colors reflects the degree of up- or downregulation, respectively, in the expression dataset. (E) Network of differentially expressed genes associated with the Alzheimer's disease pathway in T2DM patients.
The above results obtained by maintaining the false positive (FDR) percentage <5% and 0.05 significant level. To ensure quality control in the global gene expression array, multiple measures were implemented. These include > 4-fold cRNA amplification from total RNA/cDNA, scaling factors kept below 2 to achieve whole-chip normalization of 800, and visual inspection of hybridization patterns to identify any chip defects.
AD gene network and disease pathways in T2DM patients
Canonical pathways and interconnected genes within the AD gene network were identified through IPA analysis (Figure 1D). The top gene networks identified in the T2DM group included 35 molecules that were significantly (fold change range of ≥ ± 2.0 and a p-value < 0.05) differentially expressed, demonstrating substantial effects on expression levels, The genes TNF, PSEN1, APP, MAPK, and PSENEN emerged as central molecules in our findings. Pathways involving mitochondrial dysfunction, IL6, IL17, and neuroinflammation signaling were found to contribute to impaired beta-cell function in T2DM. Additionally, increased expression of amyloid-processing genes was observed in T2DM patients, indicating neurodegenerative characteristics (Figure 1D). AD-associated genes in T2DM participants exhibited overall downregulation based on global expression data (Figure 1E).
Top canonical pathways in both disease conditions
The top canonical pathways from IPA results in T2DM were Cell cycle checkpoints, Mitotic Metaphase and Anaphase, MHC class II antigen presentation, B Cell Development, PRC2 methylates histones and DNA, Mitotic G1 Phase and G1/s transition, RHO GTPases Activate Formins, Small Cell Lung Cancer Signaling, GADD45 signaling, Mitotic Prophase, and TH2 pathway. These pathways were mainly involved in cell cycle regulation and immune responses. These include Cell Cycle Checkpoints, Mitotic Metaphase and Anaphase, and Mitotic G1 Phase and G1/S Transition, highlighting the critical role of cell cycle dysregulation in T2DM pathology. Additionally, pathways related to immune function, such as MHC Class II Antigen Presentation and B Cell Development, were enriched, suggesting an interplay between immune responses and metabolic dysfunction in T2DM (Figure 2A).

(A) Top 10 canonical pathways from IPA results with their p-values in the T2DM and AD populations. (B) Heat map of common canonical pathways based on Z-score. (C) Heat map comparison of expression fold changes in AD pathobiology-related genes derived from global expression data in both disease conditions.
On the other hand, the top canonical pathways evaluated from IPA results in AD revealed Neutrophil degranulation, Antimicrobial peptides, Transport of bile salts and organic acids, metal ions and amine compounds, Transport of inorganic cations/anions and amino acids/ oligopeptides, Generic Transcription Pathway, Aspirin ADME, Role of Hypercytokinemia/hyperchemokinemig in the Pathogenesis of Influenza, Delensins, Immunoregulatory interactions between a Lymphoid and a non-Lymphoid cell, IL-17A Signaling in Fibroblasts, and Pathogen Induced Cytokine Storm Signaling Pathway. These key pathways were primarily associated with inflammation, immune responses, and cellular transport mechanisms. Additionally, pathways involved in cellular transport, such as Transport of Bile Salts and Organic Acids, Transport of Metal Ions and Amine Compounds, and Transport of Inorganic Cations/Anions and Amino Acids/Oligopeptides, were significantly enriched, suggesting altered cellular transport and metabolism. Inflammation-related pathways such as IL-17A Signaling in Fibroblasts, Pathogen-Induced Cytokine Storm Signaling, and Role of Hypercytokinemia/Hyperchemokinemia in the Pathogenesis of Influenza were also highlighted. Furthermore, Immunoregulatory Interactions between Lymphoid and Non-Lymphoid Cells, and Generic Transcription Pathway, along with pathways related to drug metabolism like Aspirin ADME, were found to be among the top pathways in AD (Figure 2A).
Comparison of canonical pathways and AD related genes in both AD and T2DM
The comparative analysis of canonical pathways via a heatmap display in T2DM and AD revealed both shared and distinct patterns of canonical pathway activity (Figure 1G). The significant canonical pathways that were similarly activated or inhibited in T2DM and AD based on the Z score included the Neuroinflammation Signaling Pathway, S100 Family Signaling Pathway, G-Protein Coupled Receptor Signaling, NF-κB Signaling, FAK Signaling, IL-10 Signaling, Th1 Pathway, signaling by Rho Family GTPases, Oxytocin Signaling Pathway, IL-3 Signaling, TREM1 Signaling, Parkinson's Signaling Pathway, PPARα/RXRα Activation, ERK/MAPK Signaling, and Reelin Signaling in Neurons. IL-10 signaling, and PPARα/RXRα Activation, most of which are key mediators of anti-inflammatory responses and lipid metabolism. Several additional pathways were inhibited (negative Z score) in both diseases, including ERK/MAPK Signaling, G-Protein Coupled Receptor Signaling, and Reelin Signaling in Neurons, indicating shared disruptions in cell signaling and neuronal functions (Figure 2B).
A heat map analysis based on the expression status of the genes was also conducted for AD and T2DM (Figure 1H). Gene expression comparison was performed on 37 genes related to AD pathogenesis. Among them, PRKCG, APBA1, PDE8B, CHRM3, BACE1, BPTF, UCHL1, NAE1, APBB2, GRIN2B, MAPT, CYP46A1, APP, CAPN1, CAPNS2, GJB1, MAPK1, NCSTN, PRKCB, SNCA, SLC18A3, and CHRM1 were similarly expressed (up- or downregulated) in both AD and T2DM. In contrast, IL1A, CDC20, CSNK1D, CTSG, CASP3, IDE, GRIN2A, ACHE, AGER, CAPNS1, CDK5R1, GAL, and PSENEN were differentially expressed between the two disease conditions (Figure 2C).
Relative expression analysis by TLDA
We implemented a TLDA profiler array with a preselected panel of 96 genes related to the amyloid hypothesis in AD, based on earlier work by ourselves and others. The TLDA (TaqMan®) array study was conducted on 12 participants divided into four groups: 3 participants in the AD group, 3 in the T2DM group, 3 in the T2DM + AD group, and 3 in the control group. Of the 96 genes analyzed, five were significantly amplified across all three disease groups compared to the controls (Figure 3). Additionally, 67 genes showed amplification when comparing only the T2DM and AD groups (Supplemental Figure 1A, B). In the group with both T2DM + AD, relative expression significantly increased over that of T2DM only and AD only, indicating a cumulative effect. Notably, genes such as AGER, APP, CAPNS2, and MAPK1 were significantly increased, while CAPN1 significantly decreased in T2DM + AD group compared to the controls (Figure 3). We also noted that CAPNS2 exhibited the highest relative expression in patients with both T2DM and AD. The ANOVA post-hoc analysis revealed that AGER, CAPN1, and MAPK1 showed significantly different relative expression levels between the T2DM and T2DM + AD groups.

Quantitative real-time PCR (qRT-PCR) AD pathobiology related genes which were relatively expressed (in T2DM (n = 3), AD (n = 3), T2DM + AD (n = 3)) compared to the control (n = 3). We used TLDA card-based profiler array analysis using the TaqMan® Array (FAST Plate) from Applied Biosystems (Catalog # 4418715, Santa Clara, CA, USA) on the ABI 7900HT-Fast Real-time PCR system for quantification. These cards are designed with preselected ninety-six (96) genes, including a reference gene (GAPDH (Hs99999905_m1)) and a manufacturer control (18 s rRNA (Hs99999901_s1)). Relative expression values were calculated using the 2−ΔCt method, normalized to GAPDH. One-way ANOVA was used to determine statistical significance between each disease group (T2DM, AD, and T2DM + AD) and the control. A p-value of <0.05 was considered statistically significant. Post-hoc comparisons were performed using Tukey's Honestly Significant Difference (HSD) test at a 95% confidence interval with a significance threshold of p < 0.05. (Note: The PRKCB1 expression value is presented without a standard deviation because the reaction could not be replicated due to a shortage of samples.).
Discussion
The prevalence of T2DM in Pakistan ranks among the highest globally, with an estimated prevalence of 37%. Contributing factors, including inadequate healthcare infrastructure, socioeconomic challenges, high dietary cholesterol intake, and complex social determinants, further exacerbate disease burden. Our previous study emphasized the need for more information on T2DM and AD pathways, potentially providing insights for deepening the understanding of overlapping versus disease-specific mechanisms.19,20 The present study extends those results by identifying genes with overlapping expression patterns in both diseases, which may provide insights into the common pathogenic mechanisms underlying T2DM and AD.
A pooled meta-analysis has shown that T2DM increases the risk of dementia across both genders, with hypoglycemic and hyperglycemic episodes further exacerbating this risk. 7 Patients with recurrent severe hypoglycemic episodes have a 1.5–2.0 times greater risk of the development or deterioration of cognitive impairment.22,23 Severe hypoglycemia can induce the permanent neurologic sequelae including neuronal cell death.22–24 T2DM is also associated with an increased expression of interleukin-6 in the central nervous system, causing inflammation of the brain and, in conjunction with oxidative stress, is implicated in the pathogenesis of AD. 25 While diabetes is more frequently linked to vascular dementia, cognitive dysfunction has also been observed in T2DM patients, with common pathways such as neurodegeneration and insulin resistance implicated. 13 Molecular mechanisms involved in T2DM appear to be relevant to the pathogenesis of AD, although the exact causality and the potential effects of disease-modifying therapies for T2DM-AD risk remain unclear. Our present findings revealed that T2DM and T2DM + AD patients had significantly higher HbA1c levels (11.1% and 10.3% respectively) compared to AD (5.62%) and control groups. This suggests severe glycemic dysregulation in these two groups, which is not only indicative of poor blood glucose control but also highlights the possible association between chronic hyperglycemia and cognitive decline. Chatterjee et al., 2016 emphasizes that both chronic hyperglycemia and recurrent hypoglycemic episodes are independently associated with an increased risk of dementia. 7 While our findings directly reflect elevated HbA1c levels indicative of long-term hyperglycemia, we acknowledge that hypoglycemia although not directly assessed in this study, it is evidenced that it may lead to permanent neuronal injury and exacerbate cognitive dysfunction. Together, these extremes in glycemic fluctuation contribute to neuroinflammation, oxidative stress, and mitochondrial damage, which align with the transcriptomic alterations observed in our T2DM and T2DM + AD participants. This dual-risk mechanism further underscores the need for maintaining optimal glycemic control in mitigating dementia risk in diabetic populations. Elevated HbA1c levels have previously been associated with an increased risk of cognitive dysfunction and AD.26,27 Additionally, MMSE score in the AD and T2DM + AD group was 9.24 ± 1.23 and 9.12 ± 1.93 respectively which indicates a severe cognitive impairment compared to control and T2DM group.28,29 This evidence supports the elevated HbA1C in the T2DM + AD group suggests a potential overlap between the metabolic dysregulation of T2DM and cognitive impairment in AD. While our findings shared overlapping genes and pathways with earlier work from the same cohort, the use of a distinct set of RNA samples selected based on severity and specific clinical parameters likely contributed to the observed differences in DEGs. This highlights the intra-cohort variability and suggests that integrating all available microarray datasets from the broader cohort may provide stronger statistical power. We are currently curating these datasets to allow for future combined meta-analyses.
In our global gene expression results, the overlap of 58 commonly dysregulated genes between T2DM and AD suggests that both conditions share common molecular pathways, particularly those related to neuroinflammation and mitochondrial dysfunction. The upregulation of the gene CXCL5 in both T2DM and AD suggests a potential link to inflammation, a known contributor to neurodegeneration. 30 Furthermore, chronic inflammation plays a pivotal role in the development and progression of both T2DM and AD. 31 These findings align with previous studies that have emphasized the central role of inflammation and mitochondrial dysfunction in the pathogenesis of both diseases. 32 Pathway analysis also revealed several key canonical pathways common to both diseases, including IL-10 signaling, neuroinflammation, and mitochondrial dysfunction consistent with our previous study. 19 Even though a similar pattern of dysregulated pathways was observed in this study, the global gene expression results differed from our previous studies conducted separately in T2DM and AD patient cohorts.18,19 Notably, dysregulation of CD40LG and CCNA2, two of the top 10 dysregulated genes, was similarly reported by Noreen et al. (2020) in diabetic patients. 18 These discrepancies are possibly due to differences in the type of patients recruited, particularly based on disease severity and clinical factors.
Mitochondrial dysfunction, driven by insulin resistance in T2DM, is another key factor that may contribute to neurodegenerative processes. Our gene network analysis of T2DM patients showed dysregulation of central genes such as PSEN1, APP, and PSENEN, which are associated with mitochondrial dysfunction and neuroinflammation signaling pathways. These findings suggest that the metabolic dysregulation seen in T2DM may influence neurodegenerative processes in AD patients, like other reports linking mitochondrial dysfunction to the development of neurodegenerative diseases. 33 Additionally, the gene networks related to amyloid-β processing were significantly enriched in T2DM patients, further suggesting the interconnection between metabolic dysfunction and amyloid plaque formation. 34
Our study also identified several genes that are upregulated in both T2DM and AD, including UCHL1 and CDK1. These genes have been implicated in the pathogenesis of AD in several studies.35–37 UCHL1, for instance, has been shown to interact with the ubiquitin-proteasome system, playing a crucial role in the degradation of damaged proteins, which is relevant to the accumulation of amyloid plaques in AD. 38 Similarly, CDK1, a cyclin-dependent kinase involved in cell cycle regulation, is associated with neuronal cell cycle re-entry and the pathological formation of neurofibrillary tangles, a hallmark of AD. 38 Our results further corroborate these findings, highlighting the significant role of these genes in both T2DM and AD pathogenesis.
Comparative analysis of canonical pathways revealed both shared and distinct patterns of pathway activation in T2DM and AD. Notably, the activation of NF-κB signaling in T2DM and its inhibition in AD underscores the complexity of the inflammatory response in these diseases. While inflammation is generally activated in T2DM, it is suppressed in AD, which may reflect the differing inflammatory profiles in the two conditions. 39 The inhibition of pathways like ERK/MAPK and reelin signaling in neurons in both diseases suggest shared disruptions in cell signaling and neuronal functions (Figure 1G). Comparative study of AD-related genes in T2DM and AD revealed 22 genes that are similarly up- or downregulated in both conditions. Among these, BACE1 was significantly upregulated, while MAPT and APP were downregulated in both diseases. BACE1 plays a critical role in amyloid precursor protein processing and plaque formation, a key feature of AD pathology. 40 The downregulation of MAPT, which is associated with tauopathies, further supports the idea that disruptions in tau-related processes contribute to neurodegeneration in both diseases.41–43 These findings suggest that the molecular mechanisms driving T2DM and AD overlap, particularly in the regulation of amyloid precursor protein processing and tau phosphorylation, both of which are key to AD pathology.
The TLDA (TaqMan®) array study further reinforced our transcriptomic findings. The analysis of 96 AD-related genes revealed significant relative expression differences in genes such as AGER, APP, CAPN1, CAPNS2, and MAPK1, in the T2DM + AD group. We also observed that that AGER, CAPN1, and MAPK1 showed significantly different relative expression levels between the T2DM and T2DM + AD groups. These findings align with our global gene expression study, where CAPNS2 exhibited the most significant increased relative expression and CAPN1 showed the decreased relative expression. 18 These genes are members of the calpain family, which have been implicated in various physiological and pathological processes in AD. 44 The increased relative expression of CAPNS2 has been shown to precede tau phosphorylation and the loss of synaptic proteins, both critical events in AD pathogenesis. 45 These results highlight the role of calpains in the development and progression of AD and suggest that T2DM may exacerbate these processes. Nonsignificant but interestingly a greater relative expression difference observed in ACHE in between the T2DM and T2DM with AD group. Similarly, pattern of increased relative expression observed in CDK5R1 in T2DM with AD group, CDK5R1 leads to increased production of p25, a cleavage product that hyperactivates CDK5 and causes abnormal phosphorylation of neuronal proteins, especially tau. 46 This results in tau aggregation, synaptic dysfunction, and neuronal death, key features of AD pathology. Increased expression of MAPK1, a member of the Mitogen-Activated Protein Kinase (MAPK) pathway, is implicated in the progression of AD. Specifically, studies indicate that MAPK1 activation, and particularly the p38 MAPK pathway, contributes to neuronal apoptosis, inflammation, and oxidative stress, all of which are hallmarks of AD.47,48 Overall, the relative expression patterns of the above genes highlight distinct molecular mechanisms underlying T2DM and AD. Specifically, the dysregulation of these genes exclusively in the T2DM group, contrasting with their increased relative expression in both AD and combined AD + T2DM conditions, suggests diabetes-specific alterations in pathways involving neuronal signaling, amyloid processing, oxidative stress, and neurotransmission. These findings imply that while AD and T2DM share some molecular features, unique genetic responses in T2DM may reflect distinct pathogenic processes.
In conclusion, our study highlights a high degree of molecular overlap between T2DM and AD, and has identified shared pathways, including neuroinflammation, mitochondrial dysfunction, and amyloid processing, which may contribute to neurodegenerative processes. The research emphasizes the importance of understanding these common mechanisms, which could aid in early diagnosis and the development of targeted therapies for T2DM patients at heightened risk of AD, especially in Pakistan with limited healthcare resources. By focusing on differentially expressed genes like CXCL5 and APP, this work underscores inflammation and mitochondrial dysfunction as promising therapeutic targets, paving the way for scalable preventive and diagnostic interventions in regions facing a growing burden of both T2DM and AD. Future research required to validate these findings in larger cohorts and explore therapeutic strategies targeting these overlapping pathways, which may offer new avenues to reduce disease progression. Furthermore, investigating genetic, environmental, and lifestyle factors in diverse populations will be essential to advance understanding and develop tailored interventions for at-risk populations.
Strengths and limitation of the study
Notably, this study is among the first in Pakistan to examine a gene expression profile in T2DM + AD patients. It focused on the common genes and common canonical pathways that may be plausibly related to the pathophysiology of T2DM and AD. The global gene expression analysis, combined with IPA data, offered detailed insights into differential gene expression and the signaling pathways involved in T2DM and AD. We applied an efficient validation process to emphasize the most significant associations between these two conditions, but our results are limited by the small sample size of these experiments. Another limitation is the use of a small subset of new samples from the same cohort, which may contribute to variation compared to our earlier findings. Future integration of all available datasets will be important to validate and strengthen these findings. We were unable to perform global expression analysis on the AD + T2DM patients due to the delayed arrival of their samples in a separate batch. Instead, we conducted only the TLDA array for the AD + T2DM samples. Additionally, our study did not validate the differentially expressed genes at the protein expression level. We also observed a different set of significant genes in the present study compared to our previously published research, possibly due to differences in patient selection (based on disease state) from the same cohort. Future studies with larger sample sizes for T2DM and AD are necessary to further validate these findings, uncover the underlying mechanisms of disease onset and progression, and explore potential strategies for treatment and prevention based on this knowledge.
Supplemental Material
sj-docx-1-alr-10.1177_25424823251403462 - Supplemental material for Exploring shared molecular pathways and gene signatures in type 2 diabetes mellitus and Alzheimer's disease in a Pakistani cohort
Supplemental material, sj-docx-1-alr-10.1177_25424823251403462 for Exploring shared molecular pathways and gene signatures in type 2 diabetes mellitus and Alzheimer's disease in a Pakistani cohort by Zarish Noreen, Tanmoy Mondal, Jheannelle Johnson, Jasneet Sahota, Christopher A Loffredo, Gail Nunlee-Bland, Brent Korba, Attya Bhatti, Vijay Chandra and Somiranjan Ghosh in Journal of Alzheimer's Disease Reports
Footnotes
Acknowledgements
The authors would like to extend their sincere thanks to all the respondents who voluntarily participated in the study and provided valuable responses during the recruitment process. The contents of this report are solely the responsibility of the authors. Our sincere thanks go Prof. Siddhartha S. Jana of Laboratory of Molecular and Cellular Biology (LMCB), Indian Association for the Cultivation of Science, India and Dr Sumit Sarkar of National Center for Toxicological Research of FDA/HHS, Jefferson, Arizona for their thoughtful advice and editing the manuscript.
Ethical considerations
The study was undertaken with prior approval of Howard University Institutional Review Board (IRB-17-MED-43), and informed consent was obtained from volunteers as per the approval of the Institutional Review Board (IRB) of Atta-ur-Rahman School of Applied Biosciences (ASAB), National University of Sciences and Technology (NUST) (28/IRB; dated. 20th April 2016).
Consent to participate
Informed consent was obtained from all individual participants included in the study.
Consent for publication
We hereby confirm that we did not use any individual identifiable background or medical records, which only reflect the population as whole whom we worked with. We also disclose to the participants statement confirming we will not reveal the independent medical information to anyone, and the consent to publish analyzed data was obtained within the manuscript text.
Author contribution(s)
Funding
This work was supported by U54 MD007597-34 (Parent) and U54 MD007597-35 (Supplement)- 5859 grant (Center PI: Southerland; Project Lead: Ghosh) from the National Institute of Minority Health and Disparity (NIMHD/NIH). This work also received support from Higher Education Commission (HEC), Pakistan (1-8/HEC/HRD/2017/6867) to Zarish Noreen. Supporting funding also received from ASAB (NUST) (Grant # 20-2321/R&D/HEC/14, PI: Bhatti. We are also indebted to Dr Peter John of National University of Sciences and Technology (NUST), Islamabad, Pakistan for the Grant support (Grant # 5965/Federal/NRPU/R&D/2016, PI: John).
Declaration of conflicting interests
The authors declared no potential conflicts of interest with respect to the research, authorship, and/or publication of this article.
Data availability statement
Data are stored and may be available upon reasonable request complying with the current data sharing policy of NIH, available at ![]() . gov/grants/guide/notice-files/NOT-OD-03-032.html. The data sets used in this study include personal information. Thus, datasets (Coded and with no personal information) are available from the corresponding author, Dr Somiranjan Ghosh, on reasonable requests. All raw and processed transcriptomic data generated in this study is available in the NCBI Gene Expression Omnibus (GEO) database (GSE303974) upon acceptance of the manuscript, to ensure public accessibility, transparency, and reproducibility of the findings
. gov/grants/guide/notice-files/NOT-OD-03-032.html. The data sets used in this study include personal information. Thus, datasets (Coded and with no personal information) are available from the corresponding author, Dr Somiranjan Ghosh, on reasonable requests. All raw and processed transcriptomic data generated in this study is available in the NCBI Gene Expression Omnibus (GEO) database (GSE303974) upon acceptance of the manuscript, to ensure public accessibility, transparency, and reproducibility of the findings
Supplemental material
Supplemental material for this article is available online.
References
Supplementary Material
Please find the following supplemental material available below.
For Open Access articles published under a Creative Commons License, all supplemental material carries the same license as the article it is associated with.
For non-Open Access articles published, all supplemental material carries a non-exclusive license, and permission requests for re-use of supplemental material or any part of supplemental material shall be sent directly to the copyright owner as specified in the copyright notice associated with the article.