
Abstract
Background
Metabolic dysfunction-associated steatotic liver disease (MASLD) is increasingly recognized as a multisystem condition with extrahepatic complications, including cognitive decline, Alzheimer's disease, and related dementias. However, conventional clinical tools have limited ability to predict dementia-related mortality in this population.
Objective
To develop and internally validate survival-based machine-learning models for predicting dementia-related mortality among adults with MASLD and identify key clinical predictors.
Methods
Adults with MASLD were identified from NHANES III with linked mortality data. Dementia-related mortality was defined using National Death Index codes for Alzheimer's disease and other dementias. Cox proportional hazards models, random survival forests, gradient-boosted survival models, and logistic regression were developed and compared with exploratory comparator model. Performance was evaluated using concordance indices, area under the receiver-operating-characteristic curve, Brier scores, and reclassification metrics relative to the FIB-4 score.
Results
Among 1774 adults with MASLD, 115 dementia-related deaths occurred during a median follow-up of 193 months. Overall discrimination was modest. Logistic regression showed the highest discrimination in 5-fold cross-validation, whereas the penalized Cox model achieved the highest bootstrap C-index. The gradient-boosted survival model demonstrated the greatest improvement in reclassification compared with FIB-4. Exploratory risk stratification classified all dementia-related deaths within the high-risk cohort, although these findings warrant cautious interpretation due to possible overfitting. Waist circumference, diabetes, body mass index, and age were the most influential predictors.
Conclusions
Survival-based models may improve identification of MASLD patients at elevated risk of dementia-related mortality. Metabolic and anthropometric factors appeared more informative than liver fibrosis scores, and warrant external validation in contemporary cohorts.
Keywords
Introduction
Metabolic dysfunction-associated steatotic liver disease (MASLD), a hepatic pathology with multisystemic effects, impacts a growing proportion of adults worldwide and is increasingly recognized.1,2 MASLD's systemic metabolic and inflammatory milieu may also contribute to neurodegenerative outcomes, including dementia mortality.3–5
Previous observational data have underscored this risk; in large-scale matched-cohort studies, patients with steatotic liver disease demonstrated significantly higher rates of dementia compared to reference individuals (adjusted hazard ratio [aHR], 1.38; 95% confidence interval [CI], 1.10 to 1.72), with particularly elevated risks observed in those with comorbid heart disease (aHR, 1.50; 95% CI, 1.08 to 2.05) or prior stroke (aHR, 2.60; 95% CI, 1.95 to 3.47). 6 Despite these associations, identifying which specific patients are at the highest risk for dementia-related mortality remains a critical, yet unmet, clinical priority.
Despite the substantial long-term morbidity associated with dementia mortality in MASLD, current risk-stratification tools remain limited. Traditional prognostic instruments, such as the FIB-4 score, were designed for hepatic fibrosis assessment and offer little utility for predicting neurological endpoints.7–9 As MASLD prevalence rises and its phenotypes diversify, there is an urgent need for more accurate, individualized prognostic approaches capable of identifying patients who may benefit from targeted surveillance or early preventive interventions.
Advances in survival machine-learning methods offer an opportunity to refine risk prediction for complex, low-frequency outcomes by leveraging high-dimensional clinical data. Such models may detect nonlinear interactions and latent risk patterns that conventional statistical approaches are unable to capture.10,11 However, their application to dementia mortality in MASLD has not been previously evaluated at scale.
In this study, we aimed to determine whether modern survival learning methods can improve risk prediction for Alzheimer's disease and related dementia mortality among adults with MASLD and we aimed to identify the clinical features most strongly associated with neurological death in this population. To accomplish these aims, we developed and internally validated multiple survival machine-learning models to predict dementia mortality among adults with MASLD using nationally representative data. We further compared model performance, assessed clinical utility through decision-curve analysis, and examined reclassification metrics relative to FIB-4.
Methods
Study design, participants, and reporting
We conducted a retrospective cohort study using publicly available data from the National Health and Nutrition Examination Survey (NHANES) III, identifying adults with MASLD who had linked mortality follow-up. Dementia-related mortality was defined using the National Death Index cause-of-death codes corresponding to Alzheimer's disease and other dementias. Follow-up time was calculated from the NHANES examination date to the date of death or censoring. This manuscript is written per the Transparent Reporting of a multivariable prediction model for Individual Prognosis Or Diagnosis-Artificial Intelligence (TRIPOD + AI). 12
Predictors
Twenty-three clinical, metabolic, laboratory, and demographic features were included as candidate predictors. These included age, sex, race/ethnicity, body mass index (BMI), waist circumference, smoking status, physical activity relative to peers, metabolic markers (e.g., triglycerides, HDL cholesterol, fasting glucose), indicators of liver health (e.g., FIB-4 score, albumin, platelet count), and socioeconomic indicators (e.g., poverty-income ratio). Data preprocessing followed NHANES analytic guidelines.
Missingness was assessed for all candidate predictors before model development. The proportion of missing values was quantified for each variable; most predictors had low rates of missingness (<5%), although selected laboratory values (e.g., fasting glucose, triglycerides) had higher rates of missingness (up to approximately 10–15%) reflecting the fasting subsample design of NHANES III. The overall pattern of missingness was assessed and considered to be consistent with a missing-at-random (MAR) assumption, given that missingness was predominantly attributable to the survey sampling design rather than to unmeasured patient-level factors.
Participants with missing outcome data (mortality status) or missing follow-up time were excluded from the analytic cohort prior to any modeling. For predictor variables with missing values, simple imputation was performed within the training data during cross-validation to avoid information leakage between training and validation folds. Specifically, continuous variables were imputed using the median value computed from the training fold, and categorical variables were imputed using the most frequent category (mode) from the training fold. The same imputation parameters (i.e., training-fold medians and modes) were then applied to the corresponding held-out validation fold without recalculation. This procedure was repeated independently within each of the five cross-validation splits. For the final full-dataset refit models, imputation was performed once using median and mode values from the entire analytic cohort. Given the relatively low rates of missingness for most predictors and the exploratory nature of this study, this approach was considered a reasonable and reproducible strategy. Continuous predictors were standardized (zero mean, unit variance) where required for regression-based models (i.e., penalized Cox proportional hazards and logistic regression); tree-based models did not require standardization.
Outcome
The primary outcome was time to dementia-related death, defined by National Death Index code for dementia (i.e., cause of death code 7). Of note, secondary neurological mortality (i.e., dementia and stroke) was catalogued but was not modeled as a separate endpoint.
Model development and hyperparameter optimization
Four primary models were developed: (1) a Cox proportional hazards (CoxPH) model with both unpenalized and elastic-net-penalized (L1/L2) configurations; (2) a random survival forest (RSF); (3) a gradient-boosted survival model (GBS); and (4) a logistic regression model included as a baseline binary-outcome comparator. In addition, we evaluated exploratory comparator models, including a latent profile survival model inspired by mixed-membership approaches used in Alzheimer's disease research and a neural network–based survival model (DeepSurv architecture). Model selection was prespecified based on established utility in clinical prediction and the ability to accommodate nonlinear or high-dimensional relationships.
Cox proportional hazards models: The unpenalized CoxPH model was fitted using all 23 candidate predictors, with the Breslow method for handling ties in event times. The penalized CoxPH model used elastic-net regularization (scikit-survival or lifelines implementation) with the regularization strength (alpha) selected via cross-validated partial log-likelihood. A mixing parameter (L1 ratio) of 0.5 was used to balance variable selection (L1) and coefficient shrinkage (L2).
Random survival forest: The RSF was implemented using the scikit-survival library. Hyperparameters tuned included the number of trees (candidates: 100, 300, 500, 1000), maximum tree depth (candidates: 3, 5, 10), and minimum number of samples required at a terminal node (candidates: 5, 10, 20, 50). Log-rank splitting was used as the split criterion.
Gradient-boosted survival model: The GBS model was implemented using scikit-survival's GradientBoostingSurvivalAnalysis. Hyperparameters tuned included the number of boosting iterations (candidates: 100, 300, 500), learning rate (candidates: 0.01, 0.05, 0.1), maximum tree depth (candidates: 1, 2, 3, 5), and minimum samples per terminal node (candidates: 5, 10, 20). The loss function was set to the Cox partial-likelihood (coxph) loss.
Logistic regression: A binary logistic regression model was fit to predict the occurrence of dementia-related death (binary outcome), rather than time-to-event, and was included as a non-survival baseline comparator. L2 regularization was applied with the regularization parameter (C) selected via cross-validation.
Hyperparameter optimization procedure: For each machine-learning model, hyperparameter optimization was performed using an inner cross-validation loop (3-fold) nested within the outer 5-fold cross-validation used for performance evaluation. The combination of hyperparameters yielding the highest cross-validated concordance index (C-index) was selected for each model. In cases where C-index values were similar (within 0.005), the configuration with the lower Brier score (better calibration) was preferred. For regression-based models (CoxPH and logistic regression), penalization parameters were selected using cross-validated likelihood-based criteria where applicable.
Exploratory comparator models: The latent profile survival model used a two-class mixture specification, and the neural survival model used a single hidden layer with 64 nodes, dropout of 0.3, and the Adam optimizer with a learning rate of 0.001. These models are reported for completeness but were not the focus of the primary analysis.
Non-linearity
Tree-based models incorporated nonlinear effects without transformation. Global feature importance was extracted for machine-learning models.
Validation and calibration assessment
Discrimination: Model discrimination was evaluated using the Harrell concordance index (C-index) and time-dependent area under the receiver-operating-characteristic curve (AUC) at 10- and 15-year horizons. The C-index quantifies the probability that, for a randomly selected pair of participants, the individual with the higher predicted risk experienced the event first. Values above 0.5 indicate better-than-chance discrimination.
Calibration: Calibration was assessed using multiple complementary approaches including use of integrated Brier scores, risk-group calibration comparisons, and fixed-time survival probability comparisons where applicable. First, the integrated Brier score (IBS) was computed over the observed follow-up period, combining discrimination and calibration into a single measure of overall prediction error; lower values indicate better agreement between predicted survival probabilities and observed outcomes. Second, for each model, participants were grouped into risk deciles (or quintiles, when event counts were insufficient for decile-level assessment) based on predicted risk probabilities, and the mean predicted risk within each group was compared with the observed event proportion (i.e., a calibration-in-the-large assessment). A perfectly calibrated model would produce a 45-degree line when mean predicted probabilities are plotted against observed proportions. Third, where survival function estimates were available (CoxPH, RSF, GBS models), calibration was additionally examined by comparing predicted survival probabilities at fixed time horizons (e.g., 10 and 15 years) with Kaplan–Meier observed survival within risk strata. We note that formal calibration slope and intercept estimation was not performed owing to the low event count, which would have limited the precision of such estimates and affect the model stability. Accordingly, calibration findings are presented descriptively and should be interpreted with caution.
Cross-validation: Model performance was evaluated using stratified 5-fold cross-validation, with stratification based on the outcome (dementia-related death) to ensure approximately equal event rates across folds given the low prevalence of the outcome. Within each fold, imputation parameters and standardization parameters were derived exclusively from the training partition and applied to the validation partition to prevent information leakage. All performance metrics (C-index, time-dependent AUC, Brier score) were computed on the held-out validation fold, and the mean and standard deviation across the five folds are reported.
Bootstrap validation: To further evaluate model robustness and quantify optimism, we performed 200-iteration bootstrap internal validation. In each iteration, a bootstrap sample (with replacement) of equal size to the original cohort was drawn, the model was fit on the bootstrap sample, and performance was evaluated both on the bootstrap sample (apparent performance) and on the original full cohort (test performance). The optimism was estimated as the mean difference between bootstrap apparent and test performance across iterations, and the optimism-corrected C-index was obtained by subtracting the estimated optimism from the apparent performance on the full dataset. Bootstrap 95% confidence intervals for the C-index were derived using the percentile method.
Censoring assumptions and competing risks
All time-to-event analyses assumed non-informative right censoring, whereby the probability of being censored at any time point was assumed to be independent of the future risk of dementia-related mortality, conditional on the observed covariates. In practice, participants were censored under two scenarios: (1) survival to the end of available mortality follow-up without experiencing dementia-related death (administrative censoring), or (2) death from a non-dementia cause prior to the end of follow-up. Follow-up time was calculated as the interval (in months) from the date of the NHANES III examination to the date of death or the end of the mortality follow-up period (December 31, 2019, corresponding to the most recent NHANES III linked mortality file), whichever occurred first.
We recognize that death from non-dementia causes (e.g., cardiovascular disease, cancer) constitutes a competing risk that precludes the subsequent occurrence of dementia-related death. Under a cause-specific hazard framework, as employed in the present study, the cause-specific hazard for dementia-related mortality is estimated by treating deaths from other causes as censored observations. This approach estimates the instantaneous rate of dementia-related death among individuals who remain alive and at risk, but it does not account for the fact that individuals who die from competing causes are removed from the risk set. Consequently, the predicted probabilities from cause-specific models may overestimate the cumulative incidence of dementia-related death in the presence of substantial competing mortality, particularly over long follow-up periods.
A competing-risk framework using Fine–Gray subdistribution hazard models or cause-specific cumulative incidence functions would provide complementary inference by estimating the probability of dementia-related death while accounting for the competing risk of death from other causes. However, given the exploratory nature of this study and the low event count, formal competing-risk models were not implemented. The present findings should therefore be interpreted as cause-specific prediction of dementia-related mortality, and future studies should evaluate competing-risk approaches, particularly in older MASLD cohorts where non-dementia mortality is prevalent.
Because non-dementia deaths may act as competing events, the present findings should be interpreted as cause-specific prediction rather than cumulative incidence prediction. Future studies with larger event counts should evaluate competing-risk approaches to better characterize absolute dementia-related mortality risk.
Feature importance analysis
For models using tree-based methods, feature importance was estimated using gain-based metrics. We ranked predictors within each model to identify variables contributing most to discrimination.
Model training
After validation, each model was refitted on the full dataset. These training metrics are presented descriptively and not used for clinical inference.
Risk stratification
Patients were stratified into low-, intermediate-, and high-risk groups based on predicted risk percentiles. Kaplan–Meier curves were generated for each risk tier.
Clinical utility
Clinical net benefit was assessed using decision-curve analysis (DCA), and improvements in reclassification were quantified using the net reclassification improvement (NRI) and integrated discrimination improvement (IDI), with FIB-4 serving as a clinical comparator.
Software and reproducibility
All analyses were conducted in Python (version 3.14). Survival models were implemented using the scikit-survival library (version 0.22) for random survival forests, gradient-boosted survival analysis, and penalized Cox models, and the lifelines library (version 0.27) for standard Cox proportional hazards models and Kaplan–Meier estimation. Logistic regression and cross-validation procedures used scikit-learn (version 1.3). Missing-data imputation used scikit-learn's Simple Imputer class with median and most frequent strategies. Decision-curve analysis was performed using the dcurves package. All random seeds were set to a fixed value (seed = 42) to support reproducibility. Final model-specific hyperparameters were selected through the cross-validation procedure described above.
Ethical and governance considerations
Data were de-identified and the study followed best-practice guidance for transparent reporting of AI-enabled prediction models.
Results
Baseline demographics
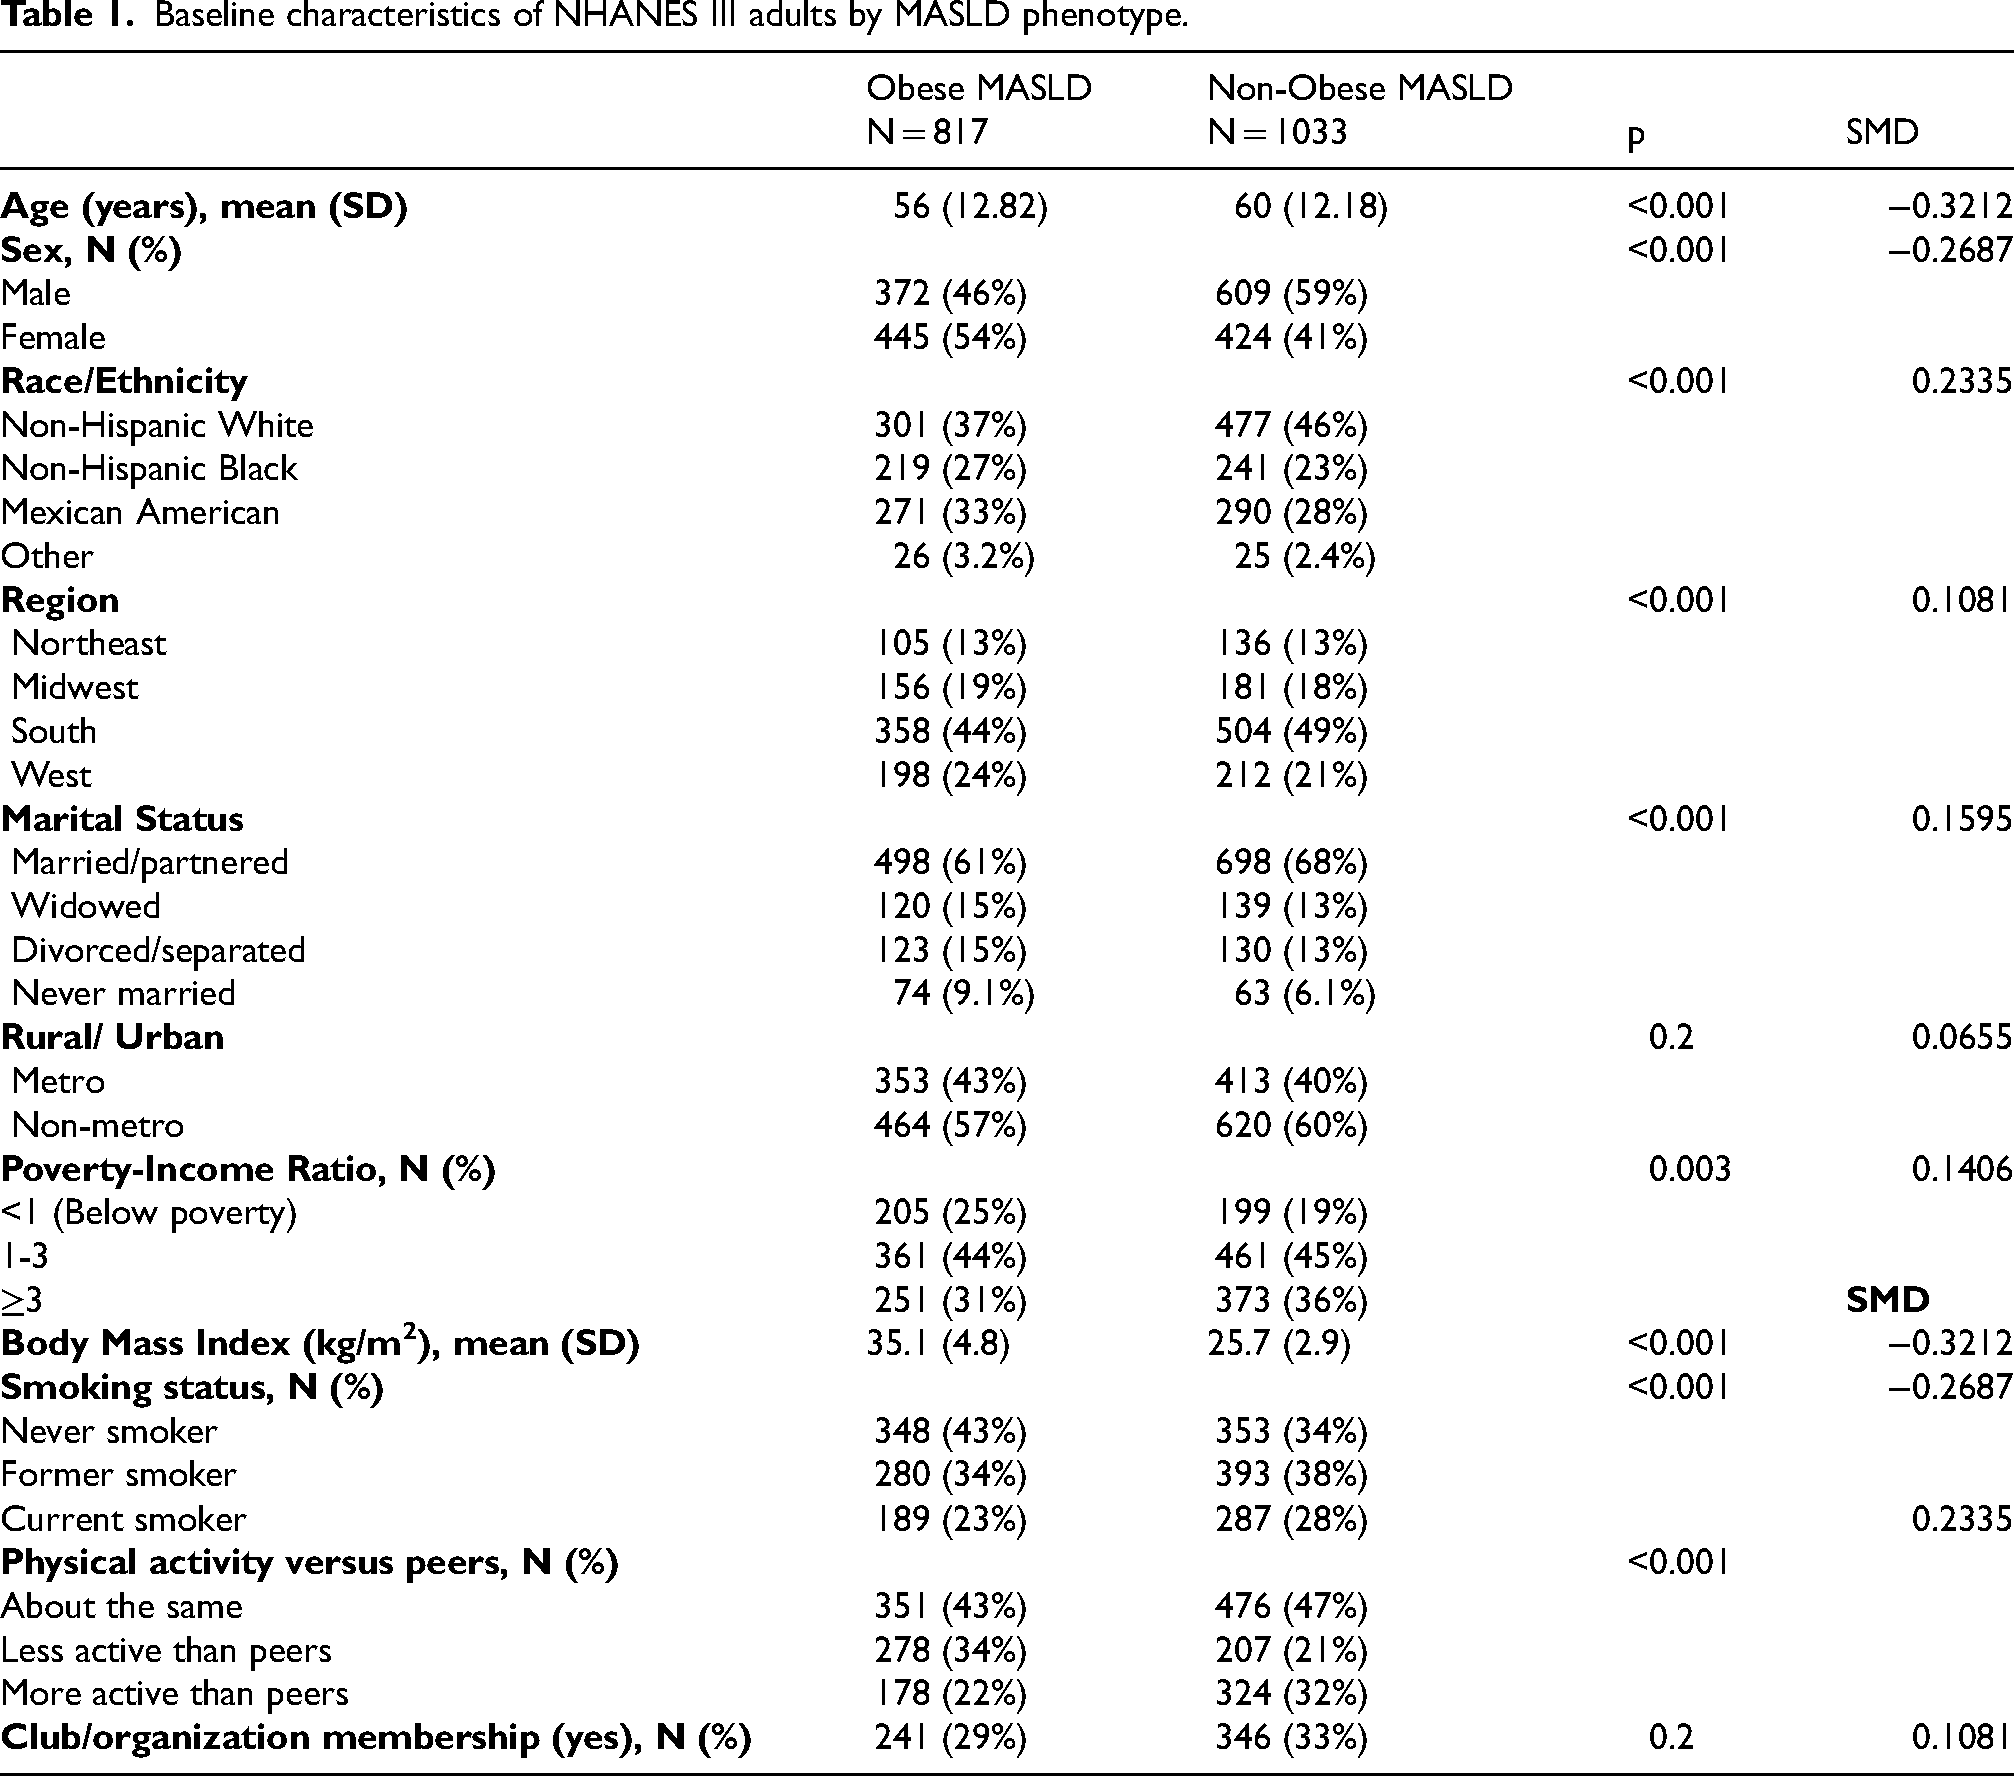
The study population included 1850 adults categorized into obese MASLD (n = 817) and non-obese MASLD (n = 1033). Compared with the obese MASLD group, participants with non-obese MASLD were older (mean [ ± SD] age, 60 ± 12 years versus 56 ± 13 years; p < 0.001) and more likely to be male (59% versus 46%; p < 0.001). BMI was markedly higher in the obese MASLD phenotype (mean, 35.1 ± 4.8 kg/m2) than in the non-obese phenotype (mean, 25.7 ± 2.9 kg/m2; p < 0.001).
Participants with non-obese MASLD were more likely to be current smokers (28% versus 23%) or former smokers (38% versus 34%) compared with those in the obese group (P < 0.001). Furthermore, physical activity levels were higher among non-obese participants, with 32% reporting they were more active than their peers, compared with only 22% of participants with obese MASLD (p < 0.001). Conversely, a larger proportion of the obese group reported being less active than their peers (34% versus 21%) (Table 1). Table 1 uses the broader MASLD phenotype cohort and the modeling cohort is restricted to MASLD with linked mortality follow-up.
Baseline characteristics of NHANES III adults by MASLD phenotype.
There were 1774 adults with MASLD and linked mortality follow-up. Among them, 115 deaths were attributed to Alzheimer's disease and other dementias (6.48%). The median follow-up was 193 months. Baseline characteristics stratified by dementia-related mortality are presented in Table 2. Participants with subsequent dementia-related mortality were younger at baseline NHANES assessment than those without dementia-related mortality (56.1 ± 11.9 versus 58.9 ± 12.2 years; p = 0.019). They also had higher BMI and waist circumference. However, the standardized mean differences for most variables were small, indicating that the magnitude of baseline differences between groups was generally modest.
Baseline characteristics of MASLD patients with non-dementia death compared to participants with dementia deaths.
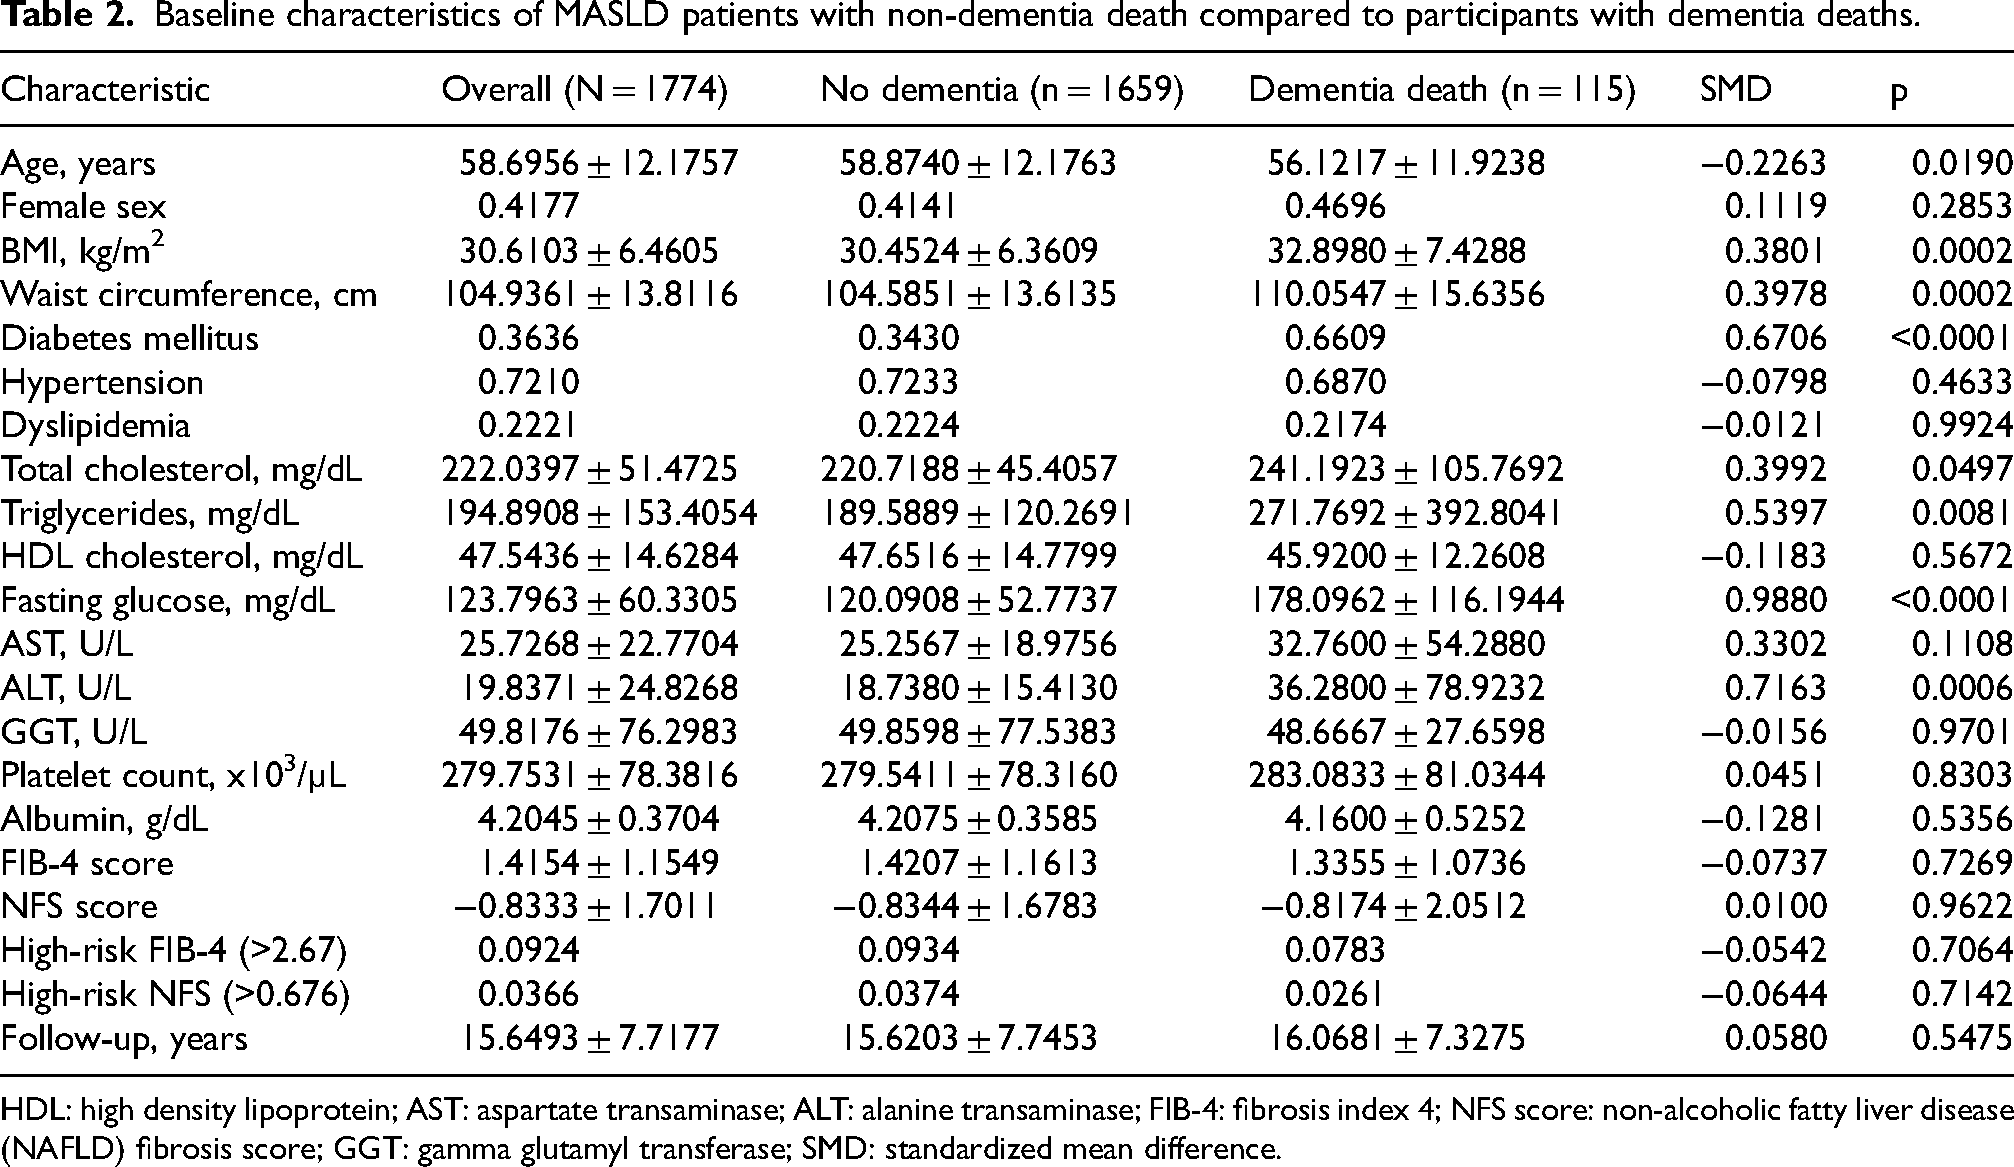
HDL: high density lipoprotein; AST: aspartate transaminase; ALT: alanine transaminase; FIB-4: fibrosis index 4; NFS score: non-alcoholic fatty liver disease (NAFLD) fibrosis score; GGT: gamma glutamyl transferase; SMD: standardized mean difference.
Cross validation
In 5-fold cross-validation, discriminative performance was modest across models. Logistic regression showed the highest overall discrimination, with a C-index of 0.69 (±0.03) and an AUC of 0.69 (±0.04). Among the survival-based models, the random survival forest demonstrated the highest discriminative performance, whereas the gradient-boosted survival model showed the lowest Brier score. Overall, cross-validated performance differences between models were modest.
Bootstrap validation
The penalized Cox proportional-hazards model demonstrated the highest discriminative ability, achieving a C-index of 0.71 (95% confidence interval [CI], 0.63 to 0.77). The logistic regression model showed comparable performance, with a C-index of 0.67 (95% CI, 0.60 to 0.76). The random survival forest and gradient-boosted survival models yielded lower point estimates, with bootstrap C-indices of 0.65 (95% CI, 0.56 to 0.73) and 0.61 (95% CI, 0.52 to 0.70), respectively. Across all evaluated models, bootstrapped AUC values ranged from 0.59 to 0.66.
Final model
After internal validation, each model was refit on the full analytic cohort to generate final model outputs for feature importance, risk stratification, ROC visualization, and clinical utility analyses. These full-dataset refit outputs are reported separately from the cross-validation and bootstrap validation results.
Feature importance
Waist circumference was the most influential predictor (importance, 0.15), followed closely by the presence of diabetes (0.15) and BMI (0.14). Age also demonstrated a high predictive value (0.14) (Figure 1).
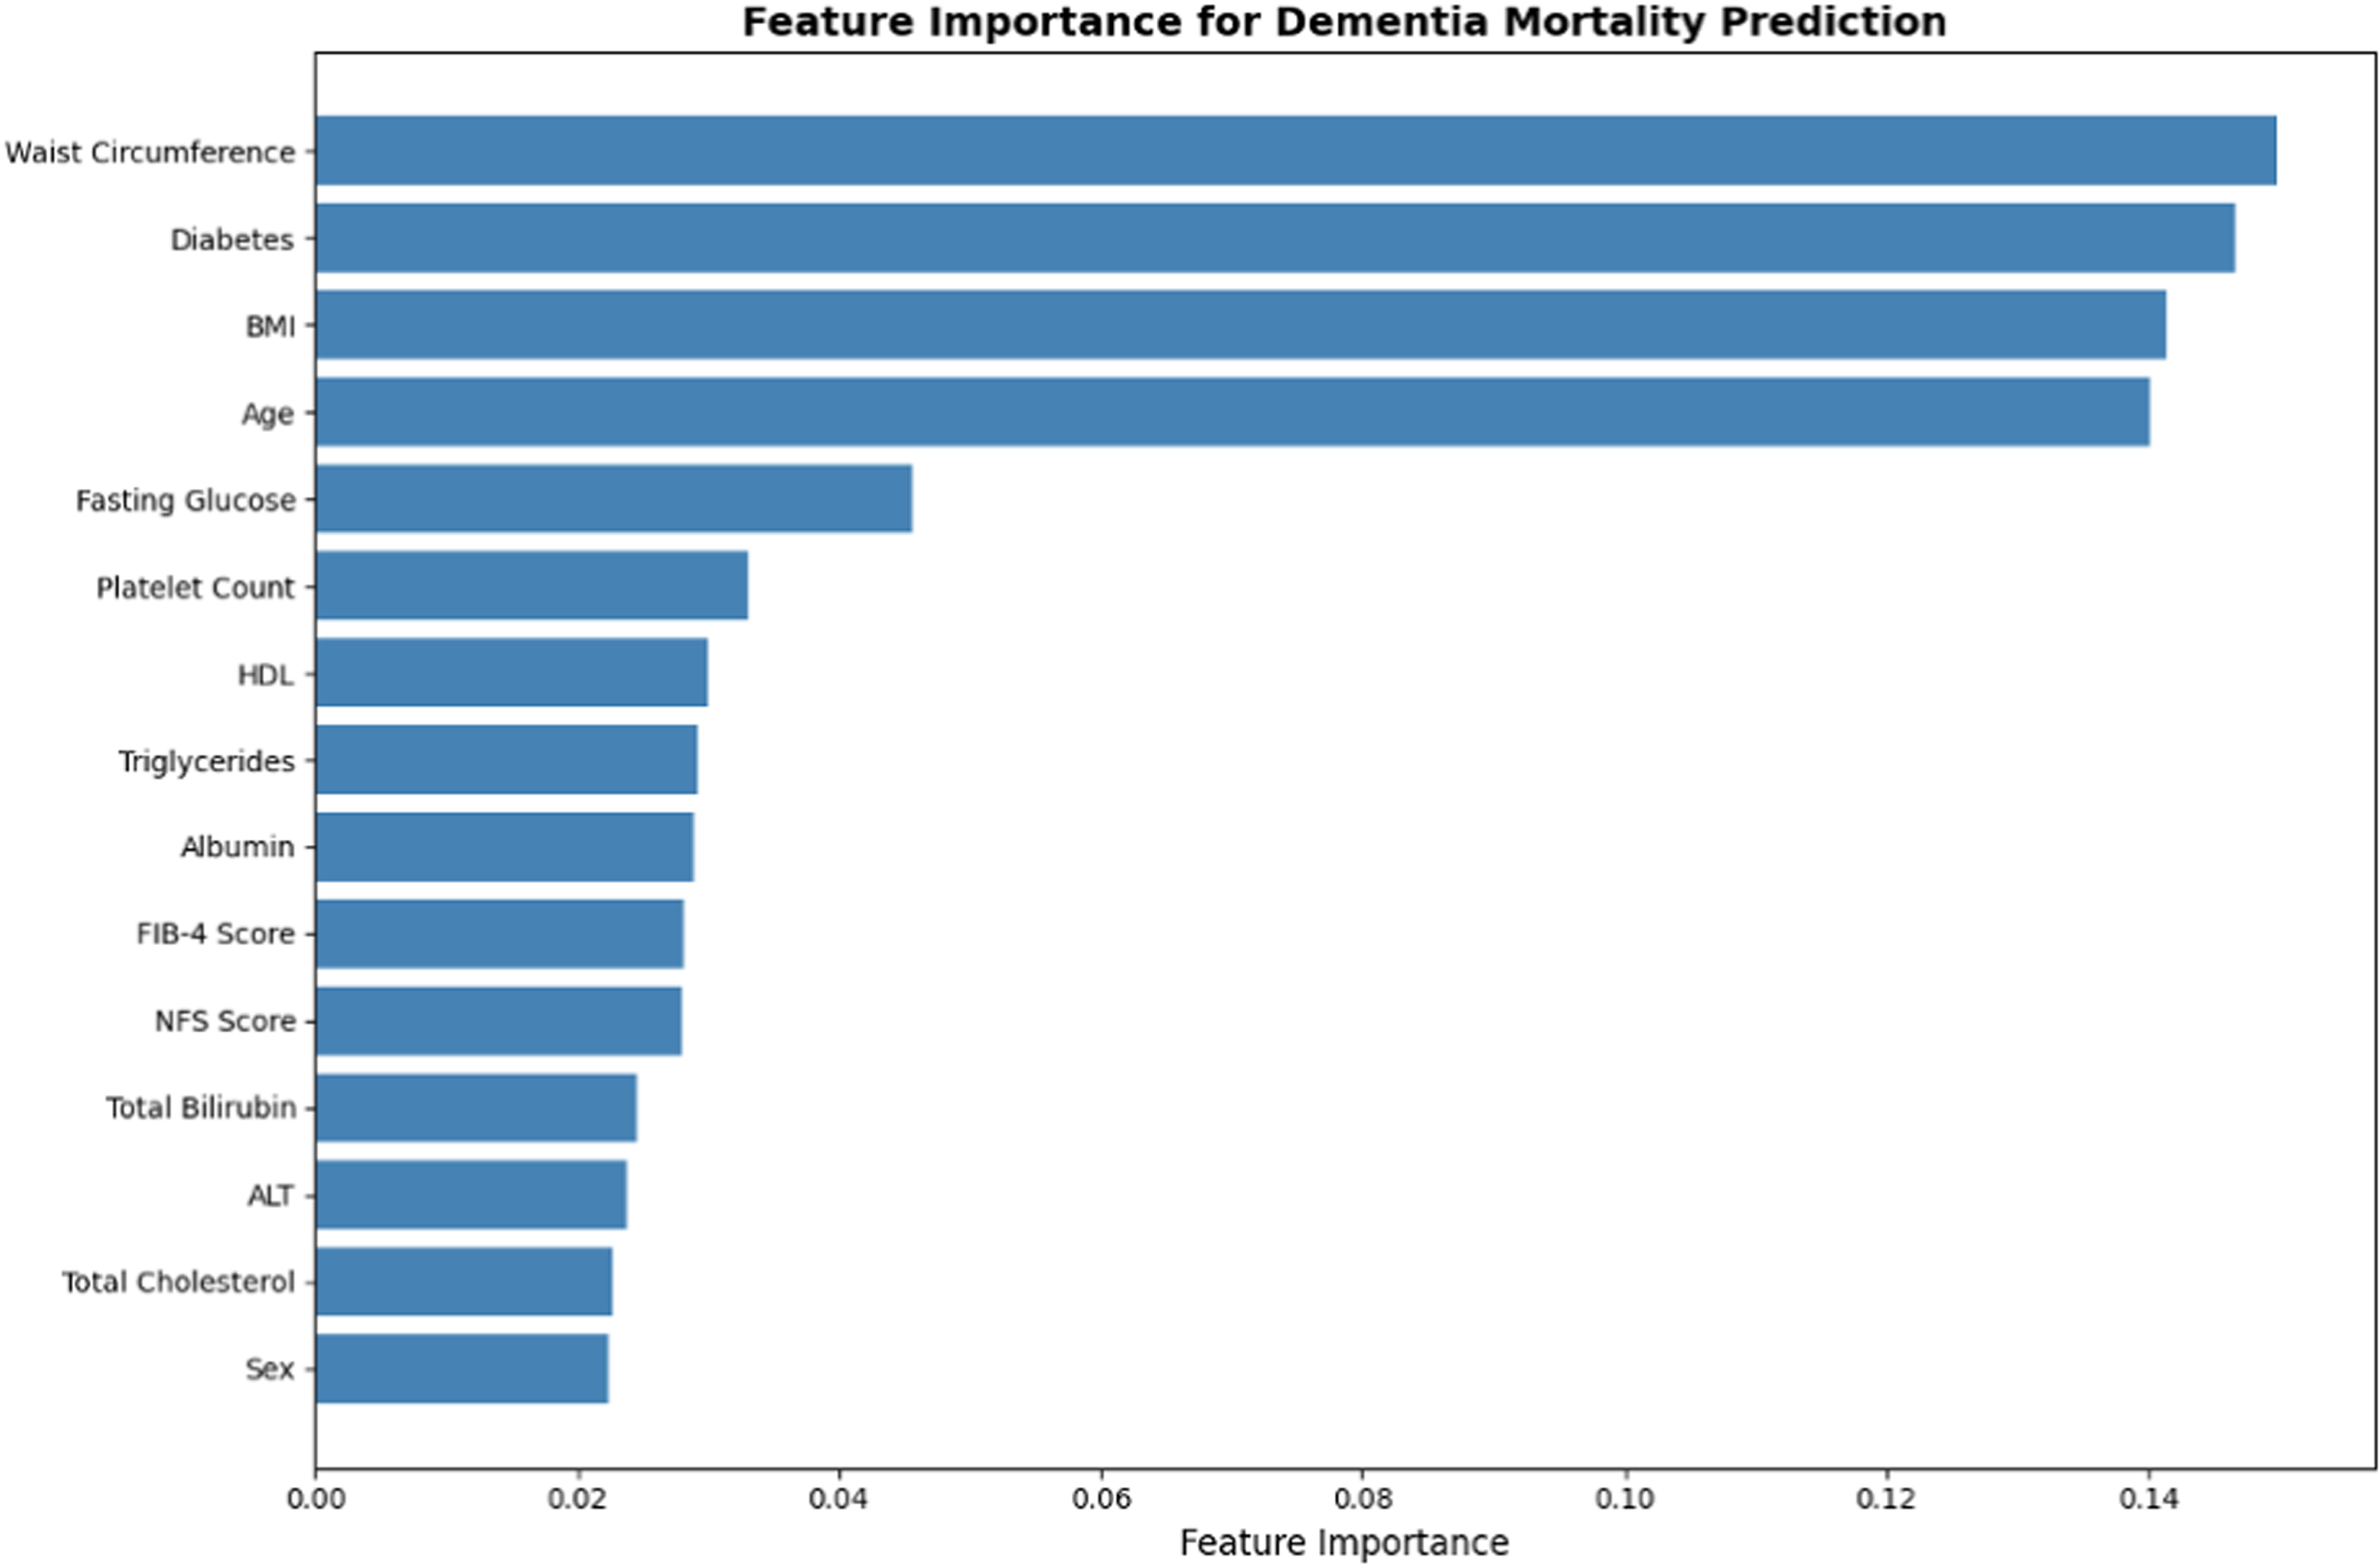
Clinical features ranked by model importance.
Risk stratification
In exploratory risk stratification using the final refitted model, all observed dementia-related deaths were classified within the high-risk cohort (115 deaths among 592 participants; mortality rate, 19.4%).
Clinical utility
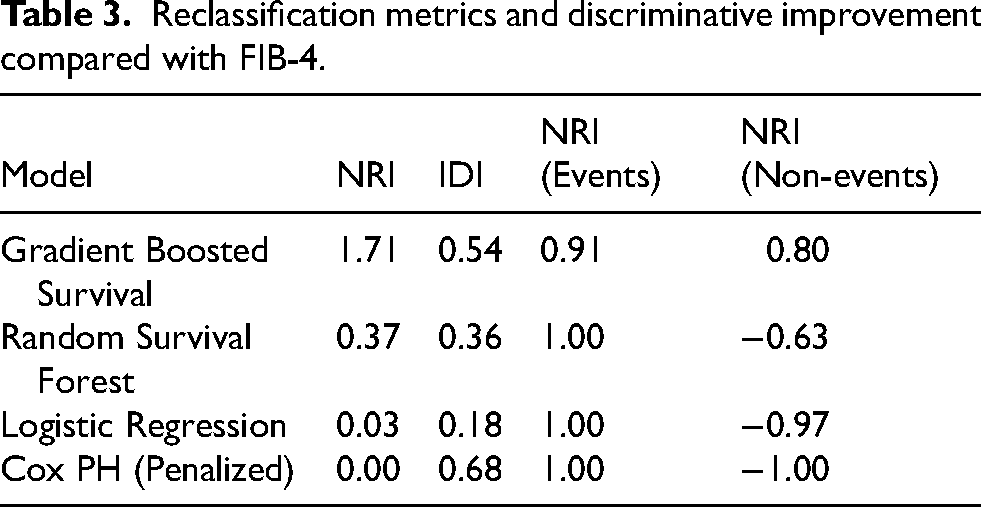
The gradient-boosted survival model had the largest NRI (1.71) and a substantial IDI (0.54) relative to the FIB-4 score. In decision-curve analysis, this model showed higher net benefit across the evaluated threshold probabilities compared with the other models and the treat-all strategy (Table 3). The apparent ROC curves from the final full-dataset refit models are shown in Supplemental Figure 1.
Reclassification metrics and discriminative improvement compared with FIB-4.
Discussion
Summary of findings
In this longitudinal study of adults with MASLD, we identified distinct demographic and clinical profiles between obese and non-obese phenotypes. Internal validation showed modest discrimination across models, with some machine-learning approaches demonstrating favorable calibration and clinical utility. The gradient-boosted survival model demonstrated favorable apparent calibration and clinical utility in exploratory downstream analyses. Metabolic and anthropometric features, particularly waist circumference, diabetes, BMI, and age, emerged consistently as the most important predictors of dementia-related mortality risk among the NHANES III population with MASLD. Exploratory risk stratification using the final refitted gradient-boosted model classified all observed dementia-related deaths within the high-risk group. Decision-curve and reclassification analyses suggested potential clinical utility beyond FIB-4; however, these downstream findings should be interpreted cautiously in light of the modest internally validated discrimination, low event count, and potential overfitting.
Liver-brain axis
Our findings align with existing literature showing that metabolic and vascular derangements carry cognitive consequences and that composite models can capture additive risk beyond single biomarkers. 13 Neuroinflammation has been proposed as one potential mechanism linking liver dysfunction and neurodegenerative outcomes, and is characterized by microglial activation and the in situ synthesis of proinflammatory cytokines such as TNF, IL-1β, and IL-6. 14 In MASLD, proinflammatory cytokines may contribute to blood-brain barrier dysfunction allowing exposure to circulating metabolites such as ammonia, lactate, and manganese, which have been implicated in neuroinflammatory responses and neuronal injury. 14 Specifically, elevated ammonia levels promote glutamine buildup in astrocytes, leading to cerebral edema and Alzheimer's type 2 astrocytic morphology. 14 High brain lactate concentrations further correlate with the severity of clinical symptoms and the release of TNF and IL-6 from microglia. 14 In addition, since the liver is the primary site for peripheral amyloid-β (Aβ) metabolism, hepatic dysfunction may lead to imbalanced Aβ clearance, contributing to Alzheimer's disease progression. 14
Obesity
The identification of waist circumference, diabetes, and BMI as primary predictors reflects the importance of these metabolic drivers over liver-specific fibrosis markers like FIB-4. In obesity, expanded visceral fat depots secrete adipokines and pro-inflammatory cytokines promoting neuroinflammation. 15 Insulin resistance, common in MASLD and type 2 diabetes, interferes with neuronal insulin signaling critical for synaptic plasticity and memory, amplifies amyloid-β deposition and tau hyperphosphorylation via IDE competition and GSK-3β dysregulation, and heightens oxidative stress. 16
Implications
MASLD may contribute to neuroinflammatory and vascular pathways through hepatic steatosis, fibrosis, and systemic metabolic dysfunction. Although our predictive models cannot establish causal pathways, the prominence of metabolic and anthropometric predictors is consistent with a broader hypothesis linking visceral adiposity, insulin resistance, dyslipidemia, vascular injury, and neuroinflammatory processes with dementia-related mortality. While strategies targeting ammonia metabolism or systemic inflammation have been explored in related neurological or hepatic contexts, the present findings do not establish whether such interventions would reduce dementia-related mortality in MASLD. Instead, our results suggest that individualized risk stratification may help identify metabolically vulnerable patients who warrant further study in future mechanistic and interventional research.
Limitations and strengths
This study has several important limitations. First, its reliance on NHANES III restricts generalizability to contemporary MASLD populations. Second, the relatively small number of dementia-related deaths compared with the number of candidate predictors and evaluated models raises concerns regarding statistical power, model stability, and overfitting. The discrepancy between modest internally validated performance and substantially higher apparent performance in the final full-dataset refit models further supports cautious interpretation. The ROC curves from the final refit models represent apparent in-sample performance and may overestimate generalizable discrimination, particularly for flexible machine-learning approaches in the setting of a low event count. Accordingly, the cross-validation and bootstrap estimates should be considered the more conservative assessment of model performance. Although internal validation was performed using cross-validation and bootstrap resampling, these procedures cannot fully overcome the limitations imposed by a low event count. The findings should therefore be interpreted as exploratory and hypothesis-generating, and external validation in larger cohorts with more dementia-related mortality events is needed before clinical implementation. Also, notwithstanding that fact that the study assessed for missingness in all candidate predictors before model development, and excluded participants with missing data, there is still a likelihood of missing data due to the retrospective nature the study. In addition, the analysis was based on existing NHANES III and mortality data, limiting causal inferences. The associations between MASLD-related factors and dementia mortality cannot establish causation. Also, models were developed using variables available in NHANES III. Emerging biomarkers, neurocognitive testing, imaging markers, and genetic data were not available and could potentially improve predictive performance.
The observation that participants with subsequent dementia-related mortality were younger at baseline than those without dementia-related mortality should also be interpreted cautiously. This comparison reflects age at NHANES assessment rather than age at dementia onset or age at death, and therefore does not imply that dementia-related mortality occurred at younger ages. One possible explanation is that participants who later experienced dementia-related mortality had a higher burden of adverse metabolic features at baseline, including diabetes, higher BMI, greater waist circumference, higher fasting glucose, and higher triglyceride levels. Prior studies have linked midlife metabolic dysfunction, obesity, and diabetes with later dementia risk, supporting the possibility that earlier metabolic risk burden may contribute to subsequent neurodegenerative vulnerability.17–19 However, given the small number of dementia-related deaths and the potential influence of competing mortality and selective survival, this finding should be considered exploratory. Also, although NHANES is nationally representative of the United States, findings may not be generalized to non-U.S. populations or healthcare systems with different demographic and metabolic risk profiles.
Notwithstanding the aforementioned limitations, the study has several notable strengths. It leverages a large, nationally representative U.S. cohort with long-term mortality follow-up, enabling examination of dementia mortality over nearly two decades. The inclusion of multiple survival-modeling frameworks offers methodological triangulation and provides consistent identification of metabolic predictors. Internal validation through both 5-fold cross-validation and 200-iteration bootstrapping helped mitigate overfitting concerns. The study also evaluated clinical utility using decision-curve analysis and systematically quantifies reclassification metrics offering insight into potential improvements over existing clinical markers. Together, these elements provide a solid foundation for future work, particularly external validation in modern MASLD cohorts and refinement of model calibration and generalizability.
Conclusion
In this nationally representative MASLD cohort, survival-based machine-learning models demonstrated the potential to identify individuals at elevated risk for dementia-related mortality, with metabolic factors such as waist circumference, diabetes, BMI, and age emerging as the strongest predictors. Although internal validation supported moderate discriminative performance, the low event rate, reliance on historical NHANES III data, and evidence of overfitting underscore the need for cautious interpretation. The study nonetheless highlights the promise of modern survival-modeling approaches for dementia-risk estimation in metabolically vulnerable populations. Future research should focus on external validation in contemporary cohorts, improved calibration, and integration of neurological, genetic, and social determinants to develop clinically reliable prediction tools.
Supplemental Material
sj-docx-1-alr-10.1177_25424823261465039 - Supplemental material for Prediction of dementia-related mortality in metabolic dysfunction-associated steatotic liver disease using survival machine-learning models
Supplemental material, sj-docx-1-alr-10.1177_25424823261465039 for Prediction of dementia-related mortality in metabolic dysfunction-associated steatotic liver disease using survival machine-learning models by Basile Njei, Sarpong Boateng, Solomon Gyabaah, Guy Loic Nguefang Tchoukeu, Yazan Al-Ajlouni and Ulrick Sidney Kanmounye in Journal of Alzheimer's Disease Reports
Footnotes
Acknowledgements
No external assistance was sought or received for the design, execution, analysis, or reporting of this study.
ORCID iDs
Ethical considerations
This study used publicly available, de-identified data from NHANES III with linked mortality follow-up. In accordance with applicable policies for publicly available de-identified datasets, formal institutional review board approval was not required for this secondary analysis.
Author contribution(s)
Funding
The authors received no financial support for the research, authorship, and/or publication of this article.
Declaration of conflicting interests
The authors declared no potential conflicts of interest with respect to the research, authorship, and/or publication of this article.
Data availability statement
The data underlying this study are publicly available through NHANES, a nationally representative survey of the non-institutionalized U.S. civilian population conducted by the National Center for Health Statistics using a complex, multistage, stratified probability sampling design. NHANES data are available at: ![]() .
.
Supplemental material
Supplemental material for this article is available online.
References
Supplementary Material
Please find the following supplemental material available below.
For Open Access articles published under a Creative Commons License, all supplemental material carries the same license as the article it is associated with.
For non-Open Access articles published, all supplemental material carries a non-exclusive license, and permission requests for re-use of supplemental material or any part of supplemental material shall be sent directly to the copyright owner as specified in the copyright notice associated with the article.