
Abstract
Introduction:
Edibles have become the second-most used cannabis product in legal U.S. states, wherein 64% of cannabis consumers reported using edibles within the past year. Among expansions to the legal cannabis industry are the newly marketed “fast-acting” edible compounds, which may address many of the issues associated with edible use related to overdose and dose management. The study hypotheses were that fast-acting edibles would reach peak concentration significantly faster than standard edibles and placebo edibles.
Materials and Methods:
Twenty participants completed three arms within-subjects designed study to test hypotheses. The three arms were ingestion of a (1) fast-acting edible, (2) a standard edible, and (3) a Δ9-tetrahydrocannabinol (THC) terpene-derived placebo edible that was indistinguishable from the two THC-containing edibles. Blood plasma was analyzed for the presence of THC and THC analytes. The pharmacokinetic parameters tested were time to max concentration (Tmax), maximum concentration (Cmax), terminal half-life (t1/2), and area under the curve (AUC).
Results:
Results supported study hypotheses in that Tmax was significantly faster for the fast-acting edible, observed 30 min post-ingestion and, on average, 30 min earlier than the Tmax for the standard edible. There were no significant differences between the fast-acting and standard edibles on Cmax, t1/2, and AUC; however, both the fast-acting and standard edibles were significantly different compared with the placebo across all pharmacokinetic parameters.
Discussion:
The results indicate that the microencapsulation technology used to create the fast-acting edible enabled analyte concentrations to peak significantly faster compared to the standard and placebo edibles.
Introduction
While smoking dried flower remains the most common cannabis use method in the United States, cannabis edible use has increased in prevalence.1,2 Edibles have become the second-most used cannabis product in legal U.S. markets, wherein 64% of cannabis consumers reported using edibles within the past year. 3 Reflective of a broader shift in consumer preferences following legalization, the rise in edible consumption may be influenced by wider product availability, decreased social stigma, improved marketing, and the appeal of cannabis use without harms associated with smoking.4,5
Emerging evidence supports the therapeutic potential of cannabis, yet research remains in its nascent stage with significant gaps in foundational pharmacokinetic properties of different cannabis preparations. 6 Edibles present the most significant challenge when it comes to accurate dosing and are linked to a higher incidence of adverse effects resulting from both unintentional overconsumption and accidental ingestion.7–9 Evidence indicates that emergency service presentations for cannabis toxicity have nearly doubled postlegalization, wherein severe cases may present with hallucinations, psychosis, central nervous system depression, bradycardia, dysrhythmias, and in pediatric cases, coma, seizures, and respiratory depression. 7 Delayed onset of intoxication with edible cannabis is a potential risk factor for overconsumption, as individuals may increase their dose before experiencing initial effects. 10 Relatedly, the way that Δ9-tetrahydrocannabinol (THC) is prepared for ingestion (i.e., method of administration, formulation of cannabinoids) can impact the onset and intensity of intoxication, further complicating the individual’s ability to anticipate ideal dosing.11,12
Among expansions to the legal cannabis industry are the marketed “fast-acting” edible compounds.13–16 However, it is unclear if products marketed as fast-acting genuinely result in a quicker intoxication onset and how they differ from standard THC edibles pharmacokinetically. This gap in the literature is concerning given increasing availability of fast-acting edibles and their potential to influence consumer behavior and public health outcomes. The present study aimed to systematically compare the pharmacokinetic properties of THC analytes in a standard, fast-acting, and placebo edible using a randomized, placebo-controlled, three-way counterbalanced crossover observational study. We hypothesized that time to peak concentration for each of the analytes would be significantly faster for the fast-acting edible compared with the standard and placebo edibles. In addition, we hypothesized that maximum concentration, terminal half-life, and area under the curve would be significantly higher comparing fast-acting and standard edibles to the placebo edible.
Materials and Methods
Participants
Participants were recruited through weekly Craigslist and Reddit ads and flyers posted around campus and within local businesses, including cannabis dispensaries. Potential participants underwent eligibility screening. Inclusion and exclusion criteria were having a history of cannabis use within the past 60 days at least two times per week and having used a cannabis edible in the past year, not taking medications known to interact with cannabis, no serious medical conditions, an age range of 21–65, willingness to fast from consuming food or drink for 8 h prior to data collection, willingness to have an intravenous port placed and have blood drawn, and no history of suicidal ideation, self-harm, or psychiatric diagnoses. The final sample consisted of 20 participants who completed three mobile laboratory sessions (see Fig. 1 for a CONSORT diagram). Descriptive statistics are provided in Table 1. This study had institutional review board (IRB) approval from the Colorado State University IRB. All participants completed informed consent prior to participating in this study.
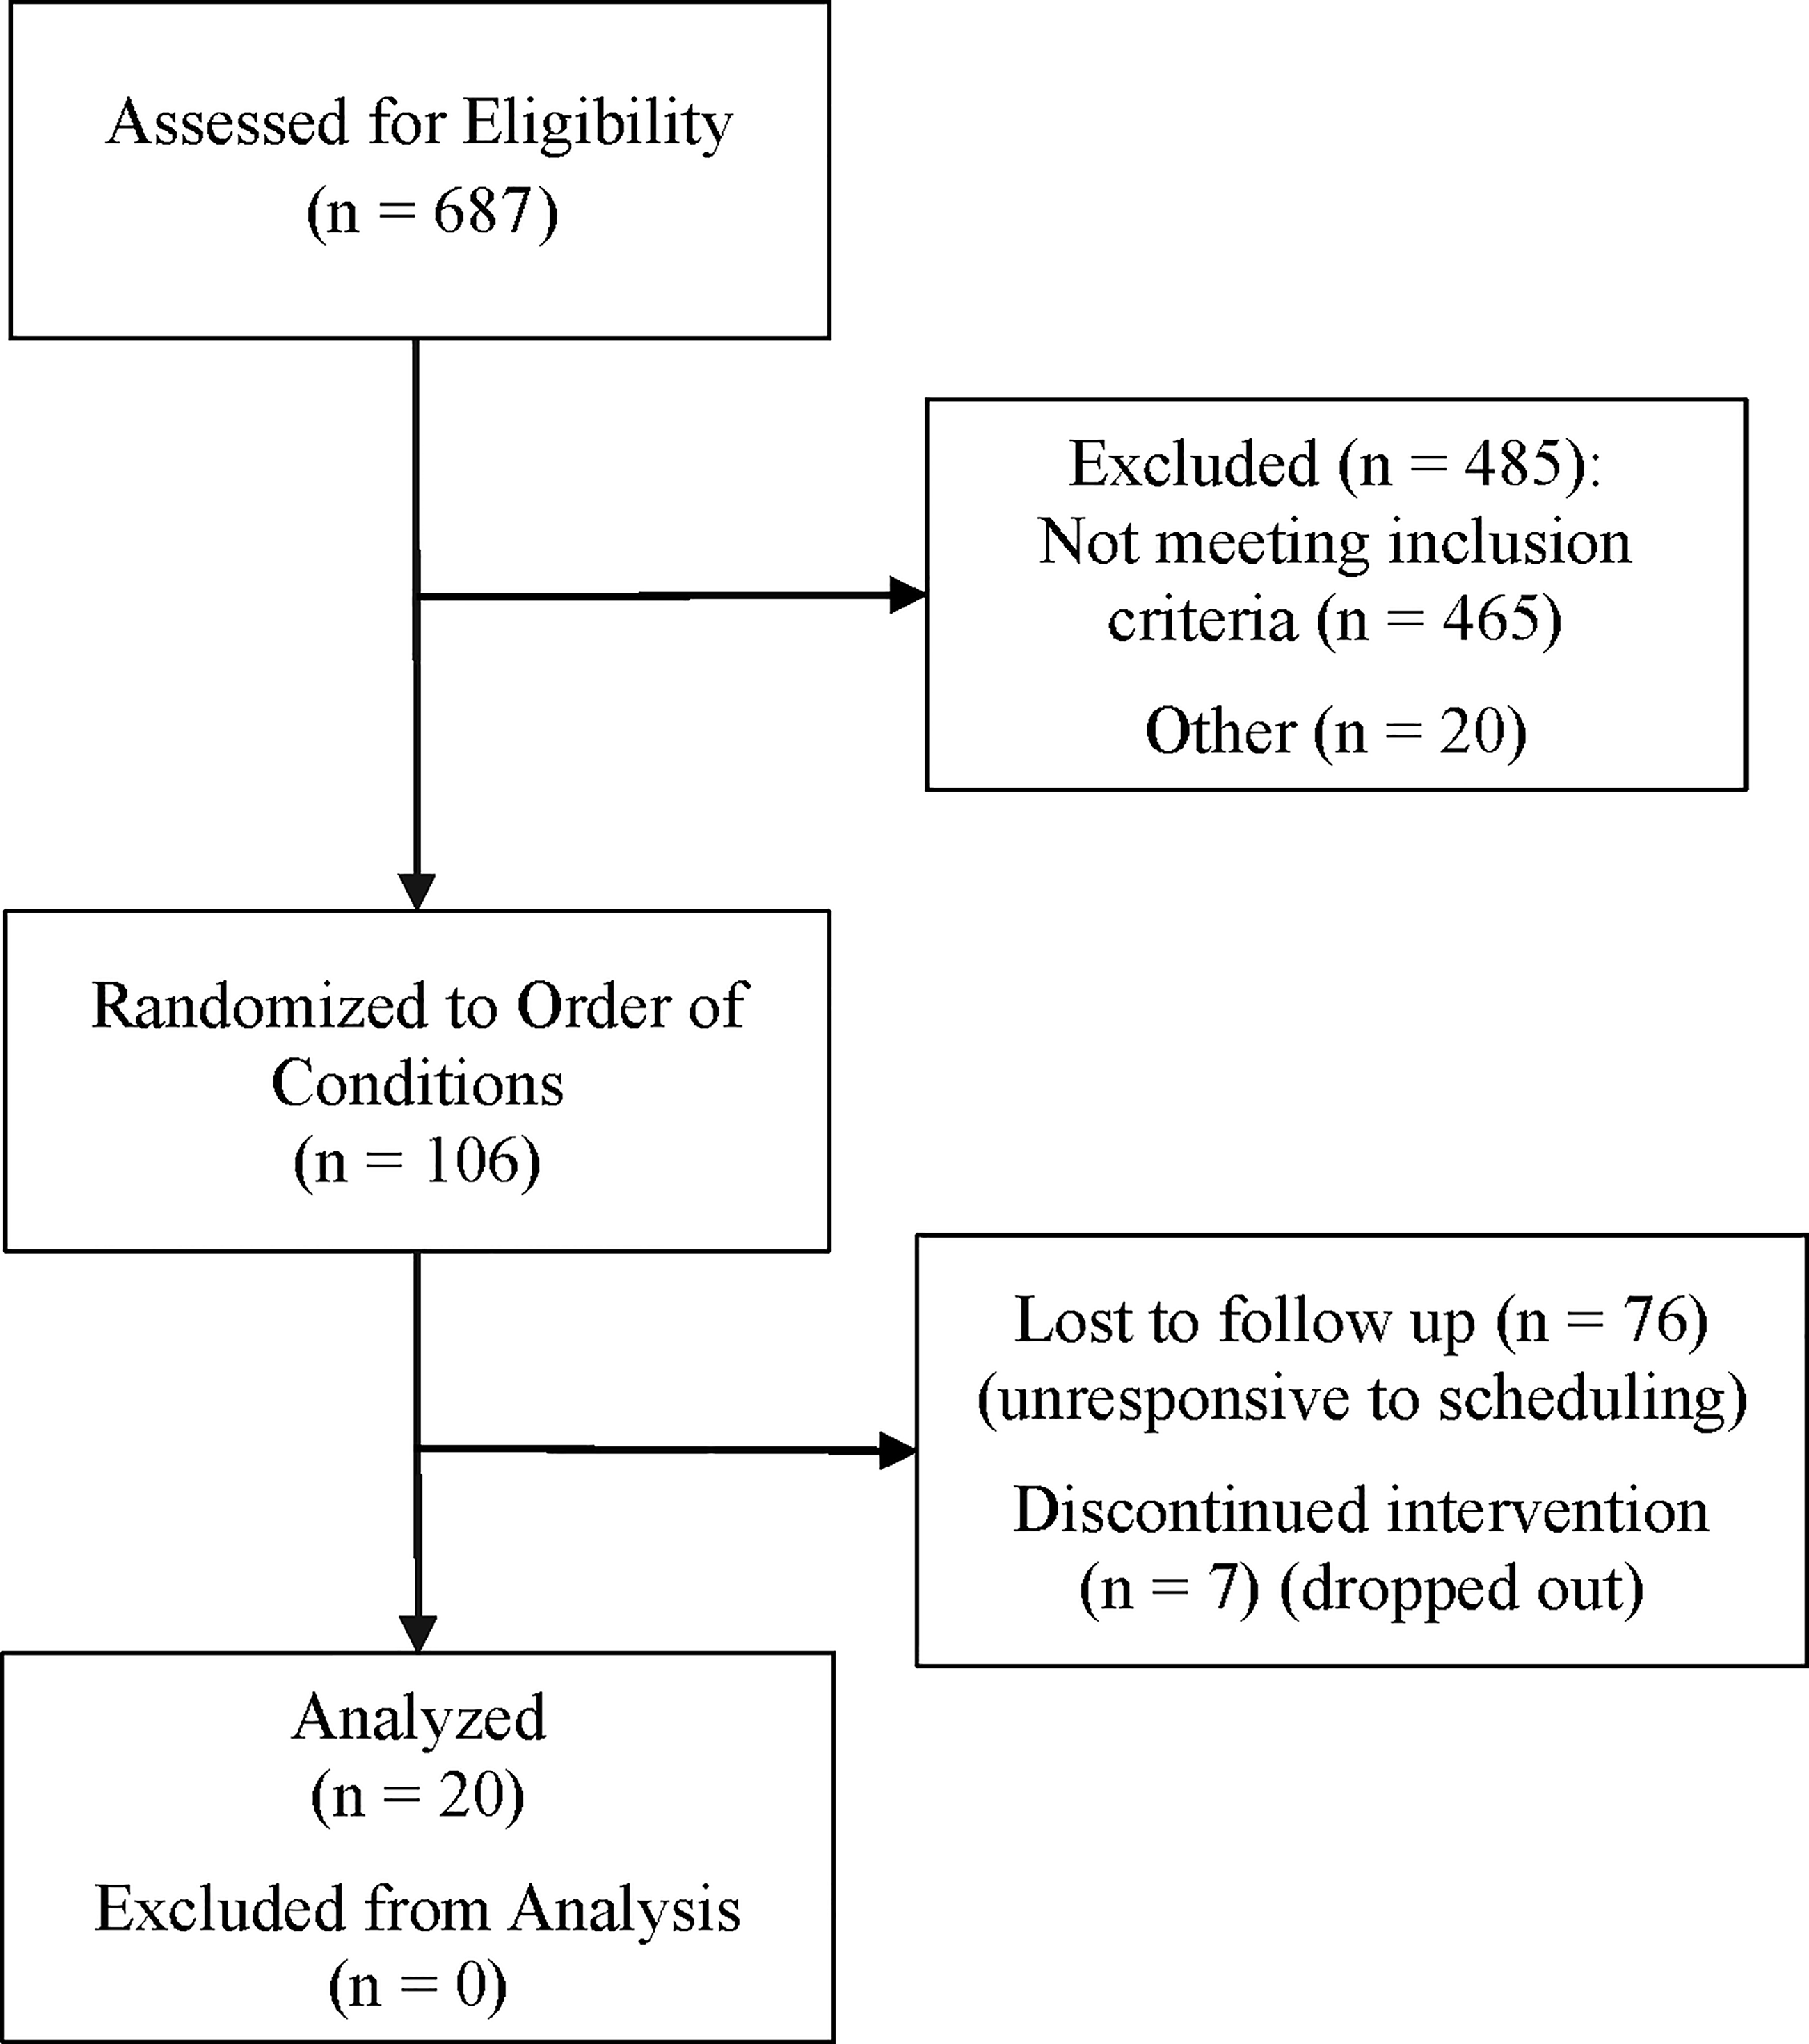
A consort diagram detailing recruitment and randomization to order of participants in our study.
Demographic Statistics for Study Participants
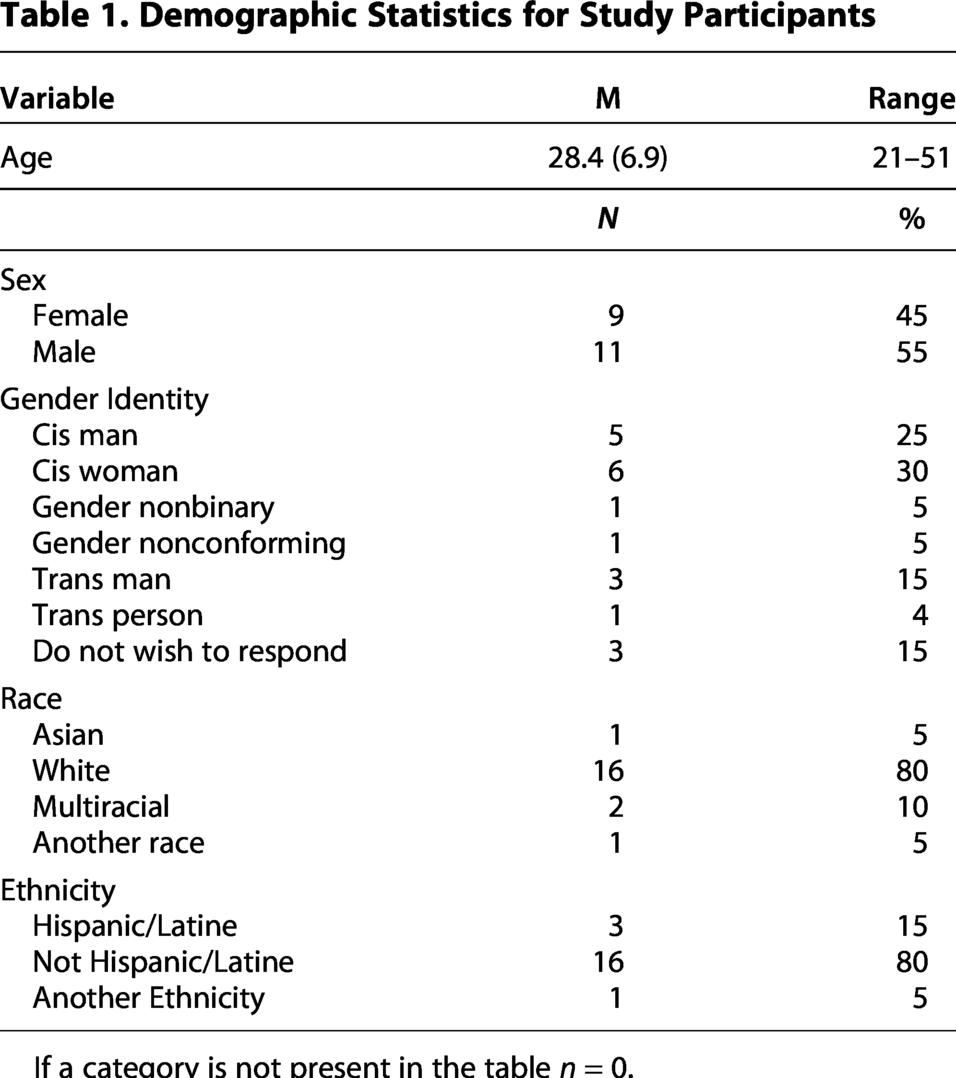
If a category is not present in the table n = 0.
Study product
Study products were developed specifically for the present study by Wana Brands, LLC., a licensed cannabinoid product manufacturer, and Azuca Inc., a cannabis technology company that develops fast-acting cannabis products. The edibles were all produced using identical ingredients, including natural flavoring, colors, and excipients (e.g., sugar, tapioca syrup, pectin, natural flavors, and colors). The two THC-containing edibles were formulated to deliver a dose of 10 mg of THC per edible. The first active edible included traditional THC distillate, while the second active edible included THC distillate that was microencapsulated using a patented formulation from Azuca Inc., to potentially accelerate its release and bioavailability. A corresponding placebo edible, identical in appearance, texture, and flavor was also produced by Wana Brands, LLC. The placebo edible included an addition of “Lime Skunk” THC-derived terpenes, mimicking the flavor of cannabis in the THC-containing edibles without including any cannabinoids, to ensure the participants could not distinguish the THC-containing edibles from the placebo edible.
All edibles were manufactured under Good Manufacturing Practice-compliant conditions to ensure quality and consistency. Representative samples from each production were independently analyzed for cannabinoid content by a third-party laboratory using a validated high-performance liquid chromatography (HPLC) method. This analysis verified that the THC-containing edibles contained the intended cannabinoid dose within a ± 10% variance, while confirming that placebo edibles did not contain detectable cannabinoids.
Blinding
The edibles were individually packaged in identical, opaque, sealed packets and were labeled with a condition code not shared with the researchers or participants, double-blinding the study. The condition code was covered with opaque tape. The code key was maintained by Wana Brands, LLC, and was not shared with researchers until after data analysis was completed. Each edible was packaged with a label describing strain and cannabinoid content to conform with Colorado labeling regulations. The blinded study edibles were transferred to a commercial cannabis dispensary, and participants used randomly generated participant IDs to purchase study products from the dispensary. Colorado law prohibits gifting cannabis from a dispensary, so participants paid $0.30 for study edibles. Prior to the first administration session, participants brought all edibles to the mobile laboratory, separated the edibles from the packaging, and mixed the edibles so that they and the researchers did not know which edibles came from which packaging, and removed the tape covering the condition label.
Product formulation
Conventional cannabis edibles typically contain extracted cannabinoids, primarily THC. When ingested, THC is processed through the digestive system and undergoes first-pass metabolism in the intestine and liver prior to entering systemic circulation. 17 Through this process, THC is converted to 11-hydroxy-Δ9-THC (THC-OH), which is further oxidized to 11-carboxy-Δ9-THC (THC-COOH). 18 This process results in low oral bioavailability, delayed onset of effects, and prolonged duration of action.19,20
Microencapsulation technology, such as the formulation from Azuca, Inc. used in this study, involves enclosing small particles of active substances, such as THC, with a protective coating. This encapsulation process often involves materials such as polysaccharides, proteins, or lipids. Microencapsulates can be engineered to protect active ingredients from enzymatic degradation in the gastrointestinal tract, enhance solubility, and regulate the release of these compounds, thereby improving absorption and increasing bioavailability upon consumption. 21 This class of technology offers several advantages for cannabis edible formulations by potentially enhancing bioavailability, providing faster onset effects, and allowing for more predictable dosing experiences.21–23 Recent studies have shown promising results for microencapsulated cannabis formulations. 24
Study procedures
Prior to scheduling in-person sessions, eligible participants were asked to complete a baseline survey that captured cannabis use patterns and allowed participants to choose one of four meal options. Participants were scheduled for their three in-person sessions and were given instructions to (a) pick up study edibles from a local dispensary, (b) abstain from cannabis use 4 days prior to administration sessions, and (c) abstain from food and beverage intake other than water 8 h prior to the administration session.
Administration sessions were conducted in a federally compliant mobile laboratory. 25 The use of the mobile laboratory allowed researchers to bypass Colorado’s current residency restrictions that create barriers to observational and administration studies in controlled laboratory settings. On administration day, researchers parked the mobile lab outside the participants’ residence. Participants were provided with a 10-panel drug urinalysis to confirm eligibility and were provided with their selected meal to standardize fat content intake within and between subjects. Meal options were chosen based on being 400 calories and consisting of low-fat content, to address cannabis’ lipid solubility, while accounting for a variety of dietary restrictions (i.e., dairy-free, gluten-free, shellfish-free, vegetarian).
Participants completed baseline measures while the Project Director (PD) implemented phlebotomy by placing an IV port (i.e., canula or venous catheter) in the right or left arm. Six participants (n = 6) were excluded due to difficulties with phlebotomy. Each participant was administered 1 L of saline throughout each session to prevent blood clotting within the port. Baseline blood samples were collected at the beginning of each administration session prior to self-administration of the edible. Participants then would return to their place of residence while maintaining contact with researchers over Zoom to consume the study edibles. 26 Researchers collected blood samples at 5-, 10-, 15-, 30-, 60-, 90-, 120-, 180-, 210-, 240-, and 270-min postingestion.
Blood collection
The PD collected blood samples via the cannulated venipuncture site using a sterile syringe. Immediately upon collection, the PD transferred blood at a 45-degree angle into ethylenediaminetetraacetic acid (EDTA)-treated tubes, gently agitating each sample tube to preserve cellular components and prevent coagulation. Researchers stored samples on ice in an electric-powered cooler in the mobile lab. Immediately following conclusion of the administration session, plasma separation was conducted by centrifuging samples at 2400 rpm for 10 minat 1000 × g, facilitating the stratification of plasma. Researchers pipetted 1000 µL of plasma into a 1 mL glass vial to prevent cannabinoid degradation, 27 then stored all plasma aliquots at −80°C to maintain sample stability and prevent molecular degradation until subsequent cannabinoid analysis. Glass was used as recent research indicates there is less degradation of cannabinoid analytes when plasma is stored in frozen glass containers compared with refrigeration or polypropylene vials.
Cannabinoid analysis by LC−MS/MS
All cannabinoid standards (THC, THC-OH, THC-COOH, Δ9-THC-d3, 11-hydroxy-Δ9-THC-d3, and 11-carboxy-Δ9-THC-d9) were purchased from Cerilliant (Round Rock, TX, USA) with purity >98.7%. Water, methanol, and acetonitrile (LC–MS grade) were purchased from Millipore (Burlington, MA, USA). Formic acid (Liquid chromatography–mass spectrometry [LC−MS] grade) was obtained from Sigma-Aldrich (St. Louis, MO, USA). Captiva EMR-Lipid columns (1 mL, 40 mg) were purchased from Agilent Technologies (Santa Clara, CA, USA). Liquid chromatography columns were purchased from Restek Inc. (Bellefonte, PA, USA).
Matrix-matched calibrators and controls were prepared by the addition of appropriate volumes of methanolic stock standard mixtures (0.01, 0.1,1.0, or 10 µg/mL of each cannabinoid) to 100 µL of cannabinoid-free plasma to produce calibrators at 0.5, 1, 5, 10, 50, 100, and 500 ng/mL. The final concentration of methanol in the calibration standards was either 5% or 10% depending on the spiked concentration. Quality control samples were prepared at 5 ng/mL and were run after every 20 samples, with an expected accuracy of ±20%. This method was previously validated following guidelines recommended by the ANSI/ASB Standard 036 Standard Practices for Method Validation in Forensic Toxicology. Acceptable accuracy was ±20%. 28
Participants’ plasma samples, matrix-matched standards, and quality control samples were prepared for LC−MS/MS analysis by protein precipitation and lipid removal (see Table 2). 10 mL of internal standard solution (0.3 µg/mL Δ9-THC-d3, 0.3 µg/mL 11-hydroxy-Δ9-THC-d3, and 0.8 µg/mL 11-carboxy-Δ9-THC-d9) was added to 100 μL of plasma and vortexed in a polypropylene microcentrifuge tube. 600 μL of ice-cold acetonitrile/methanol (85%/15%) was added dropwise while vortexing to precipitate proteins. Samples were centrifuged at 14,000 rpm and supernatants were transferred to Captiva EMR–Lipid columns for lipid removal. Using a positive-pressure manifold, 3 psi of pressure was applied to elute the samples through the columns. Eluents were collected into clean glass test tubes and dried under nitrogen at 45°C. Eluents were reconstituted in 100 µL of water/methanol (50%/50%) with 0.1% formic acid and transferred to autosampler vials with pulled-point inserts for LC−MS/MS analysis.
LC−MS/MS Ion Transitions Monitored for THC and Its Metabolites in Human Plasma
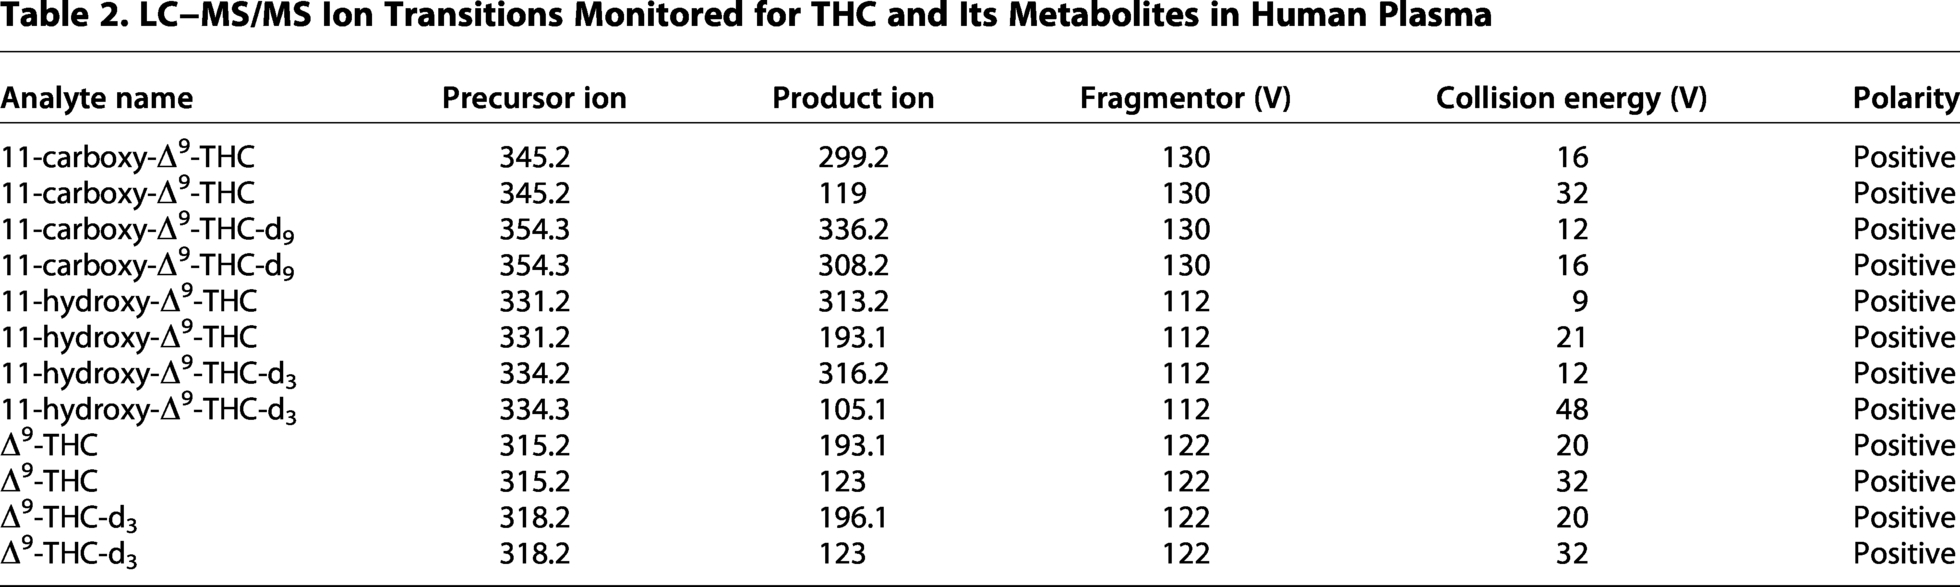
Samples were analyzed with an Agilent 1290 Infinity II liquid chromatograph coupled to an Agilent 6475 triple quadruple mass spectrometer equipped with an Agilent Jet Stream electrospray ionization source (Agilent, Santa Clara, CA). Cannabinoids were chromatographically separated on a Restek Raptor biphenyl column (3.0 × 50 mm, 2.7 μm) and held at 40°C. A sample volume of 10 μL was injected, and a mixture of water with 0.1% formic acid (A) and methanol with 0.1% formic acid (B) was introduced at a flow rate of 0.4 mL/min. Gradient elution started at 40% B, which was increased to 70% B over 1 min and subsequently to 75% B over 3.5 min, and ended at 100% B at 6 min. The ionization source conditions used were positive polarity, nebulizer pressure of 45 psi; gas flow of 12 L/min at 300°C; sheath gas flow of 12 L/min at 375°C; capillary voltage of 3500 V; and nozzle voltage of 2000 V. The ion transitions monitored are displayed in Table 2. Analytes were confirmed by retention time and product ion ratio (±20%) correlation between the sample peaks and corresponding standards. Data collection and processing were performed using Agilent MassHunter quantitative software (v.B.12.01). Quantitation was performed with linear regression using 7-point calibration curves from 0.5 ng/mL to 500 ng/mL for THC, THC-OH, and THC-COOH. The limit of detection was 0.25 ng/ml for all analytes. This method was previously validated following guidelines recommended by the ANSI/ASB Standard 036 Standard Practices for Method Validation in Forensic Toxicology. 28
Pharmacokinetic variables
The following parameters were used to compare pharmacokinetic differences: the maximal concentration of the analyte (Cmax), the time at which the maximal concentration of the analyte was observed in the blood (Tmax), the terminal half-life (t1/2), a continuous assessment of the decay of the analyte to half of Cmax following Tmax, and an area under the assessment of the total concentration of the analyte over time (AUC). Cmax was assessed in ng/mL. Tmax was assessed as the time point at which Cmax was observed over the 12 blood draws, and the median value was used in all analyses. AUC is reported as AUClast, which is the AUC across all timepoints in the study at the last timepoint. Given that cannabis analytes can remain in blood for a prolonged period, prior to any analyses, the analyte value at baseline was subtracted from the analyte at every time point to control for analyte in the blood prior to ingestion of the study edible.
Data analysis
Data analyses were conducted in SPSS 29.0 using data only from participants who completed all three arms of the study (n = 20). Intermittent missing data from these participants were treated as missing per analysis. 29 Noncompartmental pharmacokinetic parameters were calculated using Certara Phoenix WinNonlin v8.5. Given that participants were not randomly selected and that some data violated assumptions of multivariate normality, nonparametric Wilcoxon signed rank tests statistical tests were used to determine significant pair-wise differences between conditions. 30 Alpha was set to 0.05 for all analyses.
Results
Descriptive statistics for pharmacokinetic parameters are presented in Table 3. Figures 2 and 3 depict concentrations of analytes over time by condition. Table 4 presents all study statics for all pairwise comparisons.
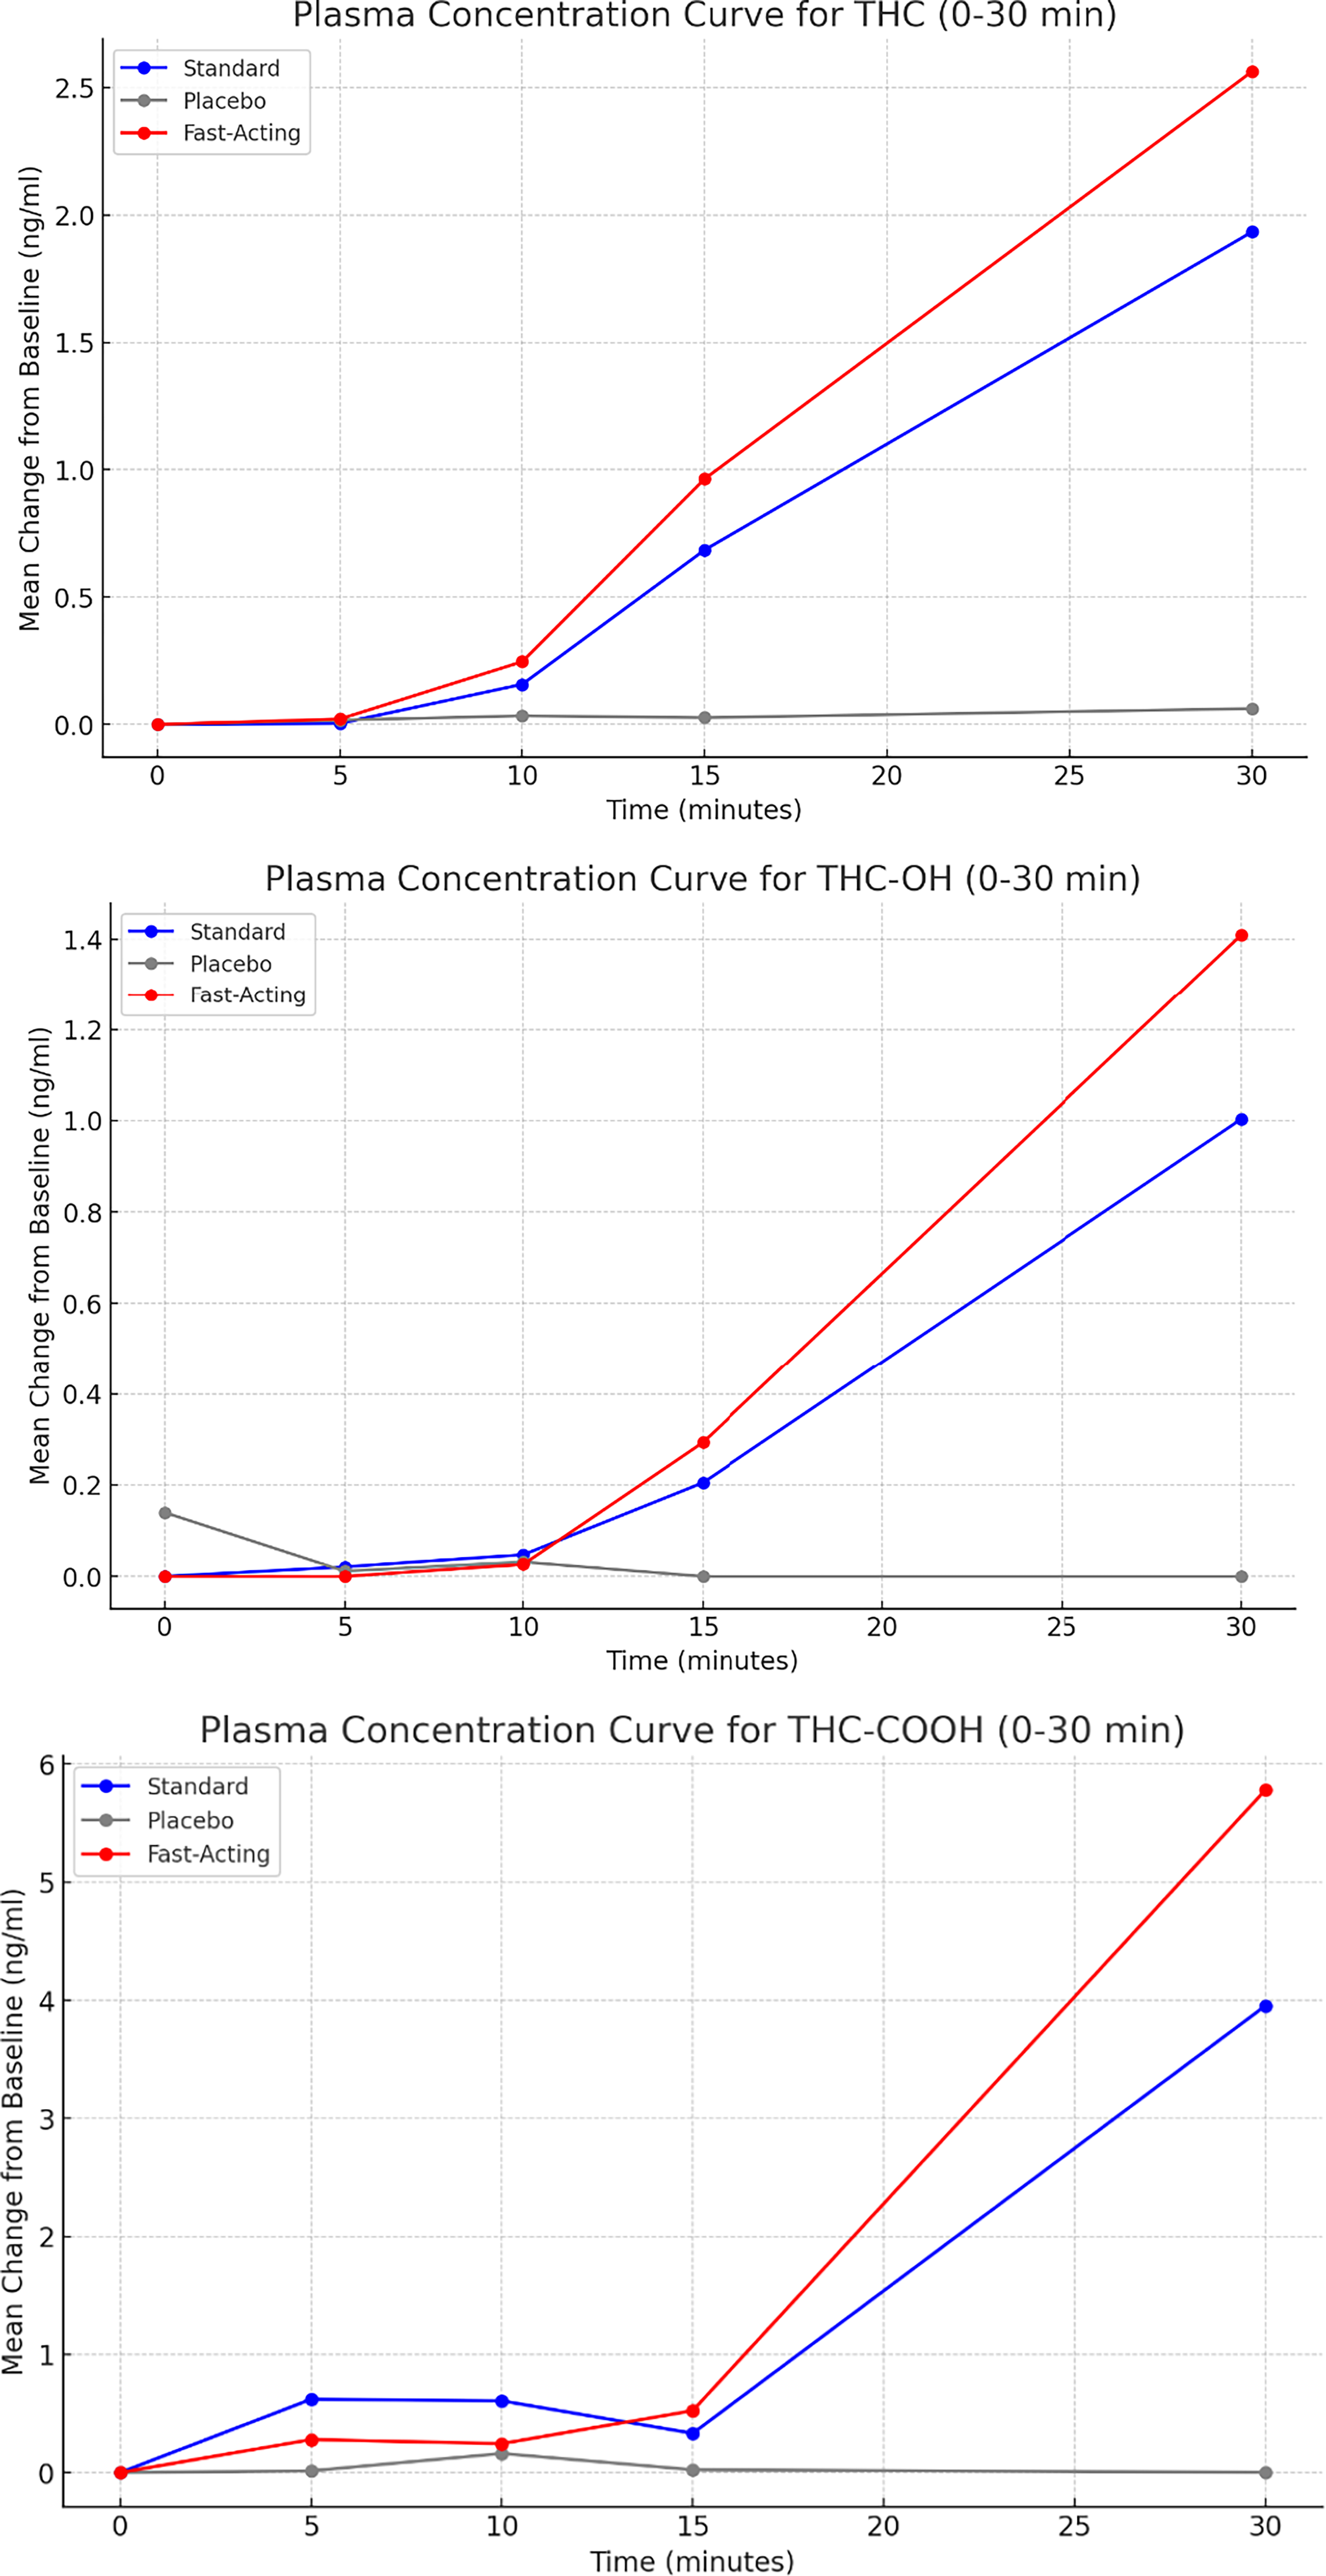
Graphs depicting plasma concentration curves for THC, THC-OH, and THC-COOH for the first 30 min of data collection. THC, Δ9-tetrahydrocannabinol; THC-COOH, 11-carboxy-Δ9-THC; THC-OH, 11-hydroxy-Δ9-THC.
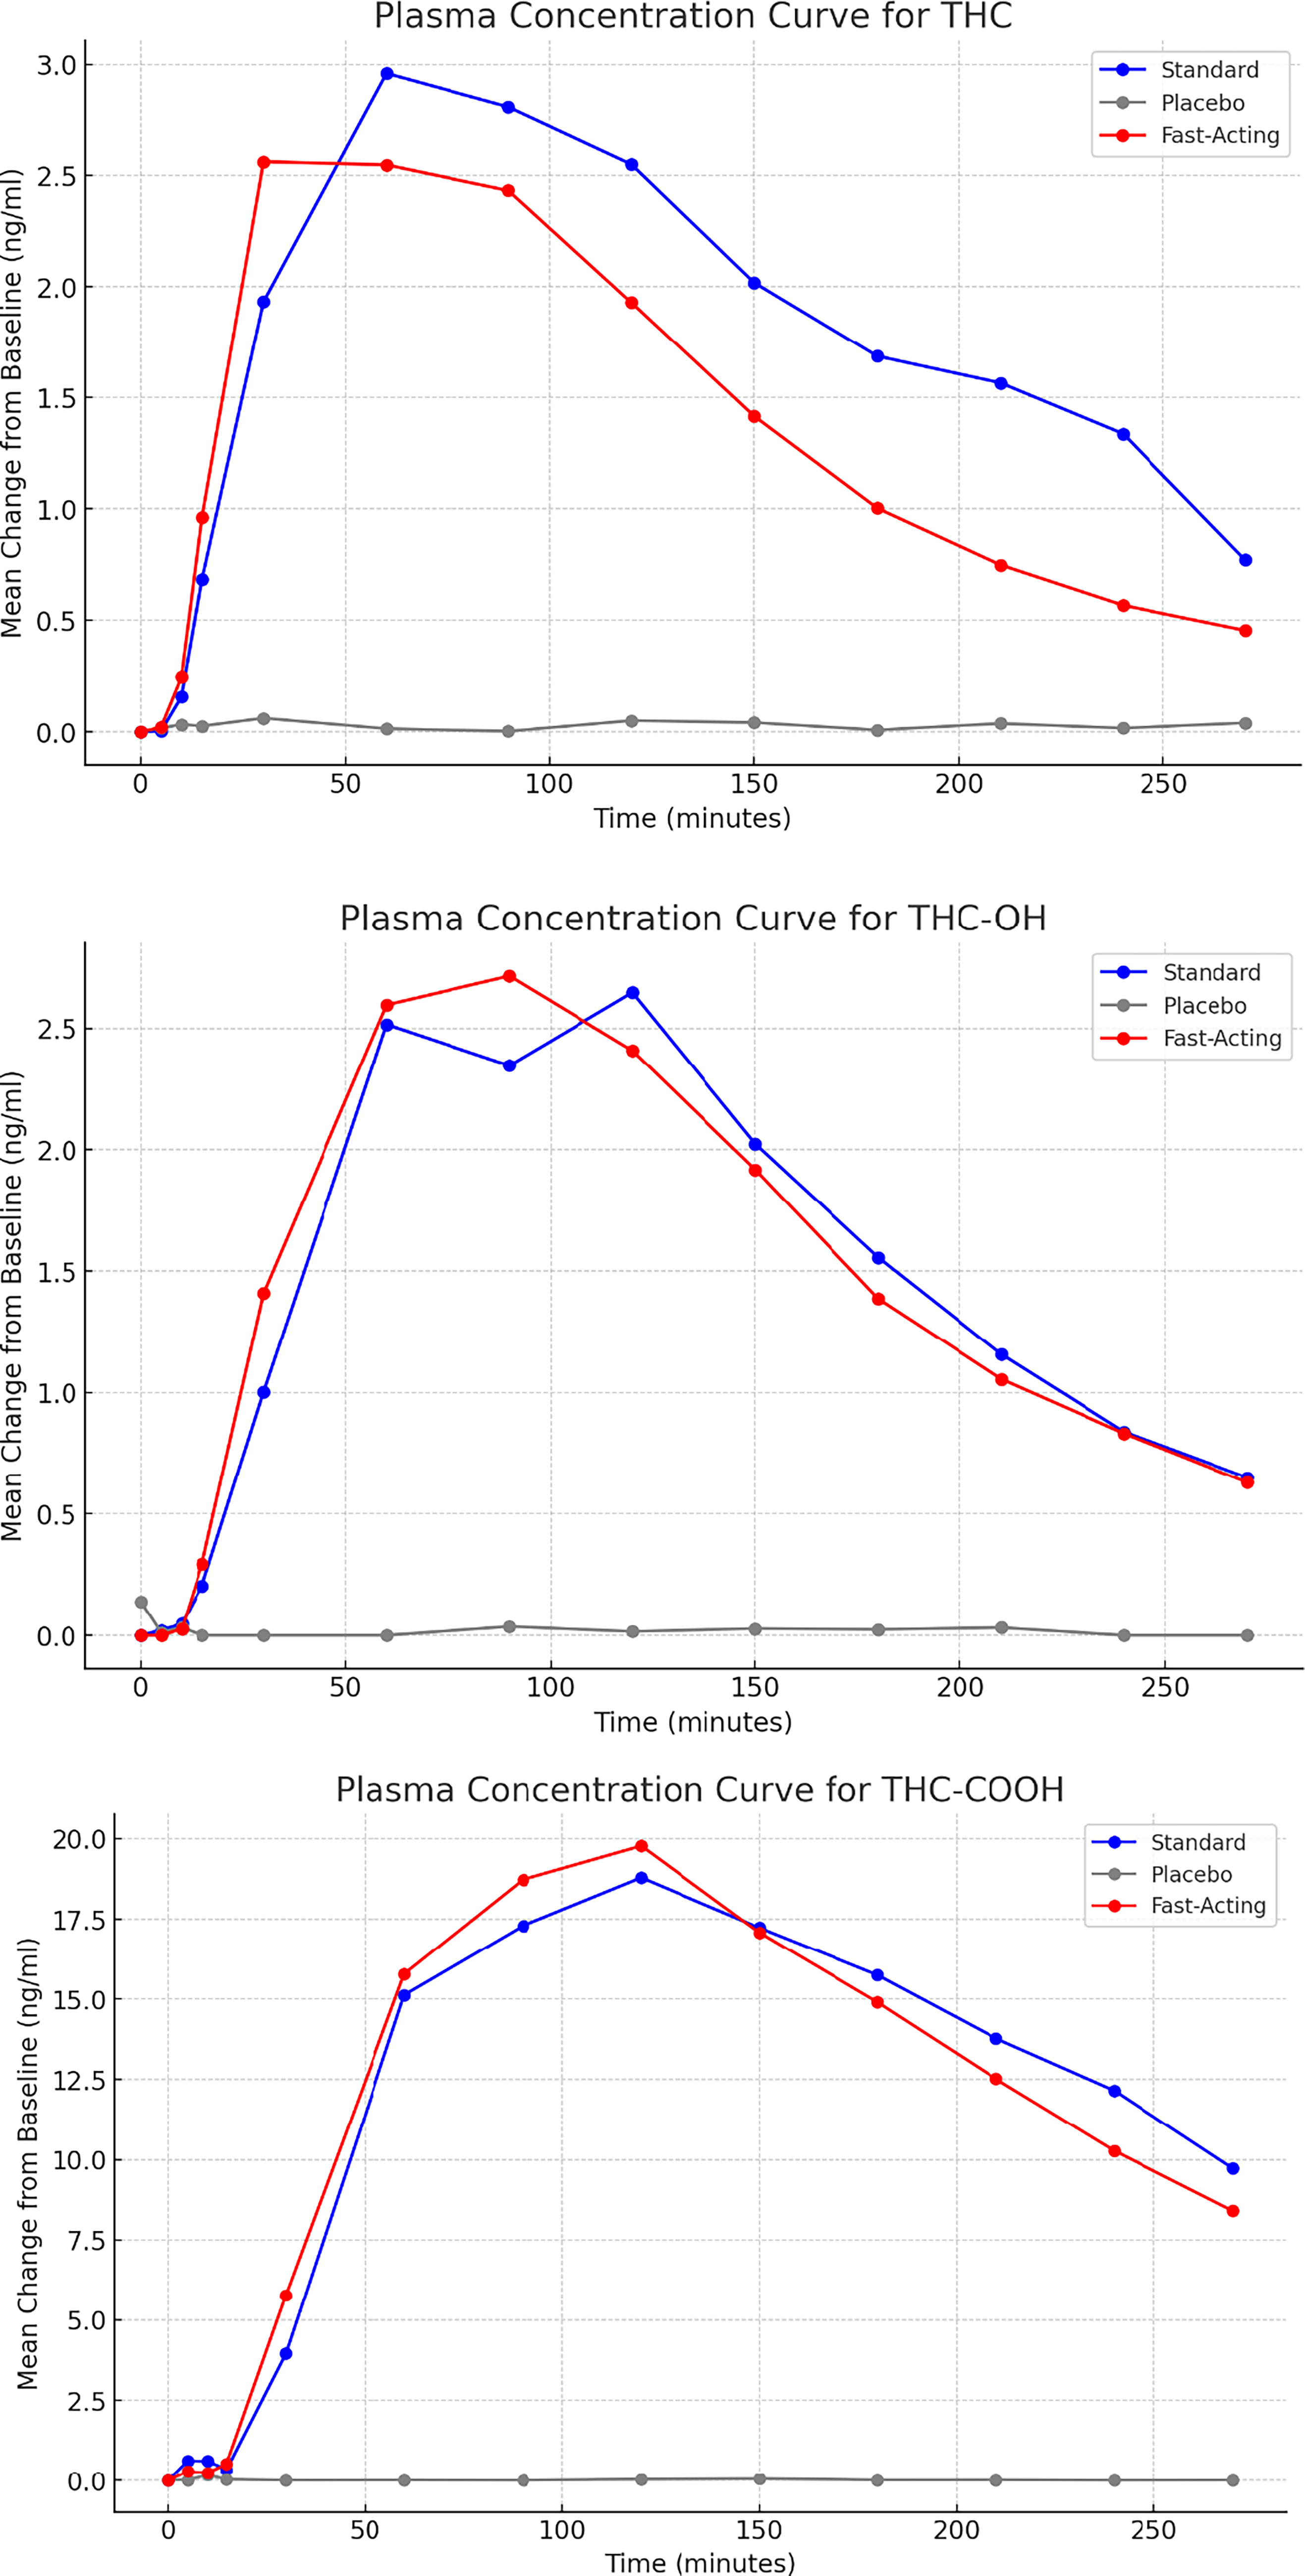
Graphs depicting plasma concentration curves for THC, THC-OH, and THC-COOH for the entire period of data collection.
Descriptive Statistics for the Study Variables
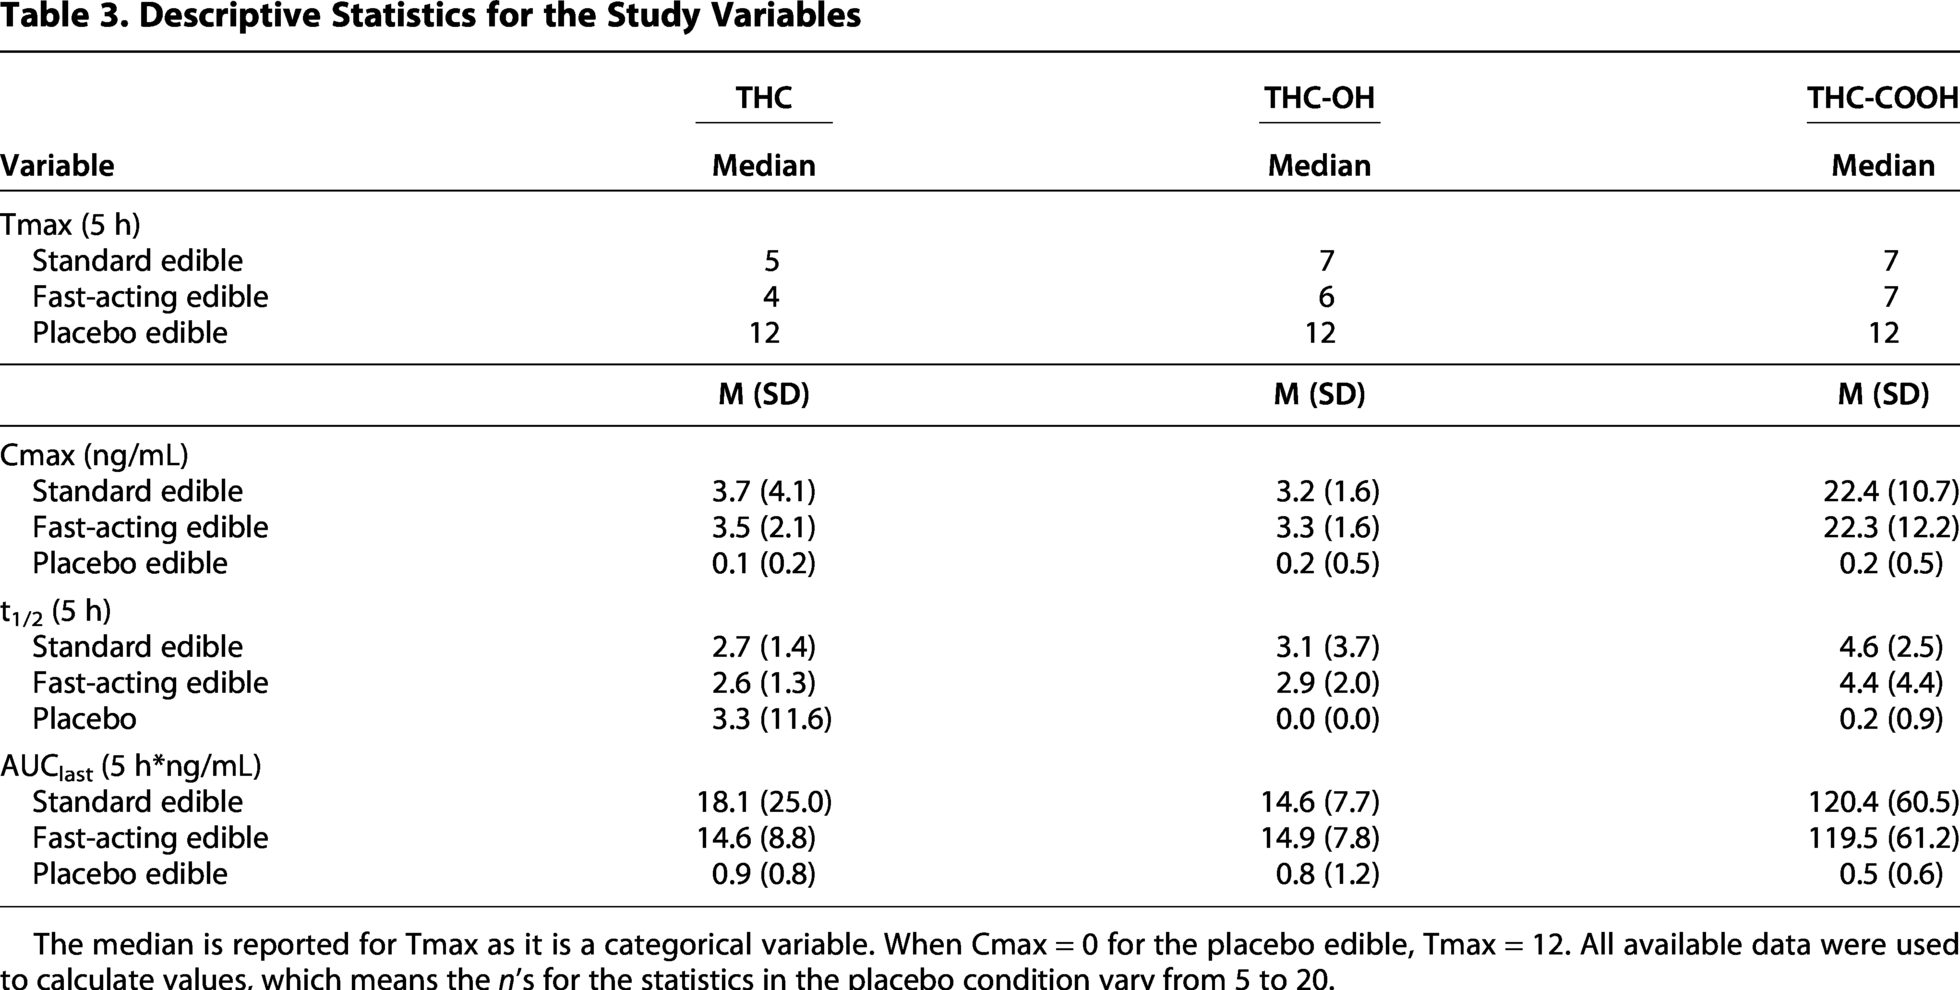
The median is reported for Tmax as it is a categorical variable. When Cmax = 0 for the placebo edible, Tmax = 12. All available data were used to calculate values, which means the n’s for the statistics in the placebo condition vary from 5 to 20.
Results of Statistical Analyses Comparing Analytes by Condition
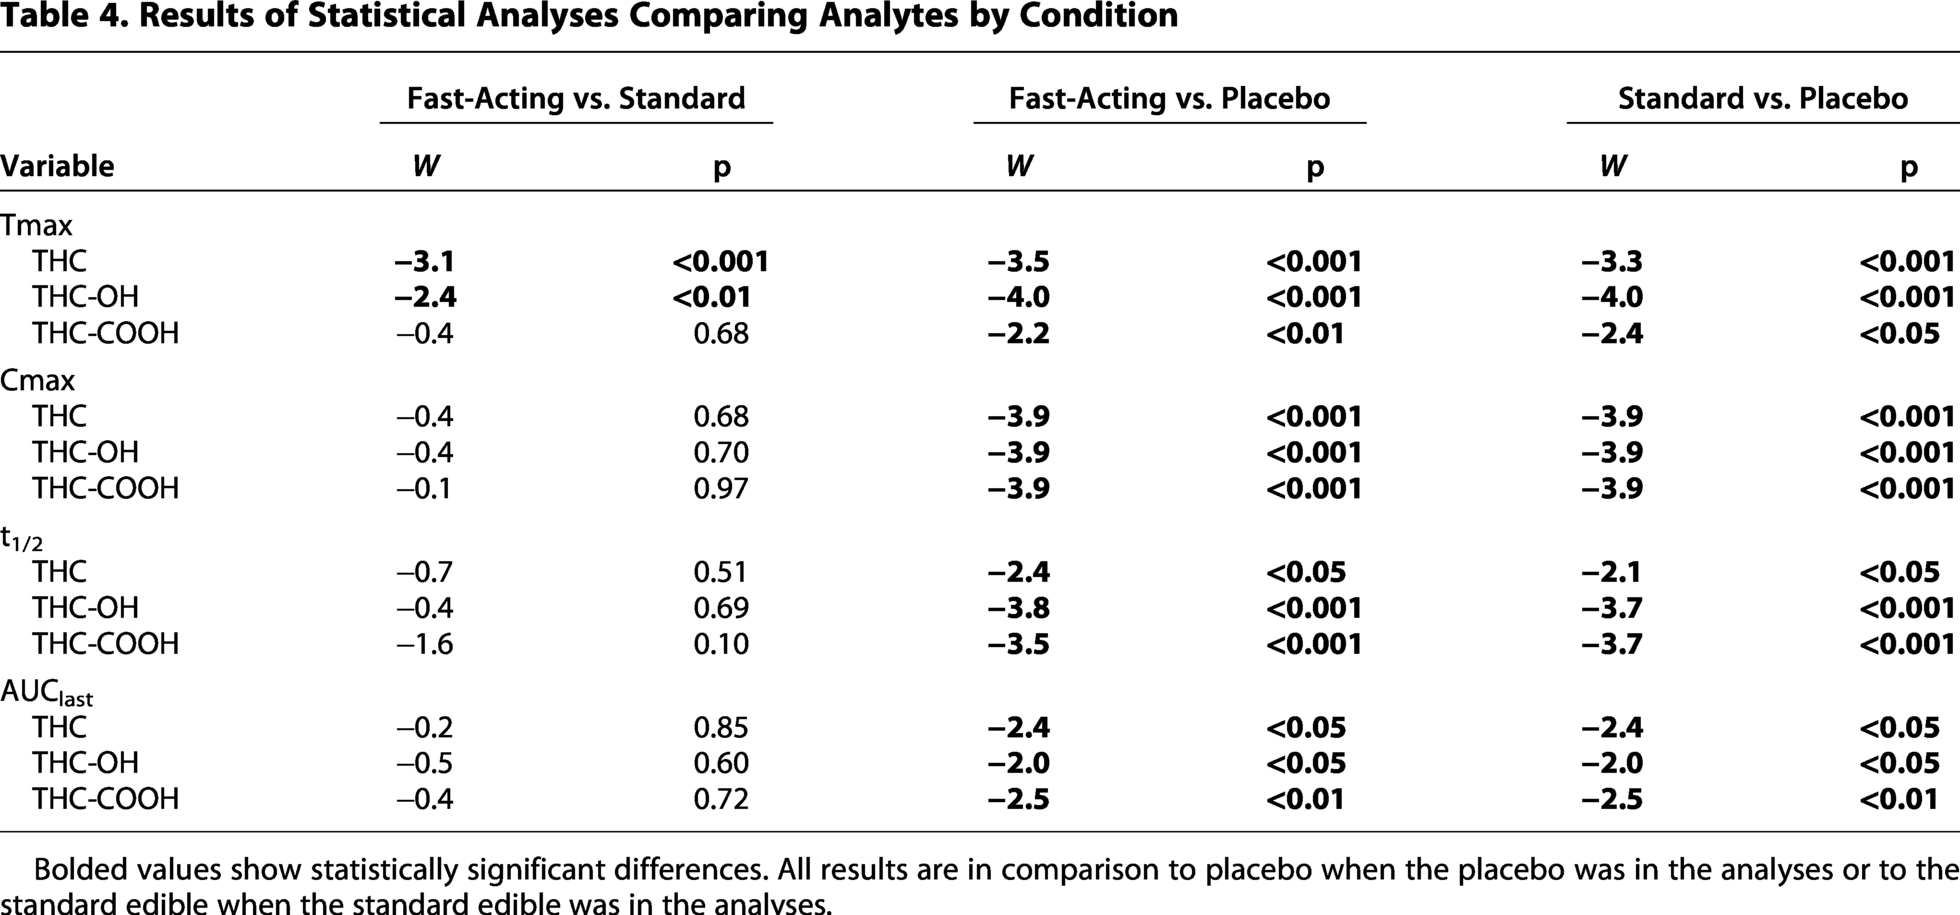
Bolded values show statistically significant differences. All results are in comparison to placebo when the placebo was in the analyses or to the standard edible when the standard edible was in the analyses.
Tmax
THC and THC-OH Tmax were significantly faster for the fast-acting edible compared with the standard edible (W = −3.1, p < 0.001 and W = −2.4, p < 0.01, respectively). The difference between the fast-acting and standard edibles was not significant for THC-COOH (p > 0.05). THC Tmax was significantly faster for the fasting-acting (= −3.5, p < 0.001) and standard edibles (W = −3.3, p < 0.001) compared to the placebo edible. THC-OH was significantly faster for the fast-acting (W = −4.0, p < 0.001) and standard edibles compared to the placebo edible (W = −4.0, p < 0.001). THC-COOH Tmax was significantly faster for the fast-acting (W = −2.2, p < 0.01) and standard edibles compared to the placebo edible (W = −2.4, p < 0.05).
Cmax
Across all analytes, the difference between the fast-acting and standard edibles for THC Cmax was nonsignificant (p > 0.05). THC Cmax was significantly higher for the fast-acting (W = −3.9, p < 0.001) and standard edible compared with placebo (W = −3.9, p < 0.001). THC-OH Cmax was significantly higher for the fast-acting (W = −3.9, p < 0.001) and standard edibles (W = −3.9, p < 0.001) compared to the placebo edible. THC-COOH Cmax was significantly higher for the fast-acting (W = −3.9, p < 0.001) and standard edibles (W = −3.9, p < 0.001) compared with placebo.t1/2
The difference between the fast-acting and standard edibles was nonsignificant across all analytes (p > 0.05). THC t1/2 was significantly longer for the fast-acting (W = −2.4, p < 0.05) and standard edibles (W = −2.1, p < 0.05) compared to the placebo edible. THC-OH t1/2 was significantly longer for the fast-acting (W = −3.8, p < 0.001) and standard edibles (W = −3.7, p < 0.001) compared with the placebo edible. THC-COOH t1/2 was significantly longer for the fast-acting (W = −3.5, p < 0.001) and standard edibles (W = −3.7, p < 0.001) compared with the placebo edible.
AUClast
The difference between the fast-acting and standard edibles was nonsignificant across all analytes (p > 0.05). THC AUClast was significantly higher for the fast-acting (W = −2.4, p < 0.05) and standard edibles (W = −2.1, p < 0.05) compared to the placebo edible. THC-OH AUClast was significantly higher for the fast-acting (W = −2.0, p < 0.05) and standard edibles (W = −2.0, p < 0.05) compared with the placebo edibles. THC-COOH AUClast was significantly higher for the fast-acting (W = −2.5, p < 0.01) and standard edibles (W = −2.5, p < 0.01) compared with the placebo edible.
Discussion
This study was designed to assess the pharmacokinetic properties of a commercially available fast-acting edible compared to a commercially available standard edible and a placebo edible. The placebo edible was designed specifically for this study using THC-derived terpenes so that it was indistinguishable from the edibles containing THC, though it contained <0.3 mg of THC. Results supported that the fast-acting edible reached peak concentration in the blood approximately 30 min faster than the standard edible across 2 of the 3 analytes, THC and THC-OH. We did not predict nor did we see significant differences between the analytes across the pharmacokinetic parameters we assessed between the fast-acting and standard edibles. We predicted and saw significant differences across parameters comparing the fast-acting and standard edibles to the placebo edible. Of interest, while the fast-acting edible reached peak concentration faster than the standard edible, the other parameters were equivalent, indicating that the fast-acting edible lasted as long, had the same total concentrations and equal concentrations in blood plasma as a function of time, as measured by area under the curve.
While this study maximized both internal and external validity by having a true placebo condition in a within-subjects design and using commercially available cannabis edibles purchased by the participant in a retail cannabis dispensary, the results should be interpreted with certain limitations in mind. First, the sample was relatively small, future research should replicate the study findings in larger and more diverse samples. Second, our data indicates that some participants did not abstain from cannabis use completely in the interval between sessions, which may have obscured some of the results. Future research should develop methods for ensuring that participants are abstaining from cannabis use prior to study sessions. In addition, differences in metabolism were not controlled for, other than by using a within-subjects design, and food intake prior to study participation was not controlled though participants were asked to fast for 8 h prior to the study. Future, lab-based research may be able to better control these variables. Finally, this study only looked at objective measures of THC analytes; however, results should be compared with subjective measures of intoxication.
The results indicate that the microencapsulation technology used to create the fast-acting edible enabled analyte concentrations to peak significantly faster compared with standard and placebo edibles. As noted, the delayed onset of intoxication associated with edible cannabis products may be a risk factor for overconsumption, as individuals may increase their dose while waiting to feel the effects. 10 The fast-acting preparation may address issues related to experiences of the onset and intensity of both subjective and objective intoxication, allowing individuals the ability to better anticipate their ideal dose of THC. Future research should investigate whether fast-acting preparations reduce this risk by quickening the time to intoxication, thus reducing the chance of individuals increasing their dose prior to experiencing initial intoxication effects.
Authors’ Contributions
B.T.C. was responsible for studying conceptualization, methodology, statistical analyses, writing, reviewing, and editing. E.E.S. was responsible for data collection, blood collection, processing, and storage, project management, and writing and editing. S.M.D. was responsible for data collection, data processing, and writing. K.L.S. was responsible for participant recruitment and writing. H.C.K. was responsible for the mobile laboratory and writing. G.D. was responsible for cannabinoid analyses and writing. N.A. was responsible for pharmacokinetic analyses and writing. C.V. was responsible for providing the microencapsulating technology, providing funding, and writing. M.H. was responsible for product formulation, providing funding, maintaining study blinding, and writing.
Footnotes
Acknowledgments
The authors wish to thank the participants for participating in this study and the research assistants who helped with data collection and data processing.
Author Disclosure Statement
All authors report no conflicts of interest. C.V. is the Vice President of Commercialization for Azuca, Inc. M.H. is the Vice President for Innovation for WANA Brands, LLC. Prior to the beginning of the study, a data use and data sharing agreement was negotiated among Azuca Inc., Wana Brands, LLC. and Colorado State University, which addressed potential conflicts of interest from the funders and prohibited any such conflicts from impacting dissemination of research study findings.
Funding Information
This project was funded by SRE Wellness, doing business as Azuca, Inc. and the CIMA Group, LLC, doing business as Wana Brands, LLC. H.C.K. is supported by K23AA028238.