
Abstract
Background:
Cannabis plants (Cannabis sativa) contain a diverse group of terpenophenolic compounds known as phytocannabinoids, with 131 cannabinoids identified to date. Rapid and low-cost analytical approaches capable of quantifying both major and minor cannabinoids are increasingly important for research, quality control, and regulatory applications. This study evaluates the patented Absorbance–Transmittance Excitation–Emission Matrix (A-TEEM™) spectroscopic technique as a fast and reliable alternative to conventional chromatographic methods. A-TEEM integrates ultraviolet–visible absorbance and fluorescence measurements while correcting for absorbance-dependent inner-filter effects, enabling linear relationships between fluorescence intensity and analyte concentration. The primary objective was to calibrate and validate machine learning models using A-TEEM data for cannabinoid quantification, benchmarked against a validated high-performance liquid chromatography–photodiode array (HPLC-PDA) reference method.
Materials and Methods:
A total of 49 dry cannabis flower extracts were analyzed using the A-TEEM technique to quantify 14 cannabinoids. Spectral data generated by A-TEEM were directly compared with concentration data obtained from an established and validated HPLC-PDA method. Extreme gradient boosting regression models were developed using HPLC-PDA results as reference values to predict cannabinoid concentrations from A-TEEM spectral data and to evaluate quantitative performance.
Results:
The A-TEEM method demonstrated rapid, robust, and sensitive quantification of all 14 target cannabinoids. Model performance metrics, including coefficients of determination (R2) and limits of detection (LOD) and limits of quantification (LOQ), are scaled proportionally with the maximum cannabinoid concentrations present in the samples. For major cannabinoids exceeding 0.35% concentration, the mean combined cross-validation and validation R2 reached 0.994 ± 0.005, with mean LOD and LOQ values of 0.0146% and 0.0442%, respectively. Cannabinoids present between 0.35% and 0.1% showed mean LOD/LOQ values of 0.00278% and 0.00842%, while minor cannabinoids below 0.1% exhibited even lower LOD/LOQ values of 0.0004% and 0.00128%, respectively. In addition, A-TEEM concentration profiles enabled clear qualitative and quantitative differentiation of three cannabis chemovars: tetrahydrocannabinol (THC)-dominant, cannabidiol (CBD)-dominant, and THC-CBD-intermediate hybrids.
Conclusions:
The A-TEEM technique provides a sensitive, rapid, and cost-effective approach for the qualitative and quantitative determination of both major and minor cannabinoids in solution. Its analytical performance is comparable to that of the reference HPLC-PDA method while offering substantial advantages in speed, simplicity, and suitability for high-throughput analysis.
Introduction
Cannabis has been used for medicinal and recreational practices in indigenous cultures around the world for several millennia. 1 Although cannabinoids are biosynthesized in other plant species and fungi, the term phytocannabinoids refers to the meroterpenoids found only in Cannabis sativa. 2 Their major pharmacological properties are attributed to interactions with cannabinoid receptors (CB1 and CB2) within the endocannabinoid system. 3 However, while the term “cannabinoids” refers to 131 different compounds, Δ9‐tetrahydrocannabinol (Δ9‐THC or simply THC) and cannabidiol (CBD) are the two major ones, biosynthesized by C. sativa.4,5 Acidic cannabinoids, such as Δ9-tetrahydrocannabinolic acid (THCA) and cannabidiolic acid (CBDA), are the primary biosynthesized forms in C. sativa. Upon exposure to heat or prolonged light irradiation, these acidic cannabinoids undergo decarboxylation, resulting in the formation of their corresponding neutral cannabinoids, Δ9-THC and CBD. This process involves the thermal or photochemical removal of a carboxyl group (-COOH) as carbon dioxide and is influenced by temperature, exposure time, and environmental conditions. Decarboxylation commonly occurs during drying, storage, and thermal processing, and it significantly affects cannabinoid composition and analytical quantification. 6
Recently, new chemovars have entered the cannabis market, including cannabigerol (CBG), cannabidivarin (CBDV), and Δ9-tetrahydrocannabivarin (THCV). The traditional THC and CBD chemovars are currently gaining popularity due to their unique properties and potential therapeutic benefits. These emerging chemovars offer new possibilities for medical applications and consumer products, expanding the scope of cannabinoid research and industry innovation.7,8
Most analytical methods for cannabinoids rely on highly specialized and expensive equipment,9,10 including gas chromatography (GC)11,12 coupled with various detection technologies, for example, flame ionization detection and mass spectrometry (MS).13–17 In GC/MS, a standardized electron ionization method is used to fragment analytes, permitting the use of compound libraries for compound identification. Over the past decade, with the advancement of computational tools, MS databases, and various advanced detection technologies, GC has become one of the major tools in forensic and phytochemical analysis of naturally occurring cannabinoids, as well as pharmacokinetic studies. Other methods include liquid chromatography with tandem mass spectrometry (LC-MS/MS).18–22 High-performance liquid chromatography (HPLC) with photodiode array (PDA) detection, 23 high-performance thin layer chromatography, 24 and ultra-performance liquid chromatography. 23
Current chromatographic methods require expert-level operators. A variety of vibrational spectroscopic approaches, such as Raman, near-infrared radiation, and Fourier transform infrared spectroscopy, have been proposed to overcome the limitations of chromatographic measurements; however, they have their own contestants. 25 Fluorescence excitation–emission matrix spectroscopy has the advantage of sensitivity comparable to chromatographic methods, but its primary limitation has been a lack of specificity, largely due to fluorescence inner filter effects (IFEs), which distort the measured fluorescence spectrum in a concentration-dependent manner. 26
To overcome interference from IFE, A-TEEM pairs simultaneous absorbance and fluorescence spectroscopy measurements for fast, precise, and complete sample molecular fingerprinting.
27
Species or samples with high absorbance (or concentration) are more likely to experience IFE interference than samples with low absorbance or concentration.
27
The A-TEEM method for IFE correction requires measuring the absorbance spectrum of the sample inclusively over the range of wavelengths used for excitation and emission. Second, the IFE correction factors (excitation path correction factor [Fex] and emission path correction factor [Fem]) are calculated. Last, the corrected fluorescence intensity is calculated from the following equation:
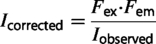
where Aex is the absorbance of the sample at the excitation wavelength, and Aem is the absorbance of the sample at the emission wavelength.
Proper application of IFE correction is subject to the condition that all molecules in solution are within the Beer–Lambert linearity concentration range, which must be evaluated in the context of any application-specific method development; hence, sample dilution is a common practice for A-TEEM analysis. Repeated measures should be conducted to guarantee the reproducibility and reliability of the corrected data.
There are many advantages of the A-TEEM method in terms of speed, low cost per measurement, and potential lab-to-lab placement.
Unlike chromatographic methods such as HPLC or GC, A-TEEM does not involve the physical separation of components, thereby streamlining the analytical process. In addition, A-TEEM offers significantly faster analysis times (<1 min) and requires simpler sample preparation compared with traditional HPLC and GC methods, providing clear advantages for high-throughput laboratory workflows. One consideration is that A-TEEM sensitivity is primarily high for fluorescent compounds, whereas conventional chromatographic techniques remain more broadly applicable to various chemical classes, especially those lacking chromophoric or fluorescent optical activity. These distinctions are presented to offer methodological context rather than to promote commercial use and broader assessments of cost and routine application that are beyond the scope of this study (Table 1).
Comparative Overview: Absorbance-Transmittance Excitation Emission Matrix Versus High-Performance Liquid Chromatography Versus Gas Chromatography
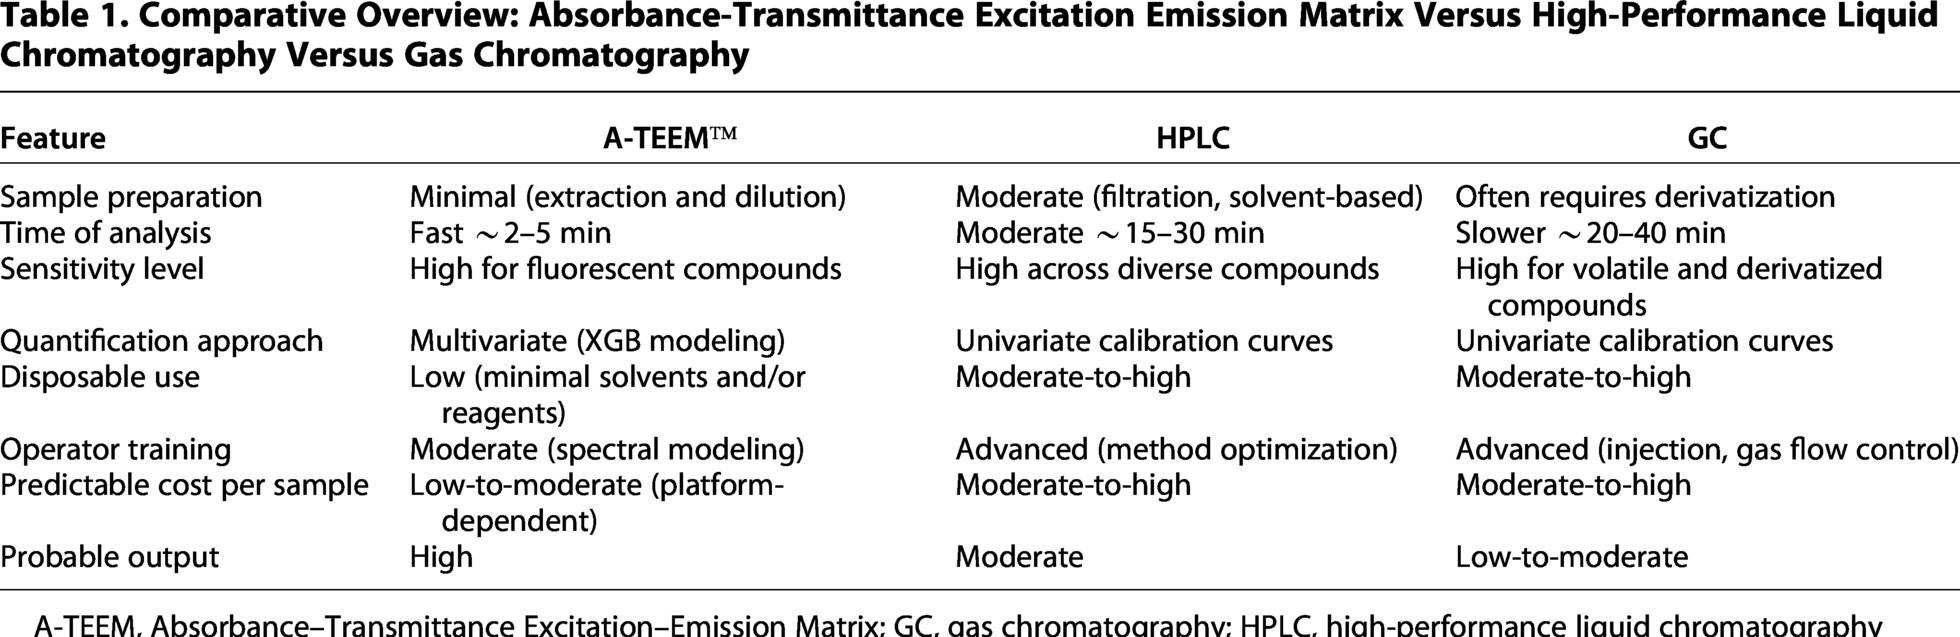
A-TEEM, Absorbance–Transmittance Excitation–Emission Matrix; GC, gas chromatography; HPLC, high-performance liquid chromatography
In an earlier study, we reported an A-TEEM method for the quantification of major cannabinoids and their corresponding acids. 28 That study compared models calibrated with both GC and HPLC. 28 The current study reports the expanded development of the A-TEEM method for robust quantification of 14 major and minor cannabinoids in cannabis plant material. A-TEEM machine learning models developed with the extreme gradient boost (XGB) regression method were calibrated and validated with HPLC reference data for the quantification of 14 major and minor cannabinoids. The results are presented with respect to model precision, accuracy, repeatability, and limits of detection (LOD) and quantification. This study also discusses and reinforces the capacity to use the modeled A-TEEM data to characterize different cultivars and clones that exhibit varying levels of THC and CBD, namely, THC dominant, CBD dominant, and a hybrid with intermediate THC and CBD levels.
Materials and Methods
Plant samples
C. sativa plants of the three major chemotypes (THC dominant, THC-CBD intermediate, and CBD dominant) were grown in the medicinal plants garden at the University of Mississippi, United States. The flowering buds were air-dried for 24 h at 40°C in a ventilated oven, milled into a powder (particle size <200 µm) with the aid of a coffee grinder, and finally stored in airtight bags at −20°C before analysis. The plant samples were allowed to reach room temperature in a desiccator prior to HPLC and A-TEEM analysis.
Standards and reagents
Standard solutions of pure Δ9-THC, THCA, CBD, CBDA, cannabichromene (CBC), CBG, cannabigerolic acid (CBGA), THCV, and cannabinol (CBN) were isolated, confirmed for purity (≥99%) in our laboratory, and prepared at a concentration of 1.0 mg/mL in methanol. Based on our previously published HPLC method, we sourced and characterized the cannabinoid standards according to validated procedures, including spectroscopic data such as 1H NMR and literature-based identification. 27
The other five cannabinoid standards [CBDV, cannabidivarinic acid (CBDVA), Δ9-tetrahydrocannabivarinic acid (THCVA), cannabichromenic acid (CBCA), and Δ8-THC] were purchased from Cayman Chemical Company (Ann Arbor, MI). The purity of all standards was above 99%, as determined by HPLC. Androst-4-ene-3,17-dione was used as the internal standard (I.S.) at a concentration of 100 µg/mL in methanol (MeOH). All standard cannabinoid solutions, in addition to the I.S. solution, were stored at −20°C and allowed to reach room temperature in a desiccator before use. HPLC-grade MeOH was used for the preparation of the working solutions.
High-performance liquid chromatography analysis
The samples were prepared according to the methodology outlined in our recent study. 28 Briefly, powdered cannabis plant material (50 mg per sample) was weighed into 20 mL glass scintillation vials and extracted with 10 mL of I.S. solution (100 µg/mL) by sonication for 20 min at 30°C. Each sample was then filtered through a 45 µm syringe filter. HPLC analysis was performed on a Waters (Milford, MA) 2695 separations module (Empower 3 software) connected to a Waters 2996 PDA detector (190–500 nm). The HPLC column was a Phenomenex (Torrance, CA), Luna C18 (250 mm × 4.6 mm, 3 µm). The column temperature was maintained at 40°C, and the mobile phase consisted of 75% acetonitrile containing 0.1% formic acid and 25% water containing 0.1% formic acid. The detector used was a PDA at λ = 220 nm, with an injection volume of 10 µL. The flow rate was maintained at 1 mL/min from 0 min to 10.1 min and then increased to 1.2 mL/min until 30 min.
Absorbance–Transmittance Excitation–Emission Matrix analysis
Dry cannabis flowering material (1.0 g) was extracted by sonication at room temperature with 10 mL of MeOH/CHCl3 (9:1) for 1 h, filtered, diluted to 25 mg/mL with MeOH, and further diluted to 0.083 mg/mL (working solution). Analyses were conducted using an Aqualog-UV-800-C (HORIBA Scientific, Piscataway, NJ) with the A-TEEM spectroscopy technique. Measuring standards and extracts were analyzed in 3 mL volumes using 1 cm path-length clear fluorescence quartz cuvettes at 20°C, with MeOH as the blank.
The Aqualog® measuring conditions included an excitation/absorbance range from 220 to 800 nm at 5 nm intervals and an emission range from 250 nm to 800 nm at 5 nm intervals. The integration time was 0.25 sec, using medium gain and 8-pixel binning for emission detection. Corrections for solvent background, dark detector signals, Rayleigh and Raman scattering, normalization to the water Raman scattering area, and IFEs were automatically applied using HORIBA Aqualog v4.2 software. Quadruplicate extracts of the samples were prepared, and each analysis was conducted in triplicate, resulting in a total of 12 measurements per sample.
In total, 517 files were generated on 44 unique plant samples for the calibration samples, including one sample with one replicate/repeat. In order to validate the method, five unique plant samples were analyzed. One sample repeat was missing in the validation files, resulting in a total of 59 files.
Data processing, software and tools, and regression analysis of A-TEEM data
In order to obtain accurate and reliable results, SOLO versions 8.8 and 9.5 (Eigenvector Research, Inc., Wenatchee, WA) were used for conducting multivariate analyses. Initially, the excitation–emission matrix (EEM) raw data were unfolded in order to transform three-dimensional EEM data into a two-dimensional array, which was subsequently pre-processed. The pre-processing was conducted in successive steps, including automated clutter removal, centering, and scaling. In order to ensure comparability across samples, the data were subsequently normalized based on the area under the curve. Principal component analysis (PCA) was conducted on pre-processed data to decrease dimensionality and identify the principal components.
The XGB regression technique was used to build predictive models for regression analysis. Both calibration and validation data were used for the evaluation of the linear regression models using HORIBA Aqualog v4.2 software.
Results and Discussion
High-performance liquid chromatography results
The analysis of cannabis plant material samples was performed using a validated HPLC-PDA method, 27 in which each analyte was identified and confirmed by comparing its retention time and UV spectrum with those of a standard compound (Supplementary Data, Supplementary Table S1). The molecular structures of the 14 tested cannabinoids are illustrated in Figure 1. The method was utilized for the analysis of 49 cannabis plant material samples. The results showed that CBD-dominant chemotype samples contained high concentrations of CBDA and low levels of other cannabinoids. In contrast, THC-dominant chemotype samples predominantly contained THCA, whereas THC-CBD-intermediate chemotype samples showed both CBDA and THCA as major cannabinoids, as depicted in Figure 2. These findings align with the USP expert panel’s classification of cannabis into three primary chemotypes based on the THC-to-CBD ratio, namely, THC dominant, THC-CBD intermediate, and CBD dominant. 29 The THC-dominant chemotype comprises samples with a total THC-to-total CBD ratio of not less than (NLT) 5:1. In the THC-CBD intermediate chemotype, this ratio ranges from NLT 0.2:1 to not more than (NMT) 5:1. Conversely, the CBD-dominant chemotype is characterized by a total THC-to-total CBD ratio of NMT 0.2:1. 29
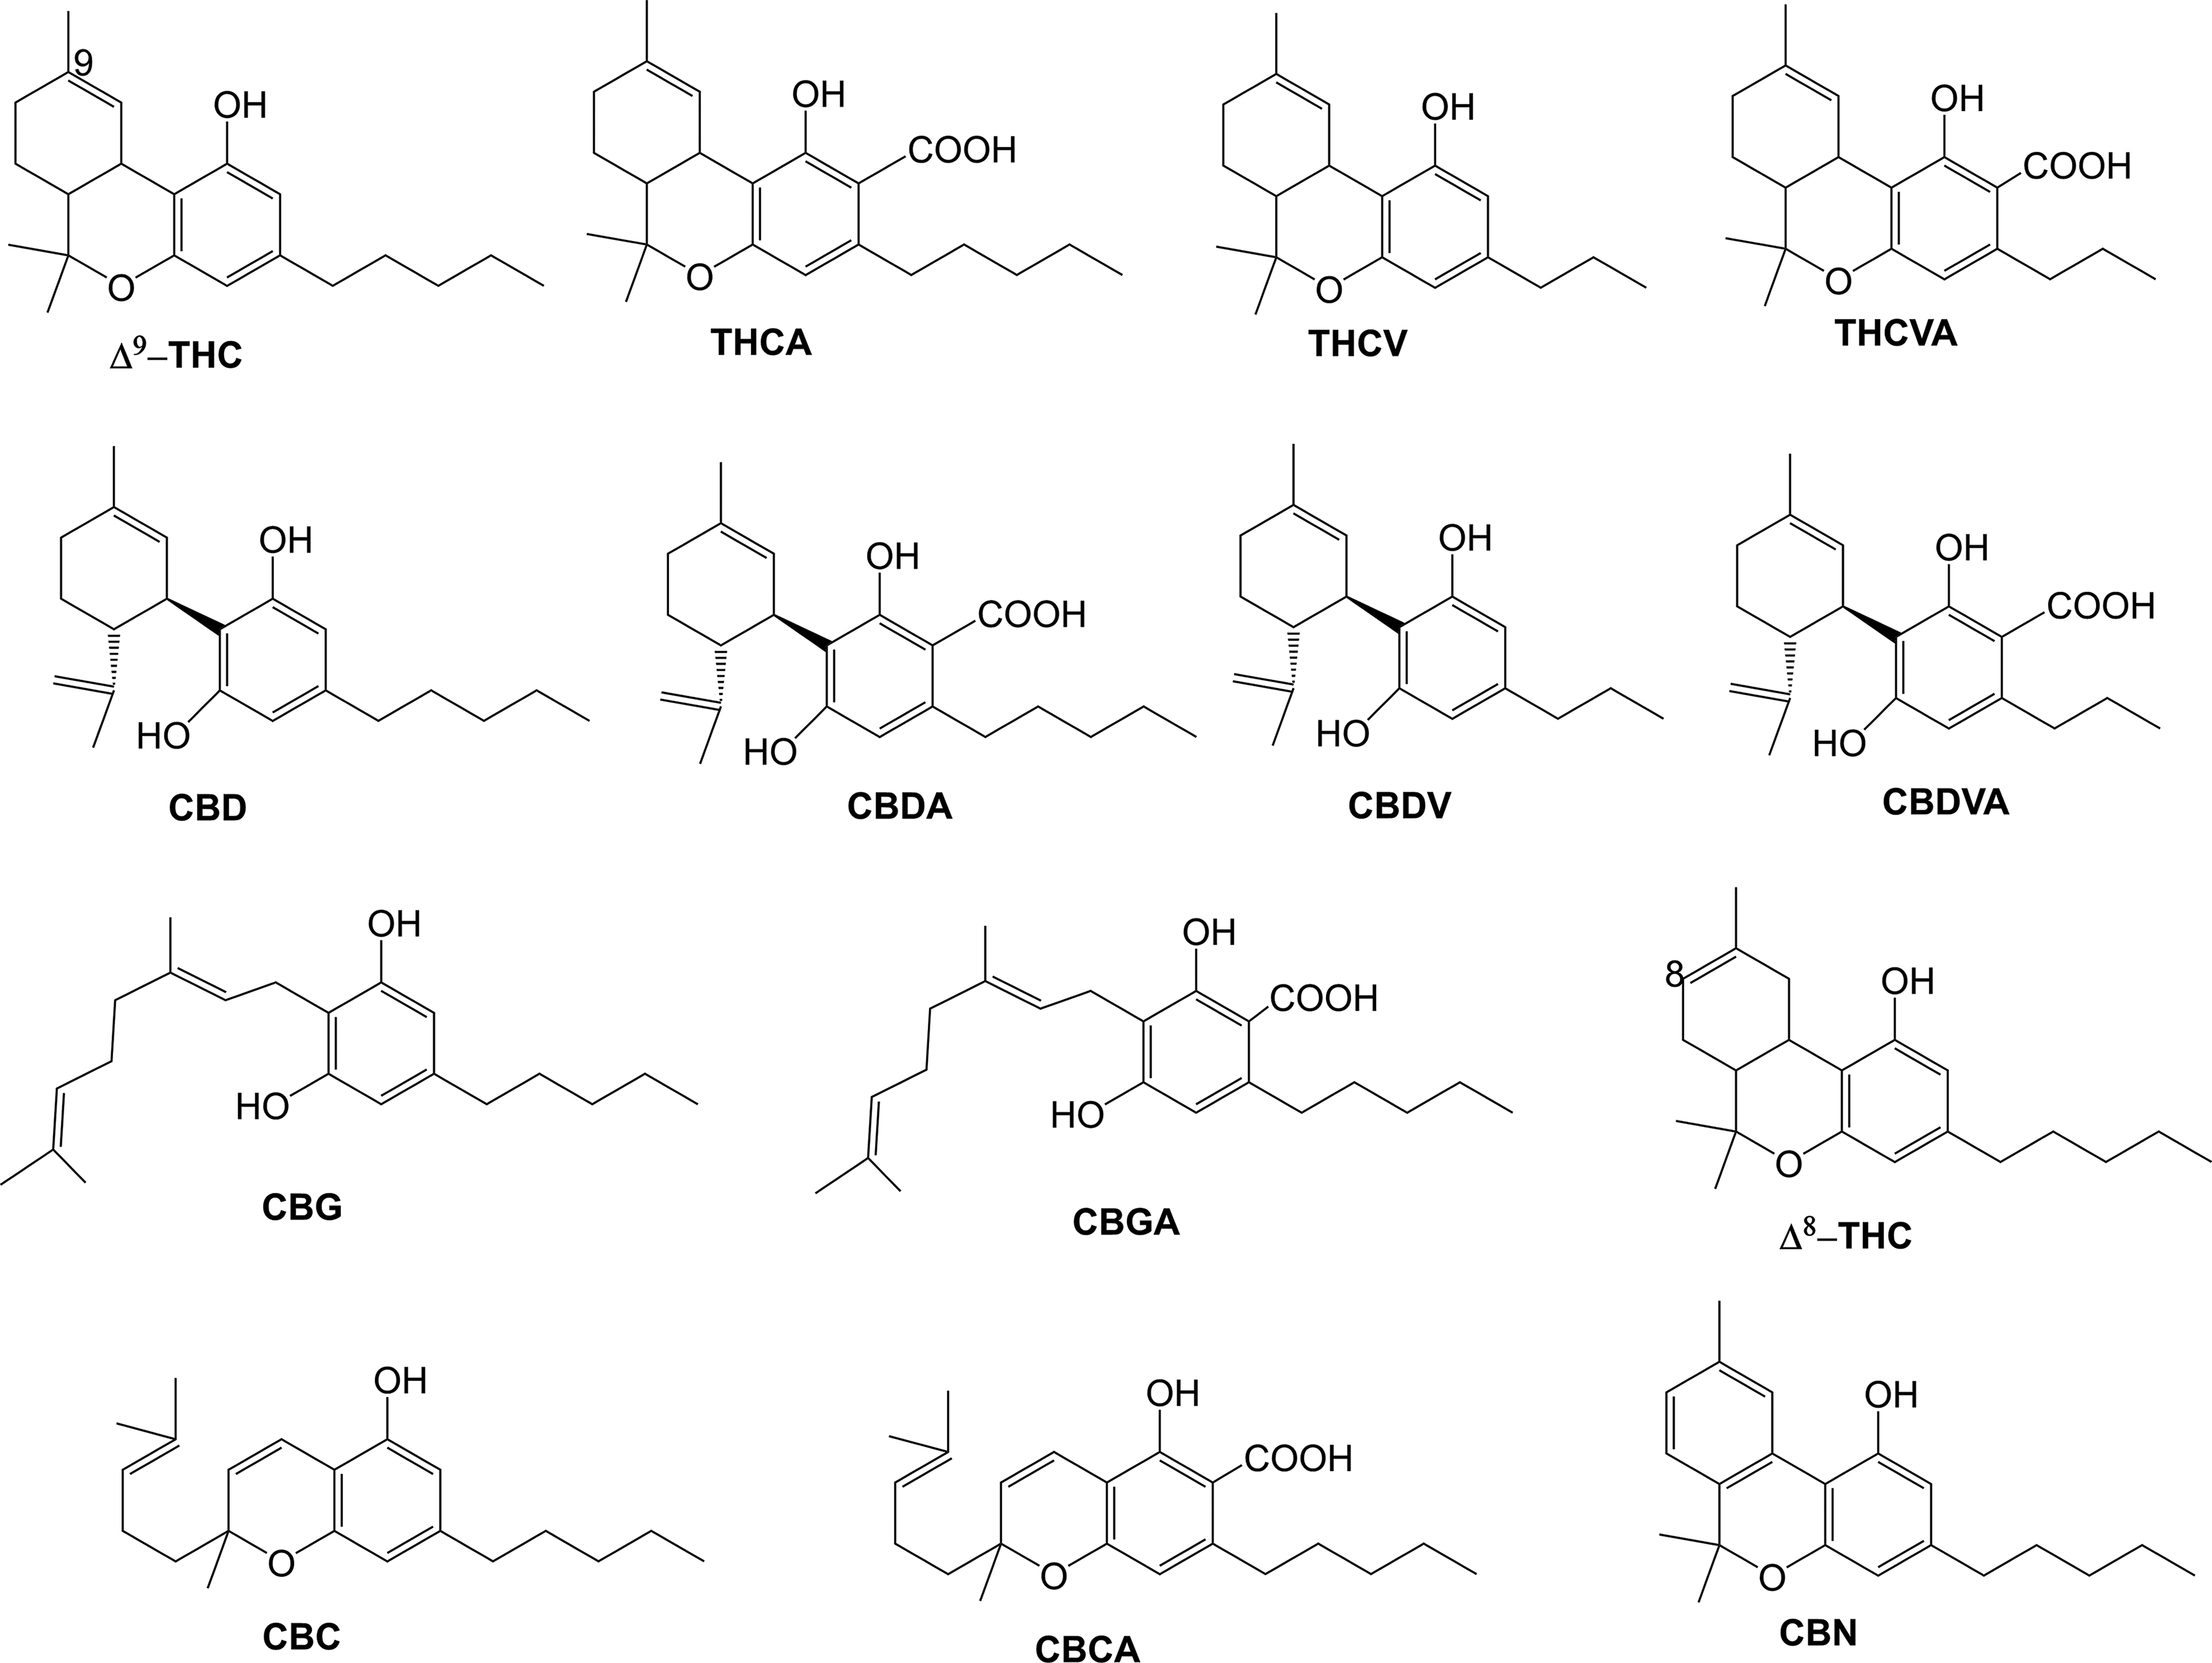
Chemical structures of the 14 tested cannabinoids.
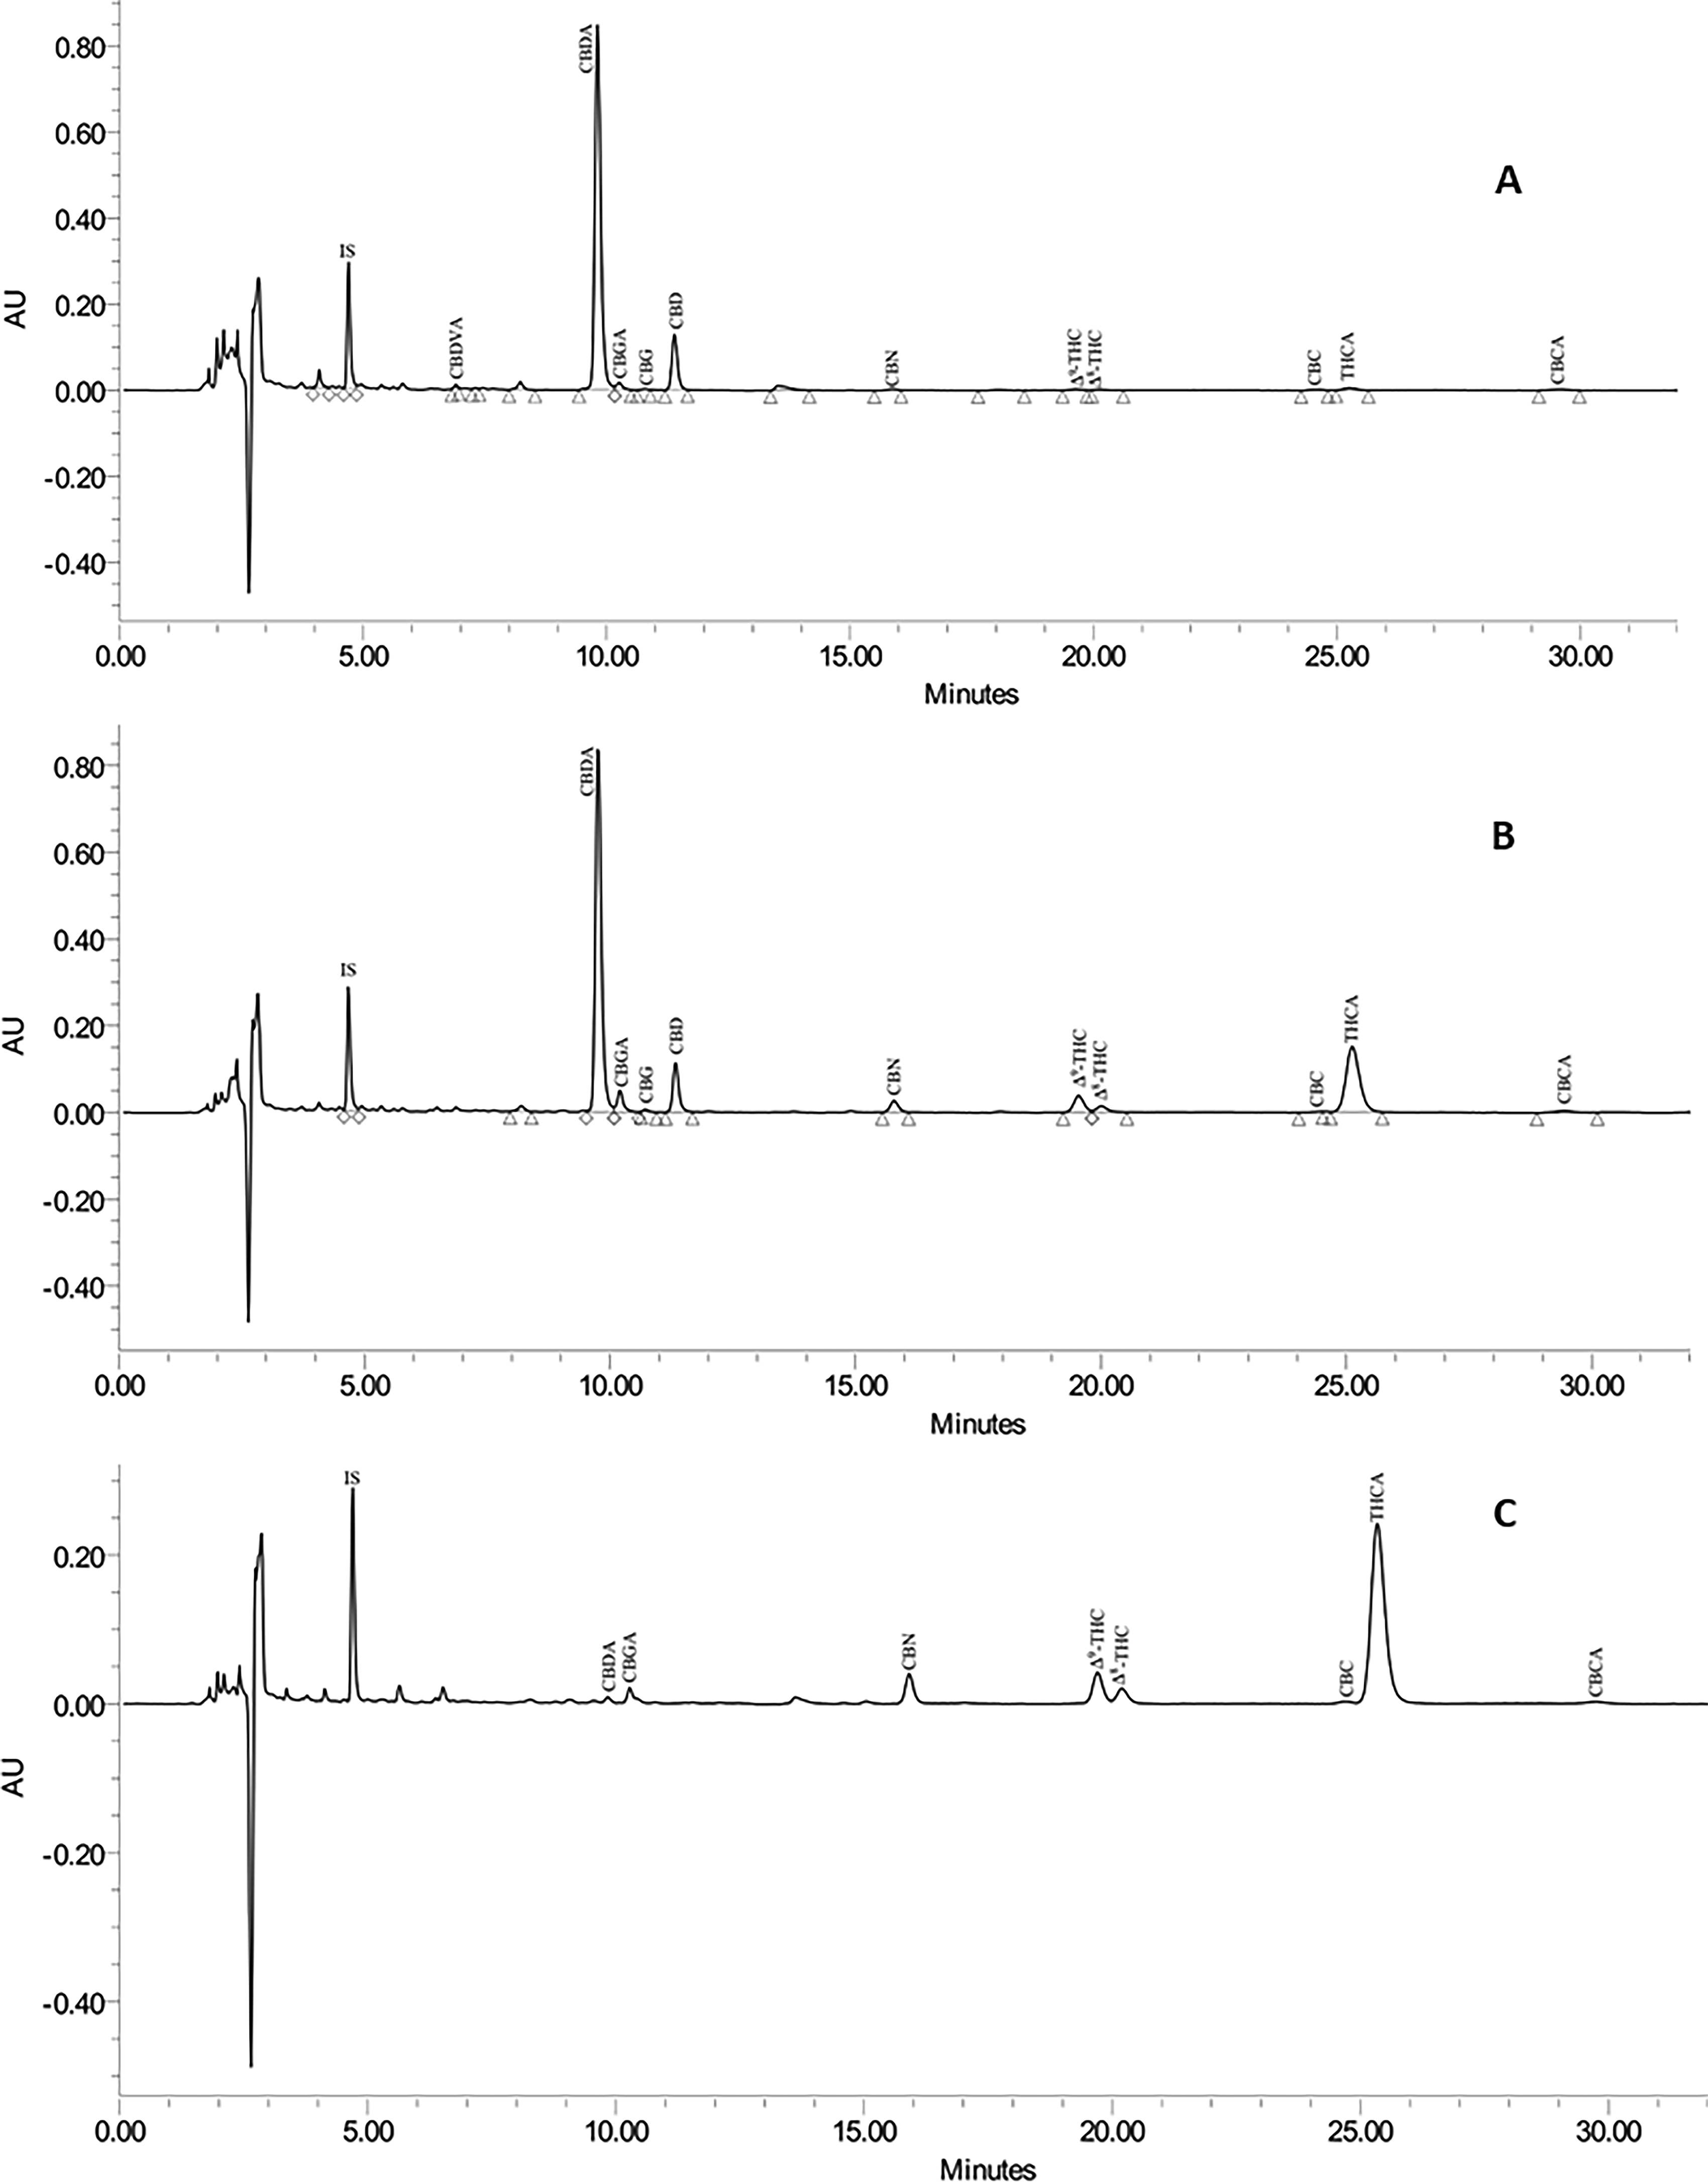
HPLC-PDA chromatograms of the three varieties (measured at λ = 220 nm):
Qualitative analysis of 14 cannabinoid standard solutions by A-TEEM using principal component analysis
Before evaluating the ability to quantify the 14 cannabinoids by regression in the flower extract matrix, we first investigated the ability to separately identify all the individual cannabinoid standards measured by A-TEEM in solution using PCA. Figure 3 shows the PCA fit obtained from the analysis of 14 individual cannabinoid standard solution samples presented with a minimum of four repeats per compound. The unfolded A-TEEM variables used for the PCA analysis correspond to the same regions to be used for the subsequent flower extract XGB regression analyses, described below. The confidence interval (CI) shown is drawn at 99.9%, as are the confidence ellipses for each of the cannabinoids. All 14 cannabinoids exhibited unique PC1:PC2 cluster coordinates within their respective 99.9% CI to support the A-TEEM’s capacity for identification and quantification.
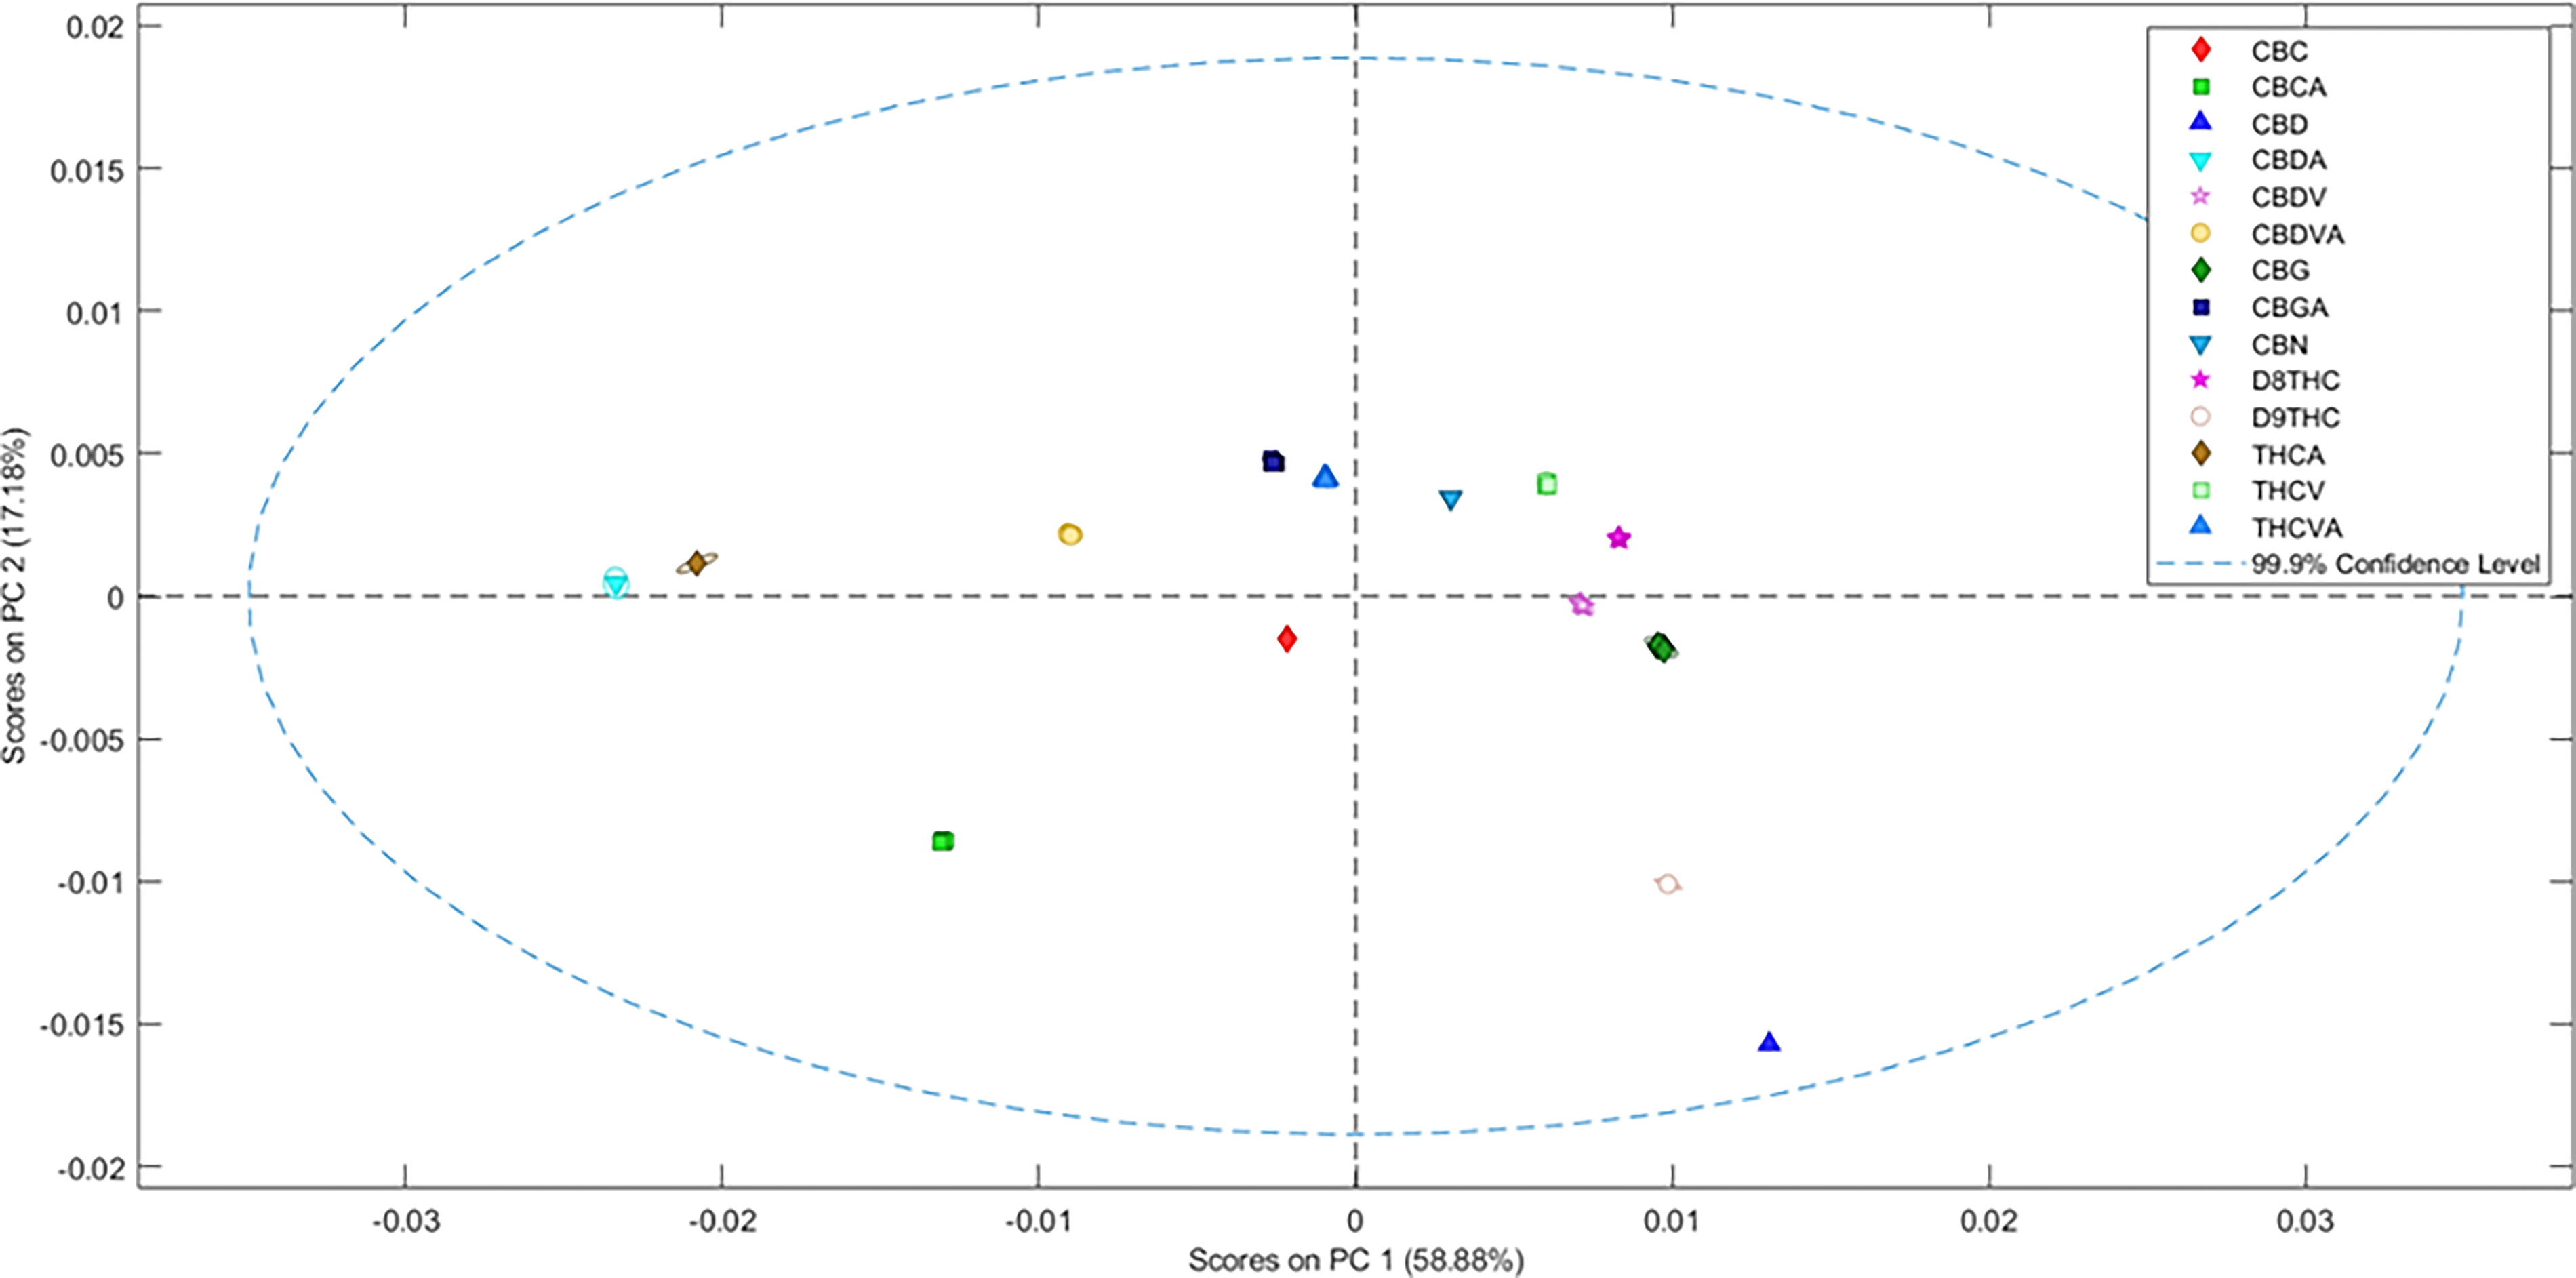
PCA cluster analysis of the A-TEEM data for the 14 individual cannabinoid standard solution sample classes using Eigenvector Solo v.8.8. Plotted are the PC1 and PC2 scores for each cannabinoid class shown in the legend, where each class comprises at least four individual measurements and is defined by a 99.9% confidence ellipse. PCA, principal components analysis; A-TEEM, Absorbance–Transmittance Excitation–Emission Matrix.
Evaluating A-TEEM spectral data to prepare for regression analysis
The first step in using A-TEEM data for effective quantitative regression with cannabis extracts involves evaluating the specific spectral regions of the data associated with the cannabinoid standards and minimizing potential interference from other natural compounds in the extracts, primarily chlorophyll-related compounds, because these do not correlate with cannabinoid concentrations in the clonal varieties in this study. Figure 4 shows a typical A-TEEM dataset obtained from a THC-dominant cannabis flower extract. Panel A presents the full ultraviolet–visible (UV/Vis) absorbance spectrum, and the inset shows the carotenoid and chlorophyll region at an expanded scale to emphasize the dominance of the cannabinoid contribution to the UV portion of the spectrum below 400 nm. The EEM contour plot Figure 4B represents that the cannabinoid spectral region is mostly excited below 400 nm, with emission maximally ranging up to 550 nm. It must be noted that other background fluorescent compounds, in addition to the cannabinoids, also excite and emit in this region, overlapping with the cannabinoids. The chlorophyll-related emission is isolated above 650 nm with excitation and absorbance, overlapping that of the cannabinoid region from 220 nm to around 700 nm. Thus, the chlorophyll emission region >650 nm would be excluded (masked) from the EEM data before unfolding and regression analysis. The entire absorbance spectral range (220–650 nm) was used for IFE correction, 28 which includes the correction for overlapping of the absorbance of cannabinoids with other compounds, including the chlorophyll-related compounds in the selected and analyzed EEM region.
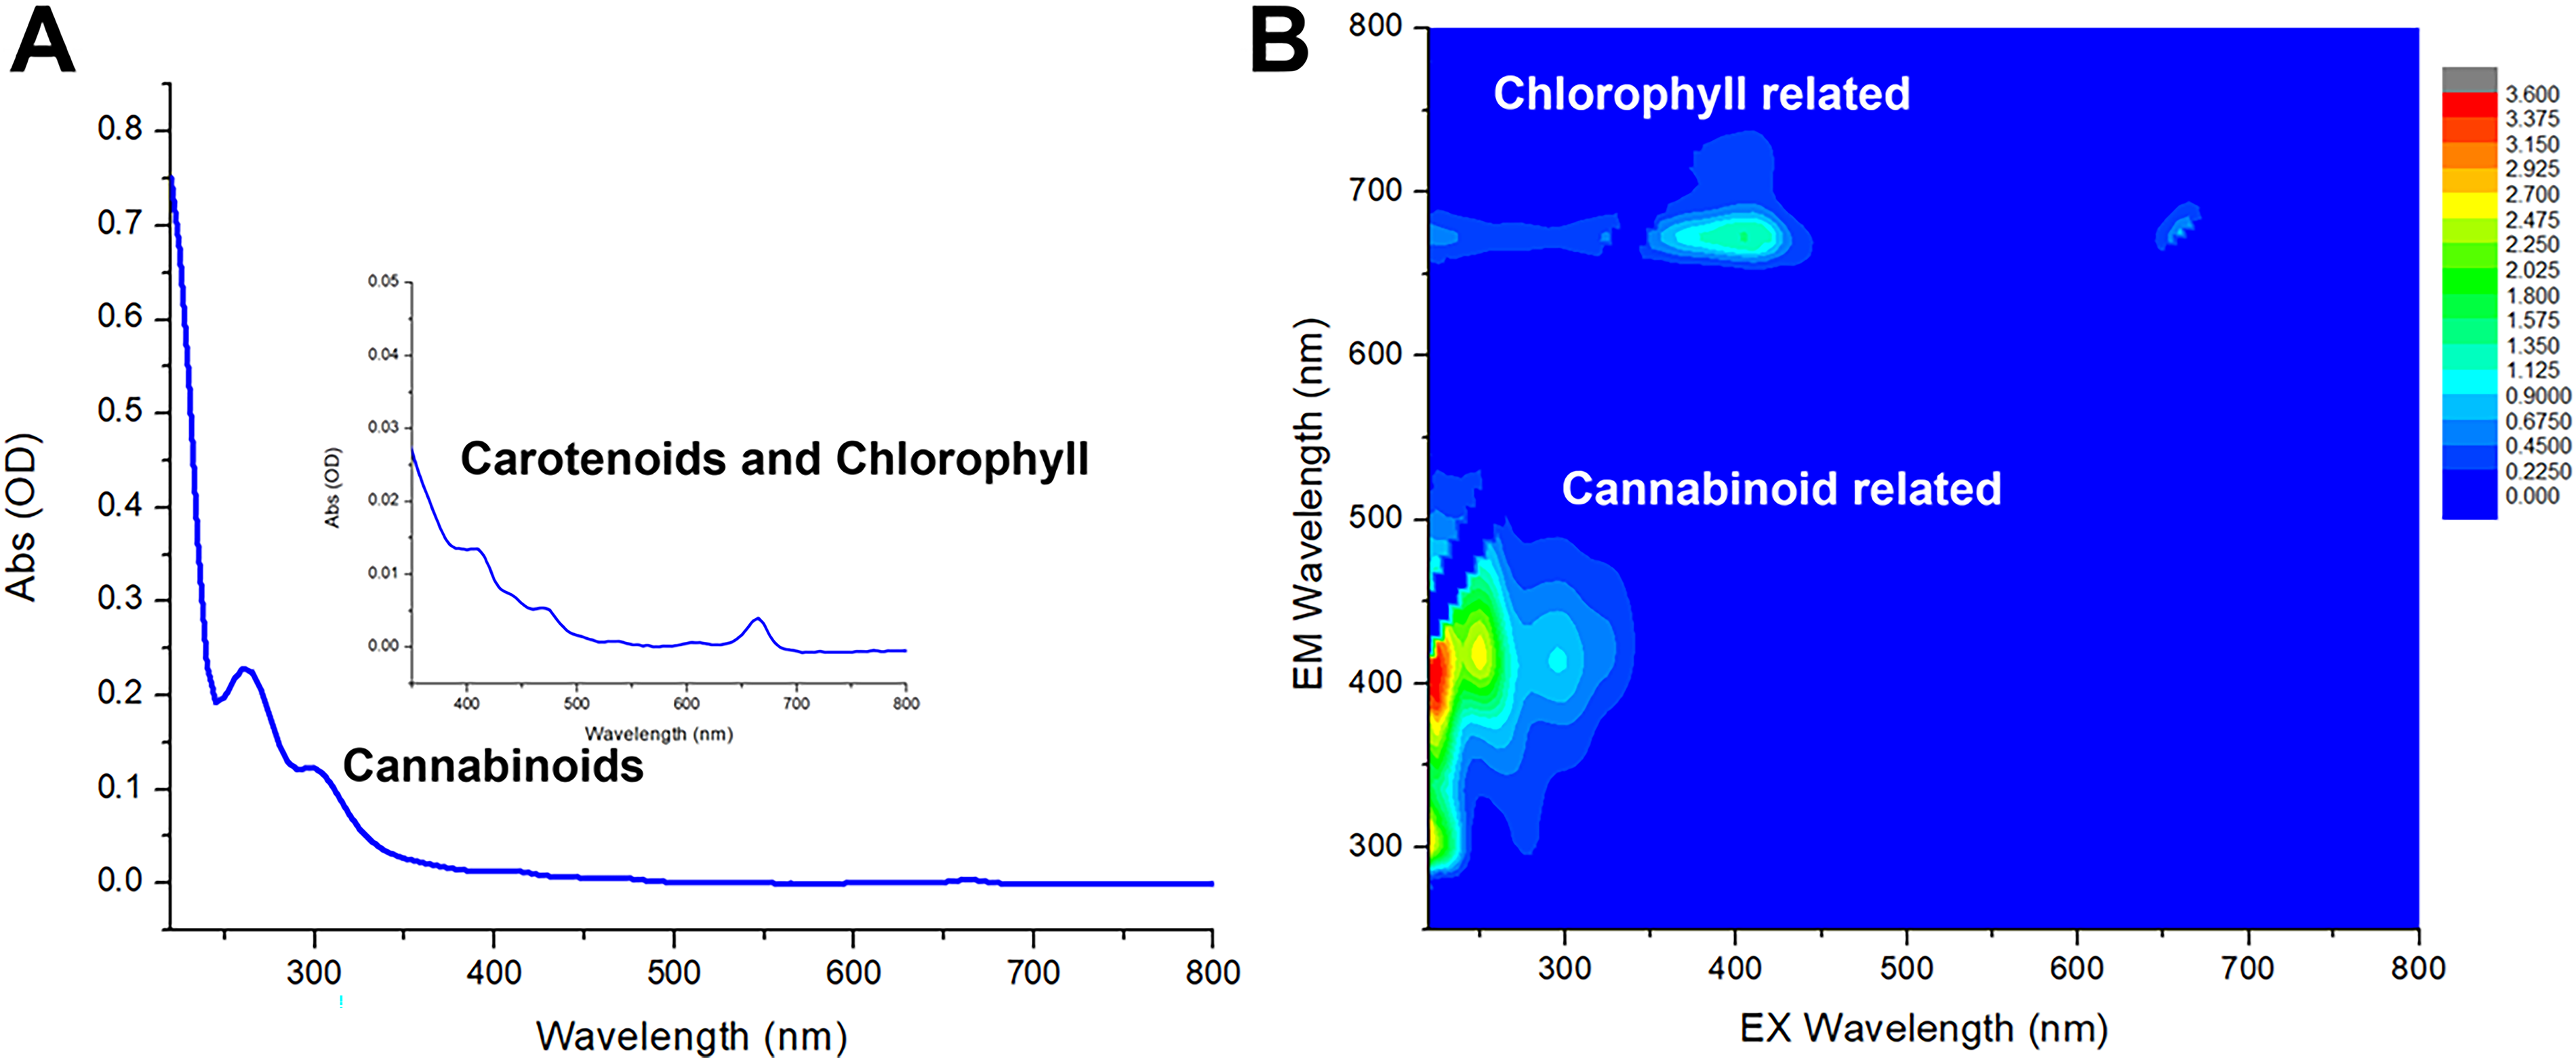
A-TEEM dataset from a high-THC cannabis flower extract.
Quantification of the 14 cannabinoids by A-TEEM spectroscopy by regression with HPLC data
Each of the 14 target cannabinoids’ regressions was modeled individually using XGB regression based on the reference HPLC measurements. The results in Table 2 are arranged into three groupings based on the relative percent weight (wt%) concentration of the cannabinoids, ranging from top to bottom as follows: high (HI) level (>0.35%), medium (MED) level (0.1% < x < 0.35%), and low (LO) level (; <0.1%). The major HI-level cannabinoids included THCA, CBDA, CBD, Δ9-THC, and Δ8-THC. The major acid forms, namely, THCA and CBDA, dominated the samples in this dataset, each representing more than 5.45%, whereas the neutral (decarboxylated) forms were all present at less than 1.0%. Notably, the three THC-related HI-level compounds all exhibited LOD levels <0.013 wt%, with R2 values >0.996. In comparison, CBDA and CBD showed slightly lower R2 values of 0.987 and 0.989, respectively. The slopes for the HI-level compounds were all close to unity, and the mean R2 for this group was 0.994 ± 0.005. The mean R2 values are summarized at the bottom of Table 2, followed a descending pattern consistent with the overall wt% distribution, becoming lower in the MED-level group (0.973 ± 0.014), followed by the LO-level group (0.965 ± 0.013). The mean root mean square error values followed a similar trend with the overall concentration ranges, from the HI (0.066% ± 0.083) to the MED (0.011% ± 0.004) and the LO (0.002% ± 0.001) groups, respectively.
Statistical Summary of Linear Regression Analyses for Cannabinoid Compounds Extracted from Flowers Following Evaluation by Extreme Gradient Boost Regression of the Absorbance–Transmittance Excitation–Emission Matrix and High-Performance Liquid Chromatography Data
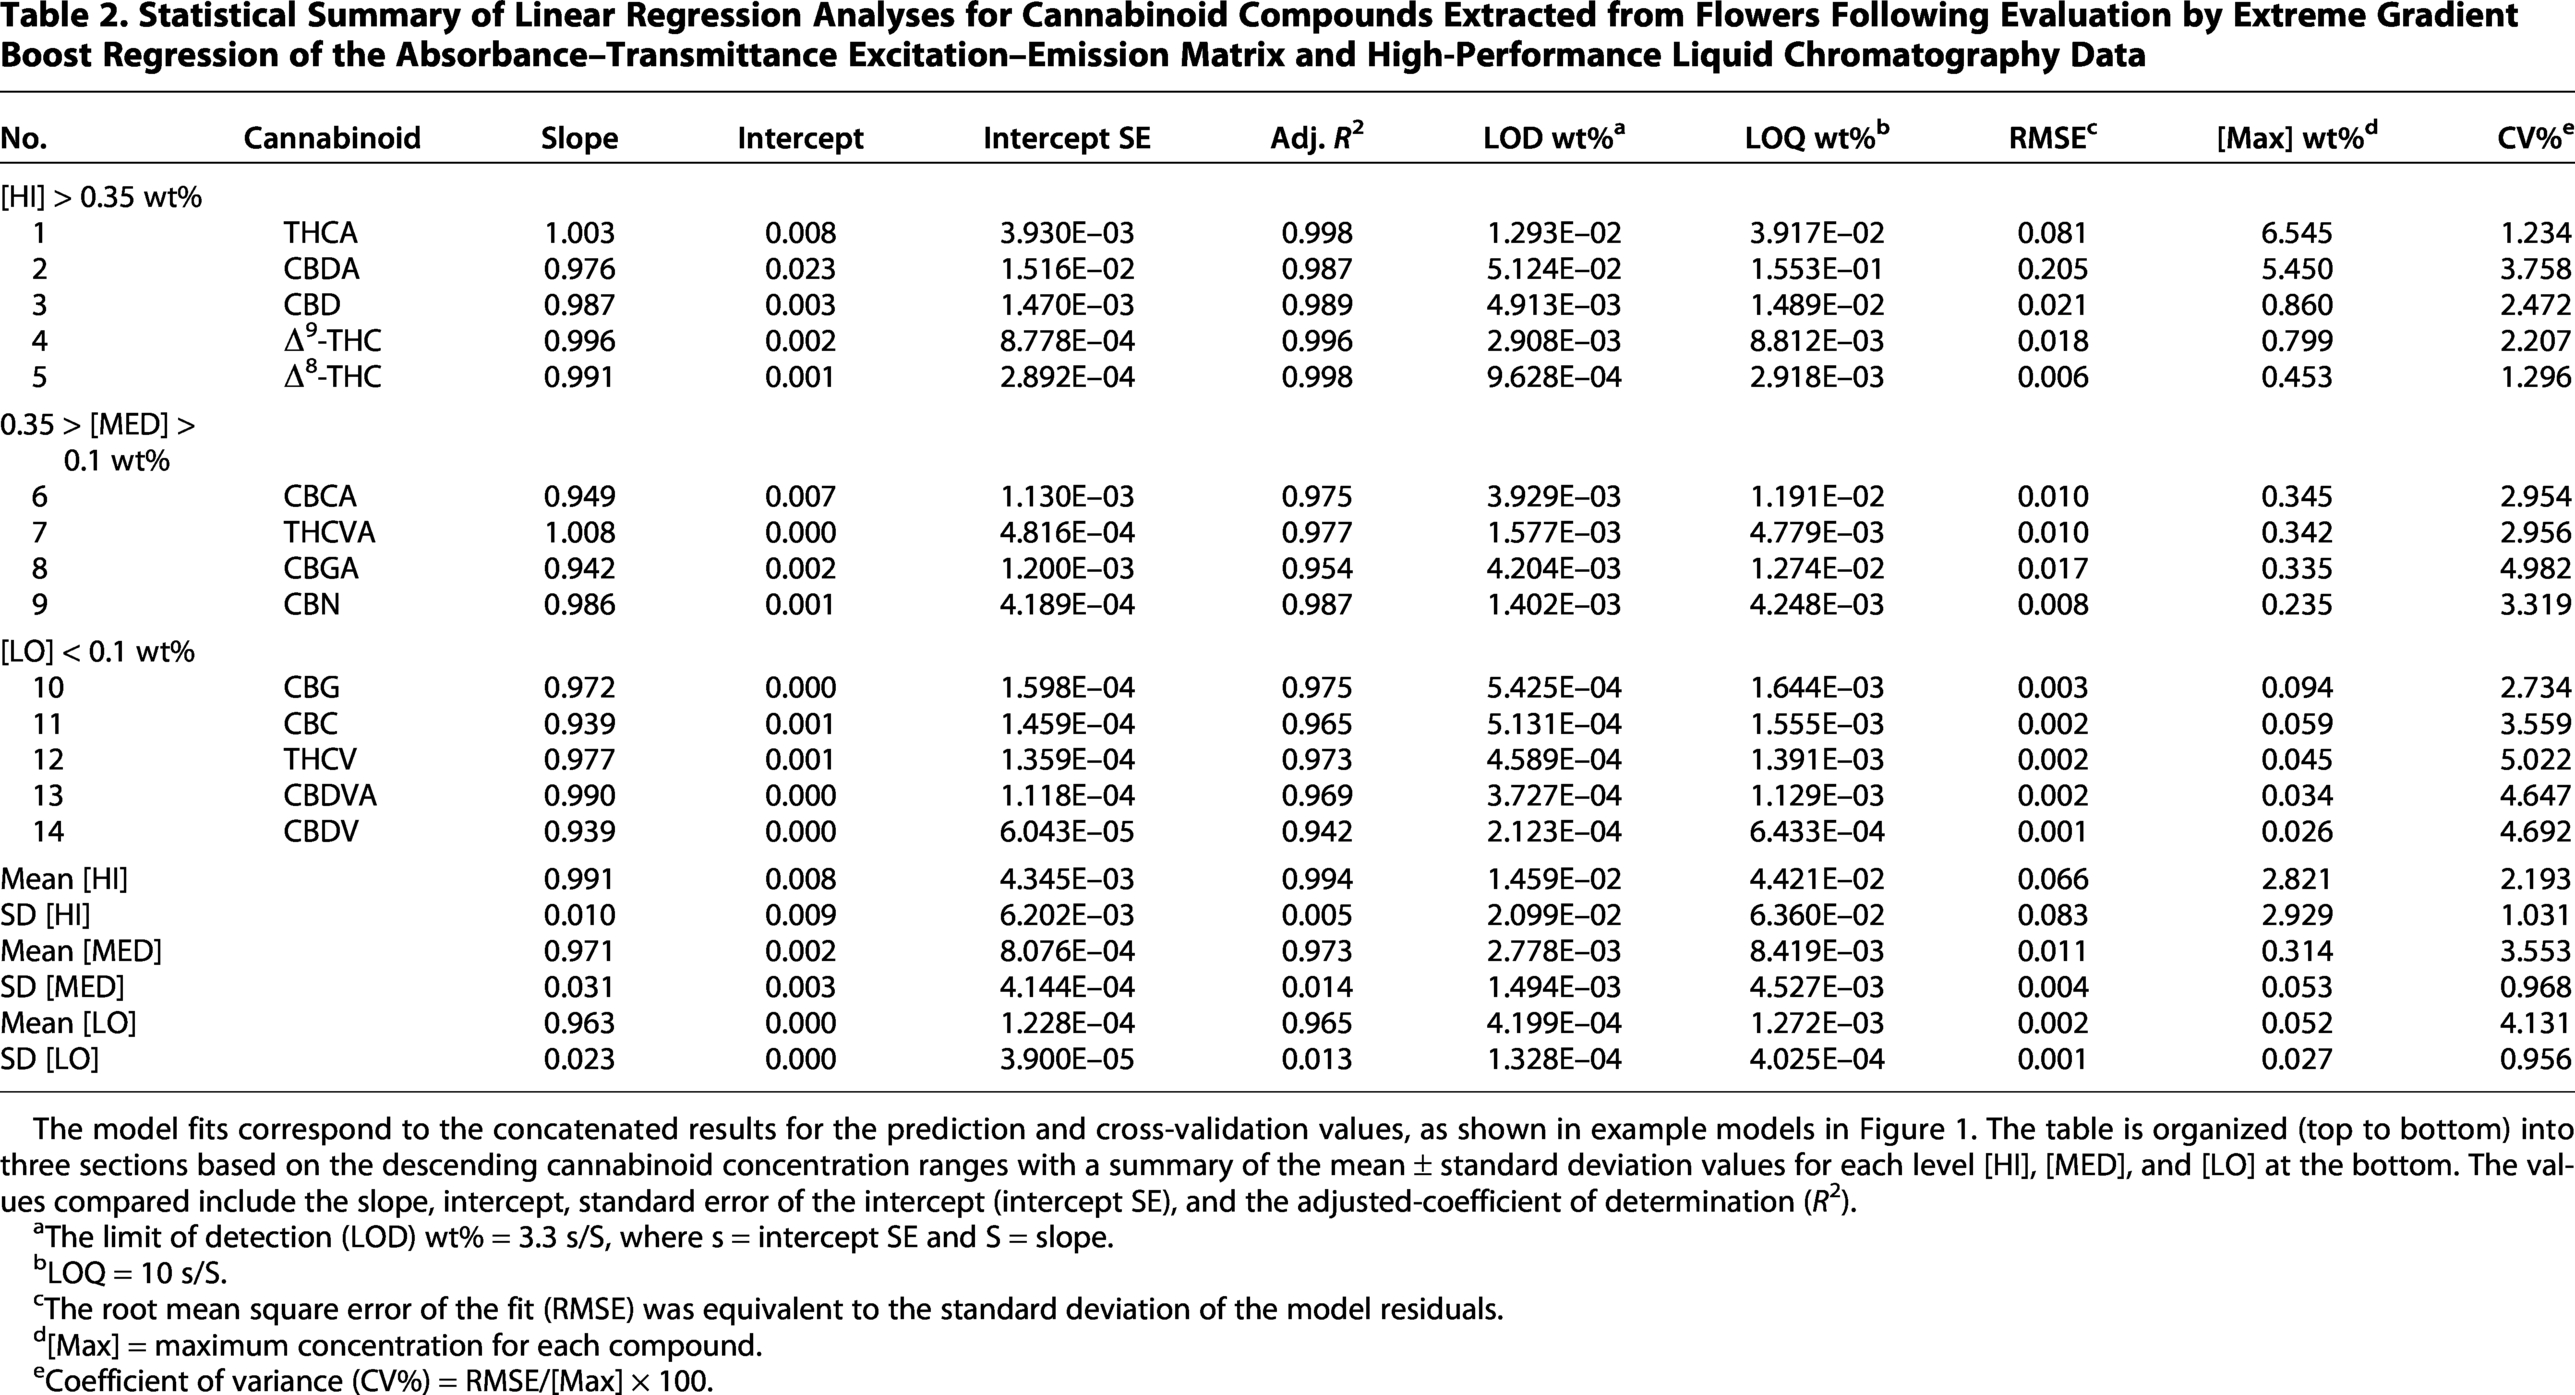
The model fits correspond to the concatenated results for the prediction and cross-validation values, as shown in example models in Figure 1. The table is organized (top to bottom) into three sections based on the descending cannabinoid concentration ranges with a summary of the mean ± standard deviation values for each level [HI], [MED], and [LO] at the bottom. The values compared include the slope, intercept, standard error of the intercept (intercept SE), and the adjusted-coefficient of determination (R2).
aThe limit of detection (LOD) wt% = 3.3 s/S, where s = intercept SE and S = slope.
bLOQ = 10 s/S.
cThe root mean square error of the fit (RMSE) was equivalent to the standard deviation of the model residuals.
d[Max] = maximum concentration for each compound.
eCoefficient of variance (CV%) = RMSE/[Max] × 100.
Figure 5 compares the linear regression plots corresponding to data selected from Table 2 for typical HI (THCA), MED (CBCA), and LO (CBDVA) cannabinoids. The maximum concentration scale for THCA in Figure 5A ranged up to 8.0%, for CBCA in Figure 5B up to 0.4% (1/20th of Fig. 5A), and for CBDVA in Figure 5C up to 0.04% (1/200th of Fig. 5A). Overall, Figure 5 shows that the concentration ranges relate in a predictable manner to the linear models’ accuracy.
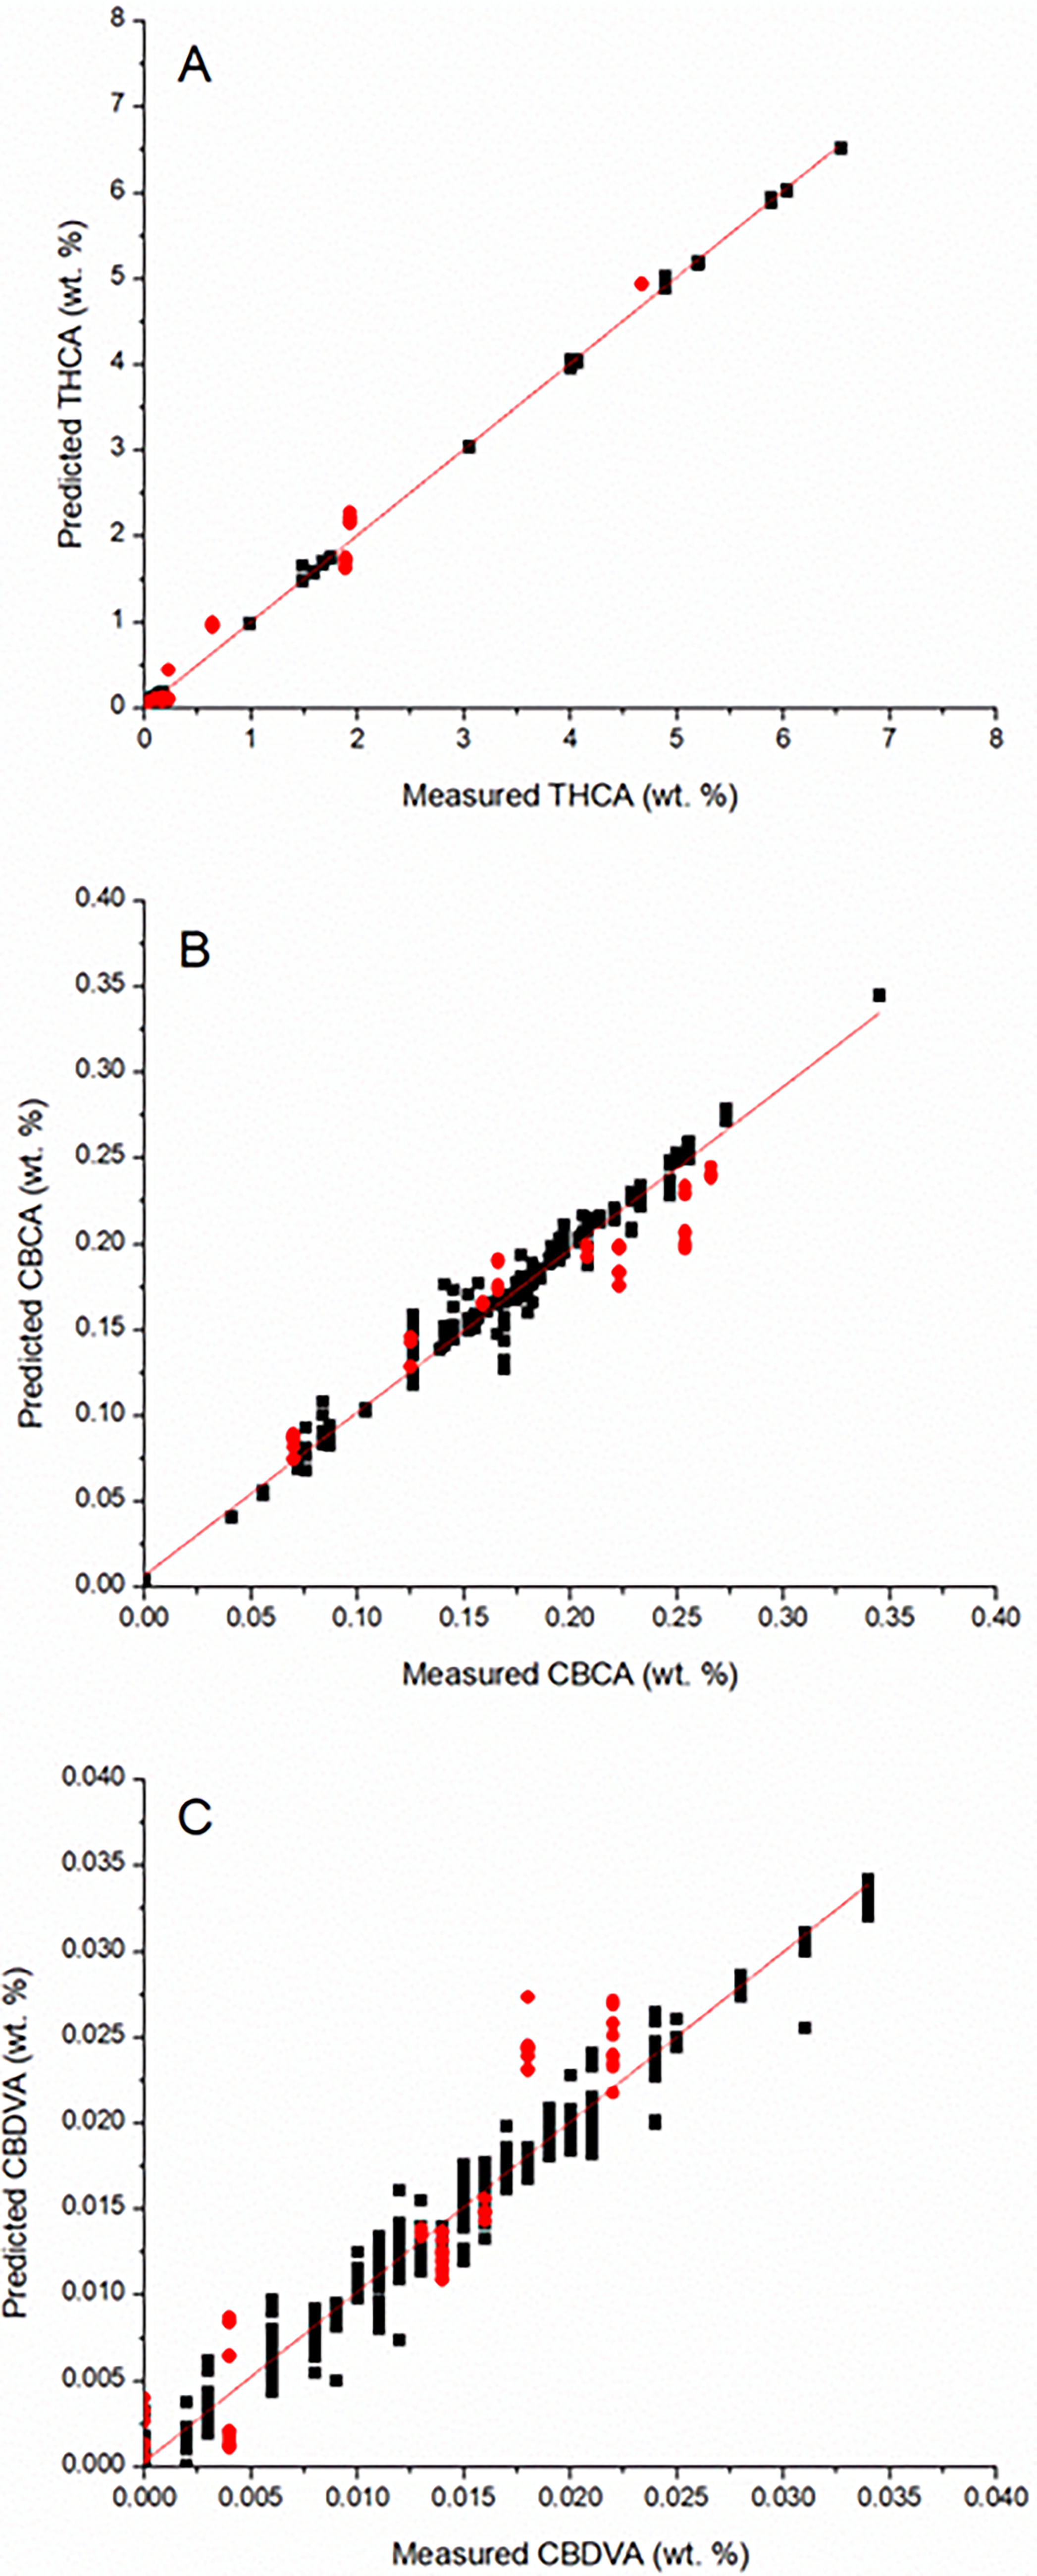
Linear regression plots for example cannabinoid XGBR models representing high concentrations >0.35 wt% (THCA) in
To illustrate the A-TEEM method’s ability to discriminate between the THC-dominant, THC-CBD-intermediate, and CBD-dominant varieties, Figure 6 compares the cannabinoid concentration profiles for typical validation samples, representing Figure 6A (HI), Figure 6B (MED), and Figure 6C (LO) concentration of cannabinoids as defined in Table 2. Figure 6A confirms the results of our previous study, 29 showing that the mean % of CBDA was lowest in the THC-dominant variety (0.03% ± 0.008), intermediate in the THC-CBD intermediate variety (3.11% ± 0.013), and highest in the CBD-dominant variety (4.60% ± 0.223). Conversely, the mean THCA wt% was highest (4.94% ± 0.001) in the THC-dominant variety, followed by the THC-CBD-intermediate (2.23% ± 0.032), and was <0.1 wt% in the CBD-dominant variety.
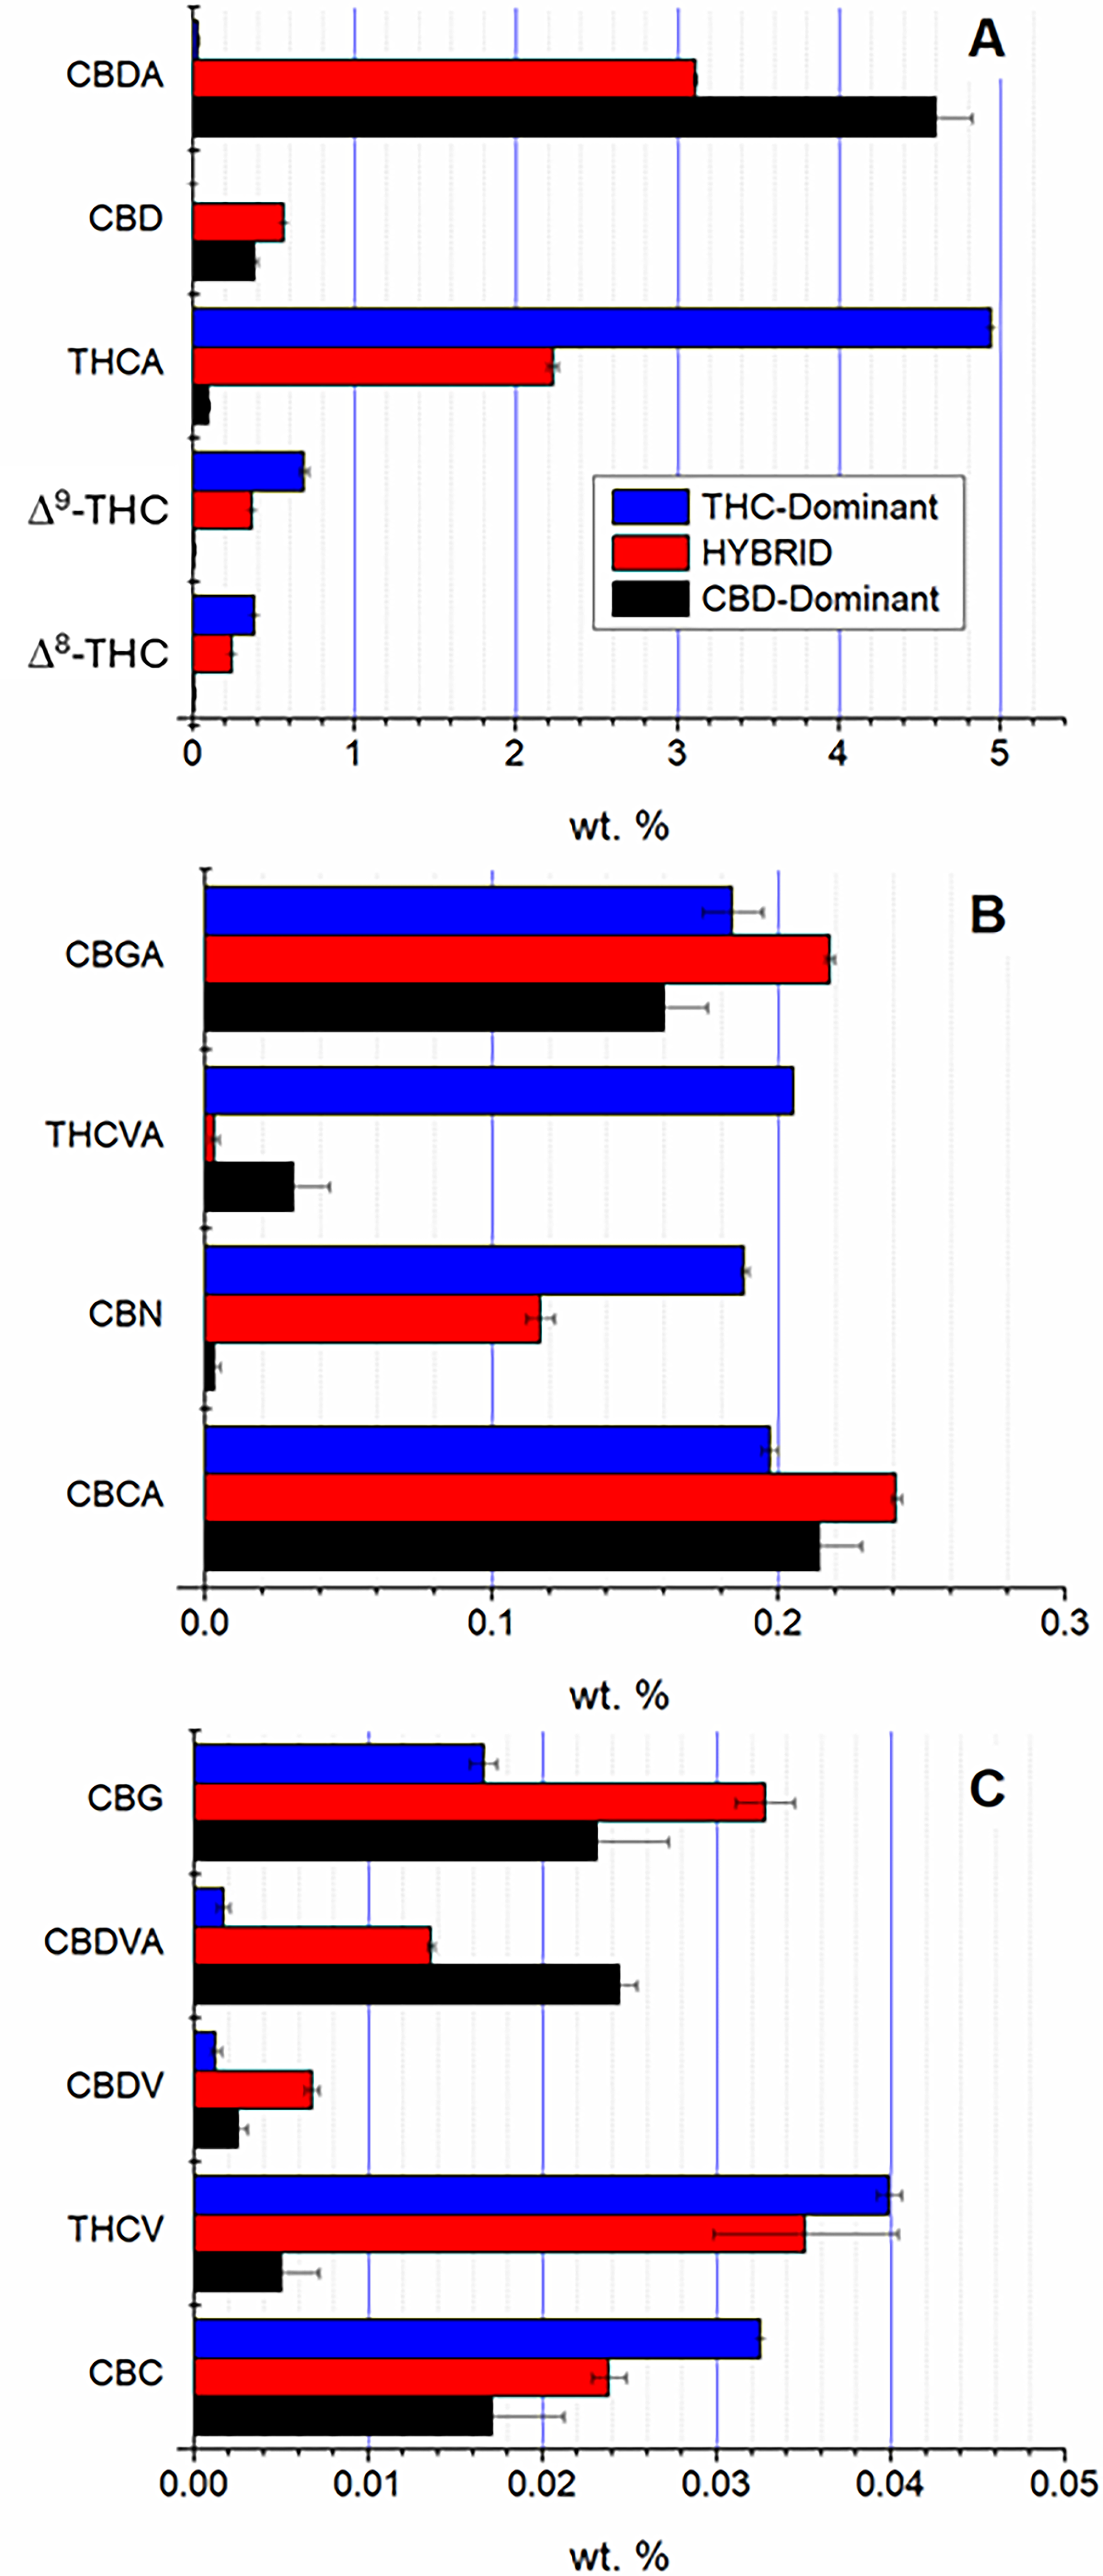
Cannabinoid concentration profiles for typical samples of THC-dominant (blue), THC-CBD-intermediate (red), and CBD-dominant (black) varieties.
Both Δ9-THC and Δ8-THC, respectively, range from the highest levels (0.684% and 0.382%) in the THC-dominant variety to intermediate levels in the THC-CBD-intermediate variety (0.364% and 0.241%), and to 0.01% in the CBD-dominant variety. The neutral form of CBD is close to undetectable in the THC-dominant variety. Overall, the results in Figure 6A are consistent with the expected differences in the expression (and/or activity) of CBDA synthase and THCA synthase in the three varieties, as reported previously. 29
The strain-dependent profiles for the MED concentration compounds in Figure 6B were, in some cases, less clearly distinguished, without any clear varietal dominance exhibited for CBGA and CBCA. Both THCVA and CBN (a decomposition product of THC) showed similar enrichment in the THC-dominant strain compared with the CBD-dominant and intermediate strains. For the LO cannabinoids in Figure 6C, CBG was of the highest concentration in the THC-CBD-intermediate chemovar, whereas CBDVA was highest in the CBD-dominant variety. THCV was highest in the THC-dominant profile, as was CBC. Thus, the data suggest that key information related to cannabinoid synthesis and accumulation is directly reflected in the A-TEEM models regressed against the HPLC reference data.
The error bars (SD) for each of the representative cannabinoids in Figure 6 can be used to calculate the percentage coefficient of variation (%CV), which is the same as the percentage relative standard deviation for the 12 pooled validation A-TEEM samples (i.e., three replicates, each with four repeats) used in the model results. Because the samples were prepared and measured by A-TEEM on the same day for each typical sample, the %CV represents the intraday repeatability of the model predictions. It is reasonable to assume that the interday repeatability would scale proportionally to the values reported earlier. 28 Here, model values for representative HI-level cannabinoids include a %CV of 4.84% for CBDA in the CBD-dominant strain and <1% for THCA in the THC-dominant strain. The %CV values for the MED- and LO-level cannabinoids can be considerably higher, consistent with those in Table 2, with values of 6.9% for CBCA (MED) and 22% for CBC (LO in the CBD-dominant chemovar).
Conclusions
The A-TEEM spectroscopic technique, when coupled with XGB regression, provides a sensitive and accurate method for the rapid quantification of 14 major and minor cannabinoids in solution. As indicated by the linear regression and repeatability statistics for most cannabinoids, the A-TEEM results are functionally comparable to the reference HPLC method. 28 The A-TEEM, clearly, is a more rapid spectroscopic technique, with data acquisition taking less than 45 sec per measurement, compared with approximately 30 min for the reference HPLC method. A-TEEM has the sensitivity to resolve and quantify cannabinoids in solution based only on their unique spectral characteristics, without interference from other components present in the plant matrix. The A-TEEM models also accurately reflected the unique cannabinoid concentration profiles inherent to the THC dominant, CBD dominant, and THC-CBD-intermediate chemovars. Future studies should aim at resolving other natural metabolites, synthetic cannabinoids, and evaluating other types of matrices, including various commercial cannabis preparations.
Authors’ Contributions
A.M.G., J.B.H., and A.E.R. conceived of the experiments; A.M.G., M.M.R., and M.A. ElSohly designed the experiments; M.A. Elhendawy, M.M.R., and A.S.W. performed the experiments; A.M.G. and M.A. Elhendawy analyzed the data; M.A. Elhendawy, A.M.G., E.A.I., A.A.M., S.C., and M.M.R., drafted the article with critical intellectual input from J.B.H., A.M.G., J.B.H., M.G., and M.A. ElSohly supervised the project. All authors reviewed the article and approved its submission.
Footnotes
Acknowledgment
The authors would like to acknowledge the help of Sean M. Travers in reviewing this article.
Author Disclosure Statement
No competing financial interests exist.
Funding Information
This work is supported in part by the National Institute on Drug Abuse (contract no. 75N95024F00001).
Supplemental Material
Abbreviations Used
References
Supplementary Material
Please find the following supplemental material available below.
For Open Access articles published under a Creative Commons License, all supplemental material carries the same license as the article it is associated with.
For non-Open Access articles published, all supplemental material carries a non-exclusive license, and permission requests for re-use of supplemental material or any part of supplemental material shall be sent directly to the copyright owner as specified in the copyright notice associated with the article.