






Abstract
This study develops a robust data-driven modeling framework to predict the unconfined compressive strength (UCS) and stiffness (Go) of low-plasticity clay soils stabilized with Xanthan Gum (XG) and Polypropylene Fiber (PPF), aiming to advance sustainable geotechnical design. A total of 108 soil specimens were prepared with varying XG dosages and cured over different periods, and predictive models were constructed using a Decision Table algorithm optimized with six bio-inspired optimization techniques. Among these, the Firefly-optimized model consistently provided the highest accuracy, demonstrating reliable agreement between predicted and measured values. Sensitivity analysis identified XG dosage, curing time, and dry density as the most influential factors governing UCS and Go. These findings highlight the strong potential of the proposed machine learning framework to guide field engineers in optimizing mix design parameters for improved mechanical behavior of bio-treated soils, reducing reliance on time-consuming and costly laboratory tests while promoting environmentally sustainable foundation practices. The need for this study arises from the growing demand for green soil stabilization techniques that minimize the use of cement and lime while still ensuring reliable performance in construction. Its applicability extends to real-world geotechnical projects such as embankments, road subgrades, and shallow foundations, where predictive modeling can significantly streamline design decisions and improve long-term sustainability.
Keywords
1. Introduction
Soil stabilization is an important strategy for improving the mechanical properties of problematic soils, such as low-plasticity clays, which have high compressibility, low strength, and are sensitive to wetting and drying cycles. Traditional materials, such as Portland cement and lime, have been utilized because they are effective, but they have serious environmental consequences, including greenhouse gas emissions. These materials account for roughly 8% of worldwide CO2 emissions, which contribute to climate change. 1 Unconventional substitutes for conventional stabilizers, including polymers, resins, acids, silicates, enzymes, and waste products like fly ash, are gaining popularity. Polymers lessen porosity in the soil matrix and aid in the formation of physicochemical connections between soil minerals. Natural, carbon-neutral, and energy-efficient substitutes for a range of geotechnical applications are biopolymers, including zein biopolymer, β-glucan (BG), γ-polyglutamic acid (GPA), chitosan, Persian gum, guar gum (GG), and microcrystalline cellulose (MCC). 2 In geotechnical engineering, Xanthomonas campestris (XG) has drawn special attention because of its ability to mitigate soil weaknesses and its recent decrease in market price. XG can greatly increase durability, decrease vulnerability to wetting-drying cycles, and triple soil cohesiveness. Furthermore, mine tailings and other soil types can be stabilized by biopolymers like XG and GG. Another efficient method to improve soil engineering properties is to reinforce soils using fibers that are dispersed randomly. 3 When the soil is uniformly mixed with polypropylene fibers (PPF), the soil’s unconfined compressive strength is increased while its compressibility and swelling are decreased. 4 Baldovino et al. 5 investigated the environmentally friendly and potentially CO2 emission-reducing usage of biopolymers such as Xanthan Gum (XG) for soil stabilization. With a 90-day curing period, clay combined with XG and polypropylene fibers demonstrated notable mechanical benefits, leading to strength increases of up to 37% and maximum dry density improvements of up to 87%. PPF also improved stiffness by 63.55% and strength by 53.93%. Bozyigit 6 provided a sustainable and ecologically friendly stabilizing method for cement production in cold climates. It focuses on identifying the best fiber-biopolymer ratios and comparing the efficacy of two distinct biopolymers when mixed with fibers under freeze-thaw conditions. The results reveal that xanthan gum-containing clay specimens perform better with fiber inclusion, with an efficient xanthan gum/fiber ratio of 1% and 0.5% for clay. This approach improves strength and lowers strength loss by up to 8% during freezing and thawing. Wan et al. 7 investigated how xanthan and guar gum affect the mechanical and physical characteristics of clay. It was discovered that adding 2% biopolymer can raise clay’s liquid limit by up to 8.0% and its plastic limit by up to 3.9%. Additionally, the maximum dry density and ideal water content rose. Specimens treated with XG and GG together often have shear strengths that are higher than those of XG or GG alone. In geotechnical engineering, biopolymers such as xanthan gum and jute fiber have become more and more popular for solidifying soil. Feng et al. 8 used splitting tension and uniaxial compression tests to examine the mechanical behavior of solidified dredged soil. At 1.5% XG content, the results demonstrated enhanced unconfined compressive strength (UCS) and splitting tensile strength (STS). The JF network structure with soil particles and XG cementation were the primary methods used to increase the strength of SDS samples. Alavijeh et al. 9 used xanthan gum biopolymer and lime as stabilizers to examine the impact of polypropylene fibers on stabilized soil. Tests of indirect tensile strength and uniaxial compression strength were performed. The addition of polypropylene fibers, xanthan gum biopolymer, and lime was found to improve the tensile, ductility, and compression strength of soil. Samples stabilized with xanthan gum biopolymer exhibited the highest tensile strength. This substance is safe for the environment. Pydi et al. 10 comprised the use of xanthan gum (XG) and guar gum (GG) in soil stabilization, with a focus on their ability to reduce environmental impact and improve soil quality. The study looks at the appropriateness and effectiveness of BP with soil, assessing strength characteristics and geotechnical features. Factors that influence BP-treated soils are also mentioned. To promote BP stabilization, methodologies for testing, mechanism analysis, and in situ attributes of BP-treated soils are addressed. The economic viability of these biopolymers is also assessed. Kumar et al. 11 examined at how a polysaccharide-modified sand-clay combination interacts with soil and how it behaves hydromechanically. The findings indicate that whereas biopolymers strengthen soil, polysaccharides decrease permeability and enhance heavy metal adsorption capacity. With its high strength and low permeability, xanthan gum-amended soil performed best as a liner material. Hamza et al. 12 reported laboratory findings on a highly flexible soil reinforced with xanthan gum (XG) biopolymer for pavement construction. The results revealed a significant increase in strength, strength improvement ratio, and energy absorption capacity, making it an appropriate subgrade for pavement construction. The XG concentration significantly increased hydraulic conductivity and moisture-mass losses during freeze-thaw durability testing. Up to 60 days of aging improved the stabilized soil’s strength and anti-deformation properties. XG biopolymer shows promise as an alternative additive for treating fat-subgrade soils. Bozyigit et al. 13 looked into how biopolymers affect kaolin clay’s mechanical properties over the long run. Guar gum and xanthan gum, two varieties of biopolymers, were employed. The samples were made with varying amounts of water and let to cure for different amounts of time. The specimens treated with biopolymers grew stronger following a 90-day cure period. Specimens with 2% xanthan gum and 25% water content showed the greatest strength improvement. Axial deformation and ductile behavior were also enhanced by the water content.
The further references cited in the research project entitled “development of data-driven framework for the geotechnical behavior of Xanthan gum-treated clay reinforced with polypropylene fibers” represent a diverse and well-curated foundation, demonstrating a clear trajectory from traditional experimental soil mechanics to advanced data-driven geotechnical modeling, particularly in the context of sustainable soil improvement and characterization using machine learning. Below is a synthesized review and discussion of the listed references, aligning them with the thematic focus of the study. References 14–16 by Onyelowe et al. provide foundational work on the application of machine learning models such as Artificial Neural Networks (ANN), Gene Expression Programming (GEP), and Evolutionary Polynomial Regression (EPR) in geotechnical engineering. These studies emphasize AI-based modeling of stiffness, deformation, and compressive strength for soil systems treated with geopolymer and non-carbon-based binders, which parallels the focus of the current work on improving clay behavior using biopolymers and fibers. The modeling strategies and validation approaches discussed in these papers strongly support the reliability of data-driven frameworks for predicting mechanical soil properties. Reference 17 extends this methodology to biochar-treated unsaturated soils, demonstrating the adaptability of AI models in predicting complex soil–bio interactions, a concept that resonates with the biological amendment (Xanthan gum) used in the present study. It further validates the application of physics-informed modeling to soil-plant-energy systems, an advanced interdisciplinary application of AI in geotechnics. References 18 and 19 focus on shear strength prediction using Genetic Programming and ANN for clays and fine-grained soils. These methods are particularly relevant given that shear strength parameters like cohesion and internal friction angle are directly related to the tensile and overall strength of treated soils, supporting the modeling framework applied in the current study. Reference 20 by Shahani et al. brings in rock mechanics and expands the utility of ML beyond soil to rock parameter prediction, using input features such as cohesion and internal friction. It demonstrates the generalizability of ML models across geotechnical domains and reinforces the credibility of data-driven prediction for strength parameters in treated geomaterials. Reference 21 presents a deep learning approach for automated soil classification, utilizing gradient-based optimizers. This aligns with the need for efficient data partitioning and processing in the current framework. The emphasis on deep learning reflects an emerging trend towards more complex architectures that can capture nonlinear behaviors in geotechnical materials, which is highly applicable to the coupled Xanthan gum-fiber system investigated. Reference 5 by Baldovino et al. is the most directly relevant to the current study. It investigates the same material system; Xanthan gum-treated clay reinforced with polypropylene fibers using experimental approaches. This paper serves as a benchmark reference for the physical behavior of the composite material, and the present study builds upon this by transitioning from empirical experimentation to predictive, data-driven modeling. Reference 22 addresses the critical aspect of data partitioning and utilization in ML applications, particularly in civil engineering contexts. This supports the methodological foundation of the current work by offering guidance on structuring datasets to maximize model generalization and minimize overfitting, crucial in developing accurate and reliable models. Reference 23 by Hoffman and Gardner presents a classical sensitivity analysis methodology, which has been widely adapted in ML frameworks for evaluating variable importance. The use of this method in the current study allows the researchers to interpret the influence of individual features (such as fiber content or moisture) on the predicted tensile strength, thereby enhancing model explainability and guiding mix design optimization. Collectively, these references provide strong technical support for the development and validation of a data-driven, physics-informed machine learning framework to model the geotechnical behavior of Xanthan gum and polypropylene fiber-treated clay. They represent a blend of experimental studies, machine learning applications, sensitivity analysis, and data strategy, forming a comprehensive foundation that reinforces the novelty, methodological soundness, and practical relevance of the current research. These works not only validate the computational approaches taken but also illustrate the growing trend toward sustainable, AI-integrated geotechnical engineering solutions.
2. Research gap and statement of novelty
Despite the growing body of literature exploring the mechanical behavior and stabilization potential of Xanthan gum-treated clay reinforced with polypropylene fibers, there remains a significant gap in leveraging advanced, bio-inspired optimization techniques within a unified machine learning framework to model and predict the mechanical properties of such sustainable composites. Previous studies, including those by Baldovino et al. and Bozyigit, have primarily relied on empirical laboratory investigations to assess unconfined compressive strength (UCS) and stiffness (Go), while recent efforts by Onyelowe et al. and others have explored machine learning applications in geotechnical contexts. However, these approaches either focus on conventional binders, different soil types, or do not systematically optimize model hyperparameters using nature-inspired strategies, leaving an untapped opportunity to improve prediction accuracy, robustness, and interpretability. Moreover, existing models often employ single optimization techniques or traditional model tuning processes without integrating diverse bio-inspired algorithms that mimic natural problem-solving behaviors. The lack of comparative insights into how these algorithms influence predictive performance when applied to the same base learning model further limits the development of a standardized, high-accuracy modeling approach in biopolymer-stabilized soil systems. Additionally, few studies have combined sensitivity analysis, comprehensive statistical evaluation, and model validation within a single, cohesive methodology to explore both predictive accuracy and feature significance in the behavior of such environmentally responsive materials. This research addresses these gaps by developing a novel, data-driven framework for predicting the unconfined compressive strength (UCS) and shear wave modulus (Go) of Xanthan gum-treated clay reinforced with polypropylene fibers. Six distinct machine learning models were developed using the Decision Table (DT) technique, each integrated with a unique bio-inspired optimization algorithm; Bat, Cuckoo, Elephant, Firefly, Rhino, and Gray Wolf, to fine-tune model hyperparameters. Implemented through Weka Data Mining Software (v3.8.6), the models were rigorously evaluated using an extensive suite of error and efficiency metrics including SSE, MAE, MSE, RMSE, R2, R, WI, NSE, KGE, Accuracy (%), Error (%), and SMAPE. This multi-model, multi-optimizer approach offers a comprehensive comparative analysis of optimization strategies and their impact on geotechnical property prediction. It marks a significant departure from existing literature by embedding multiple optimization paradigms into a single modeling framework while emphasizing sustainable soil improvement, thereby establishing a new benchmark in physics-informed, AI-integrated geotechnical engineering.
3. Aim and specific objectives
The primary aim of this research is to develop a robust, data-driven predictive framework using advanced machine learning models optimized with bio-inspired algorithms to estimate the unconfined compressive strength (UCS) and shear wave modulus (Go) of Xanthan gum-treated clay reinforced with polypropylene fibers, thereby contributing to sustainable and efficient geotechnical engineering practices. To achieve this aim, the specific objectives of the research are as follows: to build and train six distinct Decision Table (DT)-based machine learning models, each coupled with a unique bio-inspired optimization algorithm namely Bat, Cuckoo, Elephant, Firefly, Rhino, and Gray Wolf using the Weka Data Mining software platform; to evaluate and compare the predictive accuracy and reliability of these models through comprehensive performance metrics including SSE, MAE, MSE, RMSE, R2, R, WI, NSE, KGE, Accuracy (%), Error (%), and SMAPE; to assess the influence and importance of input variables on UCS and Go through sensitivity analysis using both the classical Hoffman and Gardener method and the modern SHapley Additive exPlanations (SHAP) technique, thereby improving model interpretability and aiding in design decision-making; and to validate the proposed framework as a sustainable and data-efficient alternative to conventional experimental procedures for geotechnical characterization of biopolymer- and fiber-reinforced soils.
4. Methodology
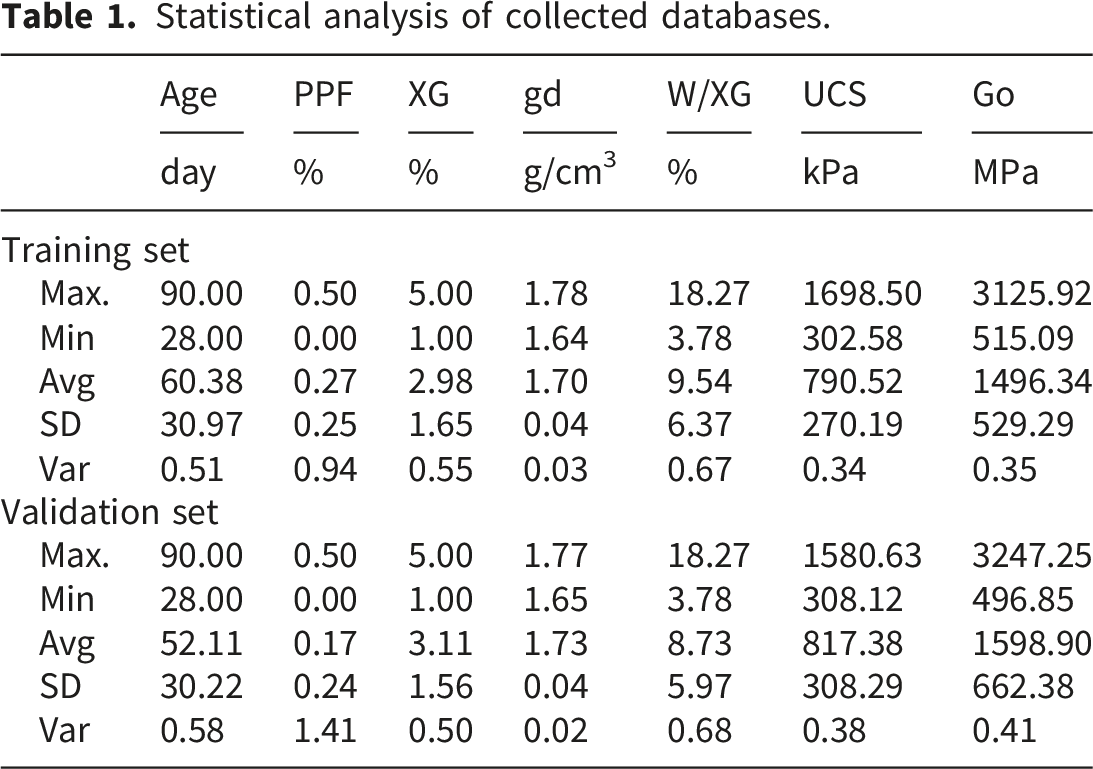
4.1. Collected database and preliminary analysis
Statistical analysis of collected databases.
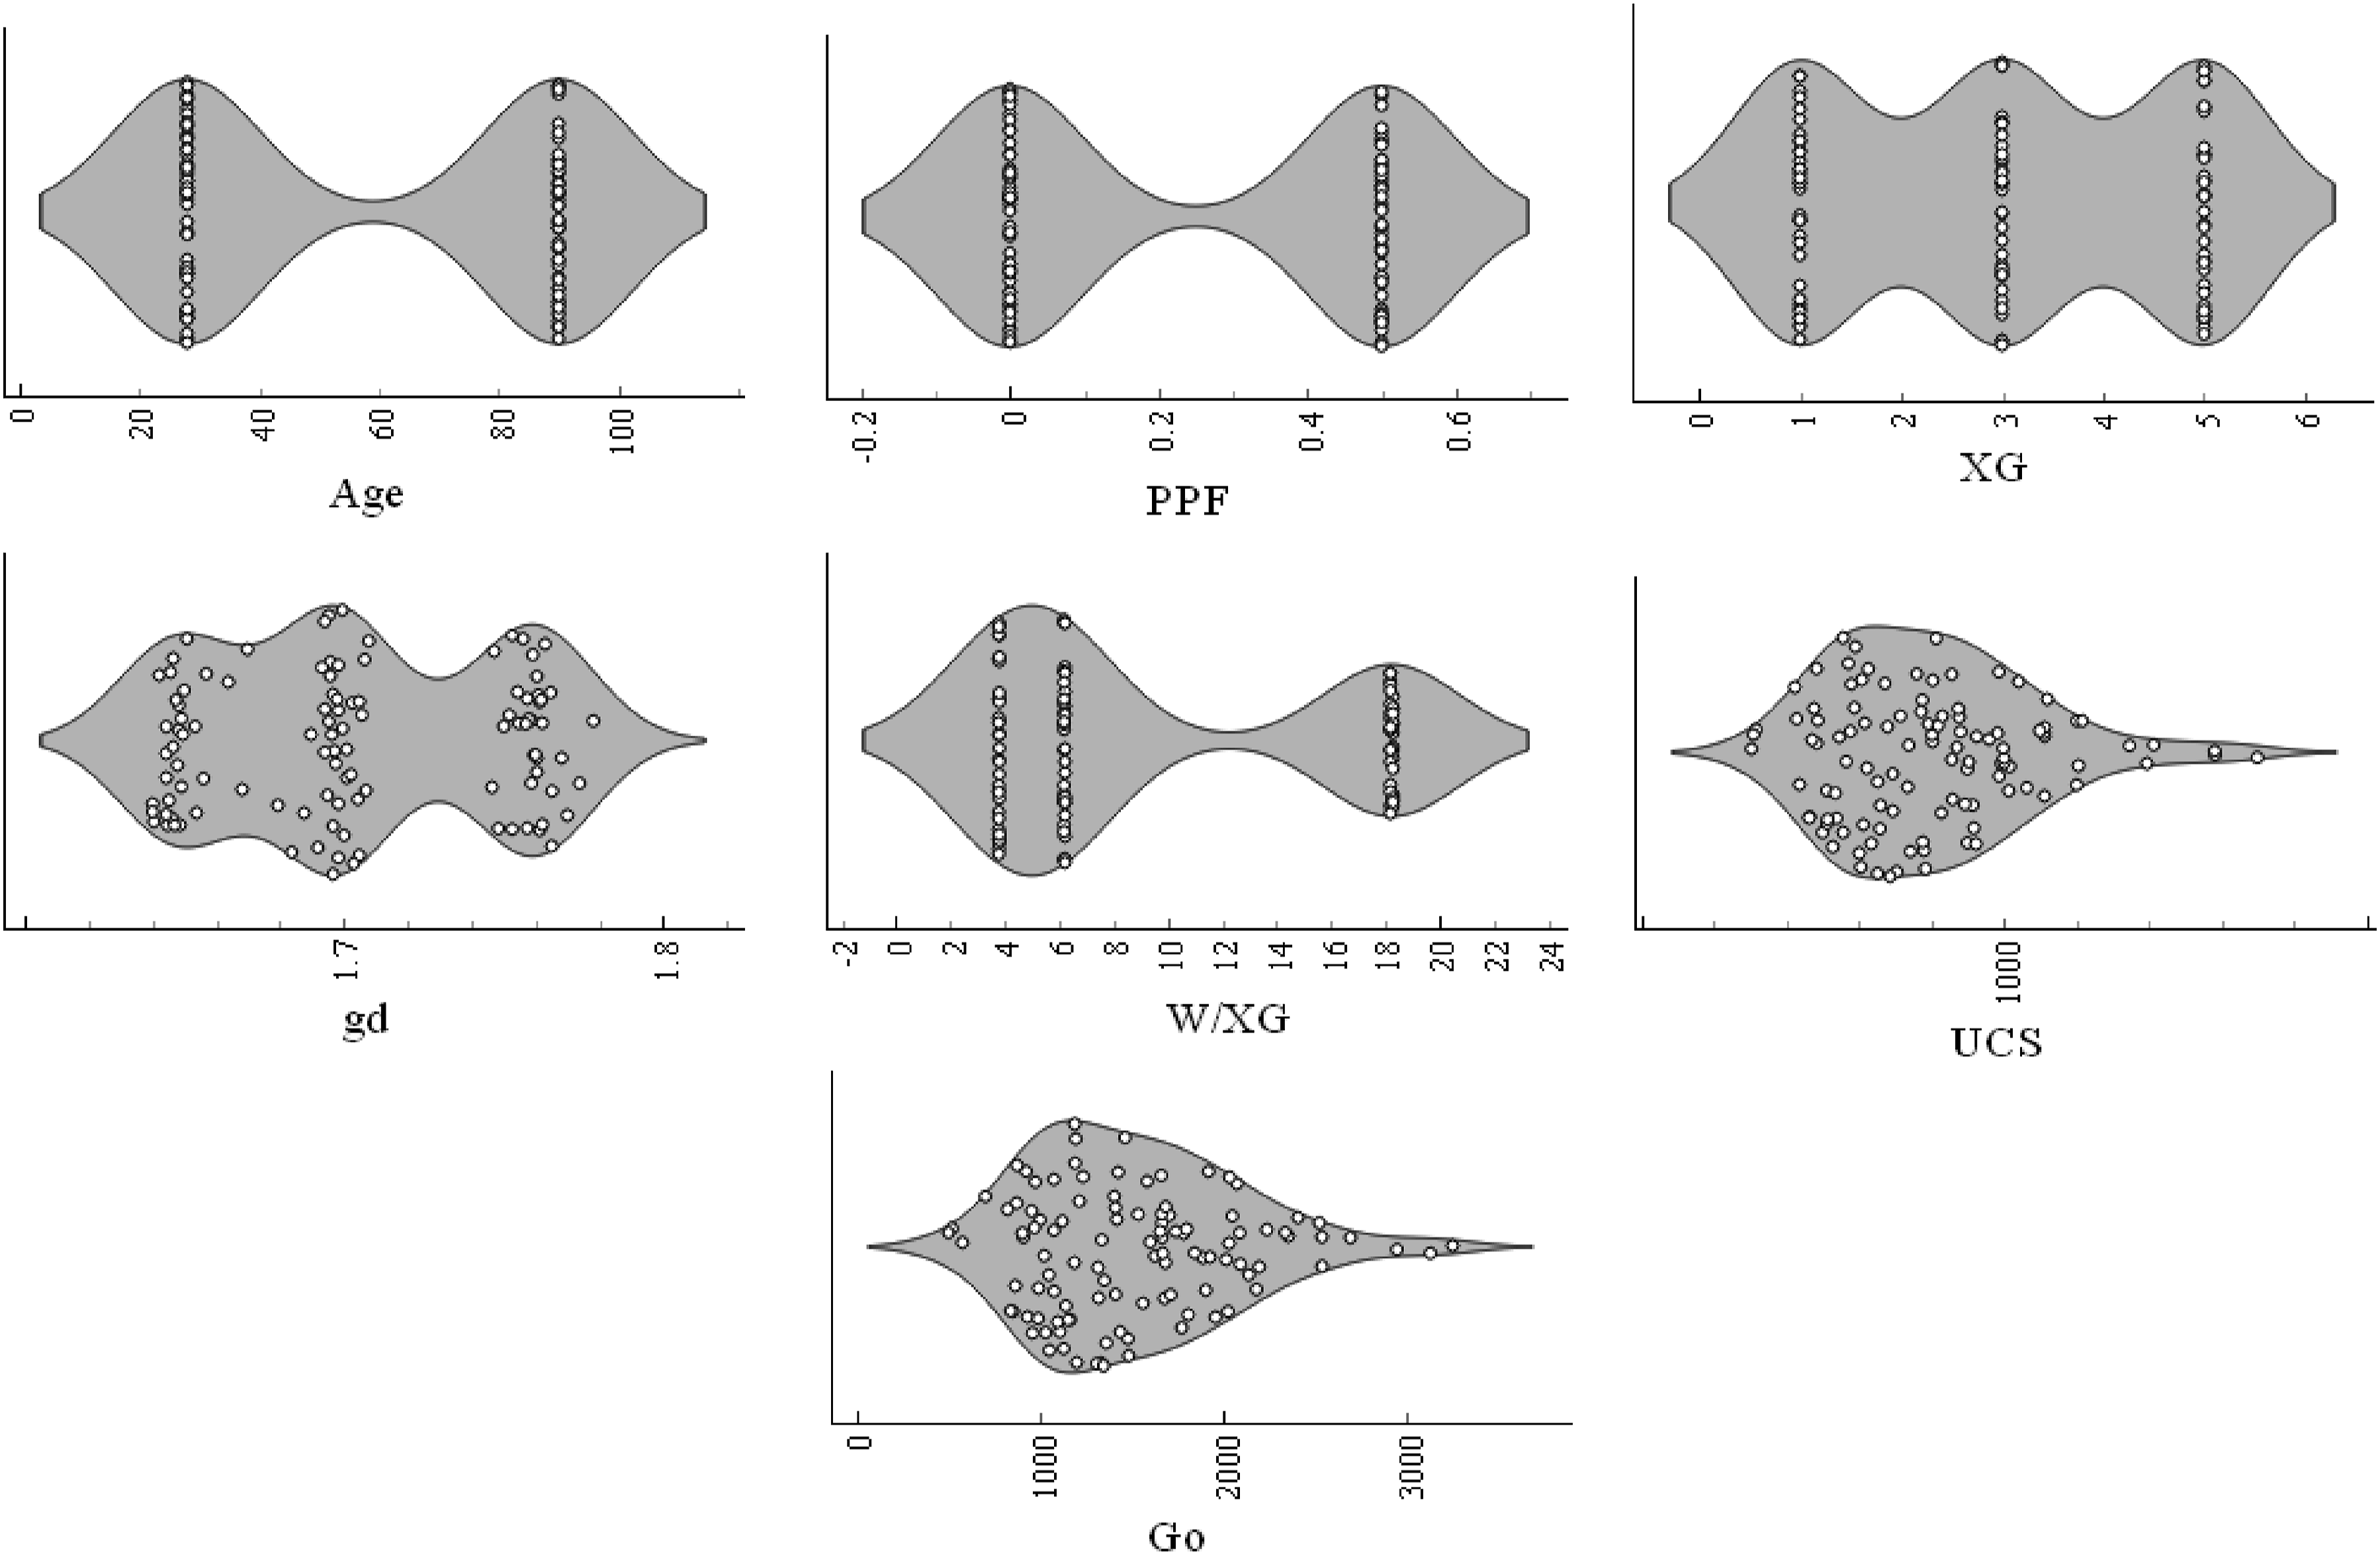
Violin distribution for each input.
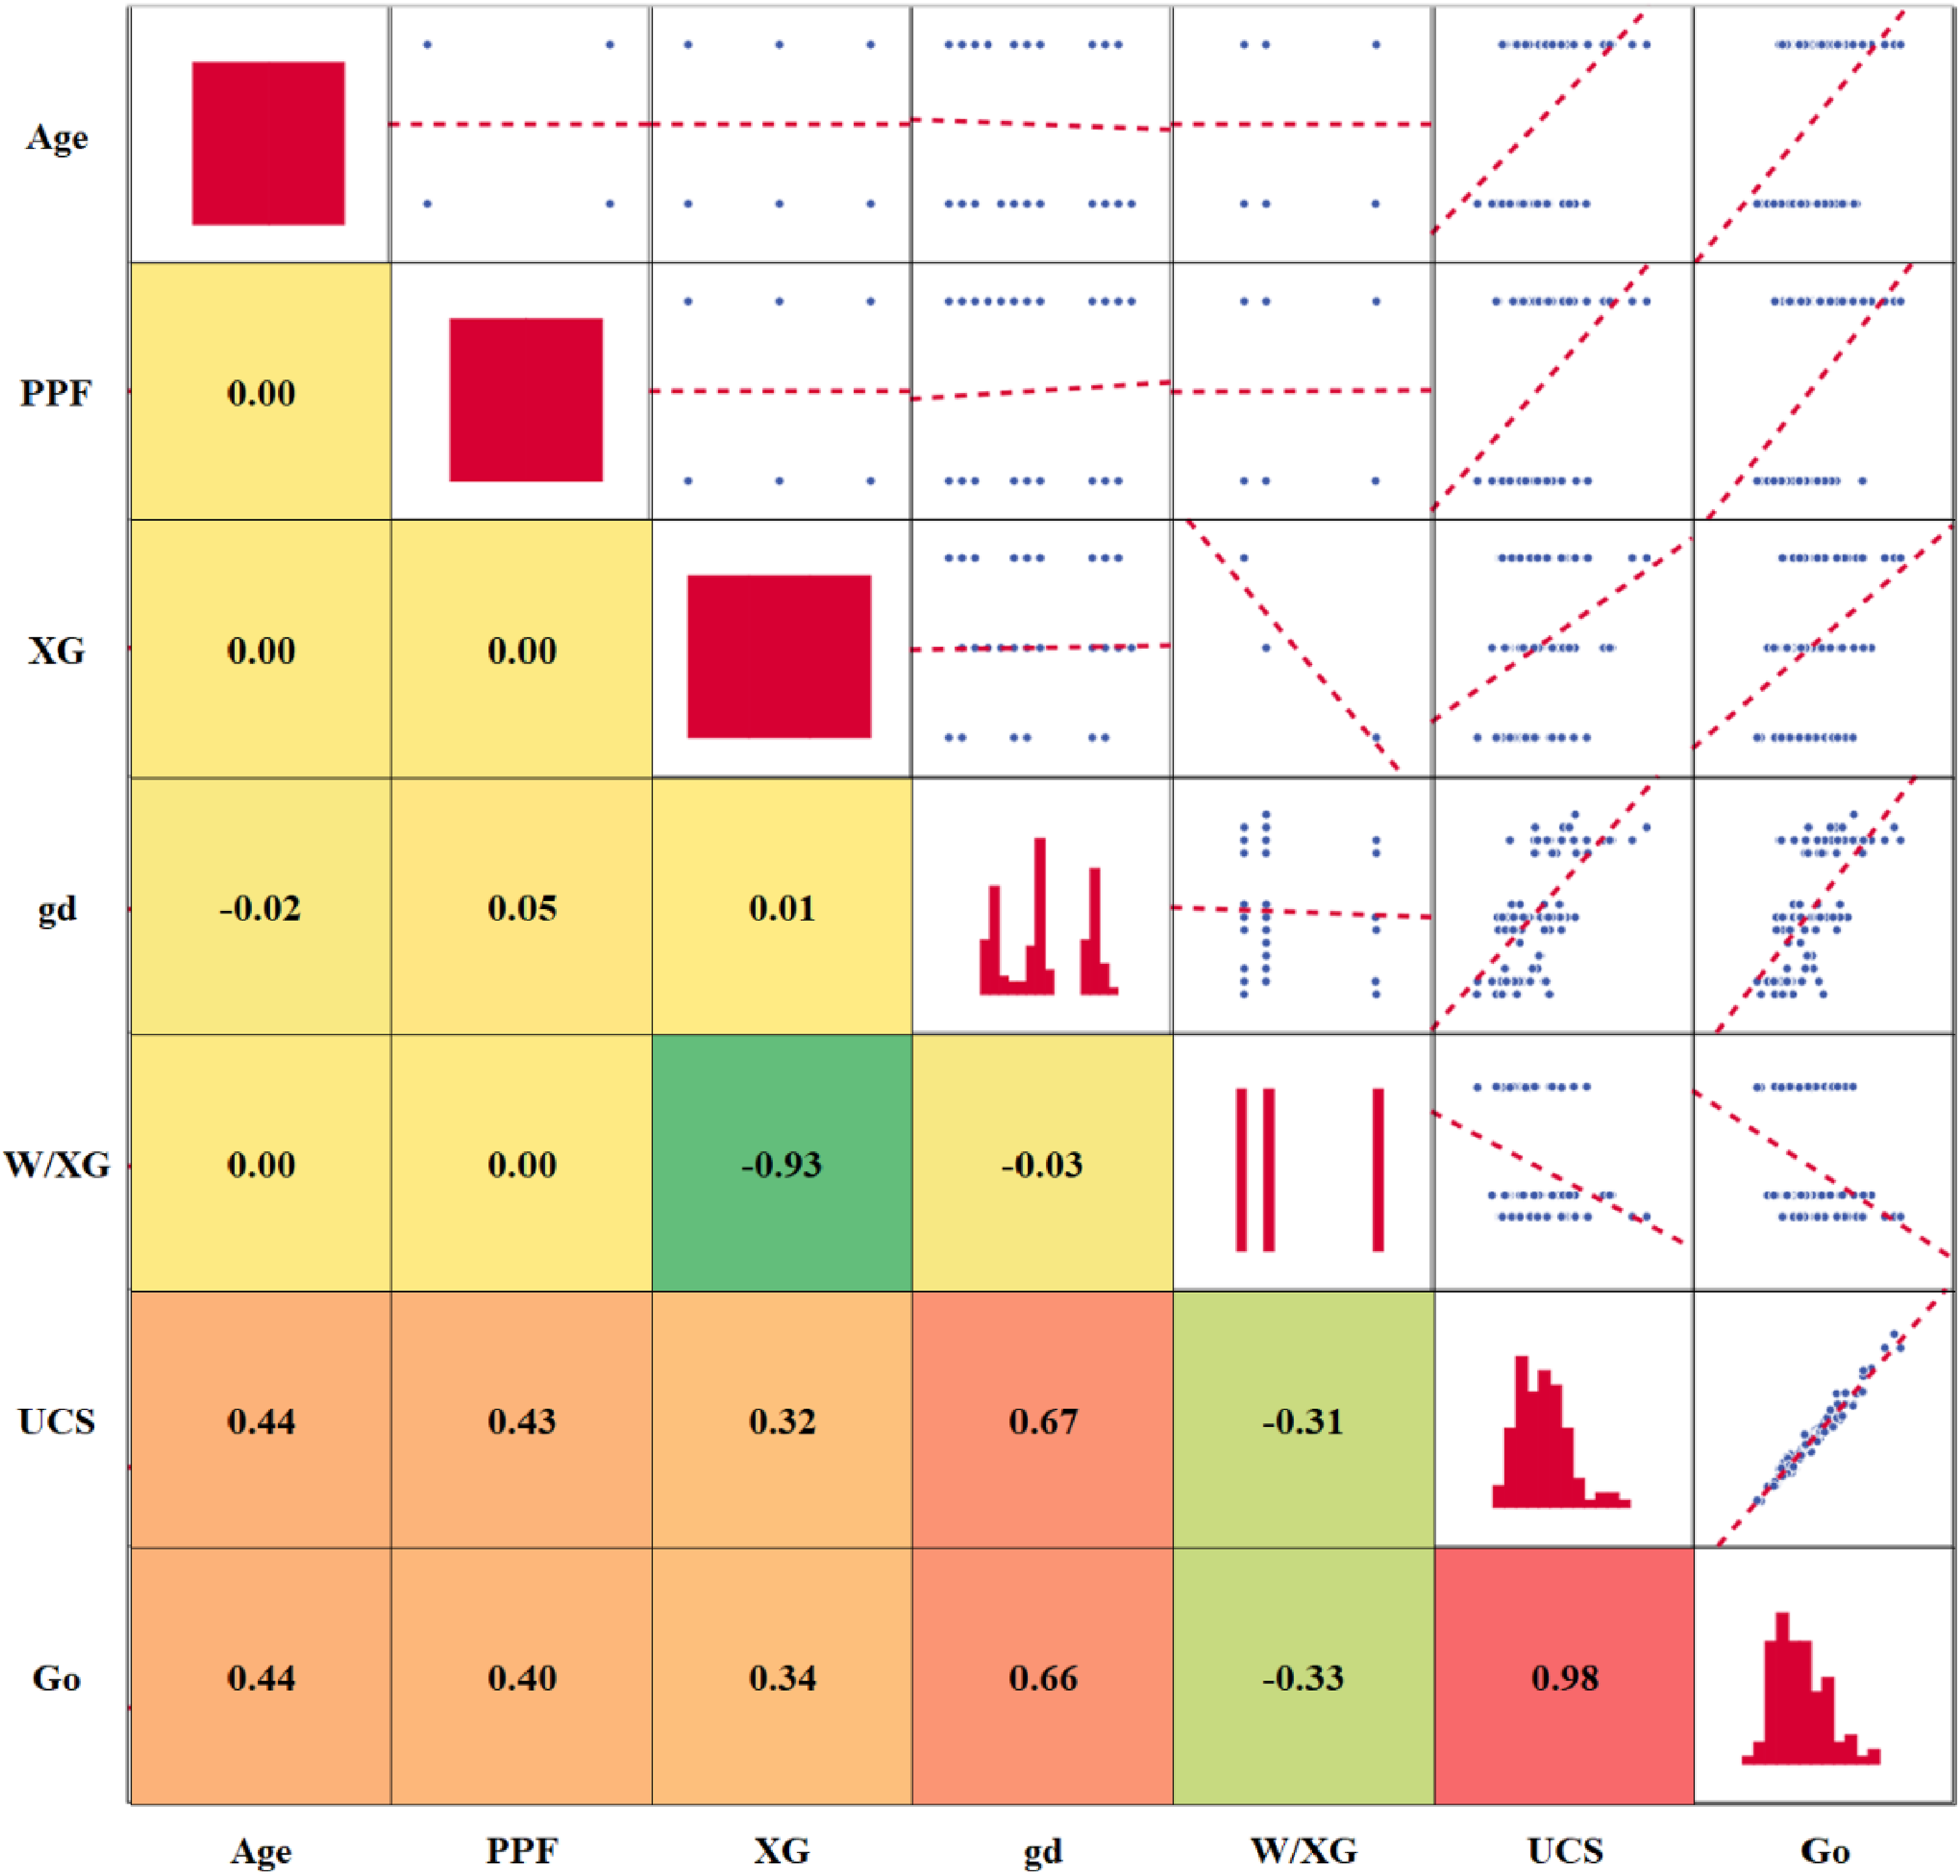
Correlation, distribution and interpreting chart.
4.2. Research program
Six different ML models were used to predict the UCS & Go using the collected database. “Decision Table” (DT) technique was used to develop all the models. However, for each model, a different optimization technique was used to optimize the hyper-parameters of the (DT) model. These optimization techniques are “Bat research algorithm (Bat)”, “Cuckoo research algorithm (Cuckoo), “Elephant research algorithm (Elephant), “FireFly research algorithm (FireFly)”, “Rhinoceros research algorithm (Rhino)” and “GrayWolf research algorithm” (Wolf). The Decision Table (DT) approach was selected as the base learner due to its interpretability, computational efficiency, and suitability for relatively small datasets, which are typical in geotechnical studies where extensive laboratory testing is costly and time-consuming. Unlike advanced models such as gradient boosting or deep neural networks, DT provides a transparent structure that enables clear understanding of how input parameters influence soil behavior, thereby supporting practical decision-making in engineering applications. While more complex models may achieve slightly higher predictive accuracy, they often require large training datasets, extensive hyperparameter tuning, and operate as “black-box” systems, limiting their usability in practice. By enhancing the DT framework with bio-inspired optimization algorithms, the present study achieves competitive predictive performance while retaining simplicity, robustness, and interpretability, making it highly applicable for real-world geotechnical engineering problems. All the models were created using “Weka Data Mining” software version 3.8.6. The machine learning models in this study were developed and evaluated using the WEKA Data Mining software (version 3.8.6), an open-source platform widely applied in academic research for predictive analytics. WEKA provides an extensive library of algorithms for classification, regression, and optimization, along with a user-friendly graphical interface that facilitates model training, testing, and performance comparison. Its integrated environment allowed efficient implementation of the Decision Table base learner combined with six bio-inspired optimization algorithms, ensuring consistent model evaluation under standardized conditions. The choice of WEKA was motivated by its accessibility, reproducibility, and proven reliability in handling small to medium-sized datasets, which aligns well with the experimental soil data used in this research.
4.3. Theoretical framework
4.3.1. Bat research algorithm (Bat)
The Bat algorithm is a bio-inspired metaheuristic optimization technique developed by Xin-She Yang in 2010. It is based on the echolocation behavior of microbats that navigate and hunt prey using sound pulses. Each virtual bat in the algorithm represents a potential solution and updates its position and velocity using frequency, loudness, and pulse emission rates, which mimic real bat behavior. In the algorithm, frequency controls the pace of convergence, loudness regulates the degree of exploration versus exploitation, and pulse rate determines the probability of local search. Initially, the bats explore widely with higher loudness and lower pulse rates. As iterations proceed, loudness decreases while pulse emission rate increases, enabling a finer search near the best solution. The Bat algorithm is advantageous in handling complex, nonlinear, and high-dimensional problems due to its balance between global and local search capabilities. It has been applied successfully in engineering design, feature selection, and hyperparameter tuning. In this study, it was used to optimize the hyperparameters of the Decision Table model, enhancing the model’s ability to predict UCS and Go accurately by minimizing error metrics such as RMSE and MSE.
4.3.2. Cuckoo research algorithm (Cuckoo)
The Cuckoo Search algorithm (Cuckoo) is a metaheuristic optimization technique developed by Xin-She Yang and Suash Deb in 2009, inspired by the brood parasitism behavior of certain cuckoo species. These birds lay their eggs in the nests of other host birds, often replacing the host’s eggs. The algorithm mimics this behavior, where each cuckoo represents a solution, and the process of laying eggs corresponds to generating new solutions. Cuckoo Search employs Lévy flights to explore the solution space, enabling long jumps that help escape local optima and promote global exploration. A fraction of the worst nests is replaced with new solutions in each iteration, simulating host birds discovering alien eggs and abandoning nests. The algorithm balances exploration and exploitation effectively through this mechanism. In the present research, the Cuckoo algorithm was utilized to optimize the hyperparameters of the Decision Table model for predicting the unconfined compressive strength (UCS) and small-strain stiffness (Go) of Xanthan gum and polypropylene fiber-treated clay. It yielded high predictive accuracy, with low error metrics and high R2 values, demonstrating its robustness and suitability for geotechnical data modeling.
4.3.3. Elephant research algorithm (Elephant)
The Elephant Herding Optimization (EHO) algorithm, often referred to as the Elephant Research Algorithm (Elephant), is a nature-inspired metaheuristic optimization technique based on the social behavior and clan-based movement patterns of elephant herds in nature. Each herd is divided into clans, and within each clan, elephants adjust their positions based on the matriarch (leader) of the clan. A separation operator handles diversification by replacing the weakest individual (often the male elephant) with a newly generated random solution, simulating migration or expulsion from the herd. In this algorithm, exploration is achieved through inter-clan diversity while exploitation is maintained by the influence of matriarchs within clans. The balance between these two phases enhances the global search ability and prevents premature convergence. Within the context of this research, the Elephant algorithm was applied to optimize the hyperparameters of the Decision Table (DT) model to predict the unconfined compressive strength (UCS) and shear modulus (Go) of Xanthan gum and polypropylene fiber-treated clay. While the model produced acceptable prediction results, its performance was slightly lower than that of models optimized by the Cuckoo and Firefly algorithms, as seen from higher SSE, MAE, and RMSE values. Nonetheless, the Elephant algorithm provided stable convergence behavior and remains a competitive optimizer for geotechnical modeling problems involving complex input–output interactions.
4.3.4. FireFly research algorithm (FireFly)
The Firefly Research Algorithm (FireFly) is a bio-inspired metaheuristic optimization technique modeled after the flashing behavior of fireflies. It assumes that each firefly is attracted to others based on their brightness, where brightness corresponds to the fitness of a solution. Less bright fireflies move toward brighter ones, and the attractiveness decreases with distance, allowing the swarm to explore the search space efficiently. The FireFly algorithm is characterized by its simplicity, strong global search capability, and fast convergence speed. It efficiently balances exploration and exploitation by adjusting attractiveness and random movement parameters, which helps avoid local minima and ensures broader solution space coverage. In this research, the FireFly algorithm was employed to optimize the hyperparameters of the Decision Table (DT) model used to predict the unconfined compressive strength (UCS) and shear modulus (Go) of Xanthan gum and polypropylene fiber-reinforced clay. Among all the six optimization strategies applied, the DT-FireFly model produced the best results in both training and validation phases. It achieved the lowest errors (MAE and RMSE), highest R2 values (up to 0.99), and superior performance indices such as WI, NSE, and KGE. This outstanding performance highlights the FireFly algorithm’s effectiveness in enhancing model accuracy and reliability, making it highly suitable for sustainable geotechnical design optimization tasks.
4.3.5. Rhinoceros research algorithm (Rhino)
The Rhinoceros Research Algorithm (Rhino) is a nature-inspired optimization algorithm that simulates the group behavior and movement dynamics of rhinoceroses in their natural habitat. It mimics their strategic navigation through complex terrain, using both individual exploration and group-following mechanisms to locate optimal solutions. The algorithm balances intensification and diversification by allowing candidate solutions (rhinos) to explore locally and globally, adapting based on position updates influenced by the best-performing members of the group. In this study, the Rhino algorithm was applied to optimize the hyperparameters of the Decision Table (DT) model for predicting the unconfined compressive strength (UCS) and shear modulus (Go) of Xanthan gum and polypropylene fiber-reinforced clay. The performance of the DT-Rhino model, while demonstrating moderate reliability, was outperformed by other optimization strategies such as FireFly and Cuckoo. The DT-Rhino model showed higher errors and lower R2 values (0.80–0.88), with higher SMAPE and lower indices like WI, NSE, and KGE, indicating a less efficient fit and prediction accuracy. Despite this, the Rhino algorithm still contributed to model development by enabling robust convergence and solution diversity. Its use demonstrates the potential for further refinement in future studies, particularly when integrated with hybrid optimization frameworks or adapted for problem-specific parameter tuning in geotechnical modeling tasks.
4.3.6. GrayWolf research algorithm (Wolf)
The GrayWolf Research Algorithm (Wolf) operates as a population-based, metaheuristic optimization technique inspired by the pack behavior and hierarchical leadership dynamics of gray wolves in nature. In computational terms, the method mimics the roles of alpha, beta, delta, and omega wolves to iteratively guide candidate solutions toward an optimal region of the search space. This is achieved through mechanisms such as encircling prey (representing the objective), social cooperation, and convergence behaviors that help balance the critical tasks of exploration and exploitation during the optimization process. When applied to machine learning models, particularly in the context of hyperparameter tuning, the Wolf algorithm demonstrates a robust capacity to escape local optima and efficiently navigate complex, nonlinear solution spaces. In the present study, it was employed to optimize the Decision Table model parameters for predicting geotechnical behavior of Xanthan gum and fiber-treated clay. This integration facilitated a more adaptive learning framework, reducing overfitting risks and improving generalization capabilities on both training and unseen validation data. By systematically adjusting the decision model parameters through its structured search dynamics, the GrayWolf algorithm contributed to enhanced model stability, interpretability, and accuracy across multiple performance metrics. The consistency of its optimization outcomes suggests its high utility in data-driven modeling for geotechnical applications, particularly where multi-variable interactions and nonlinear behaviors are involved.
4.3.7. Hyperparameter tuning for the bio-inspired applications
In this study, hyperparameter tuning for each bio-inspired optimizer was carefully designed to balance exploration and exploitation, ensuring robust convergence while preventing overfitting or premature stagnation. The tuning ranges were informed by prior literature, pilot experiments, and sensitivity checks conducted during the model development process. For the FireFly algorithm, the main parameters such as light absorption coefficient (γ), attractiveness (β), and randomization factor (α) were tuned within the ranges γ = 0.1–1.0, β = 0.2–1.0, and α = 0.1–0.9, allowing the swarm to adaptively search the solution space. The stopping criterion was defined as either convergence to a stable fitness value over 50 consecutive iterations or reaching a maximum of 500 iterations, whichever came first. The Cuckoo Search optimizer relied on its discovery rate of alien eggs (pa) and step size scaling (α), with pa varied between 0.1 and 0.3 and α tuned between 0.5 and 1.5 to regulate the balance between local intensification and global diversification. The algorithm was terminated once no significant improvement in the fitness function was observed for 40 successive generations or after 500 iterations. For the Wolf optimizer, critical hyperparameters included the number of wolves in the pack, the coefficient vectors (A and C), and the convergence constant (a). The pack size was set between 10 and 30, while the control parameter a was reduced linearly from 2 to 0 during iterations to facilitate exploration at the start and exploitation at the end. The process was stopped once the fitness curve plateaued over 30 iterations or the iteration cap of 500 was reached. In the case of the Elephant Herding Optimization, parameters such as clan size and separation factor were tuned. Clan size ranged between 5 and 15, and the separation parameter was tested between 0.1 and 0.5. The algorithm was run until the improvement rate of the objective function dropped below 10-3 for 50 consecutive iterations or until 400 iterations were completed. The Bat algorithm tuning involved adjusting the loudness (A), pulse emission rate (r), and frequency range (f). Loudness was initialized between 0.5 and 1.0, r increased adaptively from 0 to 1 during the search, and f was varied within 0–2. The algorithm terminated when average loudness fell below 10-4 or after 500 iterations, whichever condition was satisfied earlier. Finally, the Rhino optimizer employed fewer but impactful parameters, including population size, learning coefficients, and a control factor that managed exploitation. The population was set between 20 and 40 individuals, with coefficients tuned between 1.0 and 2.0. The stopping criterion was defined by stagnation of fitness improvement over 50 iterations or exhaustion of the maximum 500 iterations. Across all optimizers, the dual-stopping strategy of fitness stagnation and maximum iteration count ensured computational efficiency while safeguarding against overfitting. This structured tuning process enabled the models to achieve strong convergence behavior and reliable predictive accuracy.
4.4. Performance indices
The performance accuracies of developed models were evaluated by comparing SSE, MAE, MSE, RMSE, Error (%), Accuracy (%), R2, R, WI, NSE, KGE and SMAPE between predicted and calculated values. In evaluating the performance of machine learning models used for predicting geotechnical parameters such as unconfined compressive strength (UCS) and shear wave modulus or stiffness (Go), a range of statistical and error metrics are employed to assess both the accuracy and efficiency of the models. Each metric provides a different perspective on model performance. Sum of Squared Errors (SSE) quantifies the total deviation of predicted values from the observed values by summing the squares of all residuals. A lower SSE indicates that the model predictions are closer to actual values. Mean Absolute Error (MAE) measures the average magnitude of errors in a set of predictions, without considering their direction. It is a straightforward indicator of prediction accuracy, where lower values signify better model performance. Mean Squared Error (MSE) takes the average of the squared differences between predicted and actual values, penalizing larger errors more heavily, making it sensitive to outliers. Root Mean Squared Error (RMSE) is the square root of MSE, providing an interpretable metric in the same unit as the output variable, which helps in understanding the spread of prediction errors. Error percentage (%) expresses the relative error between predicted and actual values as a percentage, offering a normalized comparison that aids in benchmarking across different datasets. Accuracy percentage (%) measures how close the predictions are to the actual values, commonly derived from one minus the error percentage, and is widely used to provide an intuitive measure of model success. The coefficient of determination (R2) explains the proportion of variance in the dependent variable that is predictable from the independent variables. An R2 value close to 1 indicates that a large proportion of the variance has been captured by the model. The correlation coefficient (R) measures the strength and direction of the linear relationship between predicted and actual values. A higher R value, closer to 1, implies a strong positive correlation, indicating reliable predictions. Willmott’s Index of Agreement (WI) is another comprehensive metric that evaluates the degree of model prediction error compared to the observed variance. It ranges from 0 to 1, with values approaching 1 representing better agreement between predicted and observed values. The Nash–Sutcliffe Efficiency (NSE) compares the predictive power of the model to the mean of the observed data. An NSE close to 1 means the model is highly efficient, while values below zero indicate poor performance. Kling-Gupta Efficiency (KGE) integrates correlation, bias, and variability components into a single performance indicator, offering a balanced measure of both precision and accuracy. It is particularly useful for hydrological and geotechnical applications where all three components are critical. Finally, the Symmetric Mean Absolute Percentage Error (SMAPE) is a normalized version of the MAE that accounts for both predicted and actual values in the denominator, making it more robust to scale and providing balanced error measurement even when values are small. Together, these metrics provide a comprehensive evaluation of the predictive accuracy, robustness, and reliability of machine learning models used in soil behavior prediction, supporting more confident decision-making in sustainable geotechnical design. The definition of each used measurement is presented in Eq. (1) to (11).







4.5. Hoffman & Gardener and SHAP sensitivity analyses
The Hoffman & Gardener sensitivity analysis and SHAP (SHapley Additive exPlanations) analysis represent two distinct methodological approaches for evaluating the influence of input variables on model predictions, both contributing to model transparency and interpretability, but grounded in different principles. The Hoffman & Gardener method, developed primarily for radiological risk assessment, adopts a deterministic or variance-based framework to evaluate how changes in input variables affect the output of a model. This classical technique involves perturbing one parameter at a time while holding others constant to observe the resulting effect on model outcomes. It calculates sensitivity coefficients or relative importance percentages, helping to determine which variables exert the greatest control over the target response. In geotechnical modeling, this method is particularly useful for understanding physical dependencies in a system, offering a more mechanistic view of parameter impact based on model structure and input-output variance behavior. On the other hand, SHAP is a game-theoretic, data-driven method derived from cooperative game theory, particularly the concept of Shapley values. SHAP decomposes a model’s prediction for each instance into additive contributions from each feature, offering local and global interpretability. It attributes importance to a feature by averaging its marginal contribution across all possible combinations of features, enabling fair and consistent variable importance evaluation. In machine learning-based geotechnical prediction models, SHAP not only ranks the features but also illustrates the direction (positive or negative) and magnitude of each variable’s influence, allowing for a nuanced understanding of interactions and nonlinear effects. Together, the Hoffman & Gardener and SHAP analyses provide complementary insights. The former offers a grounded, physical-based perspective on parameter influence, while the latter delivers data-centric, model-agnostic interpretability with high resolution at both the global and individual prediction levels. Their integration strengthens confidence in model structure, helps validate the learned relationships, and supports optimized design decisions in sustainable geotechnical engineering. A preliminary sensitivity analysis was carried out on the collected database to estimate the impact of each input on the (Y) values. “Single variable per time” technique is used to determine the “Sensitivity Index” (SI) for each input using Hoffman & Gardener
23
formula as follows:
A sensitivity index of 1.0 indicates complete sensitivity, a sensitivity index less than 0.01 indicates that the model is insensitive to changes in the parameter.
5. Results and discussions
5.1. DT-Bat model
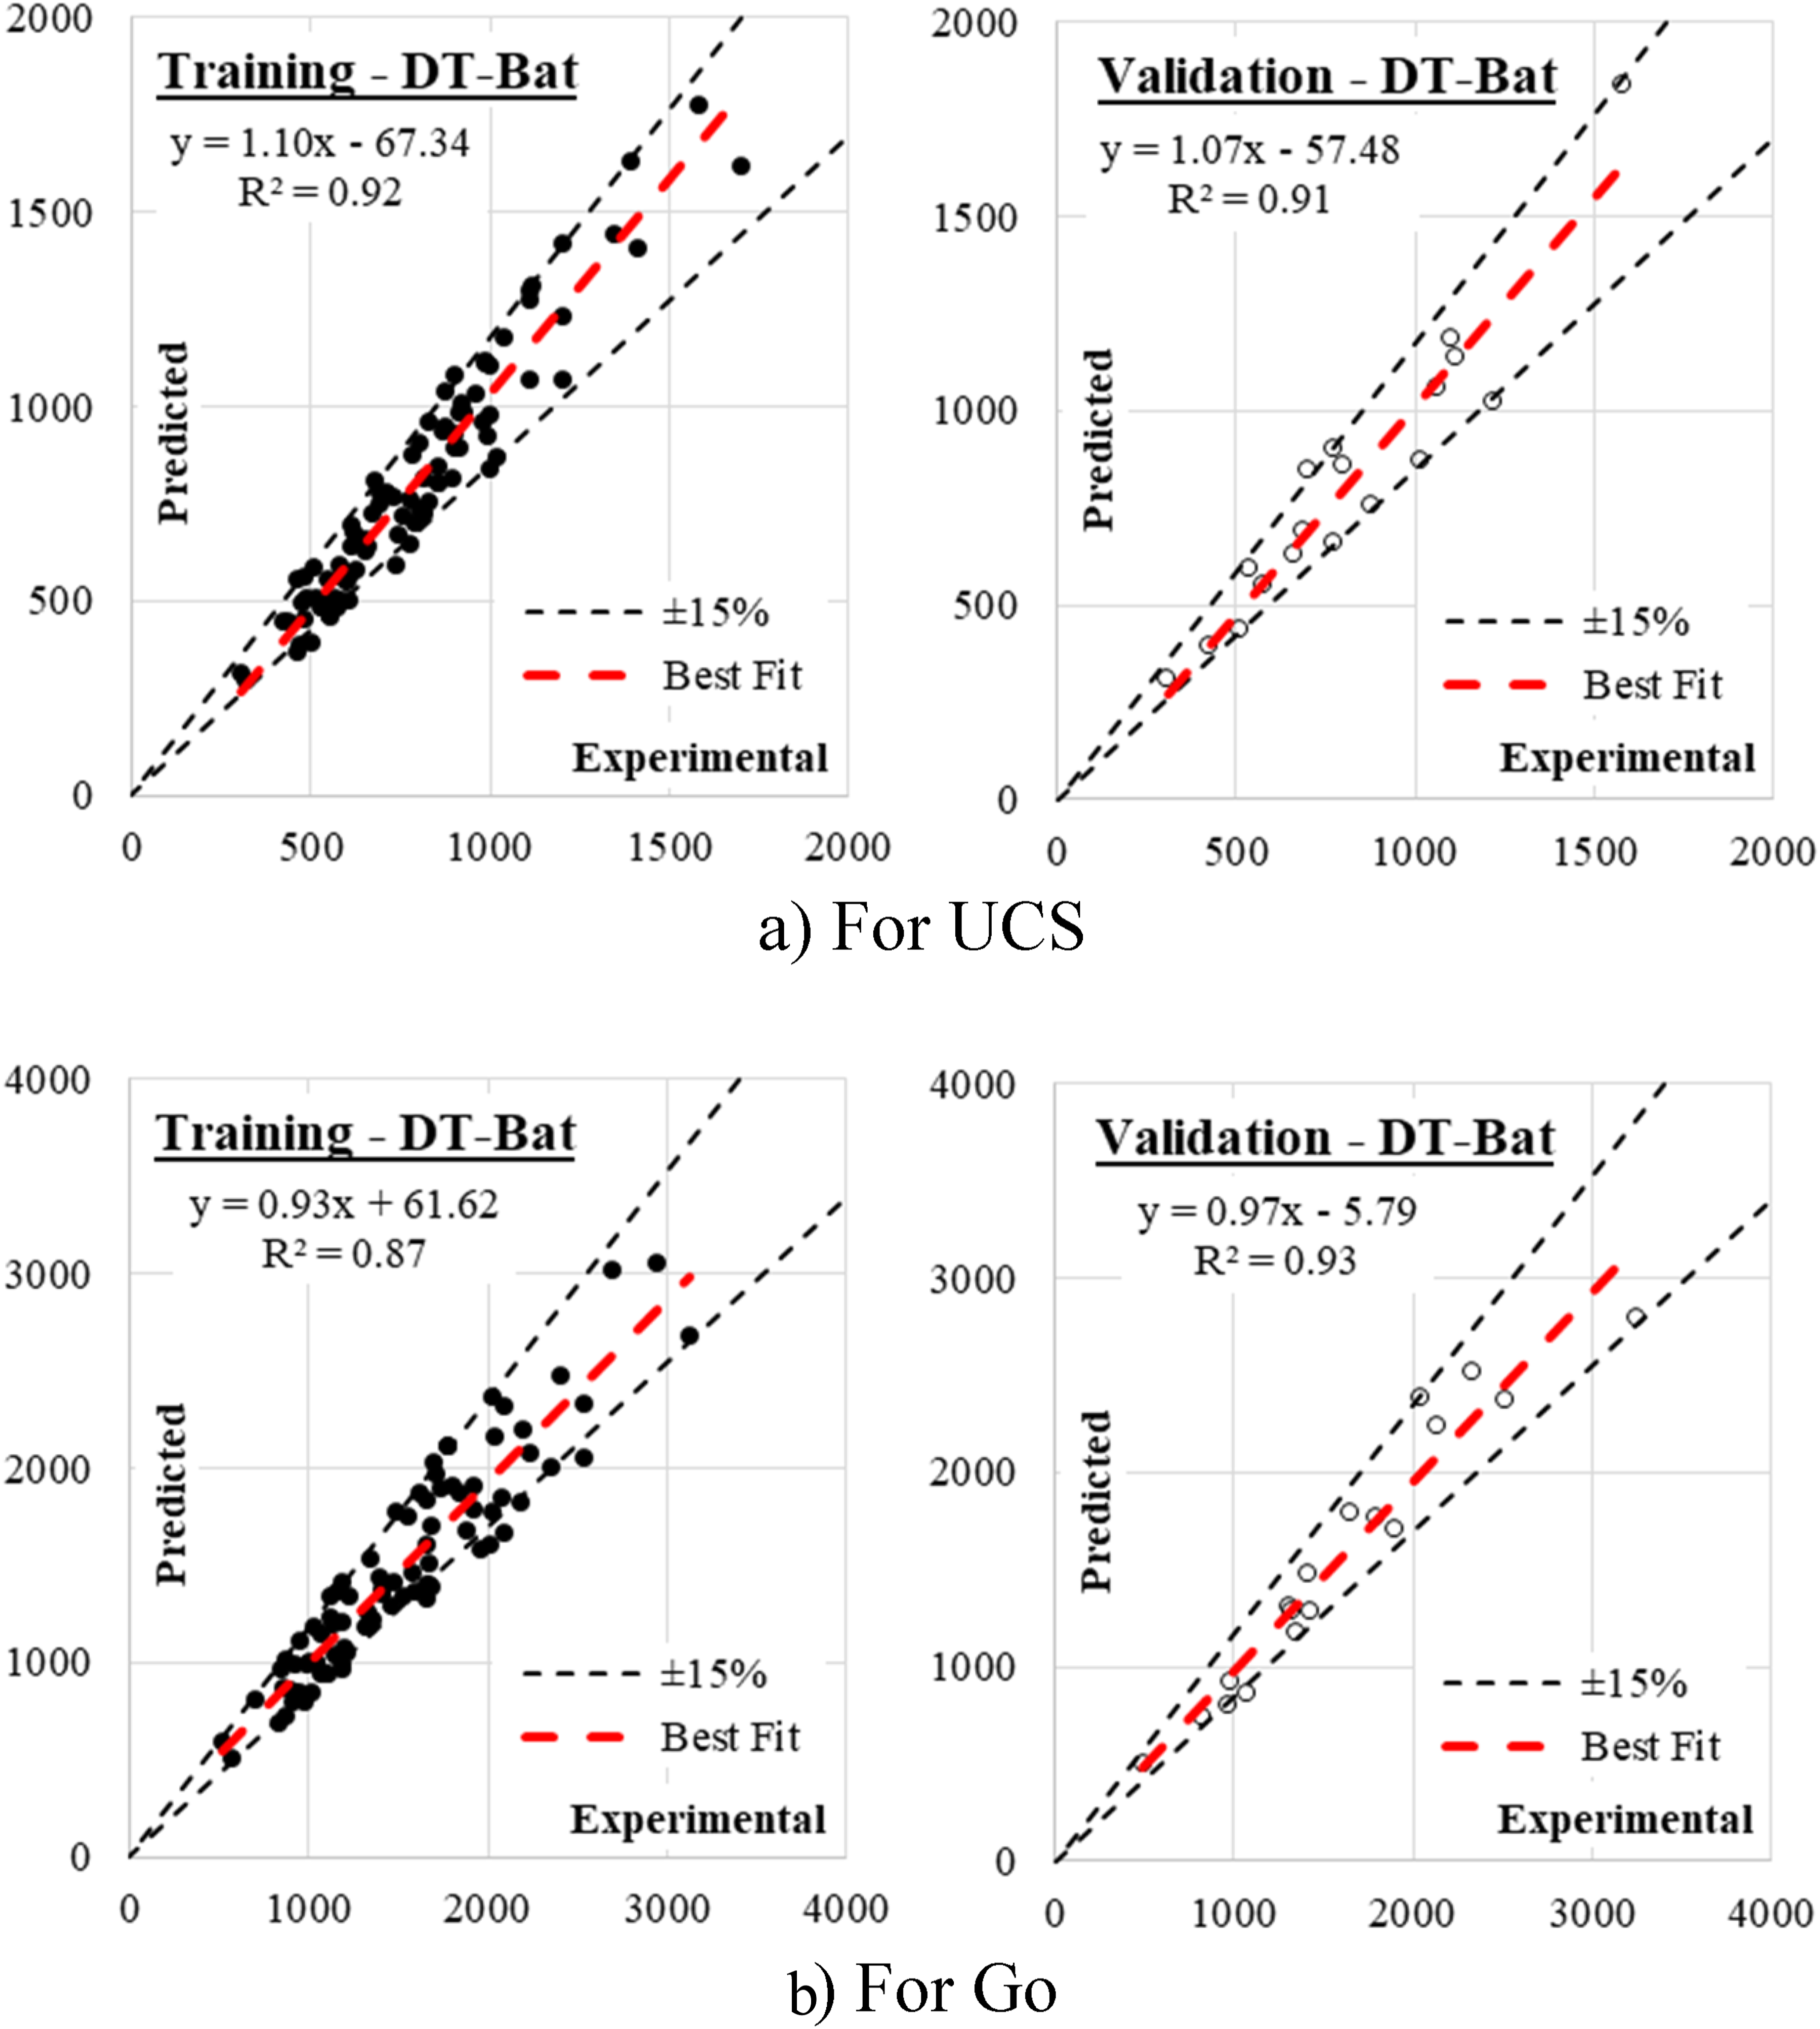
Figure 3 shows the tuned hyperparameter for the DT-Bat model protocol. The four subplots in Figure 4 display the performance of the Decision Table model optimized with the Bat algorithm (DT-Bat) in predicting the unconfined compressive strength (UCS) and the small-strain shear modulus (Go) for both training and validation datasets. The graphs plot the predicted values against the experimental values, with a red dashed line indicating the best fit line, and black dashed lines representing a ±15% error margin, which is typically used as a benchmark for acceptable predictive deviation in geotechnical modeling. For UCS prediction, the training dataset exhibits a strong linear correlation with an R2 value of 0.92 and a best fit equation of y = 1.10x – 67.34, indicating a slight overestimation trend by the model since the slope is greater than 1. The validation dataset follows closely with an R2 of 0.91 and a best fit of y = 1.07x – 57.48, also showing mild overprediction. In both cases, the majority of points fall within the ±15% range, confirming that the model generalizes well and maintains consistency outside the training data. For Go prediction, the model shows good performance as well, with R2 = 0.87 for the training set and R2 = 0.93 for the validation set. The training best fit equation y = 0.93x + 61.62 suggests a slight underestimation, while the validation fit y = 0.97x – 5.79 indicates improved alignment with the experimental values. The dense clustering of data points along the line of equality and within the ±15% bounds in both Go plots confirms high predictive accuracy and low bias. Overall, the DT-Bat model demonstrates reliable predictive performance for both strength and stiffness characteristics, with strong regression metrics and minimal deviation from experimental data, reinforcing its applicability in data-driven geotechnical design involving XG-PPF treated clays. The considered hyper-parameters of DT-Bat model. Relation between predicted and calculated values using DT-Bat. (a) For UCS. (b) For go.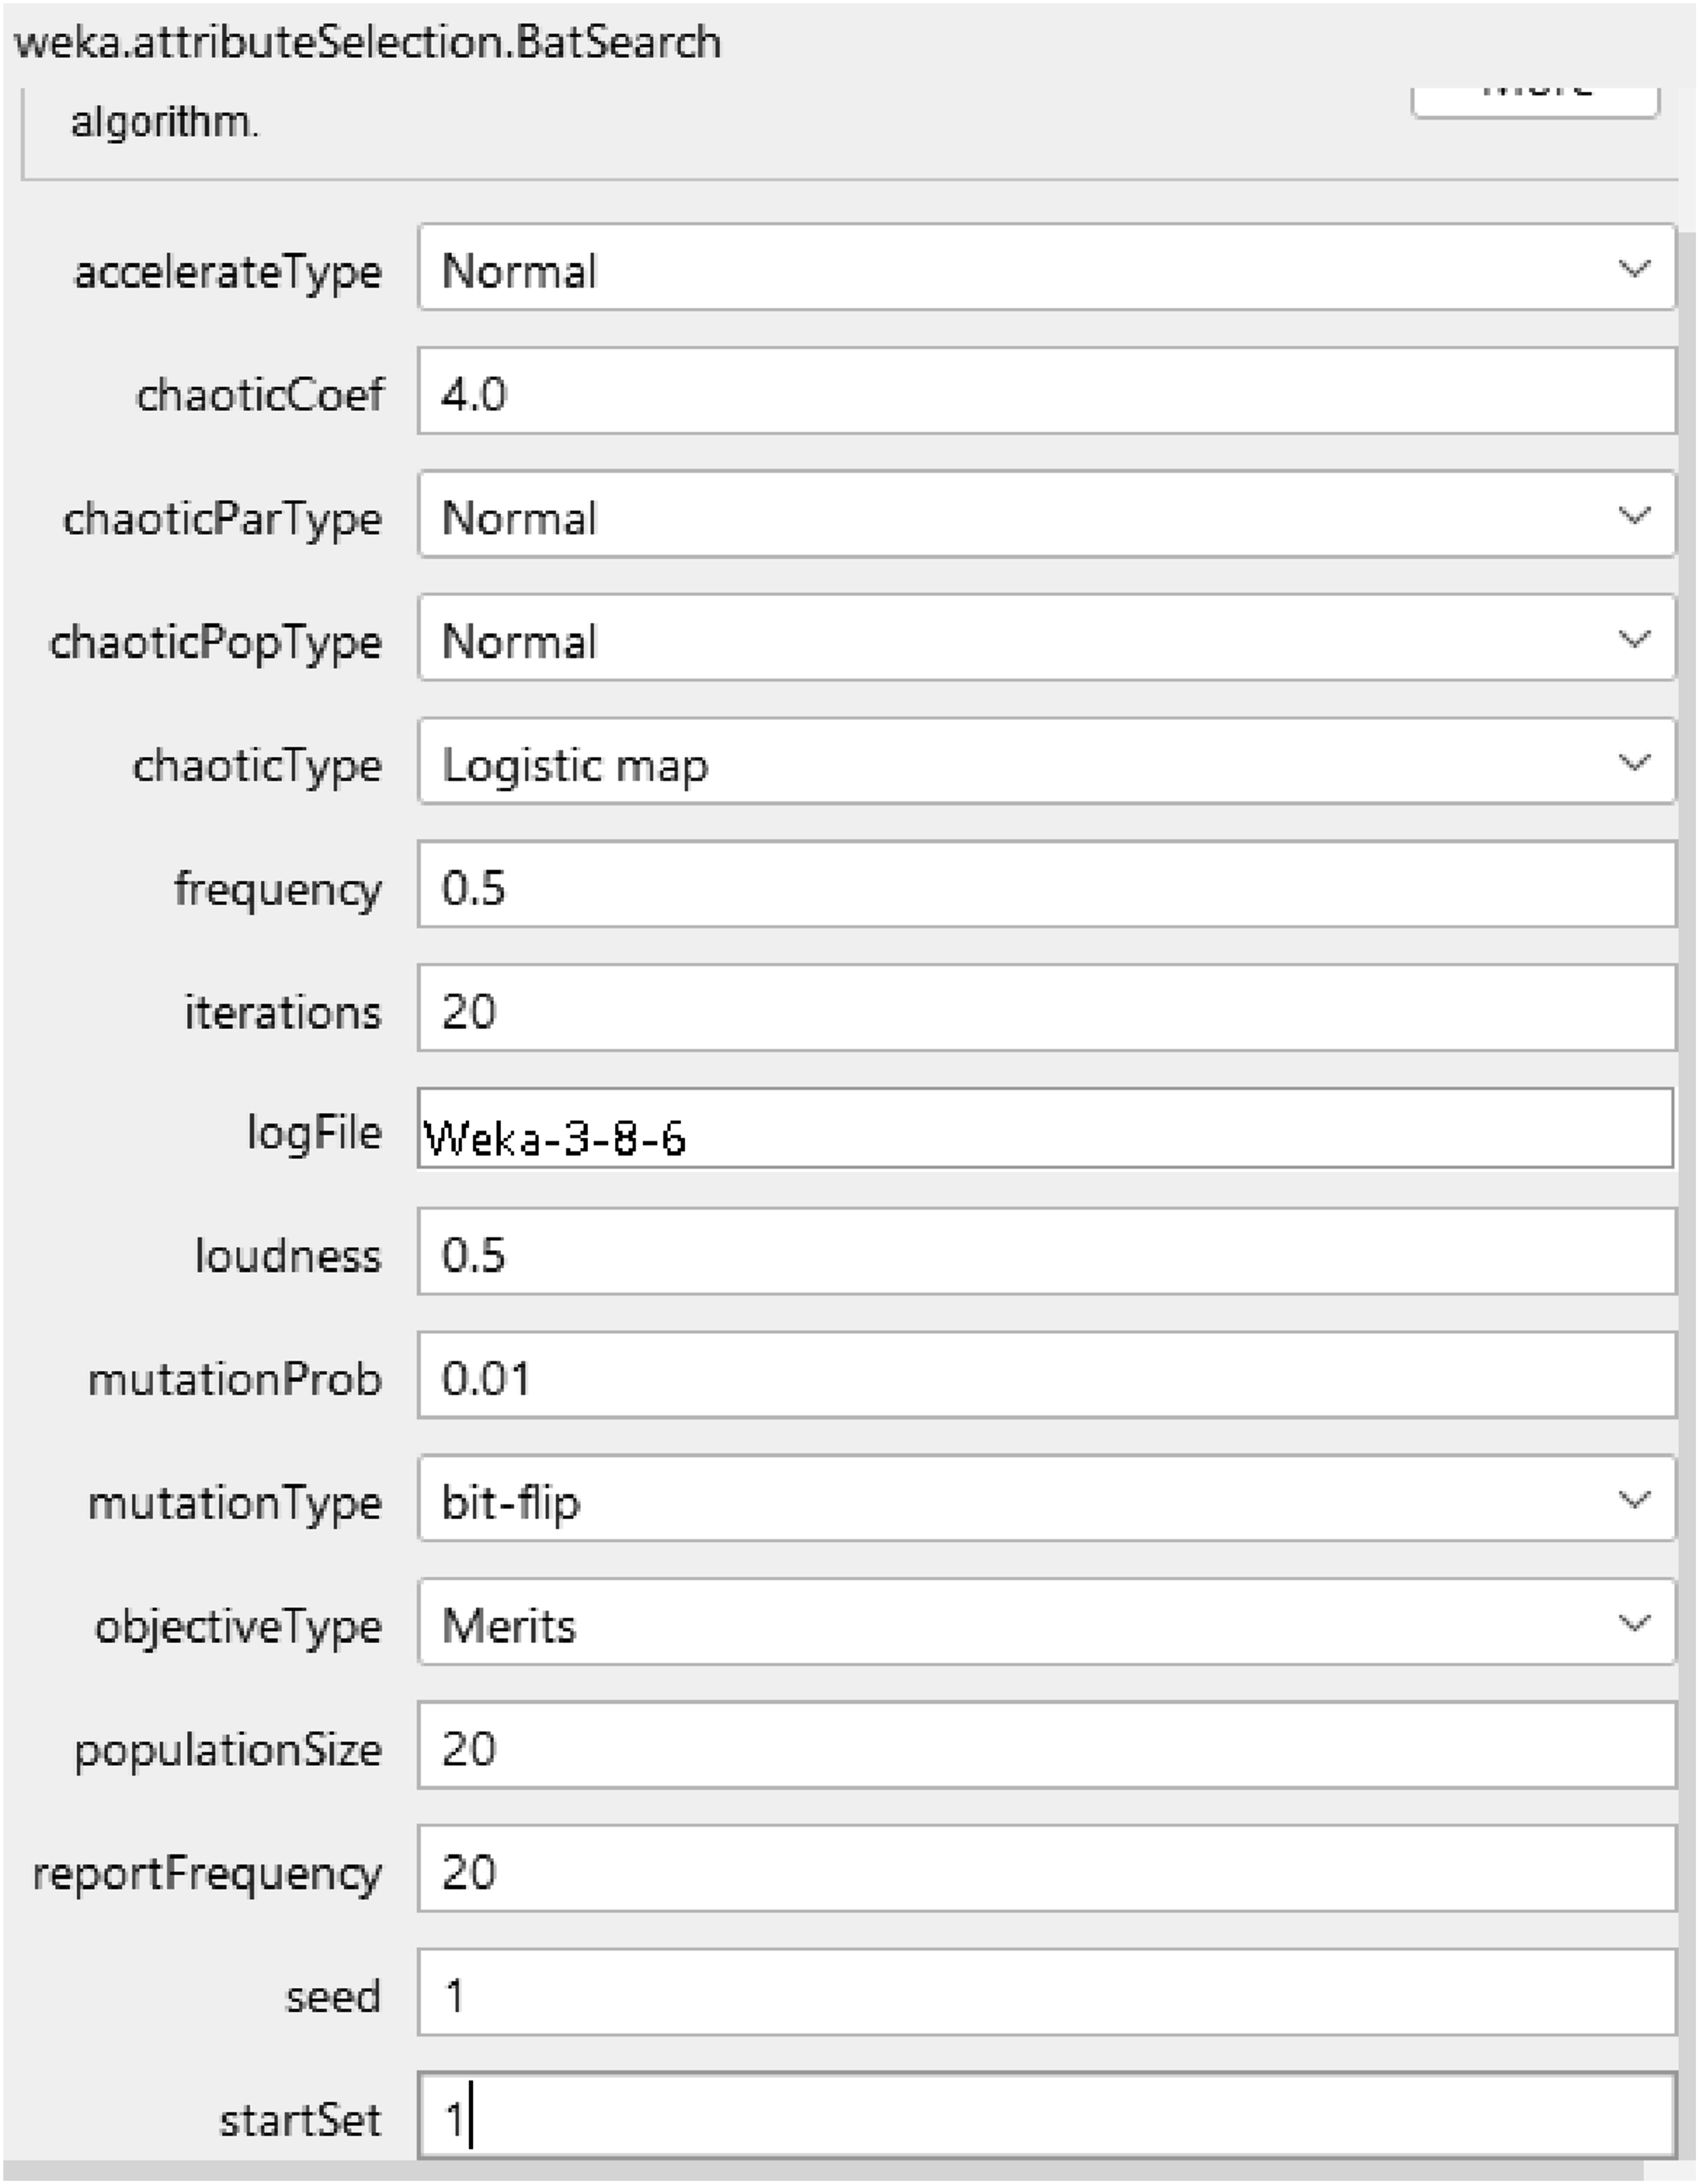
5.2. DT-Cuckoo model
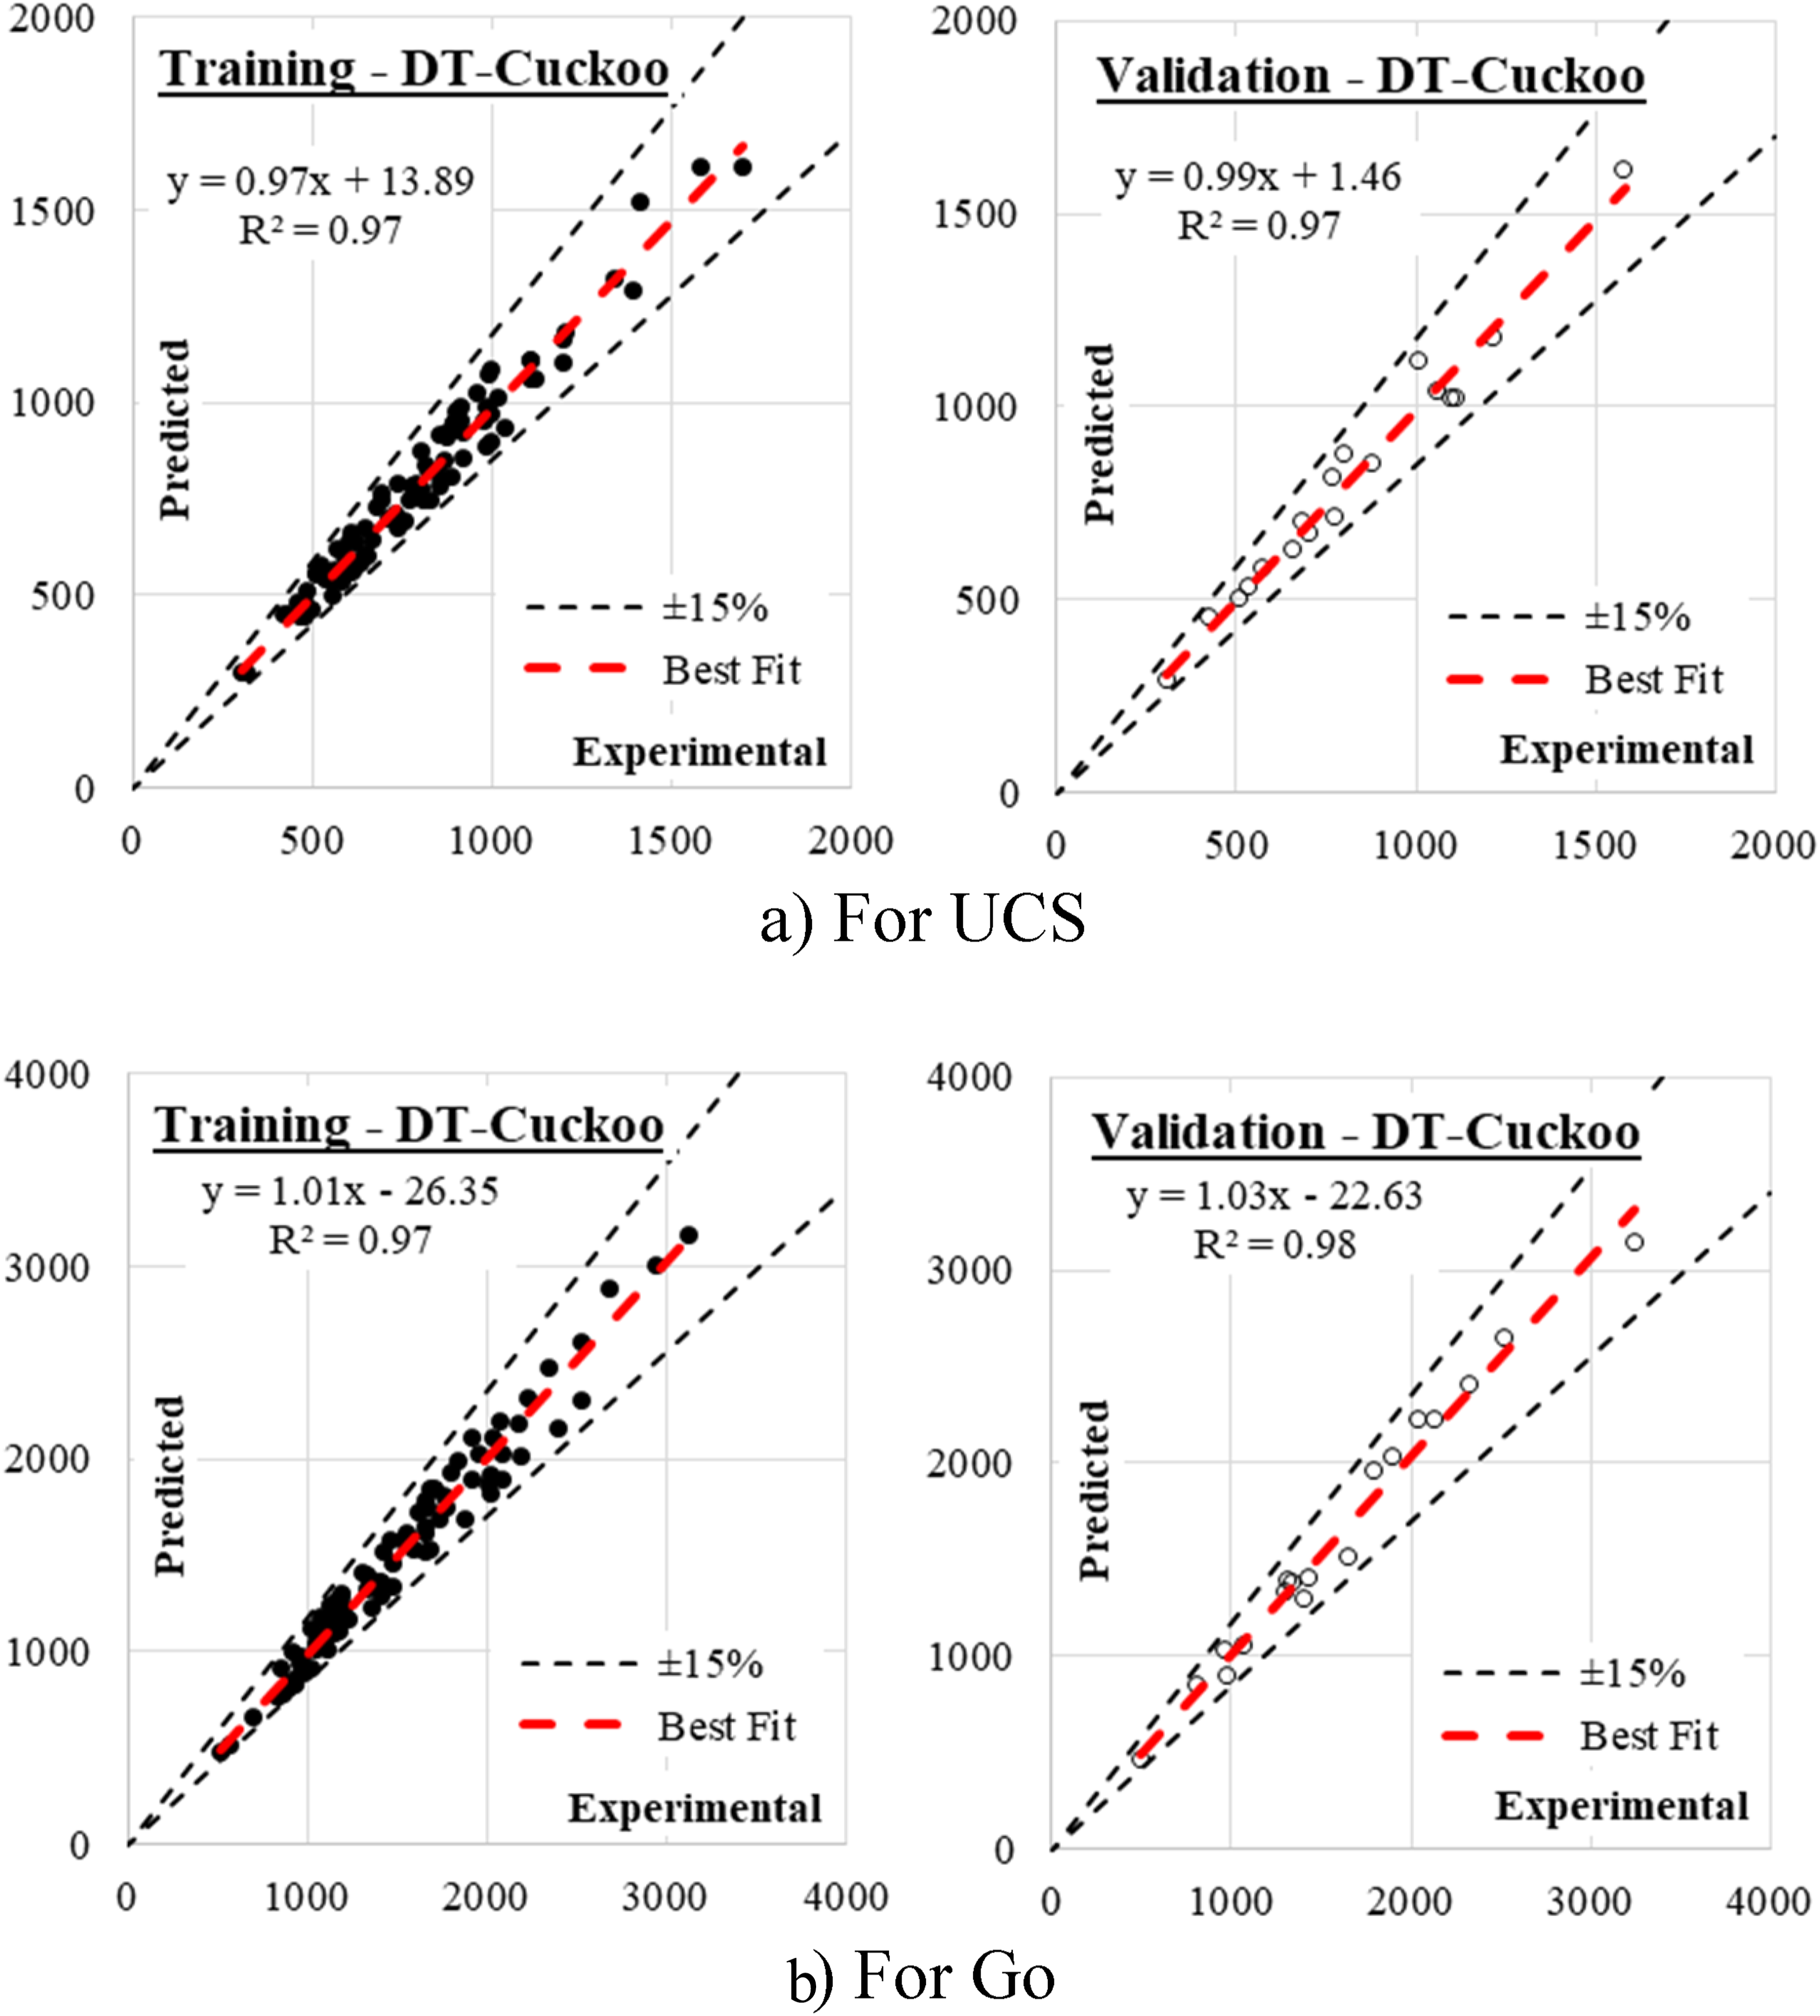
Figure 5 shows the tuned hyperparameter indices for the DT-Cuckoo model. The model graph in Figure 6 displays the relationship between predicted and experimental values for both Unconfined Compressive Strength (UCS) and GO (assumed to be a mechanical property like modulus of elasticity or a related strength parameter), using the DT-Cuckoo model. It evaluates both training and validation phases. For UCS, the training graph (top-left) shows a regression equation of y=0.97x+13.89 with an R2 value of 0.97, indicating a high level of correlation between predicted and actual values. The predicted values closely follow the experimental data line, with most points lying within the ±15% boundary, implying the model has strong predictive accuracy during training. The validation graph (top-right) displays a slightly improved linearity with a slope of 0.99 and a minor intercept of 1.46, retaining the same R2 value of 0.97. This confirms the model generalizes well beyond the training data with minimal deviation, evidenced by data points remaining mostly within the ±15% error bounds. For Go, the training phase (bottom-left) shows a regression of y=1.01x−26.35 and an R2 of 0.97, which also reflects strong agreement between predicted and experimental values. The slope being nearly one and a low intercept suggests the model is unbiased and precise in this phase. In the validation graph (bottom-right), the slope slightly increases to 1.03 with a negligible intercept of –22.63, and the R2 improves to 0.98. This enhancement in predictive strength during validation highlights the model’s exceptional capability in capturing the trends in the unseen data. Overall, the DT-Cuckoo model demonstrates robust performance in both UCS and Go prediction tasks, with high coefficients of determination, near-unity slopes, and low bias in both training and validation. The clustering of data around the best-fit line within the ±15% bounds further affirms its reliability and consistency across both datasets. The considered hyper-parameters of DT-Cuckoo model. Relation between predicted and calculated values using DT-Cuckoo. (a) For UCS. (b) For go.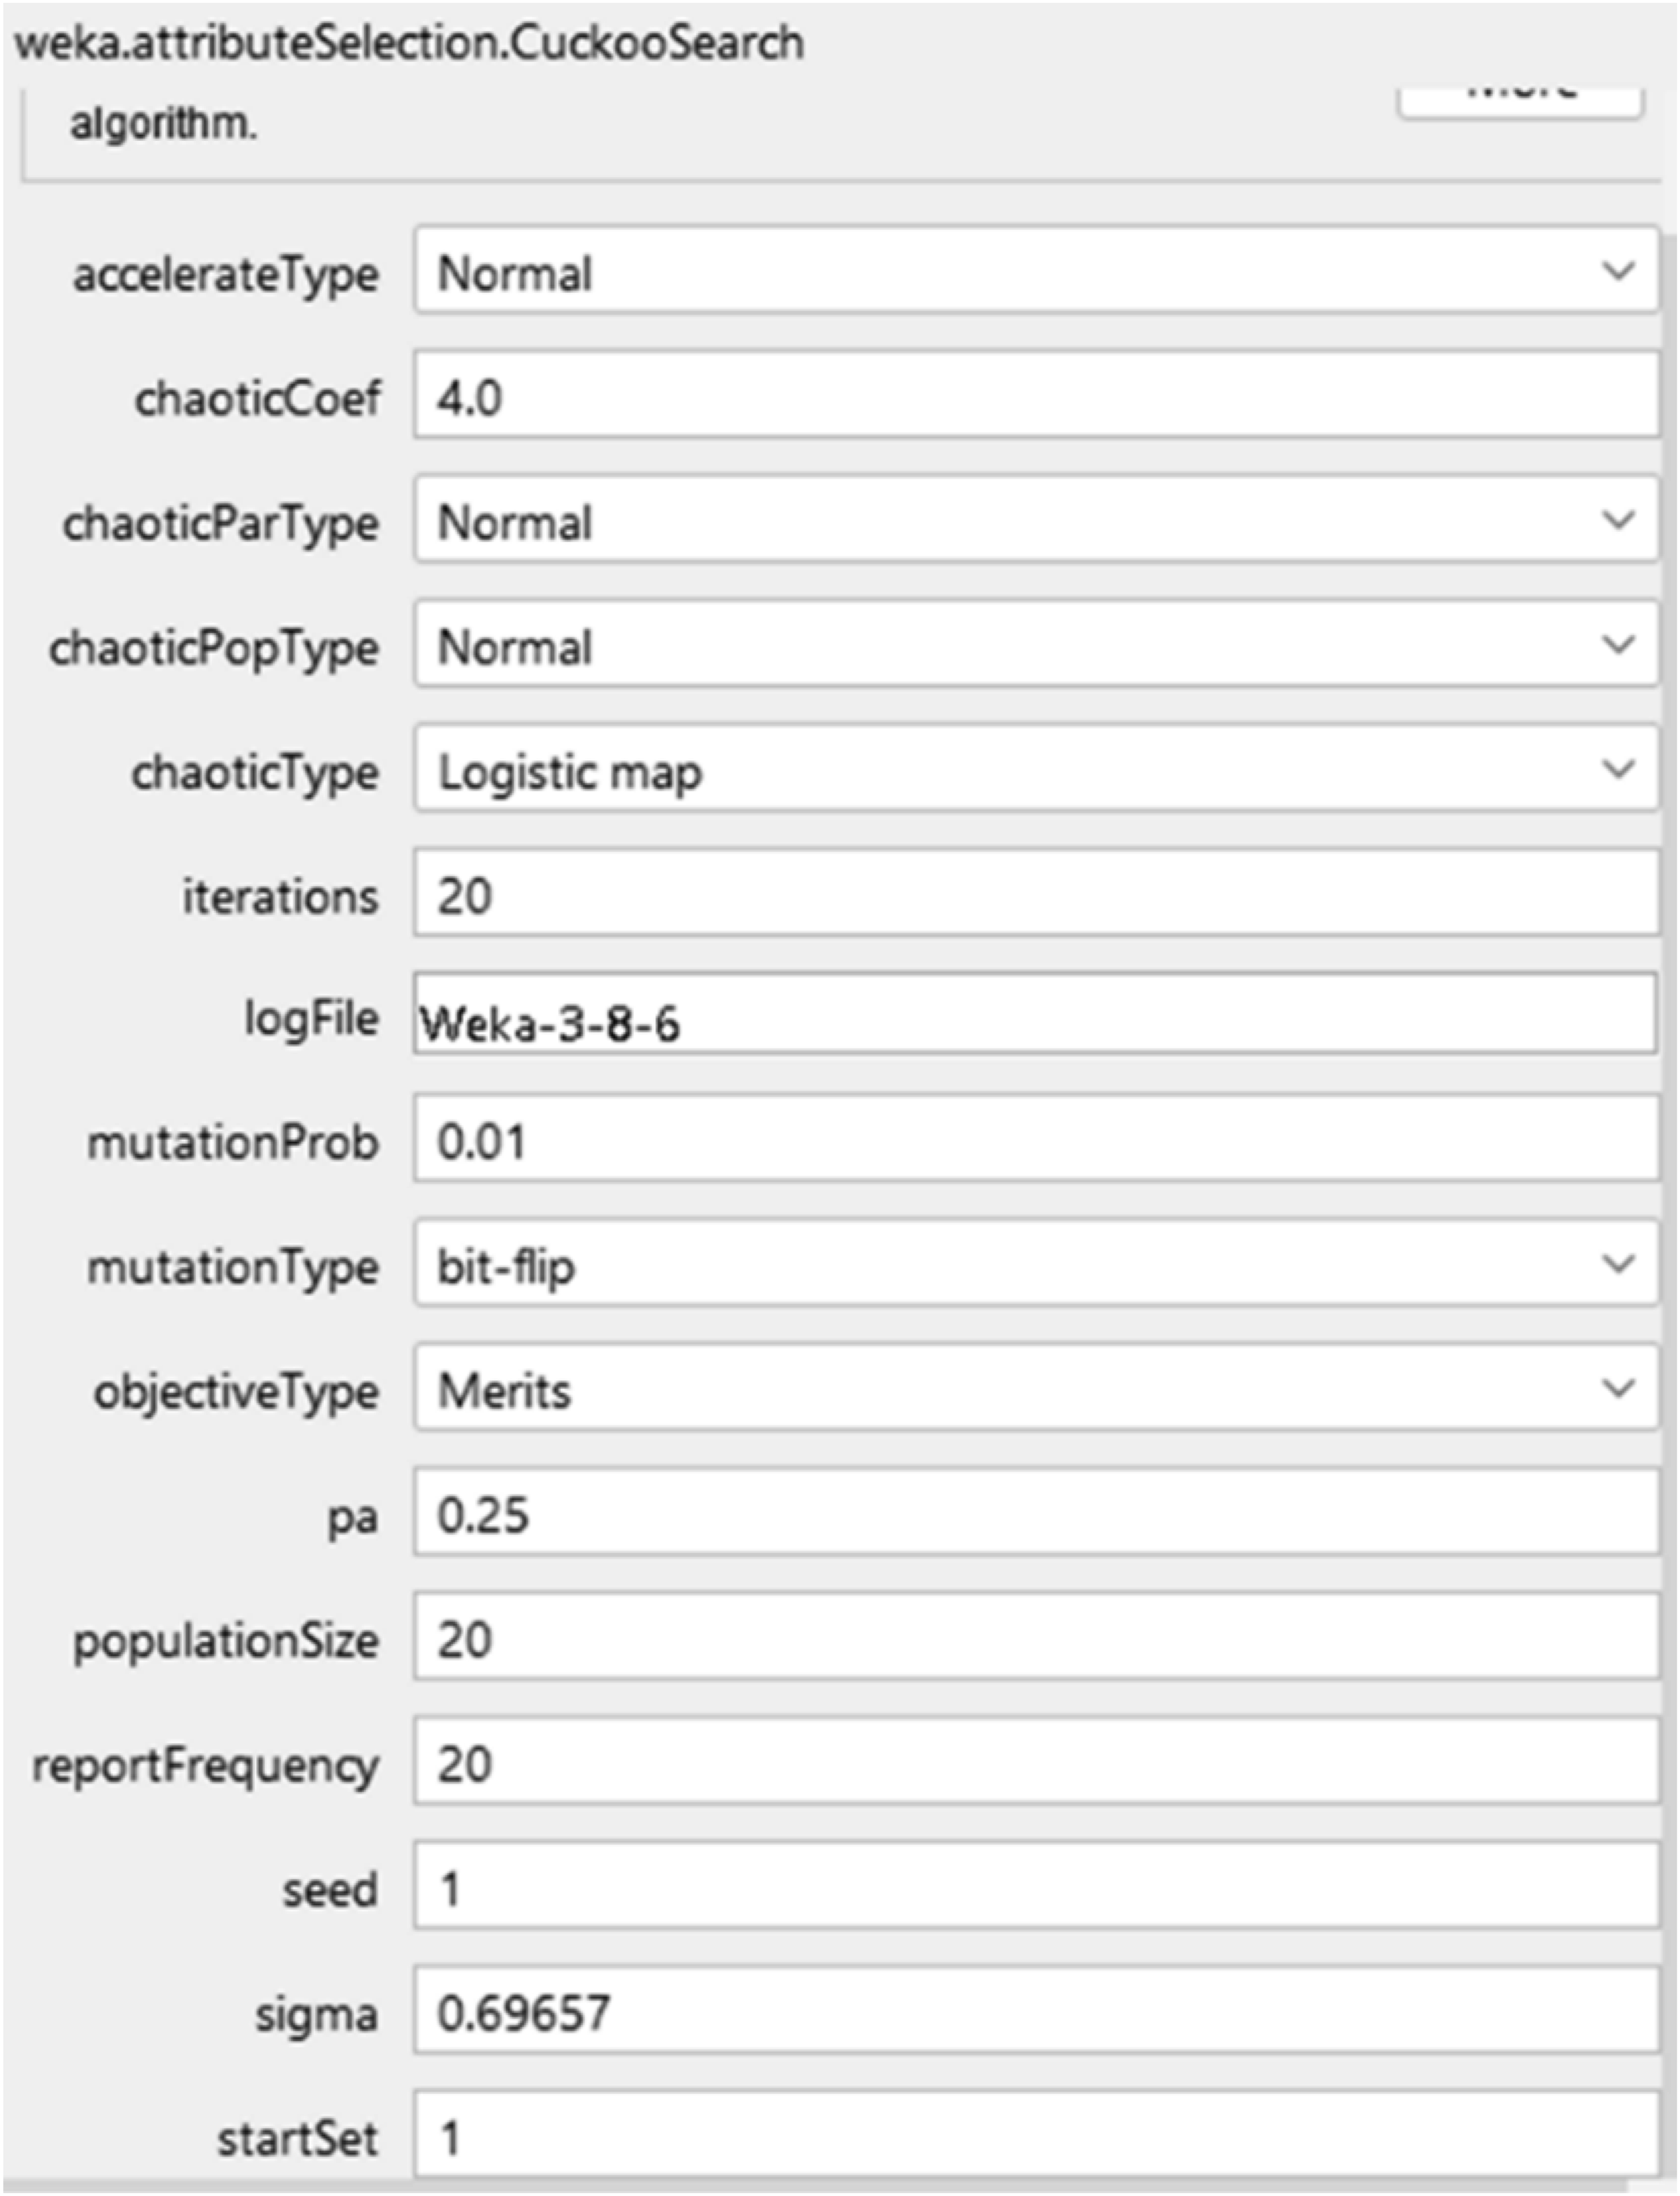
5.3. DT-Elephant model
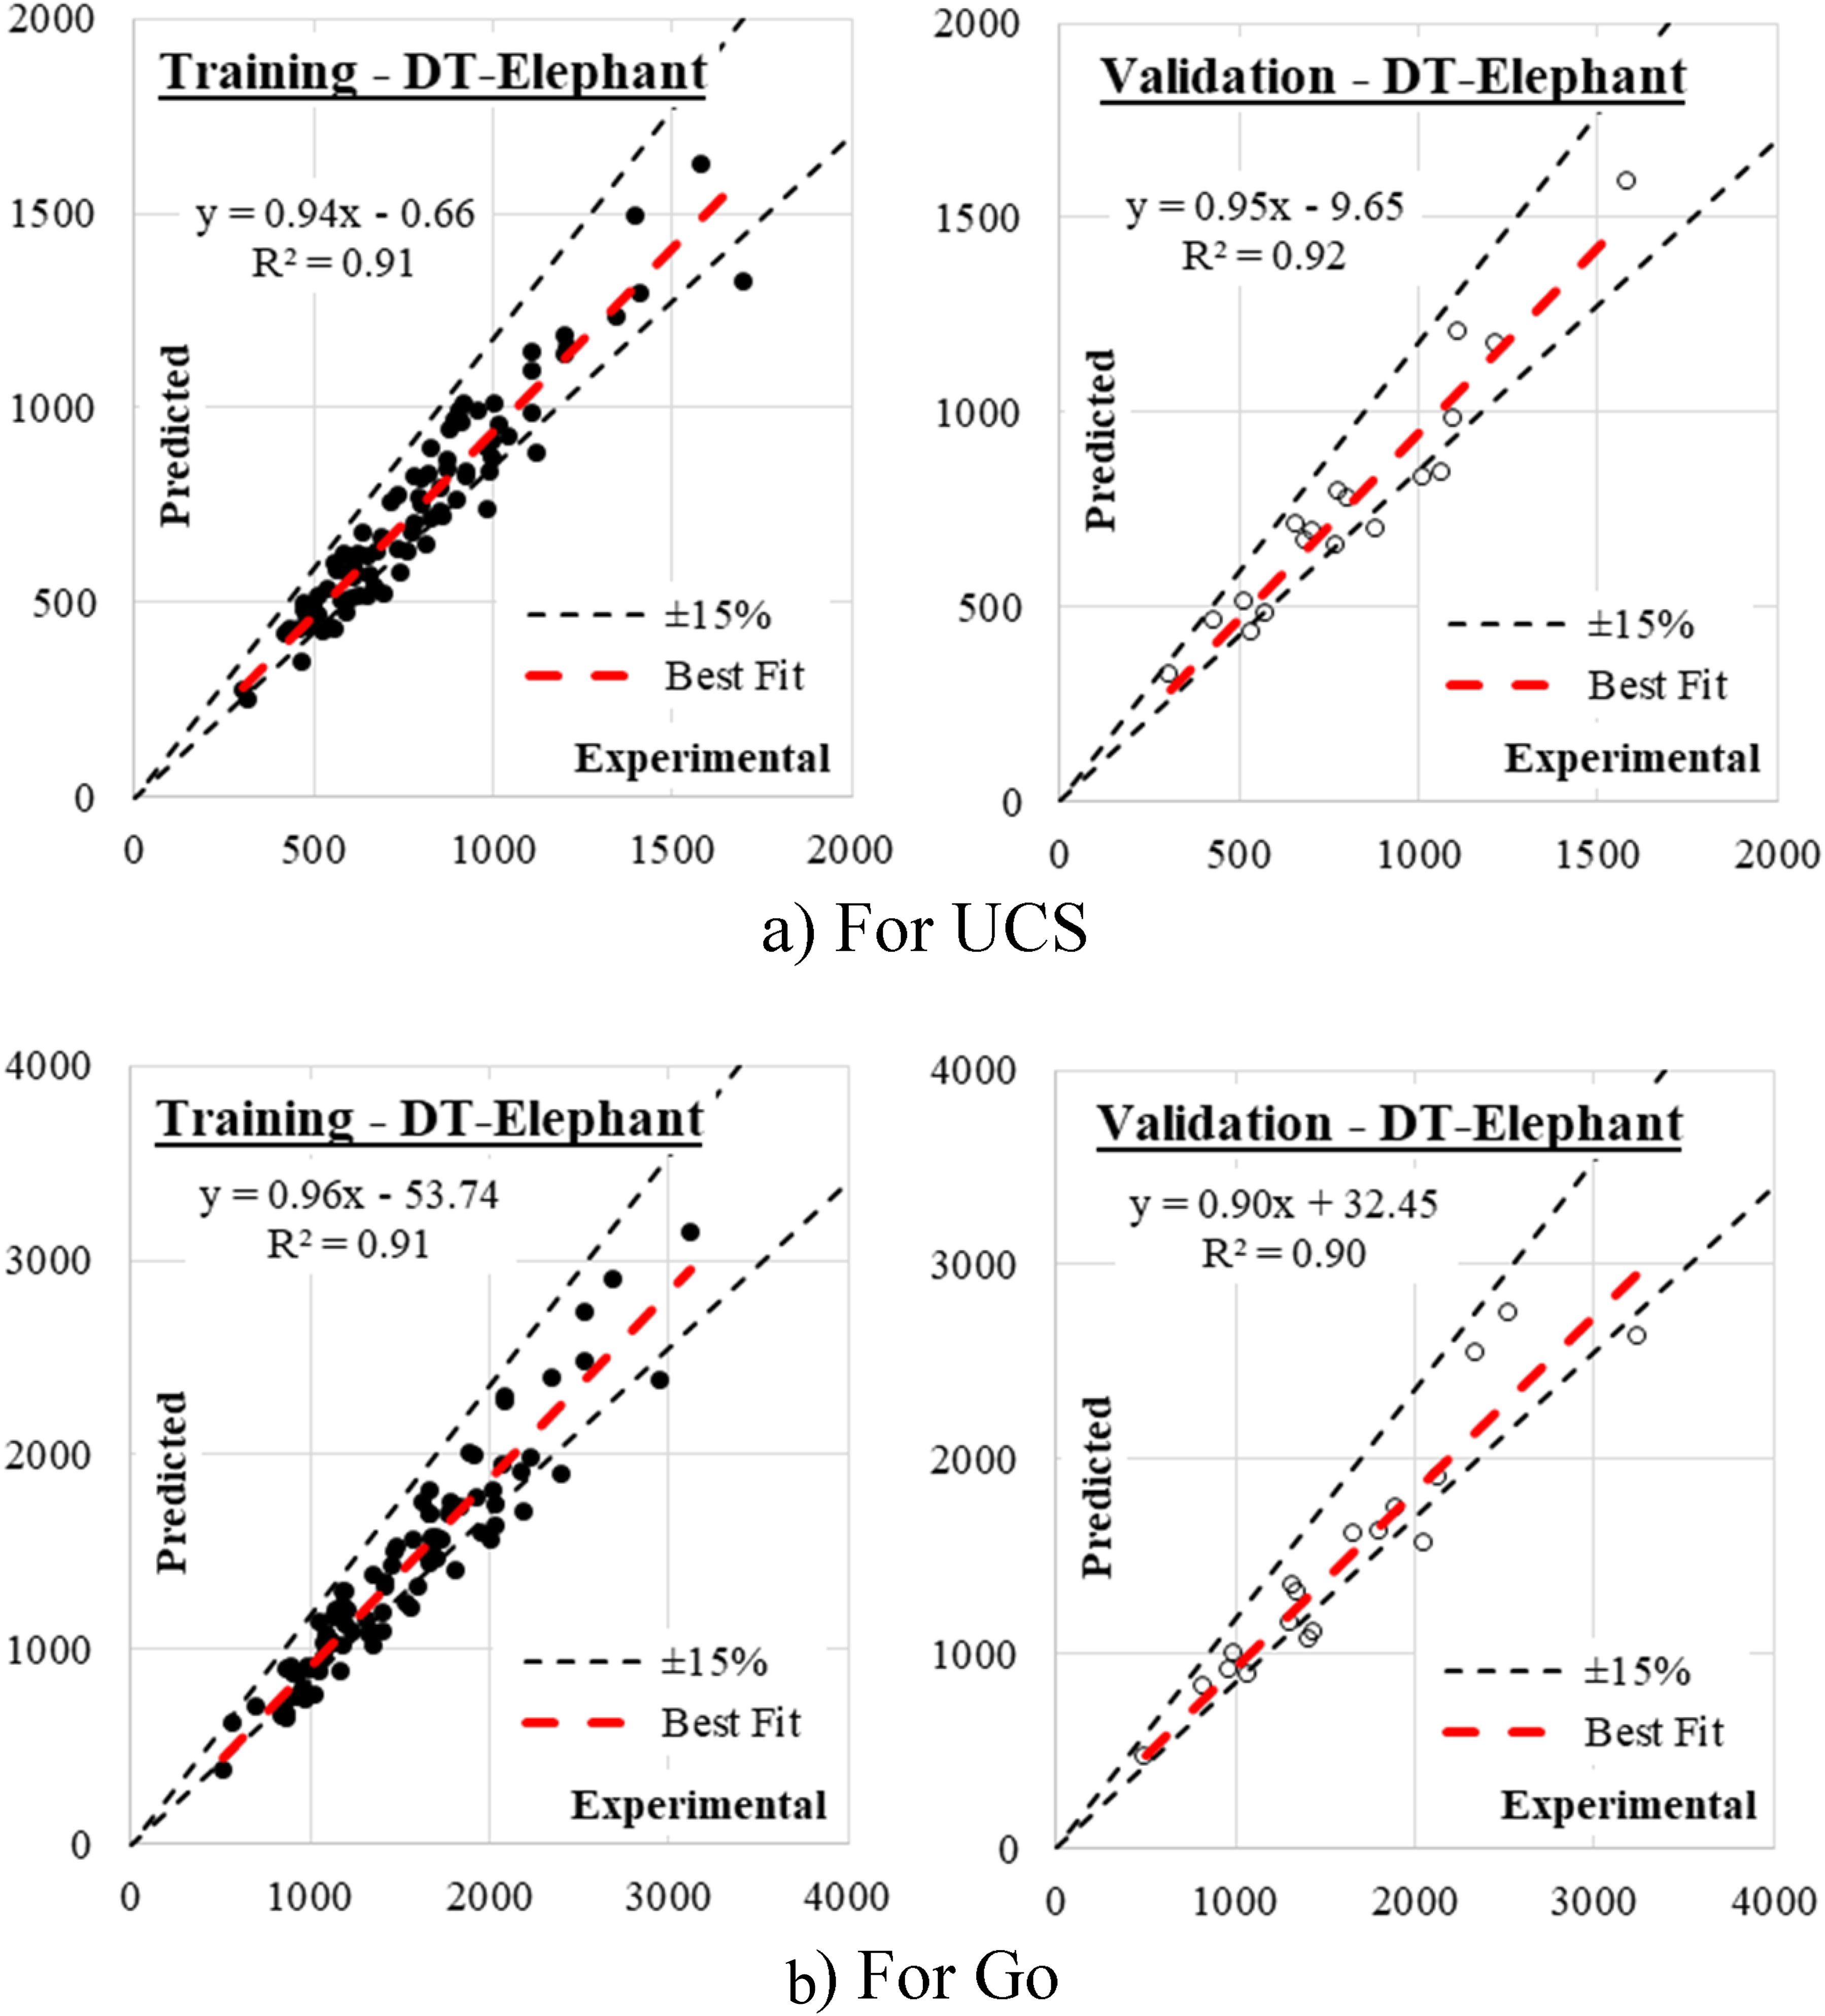
Figure 7 shows the successfully tuned hyperparameter indices for the DT-Elephant model. The graphs in Figure 8 show the relationship between predicted and experimental values for Unconfined Compressive Strength (UCS) and Go using the DT-Elephant model. Each plot includes a linear regression equation, coefficient of determination (R2), and ±15% error margins, allowing evaluation of both accuracy and generalization performance in training and validation stages. For UCS prediction, the training graph (top-left) shows a regression equation of y = 0.94x-0.66y = 0.94x - 0.66 and an R2 = 0.91. The slope being slightly below 1 and the low intercept suggest a minor underprediction trend. Although there is a good degree of correlation, the dispersion around the best-fit line indicates that prediction accuracy is not as tight as more optimized models. The validation graph (top-right) has a regression of y = 0.95x-9.65 with an improved R2 = 0.92, showing slightly better generalization. However, a few points deviate from the ±15% bounds, particularly at higher UCS values, indicating some prediction limitations at the upper end of the range. For Go prediction, the training plot (bottom-left) shows a regression line of y = 0.96x - 53.74 and R2 = 0.91. The slope and intercept suggest relatively good performance with a tendency toward slight underestimation. The data points are fairly concentrated around the best-fit line, although there is more scatter than in UCS predictions. In the validation phase (bottom-right), the regression changes to y = 0.90x+32.45, and the R2 drops slightly to 0.90, implying slightly weaker correlation and greater deviation from the perfect prediction line. The slope of 0.90 also indicates a larger bias, suggesting a more pronounced underprediction, especially for higher values of Go. Overall, the DT-Elephant model shows a reliable but comparatively moderate prediction capability for both UCS and Go. While the R2 values indicate strong general linear relationships, the model exhibits slightly more dispersion and underestimation tendencies than higher-performing models like DT-Cuckoo. This means DT-Elephant can still be a dependable predictive model, but with somewhat reduced precision and robustness, especially in extrapolating higher strength values. The considered hyper-parameters of DT-Elephant model. Relation between predicted and calculated values using DT-Elephant. (a) For UCS. (b) For go.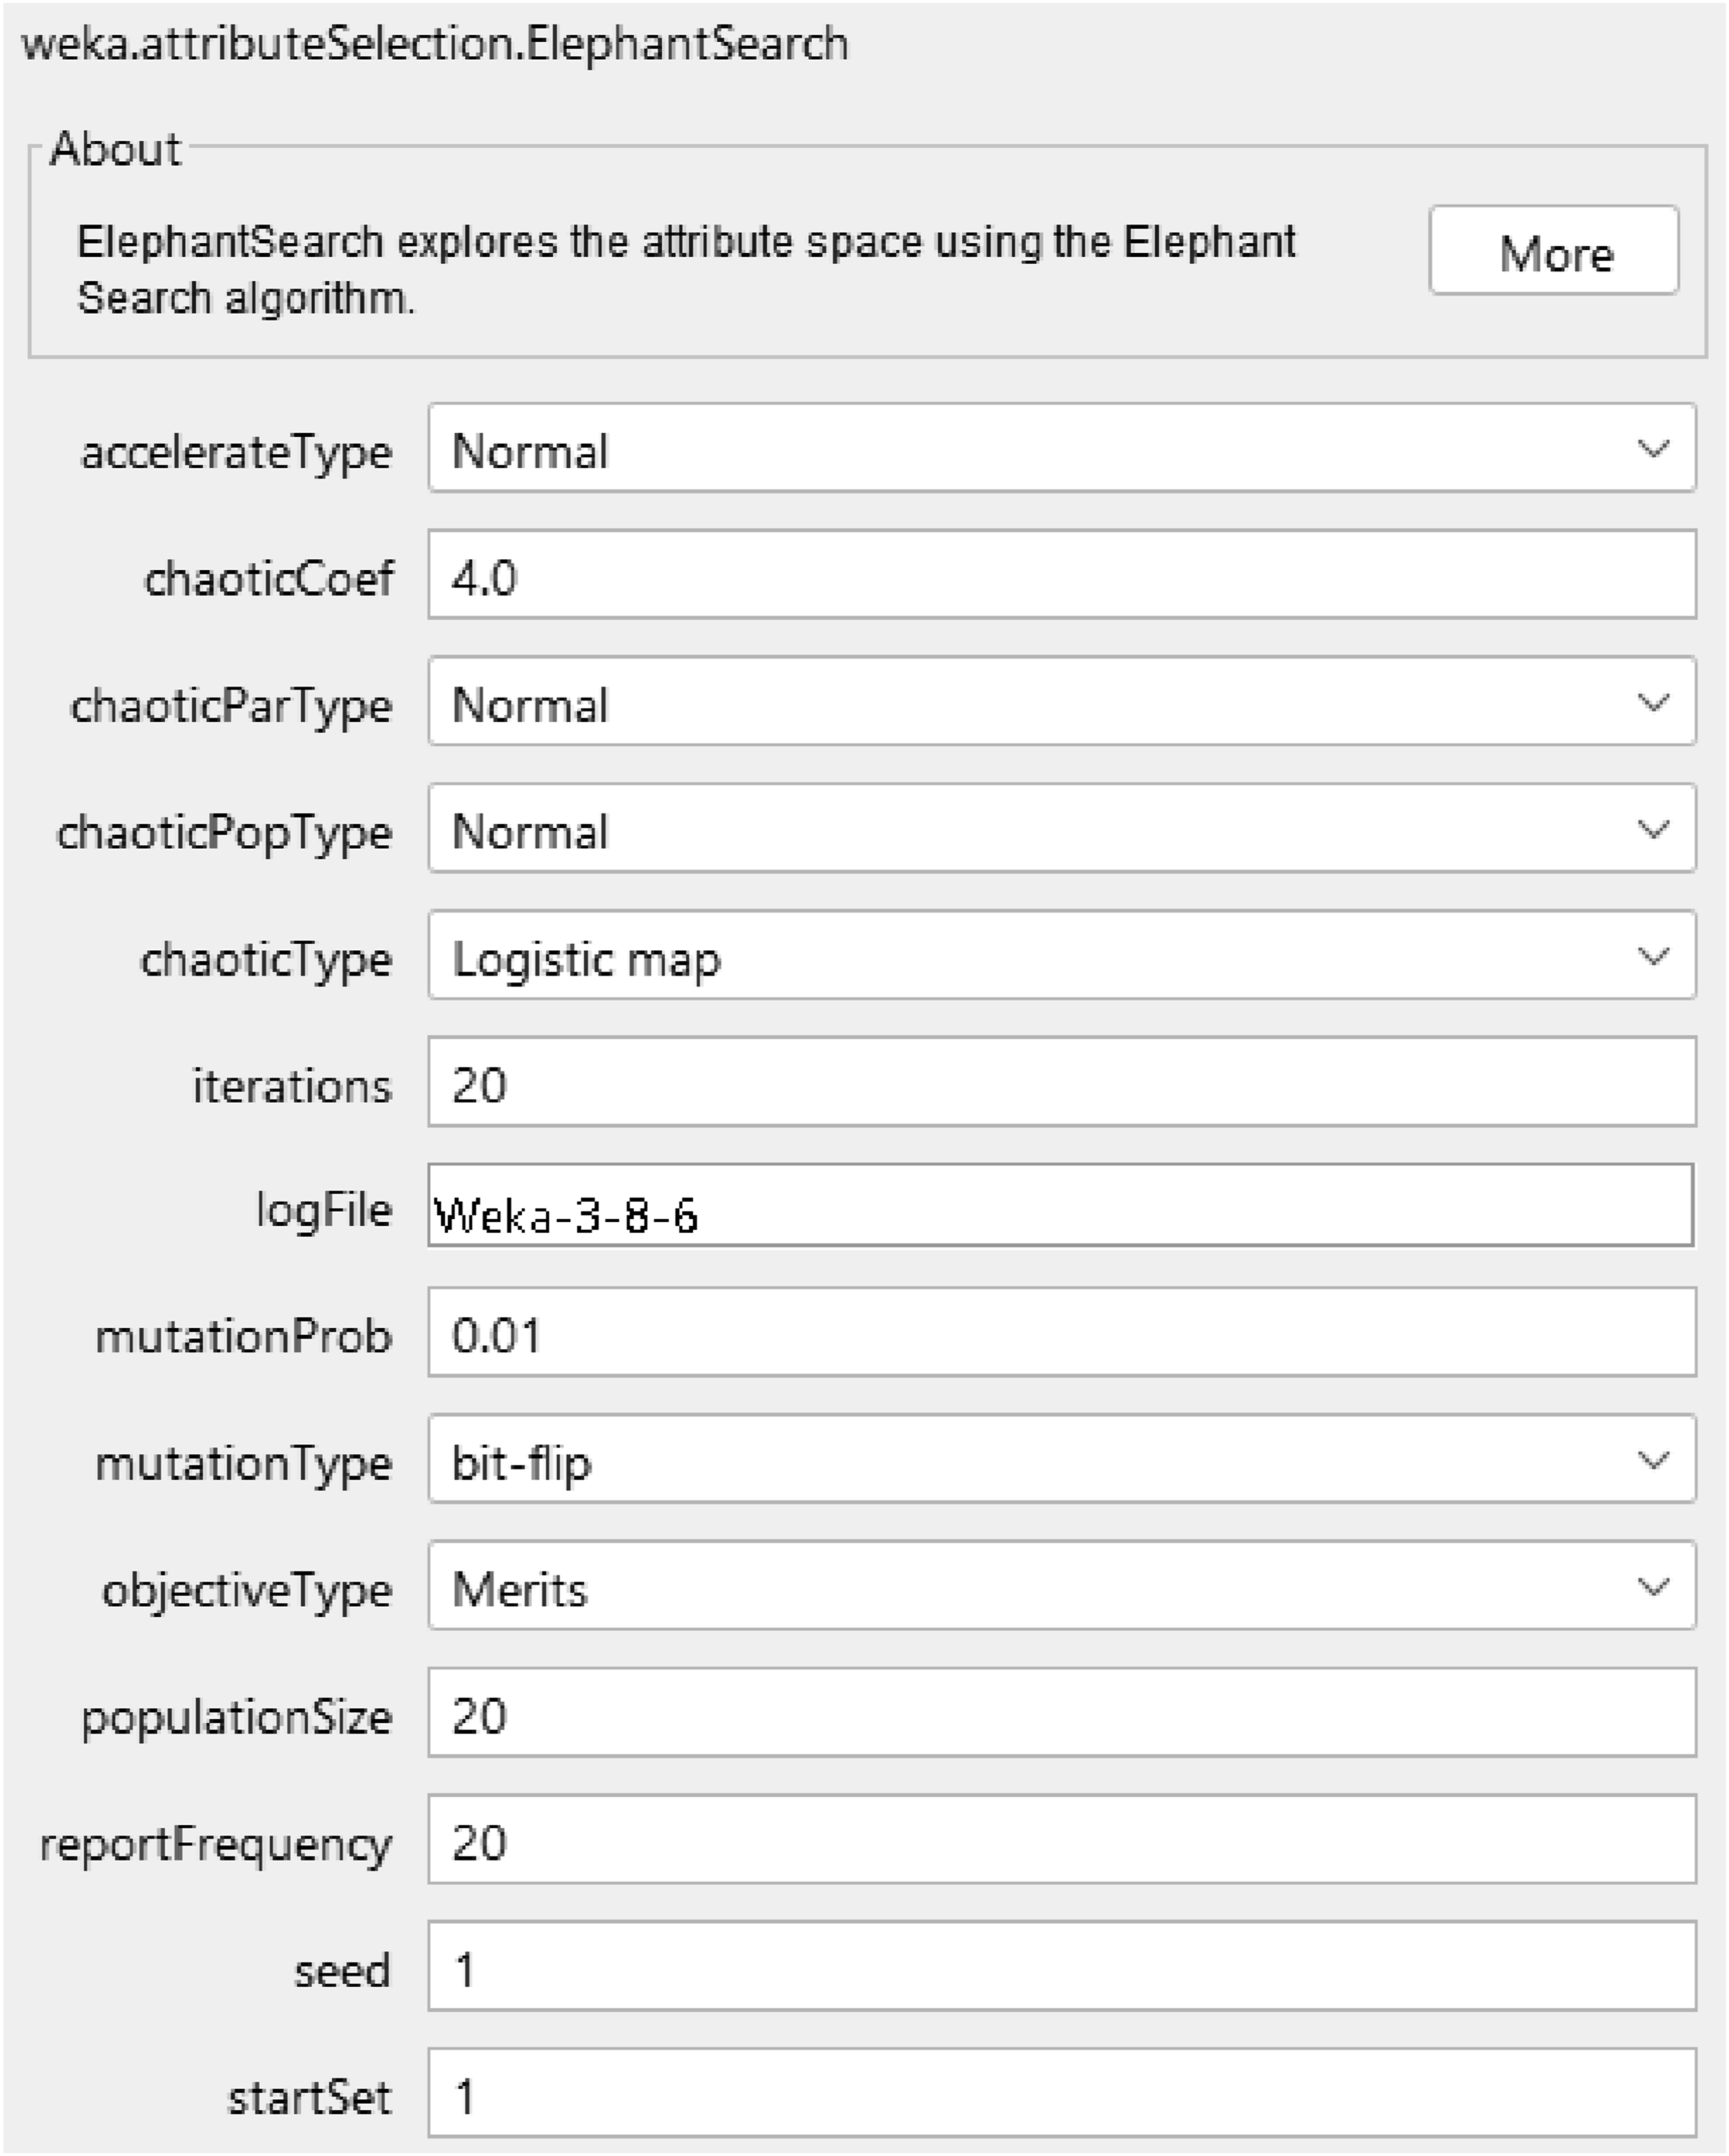
5.4. DT-FireFly model
Figure 9 shows the successfully tuned hyperparamter indices for the Firefly model. The graphs in Figure 10 illustrate the predictive performance of the DT-FireFly model for Unconfined Compressive Strength (UCS) and Go values using both training and validation datasets. The plots provide regression equations, R2 values, and ±15% margins, offering a comprehensive view of prediction accuracy and reliability. For UCS prediction, the training graph (top-left) reveals a regression line of y = 0.98x+12.15 with an exceptional R2 = 0.99. This near-perfect fit suggests that the predicted values very closely match the experimental results with minimal bias or systematic error. The data points are densely clustered around the best-fit line, and the vast majority fall within the ±15% error bounds, confirming both accuracy and consistency. In the validation graph (top-right), the model continues to perform strongly with a regression of y = 0.99x+9.98 and an identical R2 = 0.99, indicating excellent generalization to unseen data. The near-unit slope and low intercept reflect that the model captures the true trend with negligible deviation. For Go prediction, the training graph (bottom-left) shows a regression of y = 1.00x−4.92 with R2 = 0.99. The perfect slope of 1.00 suggests an almost exact linear relationship between predicted and experimental values, while the small intercept highlights a lack of systemic over- or underestimation. The predicted values tightly follow the experimental line, showing a well-calibrated model. In the validation phase (bottom-right), the regression line is y = 0.99x−15.36 with a flawless R2 = 1.00, indicating an ideal correlation and the highest possible predictive performance. The consistency of data points within the ±15% boundaries reinforces the model’s exceptional reliability and accuracy even on data it was not trained on. In summary, the DT-FireFly model demonstrates outstanding predictive capability for both UCS and Go. Its regression slopes are nearly one, intercepts are minimal, and R2 values reach up to 1.00, showing a nearly perfect match with experimental results. The narrow dispersion and high conformity within error margins confirm that this model achieves the highest predictive strength and generalization among the models observed. The considered hyper-parameters of DT-FireFly model. Relation between predicted and calculated values using DT-FireFly. (a) For UCS. (b) For go.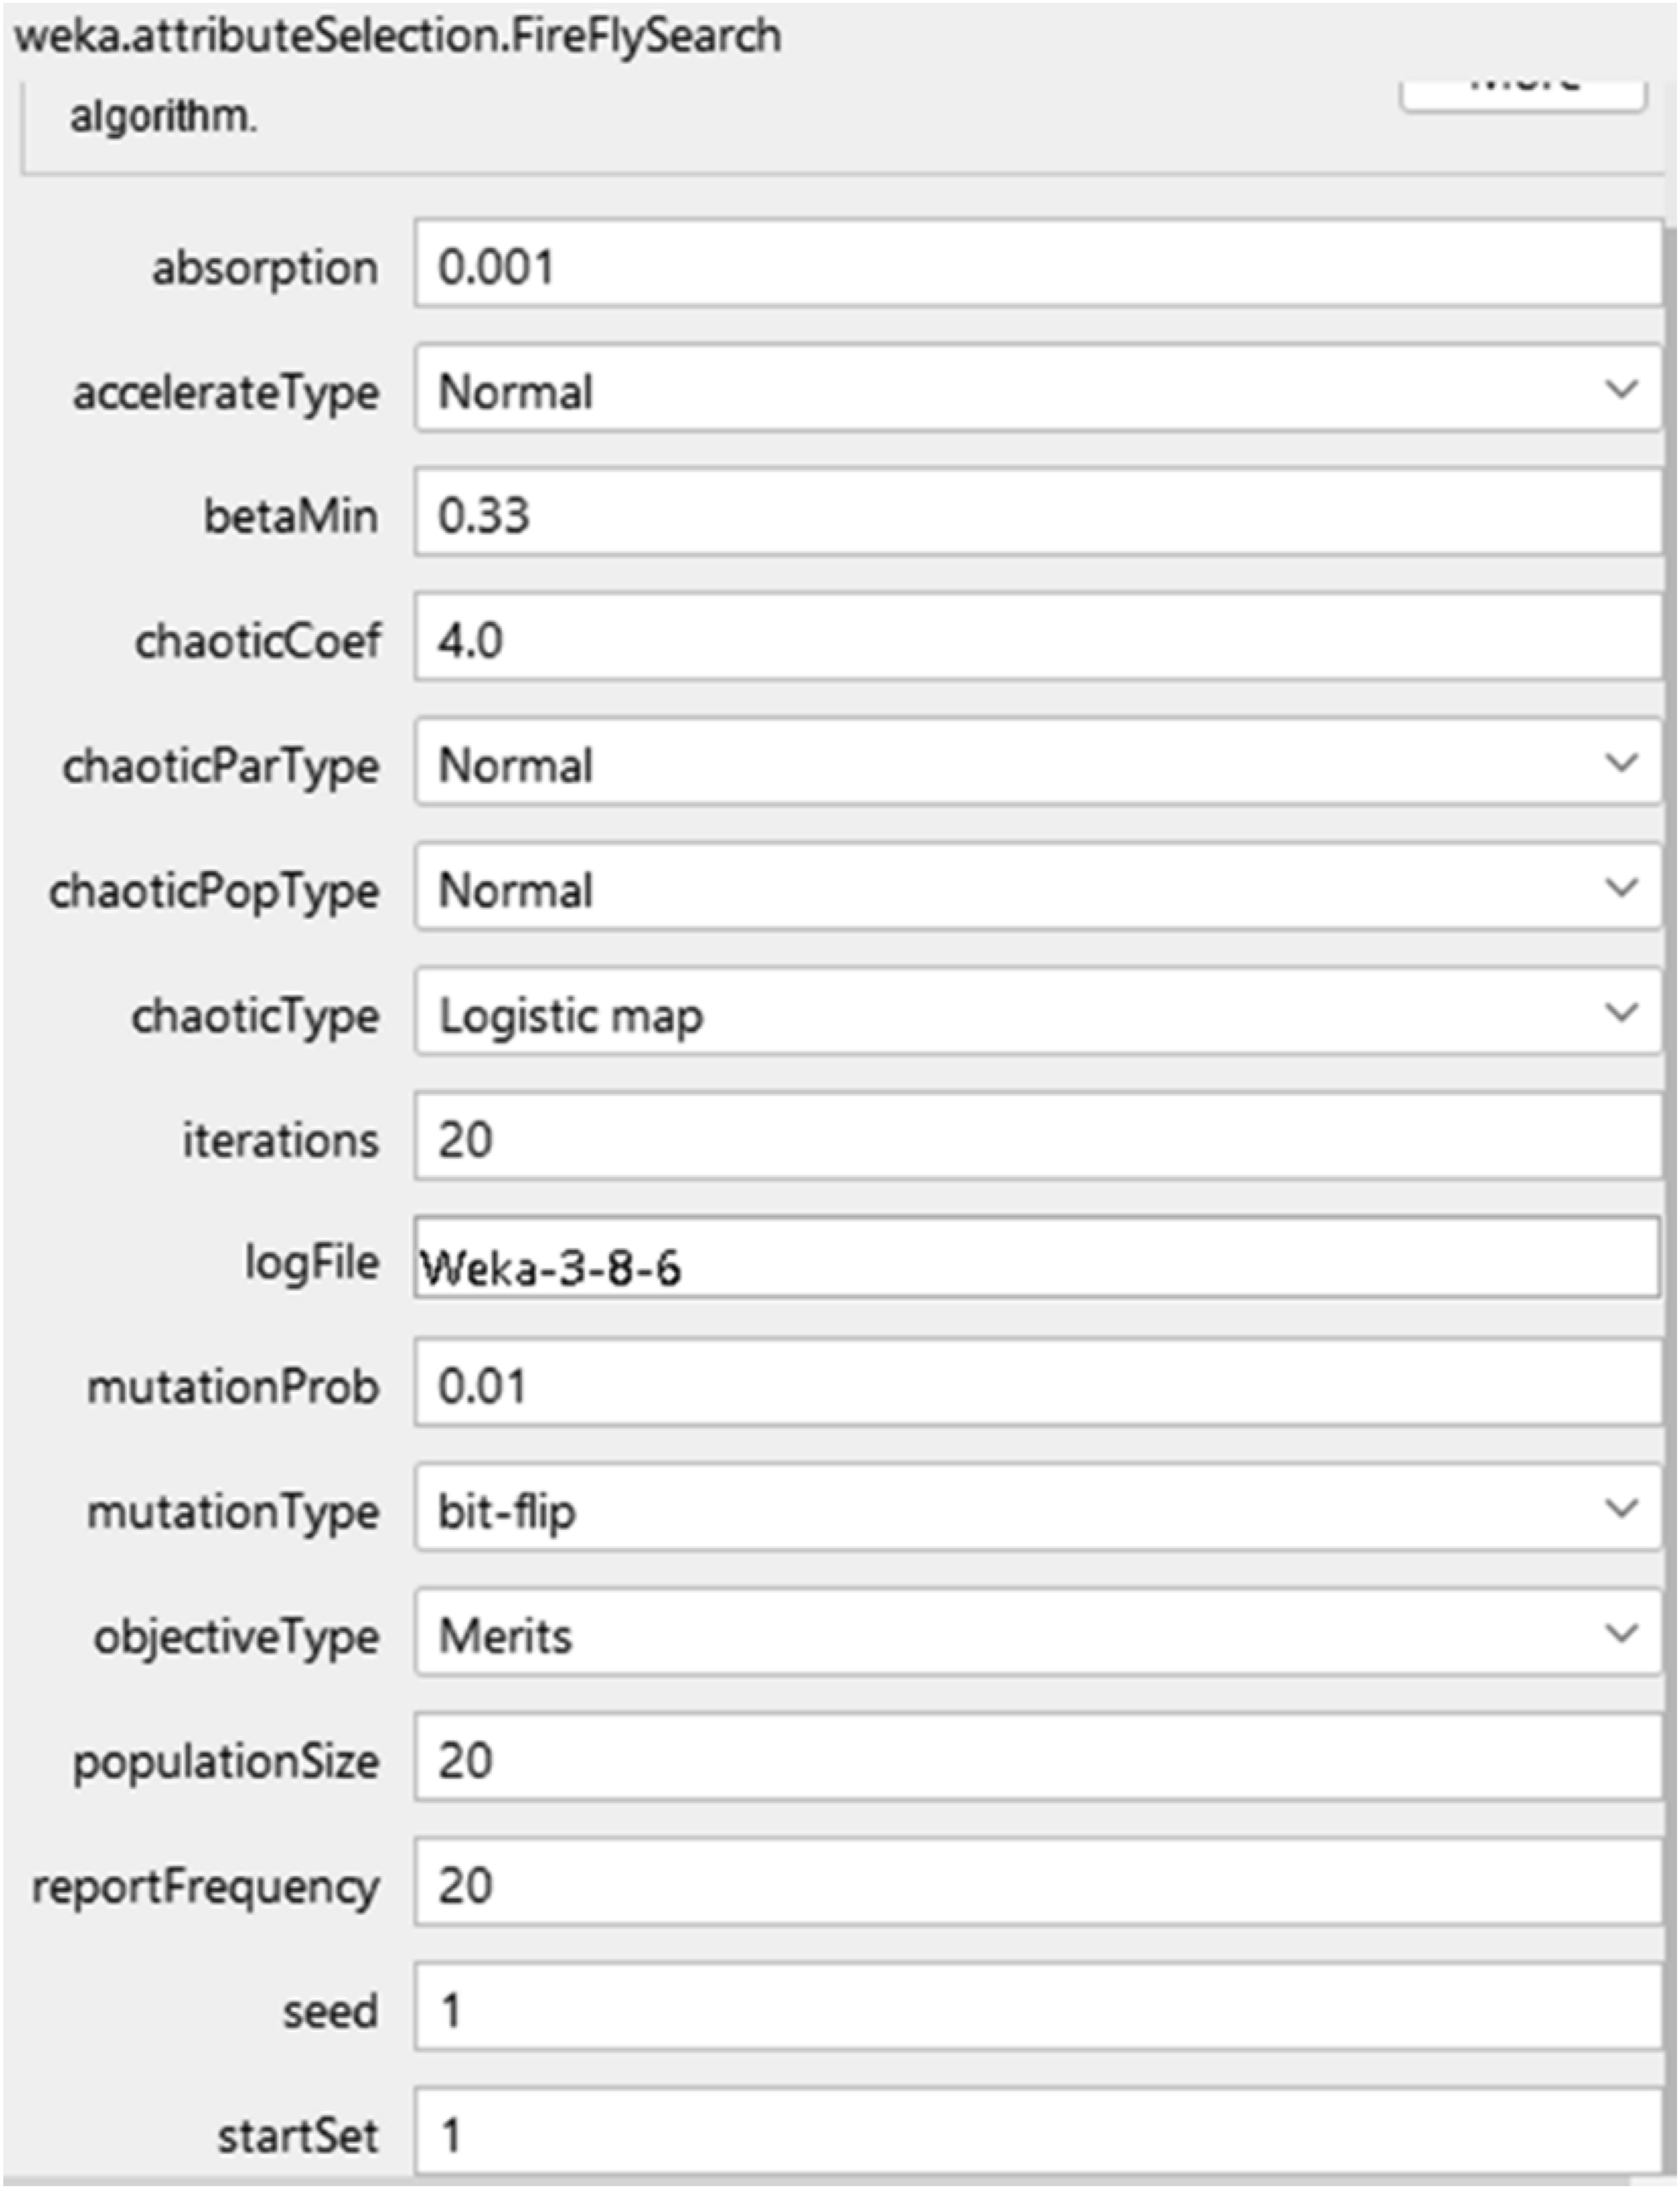

5.5. DT-Rhino model
Figure 11 shows the successfully tuned hyperparamter indices for the DT-Rhino model. The Figure 12 presents regression plots comparing predicted and experimental values for UCS (Unconfined Compressive Strength) and Go (shear modulus or modulus of deformation) using a Decision Table model optimized with the Rhino technique (DT-Rhino), for both training and validation datasets. For UCS, the training graph shows a regression equation of y = 0.96x+24.22 with a coefficient of determination R2 = 0.80. This indicates a strong linear relationship with a slight underestimation bias (slope less than 1 and a positive intercept). The predicted values are mostly clustered within the ±15% error bounds, suggesting good accuracy. The validation graph for UCS shows improved performance with an equation y = 1.07x−40.43 and a higher R2 = 0.88, indicating that the model generalizes well. The slope above 1 shows a slight overestimation tendency in the validation set, but the majority of predictions still lie within acceptable error limits. For Go, the training set performance is represented by the equation y = 0.91x+145.83 and R2 = 0.81, implying a slightly lower slope and stronger positive bias compared to UCS, but still with a solid correlation. The prediction accuracy is robust with a tight distribution around the best-fit line. In the validation set, the model maintains consistent performance with the equation y = 1.02x−67.91 and R2 = 0.80, demonstrating generalization without significant degradation in predictive capability. The slope near unity and small intercept reflect minimal bias and high model reliability. Overall, the DT-Rhino model exhibits strong predictive performance for both UCS and Go across training and validation phases. The data points’ close adherence to the ideal and best-fit lines, as well as their containment within the ±15% bounds, indicate that the model can effectively capture the underlying relationships in the dataset, with only minor tendencies toward under- or over-prediction in different phases. The considered hyper-parameters of DT-Rhino model. Relation between predicted and calculated values using DT-Rhino. (a) For UCS. (b) For go.

5.6. DT-Wolf model
Figure 13 shows the successfully tuned hyperparamter indices for the DT-Wolf mdoel. The graphs in Figure 14 display the predictive performance of the DT-Wolf model in estimating UCS (Unconfined Compressive Strength) and Go (shear modulus) across training and validation phases, with experimental values plotted against predicted ones. For UCS, the training phase reveals a regression line y = 1.02x−13.12 with a very high coefficient of determination R2=0.97. This indicates an almost perfect linear relationship, with a slope very close to unity and a minimal intercept, suggesting low bias and high accuracy. The validation plot similarly demonstrates excellent predictive capacity with y = 0.96x+30.00 and an even higher R2 = 0.98. The slope remains close to 1, reflecting balanced prediction, and the points are densely clustered within the ±15% bounds, confirming strong generalization performance and minimal over- or underestimation. For Go, the training dataset achieves the same high R2 = 0.97 with a regression line y = 1.06x−84.13. The slight overestimation in slope and a small negative intercept do not significantly impact the accuracy, as the prediction points tightly align with the best-fit and ideal lines. The validation performance is similarly strong, with y=0.93x+60.49y = 0.93x + 60.49y=0.93x+60.49 and R2=0.98, indicating high reliability. The slope marginally underestimates but is offset by the positive intercept, keeping predictions balanced overall. Overall, the DT-Wolf model exhibits superior prediction performance compared to the previously evaluated DT-Rhino model. The higher R2 values across all graphs (ranging from 0.97 to 0.98), regression slopes near unity, minimal intercepts, and tight clustering within the ±15% error margin confirm that the DT-Wolf approach provides highly accurate and generalized estimations of both UCS and Go. This model demonstrates excellent capability in capturing the complex nonlinear relationships between input variables and output mechanical properties in concrete systems. The considered hyper-parameters of DT-Wolf model. Relation between predicted and calculated values using DT-Wolf. (a) For UCS. (b) For go.

5.7. Comparison of the models with respect to UCS and go prediction
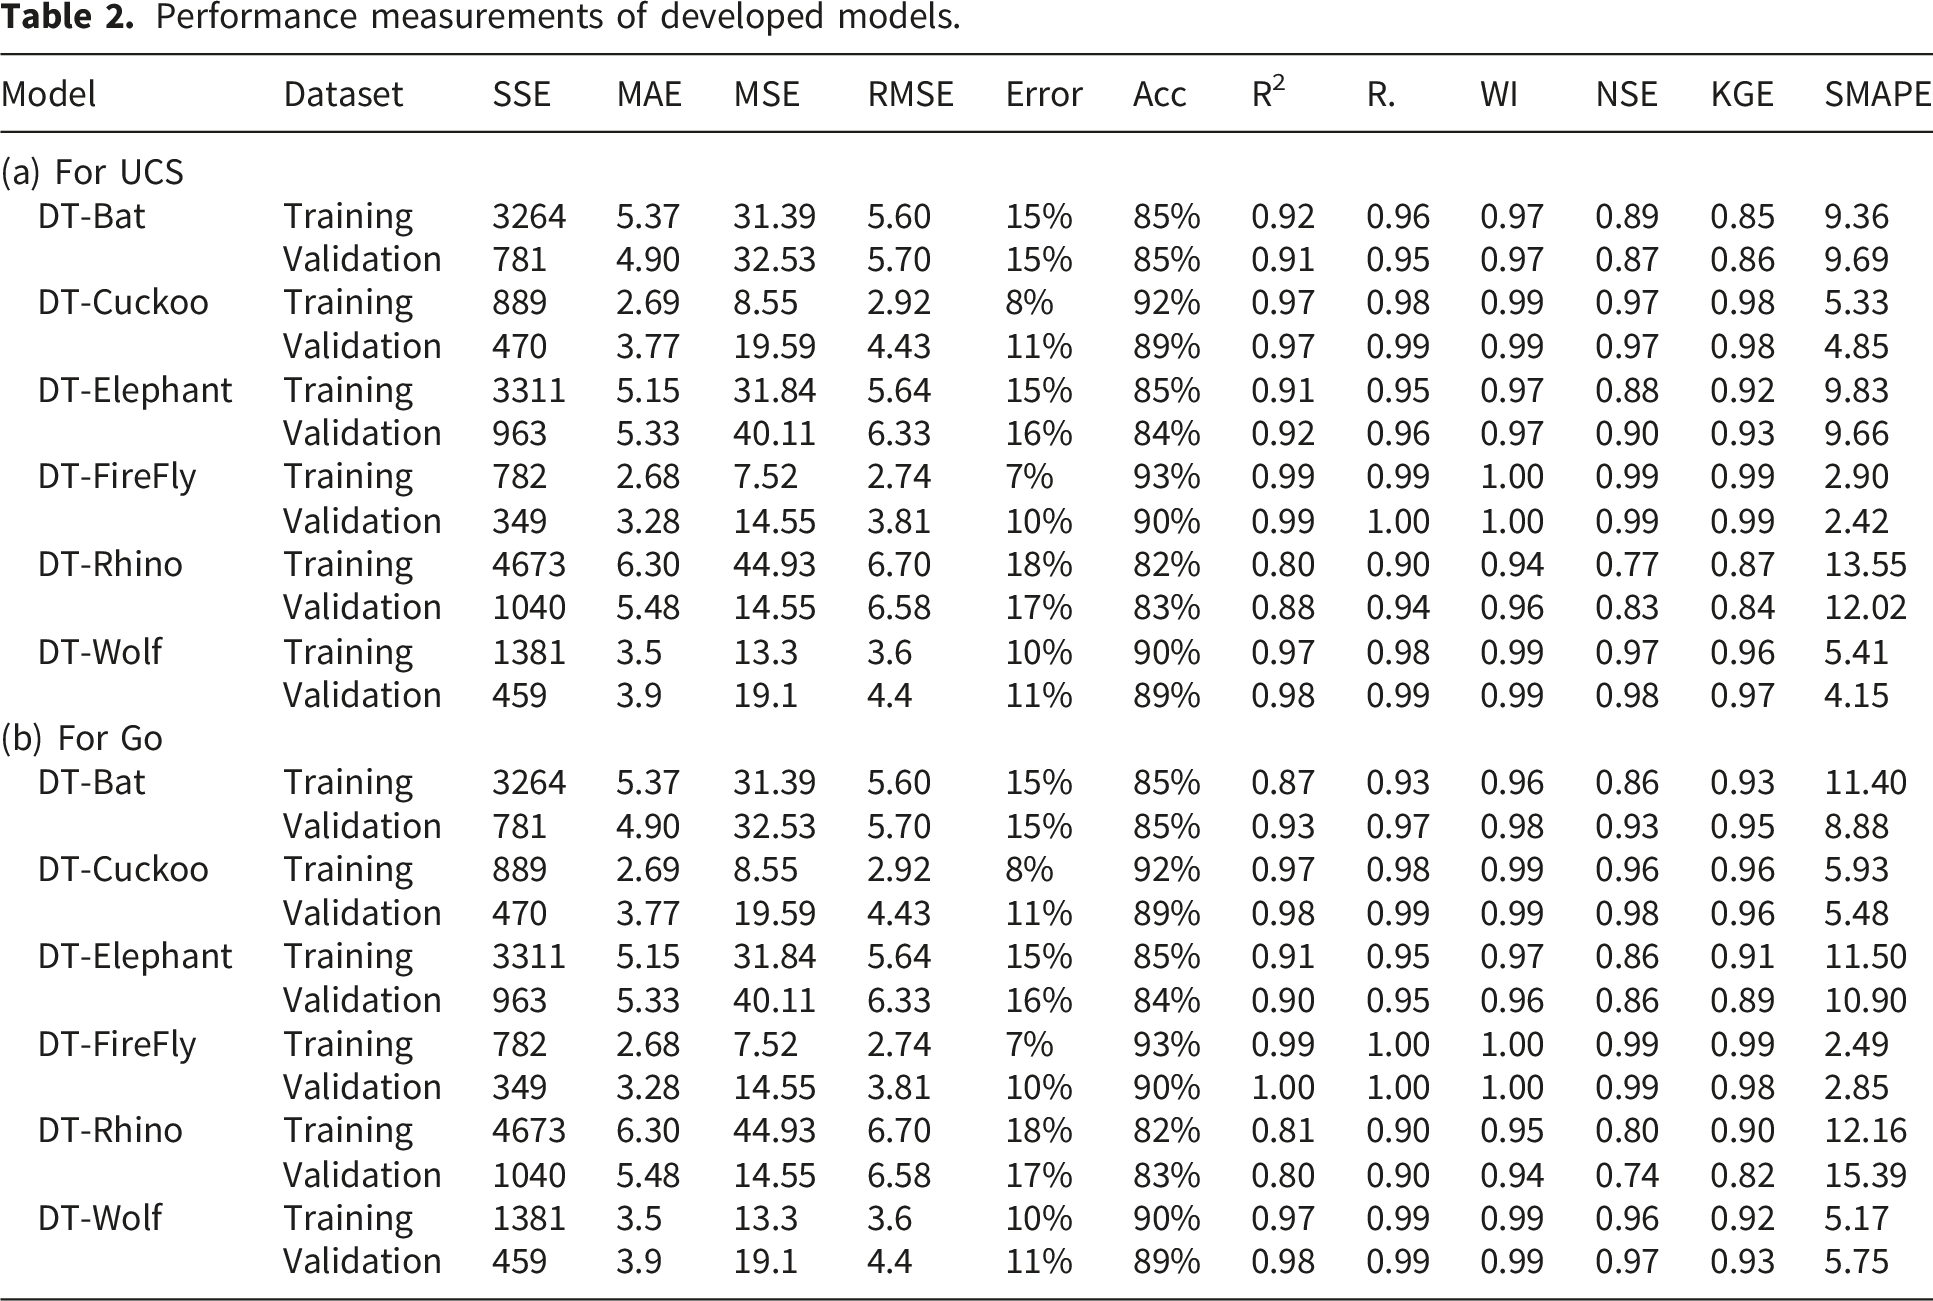
Performance measurements of developed models.

Comparison of the accuracies of the developed models using Taylor charts. (a) For UCS. (b) For go.
For UCS prediction, the DT-FireFly model exhibited the best overall performance, with the lowest error metrics and highest statistical accuracy. During training, it achieved an RMSE of 2.74, MSE of 7.52, MAE of 2.68, and an exceptionally high R2 of 0.99 and correlation coefficient (R) of 0.99. The Willmott Index (WI), Nash–Sutcliffe Efficiency (NSE), and Kling–Gupta Efficiency (KGE) were all 1.00, 0.99, and 0.99, respectively, indicating near-perfect agreement between predicted and observed values. The model maintained strong performance on the validation set, with only slight increases in RMSE (3.81) and MAE (3.28), and similarly high accuracy and statistical alignment. The DT-Cuckoo and DT-Wolf models also performed excellently, particularly in balancing prediction accuracy and generalization. DT-Cuckoo had very low error values in training (MSE of 8.55, RMSE of 2.92) and validation (MSE of 19.59, RMSE of 4.43), with R2 values of 0.97 and 0.97 for training and validation, respectively. DT-Wolf followed closely with MSEs of 13.3 and 19.1, RMSEs of 3.6 and 4.4, and consistent R2 values of 0.97 and 0.98 across datasets. Both models achieved accuracies above 89% and low SMAPE values, confirming their predictive strength. Conversely, DT-Rhino yielded the weakest performance, with significantly higher SSE (4673 in training), RMSE (6.70), and Error% (18%) during training. Its validation results also lagged behind, showing less agreement with measured UCS values (R2 of 0.88, KGE of 0.84), and a higher SMAPE of 12.02, suggesting limited suitability for high-accuracy predictions. DT-Bat and DT-Elephant models exhibited moderate performance, with similar RMSEs around 5.6 to 6.3 in training and validation and Error% between 15% and 16%. Although their R2 values remained reasonably high (above 0.91), they lacked the precision of FireFly, Cuckoo, and Wolf, as reflected in lower KGE and higher SMAPE values.
For Go prediction, the performance trends were nearly identical, with DT-FireFly once again leading in both training and validation. It achieved the lowest RMSE values (2.74 and 3.81), highest R2 (0.99 and 1.00), and minimal error percentages (7% and 10%), confirming its strength as a highly stable and precise predictor for stiffness characteristics as well. Its SMAPE values (2.49 and 2.85) were also the lowest across all models. DT-Cuckoo and DT-Wolf continued to show consistent and strong predictive capacity for Go, with RMSEs under 4.5, R2 values of 0.97 to 0.98, and SMAPE values below 6. DT-Cuckoo, in particular, maintained its strength from UCS prediction, proving its general applicability. The DT-Rhino model again underperformed, with the highest error metrics across both training and validation (RMSE of 6.70 and 6.58), the lowest R2 (0.80 and 0.80), and the highest SMAPE of 12.16 and 15.39. This performance highlights challenges in convergence or hyperparameter tuning for this optimization algorithm when used with DT. DT-Bat and DT-Elephant maintained average performance, showing RMSE values around 5.6 and 6.3, and accuracy between 84% and 85%. Their statistical alignment (R2, WI, NSE, KGE) remained acceptable but consistently below the best three models, while SMAPE values hovered above 10, indicating higher dispersion in predictions. In summary, DT-FireFly demonstrated the most effective learning and generalization capability across both UCS and Go prediction tasks, followed by DT-Cuckoo and DT-Wolf, which provided highly accurate and reliable results. DT-Rhino was the least efficient model, with consistently poorer results, suggesting limitations in its optimization performance when paired with the DT framework. DT-Bat and DT-Elephant showed moderate performance but lacked the predictive precision needed for high-stakes geotechnical modeling.
The performances of the developed DT-based models in this study significantly outperform many of the models reported in the reviewed literature, both in terms of accuracy and predictive reliability for unconfined compressive strength (UCS) and stiffness (Go). In the reviewed studies by Onyelowe et al.,14–16 machine learning techniques such as ANN, GEP, and EPR were used for predicting soil strength characteristics. These models reported R2 values in the range of 0.82 to 0.97, RMSE values typically above 1.15, and Accuracy between 84% and 92.5%. While these results reflect strong predictive capacity, the DT-FireFly, DT-Cuckoo, and DT-Wolf models in this current study demonstrate superior or comparable performance. For example, DT-FireFly achieved R2 values up to 0.99, RMSE as low as 2.74 for UCS and 2.74 for Go, with Accuracy reaching 93%, and extremely low SMAPE values (as low as 2.42). These metrics indicate greater precision and lower residual error when compared with those from ANN and EPR models.
Comparison of predictive model performance for UCS and Go with previous studies.

5.8. Sensitivity analysis
A sensitivity index of 1.0 indicates complete sensitivity, a sensitivity index less than 0.01 indicates that the model is insensitive to changes in the parameter. Figures 16 and 17, respectively show the Hoffman &Gardener and SHAP sensitivity analyses with respect to UCS &Go. Hoffman & Gardner’s method of sensitivity analysis. (a) For UCS. (b) For go. SHAP sensitivity analysis. (a) For UCS. (b) For go.

The Hoffman & Gardener sensitivity analysis method applied in this study to evaluate the influence of input variables on the predicted Unconfined Compressive Strength (UCS) and stiffness (Go) offers detailed insights into variable significance across the data-driven models. For UCS, the sensitivity results revealed that the most influential variables include xanthan gum (XG) content, polypropylene fiber (PPF) dosage, curing period, and dry density. XG content exhibited the highest impact, indicating its critical role in binding soil particles and enhancing inter-particle cohesion. PPF also demonstrated strong influence due to its ability to improve tensile resistance and reduce crack propagation, which indirectly enhances UCS. The curing period, especially the transition from 28 to 90 days, showed a progressive increase in strength due to continued hydration and gel formation, while dry density had a moderate but noticeable effect by dictating the compactness and load transfer capacity within the stabilized matrix. For Go, the stiffness behavior was influenced primarily by dry density and curing period, with XG content also playing a major role. Dry density had the strongest influence on Go, which is consistent with the physical understanding that denser soil structures provide higher resistance to deformation, thereby increasing stiffness. The extended curing period again enhanced structural bonding and matrix stiffness through ongoing biopolymer-soil interaction. XG content contributed significantly by improving soil elasticity and contact structure, while PPF had a lesser but supportive impact on stiffness by bridging voids and offering fiber reinforcement against minor deformations. In both cases, the Hoffman & Gardener analysis effectively highlighted how different parameters interact with model outputs, establishing a clear priority of input features for targeted mix optimization and reliable predictive design. The comparative difference in variable impact between UCS and Go underlines the multifaceted behavior of treated soils, where strength and stiffness are governed by overlapping but distinct mechanisms.
The SHAP (SHapley Additive exPlanations) sensitivity analysis conducted for UCS and Go provides a model-agnostic, feature-level interpretation of how each input variable contributes to the output predictions, using cooperative game theory to assign individual contribution values. For UCS, the SHAP analysis shows that xanthan gum (XG) dosage exerts the most positive influence on strength prediction across all instances. Higher XG values generally correspond to increased UCS, as SHAP values rise sharply with XG levels, confirming the strong physicochemical bonding effect of biopolymers. Polypropylene fiber (PPF) content also contributes positively, particularly when combined with XG, reinforcing the tensile capacity and microstructural stability. Curing time, especially moving from 28 to 90 days, exhibits a cumulative positive SHAP impact, reflecting the ongoing gain in strength due to prolonged hydration and stabilization. Meanwhile, dry density appears with mixed influence: higher densities result in positive contributions to UCS up to an optimum, beyond which compaction effects may plateau or slightly reduce effectiveness, depending on water availability and pore pressure dynamics. For Go, the SHAP values indicate that dry density is the dominant variable, showing a consistently high positive influence on stiffness prediction. Higher densities lead to a more tightly packed soil matrix, increasing resistance to elastic deformation. Curing time remains a major factor, with longer durations contributing positively by allowing more complete bond development and stiffening of the treated matrix. XG content contributes positively but less steeply than in UCS, suggesting its elastic bonding effect is influential but not solely decisive in stiffness control. PPF has a marginal SHAP impact on Go, indicating it plays a secondary role in stiffness enhancement, more pronounced in tension-bearing mechanisms than in elasticity. In both UCS and Go cases, SHAP analysis enables precise identification of feature importance and direction of impact, validating and complementing the Hoffman & Gardener results. SHAP adds the benefit of local interpretability—showing how each individual sample is affected—which is critical for understanding mix design behavior under varying field conditions.
Comparing the outcomes of the Hoffman & Gardener and SHAP sensitivity analysis methods reveals aligned yet complementary insights that support sustainable foundation design through optimized Xanthan Gum (XG) utilization. The Hoffman & Gardener method provides a global sensitivity overview by quantifying the percentage impact of each input variable on the outputs. It identifies XG content as one of the top contributors to both unconfined compressive strength (UCS) and stiffness (Go), followed by dry density, curing period, and polypropylene fiber (PPF). This ranking confirms that increasing XG significantly enhances mechanical performance, supporting its prioritization in eco-efficient mix formulations for foundation materials. The global nature of this analysis helps in identifying which variables should be controlled during mix proportioning and site-specific design. On the other hand, the SHAP method offers both global and local interpretability by showing how individual variable values affect specific predictions. SHAP confirms the dominant role of XG in UCS prediction and its moderate role in Go enhancement. More critically, SHAP reveals the non-linear behavior of variables—such as diminishing returns in strength with excessively high XG or density, which the Hoffman & Gardener method cannot capture. SHAP also demonstrates interaction effects between variables, such as XG and curing time synergistically improving strength. Together, both methods reinforce the conclusion that optimal XG utilization combined with sufficient curing and appropriate dry density can significantly improve strength and stiffness, leading to more durable and sustainable foundations. The quantitative ranking from Hoffman & Gardener provides clarity for design guidelines, while the nuanced, instance-level insights from SHAP enable fine-tuning of formulations under varying field or material conditions.
6. Conclusions
This study set out to address the research gap in developing reliable, data-driven predictive frameworks for biopolymer- and fiber-stabilized soils, with a clear novelty in combining Decision Table algorithms with bio-inspired optimization techniques. The outcomes demonstrate both the experimental improvements from Xanthan Gum (XG) and Polypropylene Fiber (PPF) stabilization and the predictive strength of the proposed modeling approach.
Research Outcomes: • Experimental testing of 108 specimens showed that increasing XG dosage (1%, 3%, and 5%) and curing duration (28 and 90 days) significantly enhanced unconfined compressive strength (UCS) and stiffness (Go), supported by ultrasonic pulse velocity (UPV) results. • Among six bio-inspired optimization approaches applied to Decision Table (DT) models, the DT-Firefly and DT-Cuckoo algorithms achieved the highest predictive accuracy, with R2 up to 0.99, RMSE as low as 2.74, and accuracy exceeding 90% across both training and validation datasets. • Sensitivity analyses using Hoffman & Gardener and SHAP consistently identified XG dosage, curing period, and dry density as the most influential parameters, with SHAP providing deeper interpretability of variable interactions. • Comparative assessment with existing literature confirmed that the proposed framework outperformed earlier AI-based geotechnical models in predictive accuracy, error reduction, and robustness across performance metrics. • Recommendations and Practical Implications: • The integration of advanced machine learning with sensitivity analysis offers engineers a reliable tool for predicting UCS and Go, reducing reliance on costly and time-consuming laboratory testing. • The framework supports sustainable geotechnical design by optimizing biopolymer use, aligning with eco-conscious infrastructure development goals. • While this study focused on low-plasticity clay, the developed models are adaptable and can be retrained using data from other soil types or site-specific conditions, extending their applicability to broader geotechnical contexts. • In summary, the study successfully demonstrates the novelty of applying bio-inspired optimization to Decision Table algorithms for soil property prediction, bridging the identified research gap and contributing both methodologically and practically to sustainable geotechnical engineering. Although the present study is based on a single soil type, the developed framework is inherently adaptable and can be retrained with datasets from other soil types or field conditions, ensuring its practical applicability beyond the current experimental scope.
7. Practical application
The practical and field application of this research lies in its ability to offer a reliable, sustainable, and cost-effective solution for improving problematic soils particularly low-plasticity clays through the use of Xanthan Gum (XG) and Polypropylene Fibers (PPF). By combining biopolymer stabilization with advanced machine learning modeling, engineers and practitioners can accurately predict critical geotechnical parameters such as unconfined compressive strength (UCS) and small-strain stiffness (Go) without extensive laboratory testing. This enables more efficient mix design optimization on-site, reduces material wastage, and shortens project timelines. The predictive models and sensitivity tools developed can be directly applied in the design and performance evaluation of subgrades, embankments, shallow foundations, and pavement systems in both rural and urban geotechnical projects. Moreover, the environmentally friendly nature of XG and PPF aligns with green construction policies, making the framework highly suitable for sustainable infrastructure development in resource-sensitive or remote areas.
8. Recommendation for future research
Future research should focus on expanding the dataset by incorporating a wider range of soil types, including high-plasticity clays and silty soils, to enhance the generalizability of the developed models across diverse geotechnical conditions. Additional experimental parameters, such as cyclic loading behavior, permeability, and freeze-thaw resistance, should be included to evaluate long-term performance and durability of XG-PPF treated soils. The integration of other eco-friendly stabilizers and hybrid biopolymer systems could also be explored to optimize mechanical performance while maintaining environmental sustainability. Moreover, future studies should consider coupling the developed predictive framework with geospatial data and remote sensing tools to support real-time, site-specific soil improvement planning. Field-scale validation of the predictive models under actual loading and environmental conditions will further bridge the gap between laboratory modeling and in-situ application, ensuring practical deployment in infrastructure design and construction.
Future studies will also focus on extending the framework’s validation by incorporating datasets from diverse soil types, varying geological settings, and independent experimental campaigns, thereby enhancing its generalizability and demonstrating its robustness for wider geotechnical applications.
9. Research limitations
This research is limited by its focus on a specific soil type, namely low-plasticity clay (CL), which may restrict the applicability of the developed models to other soil classifications without further calibration. The experimental program, although comprehensive, was conducted under controlled laboratory conditions that may not fully replicate the variability and complexities of field environments, such as moisture fluctuations, load histories, and temperature variations. Additionally, the curing periods were limited to 28 and 90 days, which may not capture the complete long-term behavior of the treated soils. The study also relies on specific dosages of Xanthan Gum and Polypropylene Fibers, and the influence of higher or variable fiber content was not explored. From a modeling perspective, although the Decision Table framework with bio-inspired optimization yielded high accuracy, the models were built and validated using the same structured dataset, and their performance in real-world, unstructured data conditions remains untested. Furthermore, the interpretation of SHAP and Hoffman & Gardener sensitivity outcomes, while informative, may vary with changes in data size and distribution, potentially affecting the consistency of variable influence analysis.
The present framework has been validated only on low-plasticity clay, and its applicability to other soil types with varying mineralogical and mechanical properties remains to be established through future investigations.
Supplemental material
Supplemental Material - Development of data-driven framework for the geotechnical behavior of xanthan gum-treated clay reinforced with polypropylene fibers
Supplemental Material for Development of data-driven framework for the geotechnical behavior of xanthan gum-treated clay reinforced with polypropylene fibers by Kennedy C. Onyelowe, Viroon Kamchoom, Jair De Jesús Arrieta Baldovino, S. Anandha Kumar, Ahmed M. Ebid, Shadi Hanandeh, and Krishna Prakash Arunachalam in Composites and Advanced Materials.
Footnotes

Funding
The authors received no financial support for the research, authorship, and/or publication of this article.
Declaration of conflicting interests
The authors declared no potential conflicts of interest with respect to the research, authorship, and/or publication of this article.
Data Availability Statement
The supporting data for this research project is available from the corresponding author on reasonable request.
Declaration of generative AI and AI-assisted technologies in the writing process
During the preparation of this work the authors used “askai” in order to improve language and readability. After using this tool, the authors reviewed and edited the content as needed and take full responsibility for the content of the publication.
Supplemental material
Supplemental material for this article is available online.
References
Supplementary Material
Please find the following supplemental material available below.
For Open Access articles published under a Creative Commons License, all supplemental material carries the same license as the article it is associated with.
For non-Open Access articles published, all supplemental material carries a non-exclusive license, and permission requests for re-use of supplemental material or any part of supplemental material shall be sent directly to the copyright owner as specified in the copyright notice associated with the article.
