
Abstract
Purpose:
The purpose of this study was to examine the associations of demographics, diabetes-related symptoms, and egocentric social networks with loneliness among Black/African American men with type 2 diabetes (T2D).
Methods:
As part of a National Institute of Health–funded study, cross-sectional data were collected using an internet-based survey. Eligible respondents (n = 1220) were men who identified as Black/African American and self-reported having T2D. The dependent variable was loneliness, measured with the 3-item UCLA Loneliness Scale (UCLA-3; score ≥6 indicating loneliness). Diabetes symptoms were measured by Diabetes Care Profile items. Egocentric networks were elicited with a multiprompt name generator to derive network size, perceived support, and frequency of diabetes-specific discussions. Poisson egressions were fitted to examine associations of demographics, T2D symptoms, and social-network factors with loneliness.
Results:
Of the participants, 45.3% reported being lonely. In the Poisson regression, older age (prevalence ratio [PR] 0.99, 95% CI, 0.98-0.99), higher household income (PR 0.93, 95% CI, 0.88-0.98), and rural residence (PR 0.75, 95% CI, 0.59-0.96) were associated with a lower likelihood of loneliness. Greater hypoglycemia symptom burden was associated with a higher likelihood of loneliness (PR 1.24, 95% CI, 1.16-1.33). Higher perceived network support was associated with a lower likelihood of loneliness (PR 0.79, 95% CI, 0.72-0.88), while network size and diabetes-specific discussions with others were not significantly associated with loneliness.
Conclusions:
Diabetes care should routinely screen for loneliness, prioritize younger and lower income patients, and actively reduce hypoglycemia. Efforts to strengthen social support should emphasize strategies such as culturally responsive coaching to mobilize existing ties, warm handoffs to peer mentors, and community partnerships.
Type 2 diabetes (T2D) is a dominant and rapidly expanding public health problem in the United States. Nationally representative data show that adult onset T2D affected roughly 1 in 12 adults from 2017 to 2020, when combining diagnosed and undiagnosed estimates from the same survey platform. 1 One pooled analysis found 13% of non-Hispanic Black adults have T2D compared to about 8% for non-Hispanic White adults, underscoring a persistent disproportionate burden. 2 Across US demographics, T2D disproportionately affects Black/African American men, 2 reflecting the cumulative impact of clinical risk factors, structural racism, and social determinants of health across the life course.3,4 Studies indicate that diabetes disparities often reflect underlying social and economic conditions, including poverty, unemployment, and food access.5,6 A recent scoping review found that structural factors, including racism, may contribute to differences in glycemic control and self-care behaviors. 5
Psychosocial dynamics, specifically feelings of loneliness, intersect with T2D management. Evidence from prospective cohorts indicate that loneliness independently predicts the onset of T2D after adjustment for sociodemographic factors and body mass index, suggesting a pathway through stress, sleep, health behaviors, and inflammation that is not reducible to clinical risk alone. 7 Among people already living with T2D, loneliness and social disconnection are associated with higher risks of microvascular complications and worse self-management and distress; supportive, validating exchanges within one’s network are associated with better self-efficacy and adherence, including in studies focused on Black/African American men with T2D.8,9 Furthermore, given racially patterned barriers to care, technology, and trust,10,11 Black/African American men may face heightened vulnerability when loneliness coincides with disease self-management demands.
Loneliness is a subjective feeling of isolation defined as the perceived gap between desired and actual levels of social connection. 12 While an estimated 60% of American adults report feeling lonely, 13 racial and ethnic minoritized populations often experience this burden disproportionately.14,15 For Black/African American adults, loneliness is frequently patterned by structural racism and everyday discrimination, which shape social opportunity, trust in care, and access to resources. 16 Research indicates that subjective isolation and diminished emotional closeness are strongly linked to depressive symptoms and psychological distress in this population, often more so than infrequent contact alone. 17
Loneliness reflects a convergence of individual sociodemographic factors and racially patterned exposures.18,19 While national data attribute some racial disparities in loneliness to socioeconomic indicators such as income and education, 15 material resources alone do not fully account for the experience. Community-based research demonstrates that perceived everyday discrimination, including within health care settings, is robustly associated with greater loneliness and psychological distress among Black/African American adults independent of how often they interact with others.20,21 This pattern highlights that for this population, loneliness is shaped less by social quantity than by the perceived availability of safe, responsive support. Prior studies indicate that discrimination and marginalization within local environments erode social trust, elevating loneliness risk for Black/African American residents even when they live near others.22,23 These findings suggest that place-based stressors and institutional barriers may uniquely heighten isolation among Black/African American men, who already face distinct challenges in help-seeking and engagement with T2D care. 22
Symptom experiences of men living with chronic conditions, including T2D, can impact their loneliness by shaping when and how they engage socially.24,25 Hypoglycemia is unpredictable and publicly visible through tremors, confusion, and the need for assistance,26,27 which can foster fear and avoidance of social situations, reduce spontaneous outings, and encourage rigid planning of meals and transport, all patterns linked to lower social participation and greater distress.28,29 Hypoglycemia remains a major limiting factor in T2D management, while fear-driven avoidance can lead to less engagement with peers and family, with downstream effects on mood and perceived connection. 30 In contrast, hyperglycemia can degrade energy and well-being, thus indirectly restricting social activities, although hyperglycemic symptoms are often less conspicuous in real time. 31 Studies of adults with diabetes also have demonstrated that social events and gatherings introduce challenges to glycemic safety, such as limited food options, raising the perceived social costs of participation and reinforcing withdrawal for those who already feel isolated.32,33 Therefore, the fear and management of hypoglycemia or hyperglycemia can create social constraints that intensify loneliness. 34 This is particularly complex for Black/African American men; while they benefit from validating, autonomy-supportive assistance, they often report practical and cultural barriers to seeking visible help during symptoms.35,36
Personal social networks remain a modifiable, clinically relevant lever for intervention, 37 with functional support (eg, validating emotional/informational exchanges and respectful instrumental help) more predictive of health than structural metrics like size or density alone across conditions. 38 In diabetes specifically, higher perceived support relates to better glycemic control and lower distress, partly via reduced life stress, while criticism and controlling communication undermine adherence and belonging.39,40 Recent randomized and quasi-experimental studies illustrated that activating existing ties with autonomy-supportive, nonblaming scripts, often via low-burden channels such as text messaging, can improve psychosocial outcomes and in some subgroups, A1C.41,42 However, frequent disease-focused talk via nonvalidating and stigmatizing language can amplify strain and deter help-seeking.43,44
Many studies characterize loneliness or diabetes in broad, mixed-sex samples and rarely focus specifically on Black/African American men. The absence of focused studies limits our understanding about how sociodemographic position and egocentric network characteristics shape loneliness among this group of men. Prior research among Black/African American men underscores the importance of network quality for self-management,35,45-48 yet few investigations examine whether perceived support and discussion frequency are uniquely associated with loneliness within this population, especially when demographic and symptom profiles are considered simultaneously. Additionally, while studies have linked loneliness to T2D incidence, 49 most do not parse out symptom experiences, thus limiting our understanding about whether hypoglycemia and hyperglycemia relate differentially to loneliness when demographic context is held constant. To address these gaps, the purpose of the current study was to assesses the relative and combined contributions of sociodemographic factors, diabetes symptom profiles, and social network characteristics on self-reported loneliness among Black/African American adult men with T2D.
Methods
Research Design
The overall purpose of the parent study was to assess the attitudes, self-care behaviors, and social networks of Black/African American adult men diagnosed with T2D in the United States.35,45-48,50,51 Data were collected using a cross-sectional, internet-based survey (Qualtrics) between February and June 2024. Participants were recruited via CloudResearch, who directed potentially eligible men with T2D to the Qualtrics survey and directly compensated eligible men for their participation.
Study Participants and data Collection
An Institutional Review Board-approved information sheet (IRB2023-1311M) was provided at the beginning of the survey. Anonymity was assured, and all respondents gave electronic informed consent prior to participation. Data collection procedures safeguarded confidentiality, participation was voluntary, and participants could withdraw from the study at any time. Of 3965 individuals who initiated screening, 1225 participants met eligibility criteria: (1) self-identification as Black or African American, (2) male, (3) ages 21 years or older, (4) self-reported T2D diagnosis, and (5) residence in the United States. The survey instrument took participants about 20 minutes to complete. To enhance data quality and reduce careless responding, the instrument embedded 3 attention/validity checks; respondents were required to pass all 3, including instructed-response items. Among eligible men who completed the survey, 5 cases were excluded due to missing responses on loneliness, the primary dependent variable of this study. Consequently, the final analytical sample comprised 1220 respondents.
Measures
Dependent variable: 3-item UCLA Loneliness Scale
Loneliness was assessed using the 3-item UCLA Loneliness Scale, 52 which captures 3 subjective dimensions. Participants are asked: (1) How often do you feel that you lack companionship?; (2) How often do you feel left out?; and (3) How often do you feel isolated from others? Items were rated on a 3-point scale (1 = hardly ever, 2 = some of the time, 3 = often) and summed to yield a total score ranging from 3 to 9. In accordance with prior work,53,54 participants with scores from 3 to 5 were considered “not lonely,” and participants with scores 6+ were classified as “lonely.” Internal consistency in the present sample was high (Cronbach’s α = 0.87).
Demographic variables
Demographic characteristics were self-reported and included age, rurality, educational attainment, marital status, employment status, and annual household income. Age was assessed in years as a continuous variable in all analyses. Rurality was categorized as rural, suburban, or urban. Educational attainment was grouped as high school graduate/GED, some college/associate’s degree, or college graduate and above. Marital status was coded as married/partnered, never married, or divorced/separated/widowed. Employment status was coded as student, employed, unemployed, retired, or unable to work. Annual household income was reported in $25 000 increments (range: <$25 000 to ≥$150 000).
Diabetes symptomatology
Adverse T2D symptomatology was assessed using 2 items from the Diabetes Care Profile (DCP).55,56 These validated items capture the frequency of common glycemic symptoms, including hypoglycemic manifestations (eg, sweating, weakness, anxiety, trembling, hunger, headache) and hyperglycemic manifestations (eg, thirst, dry mouth/skin, increased urinary sugar, reduced appetite, nausea, fatigue) over the prior month. Consistent with DCP scoring procedures, each item was rated on a 5-point scale (0 = 0 times, 1 = 1-3 times, 2 = 4-6 times, 3 = 7-12 times, 4 = over 12 times).
Social networks
Personal (egocentric) social networks were elicited using a multiple name generator.57,58 Participants nominated individuals (termed alters) who (1) provide advice, (2) are considered a confidant, (3) offer practical assistance, and (4) make T2D management more difficult. Respondents could list the same alter across multiple prompts. For each nominated network member, participants reported demographics, behaviors, relationship characteristics, and alter-alter connections. Responses were aggregated to derive a network-level indicator, including network size, average perceived support, and frequency of diabetes-specific discussions, following established social network analytic protocols.59,60
Statistical analysis
All analyses were conducted using SPSS version 28 (SPSS Inc., Chicago, IL, USA). Participant characteristics were summarized with descriptive statistics. Bivariate associations of study variables across loneliness categories were examined using independent sample t tests and χ² tests. To assess the relative associations of demographics, diabetes symptomatology, and social networks with loneliness, we estimated a series of generalized linear models using Poisson regression with a log link and robust standard errors to obtain prevalence ratios (PRs). The models were specified as follows: (1) Model 1: demographics only; (2) Model 2: diabetes symptomatology only; (3) Model 3: social network variables only; (4) Model 4: demographics with diabetes symptomatology; (5) Model 5: demographics with social network variables; and (6) Model 6: full model including all variables. In models that included demographics, marital status was excluded because the social network size variable explicitly included a spouse/partner (when present), creating conceptual overlap and risk of multicollinearity. Thus, marital status was omitted from regression models to maintain a consistent demographic block across specifications. For all study analyses, statistical significance was set at P < .05.
Results
Sample Characteristics
Of the 1220 men with T2D, 45.3% (n = 553) reported being lonely. On average, participants were age 41.8 ± 14.5 years. Thirty-four percent of participants had a college degree or more education, 39.3% had some college education or an associate’s degree, and 26.7% had a high school education or less. Most participants reported being married or partnered (61.0%), employed (78.2%), and residing in urban (52.5%) or suburban (36.3%) areas. About 38% of participants reported annual household incomes of $49 999 or less, while 19.2% reported annual household incomes of $100 000 or more. See Table 1 for demographic details.
Samples Characteristics by Loneliness.
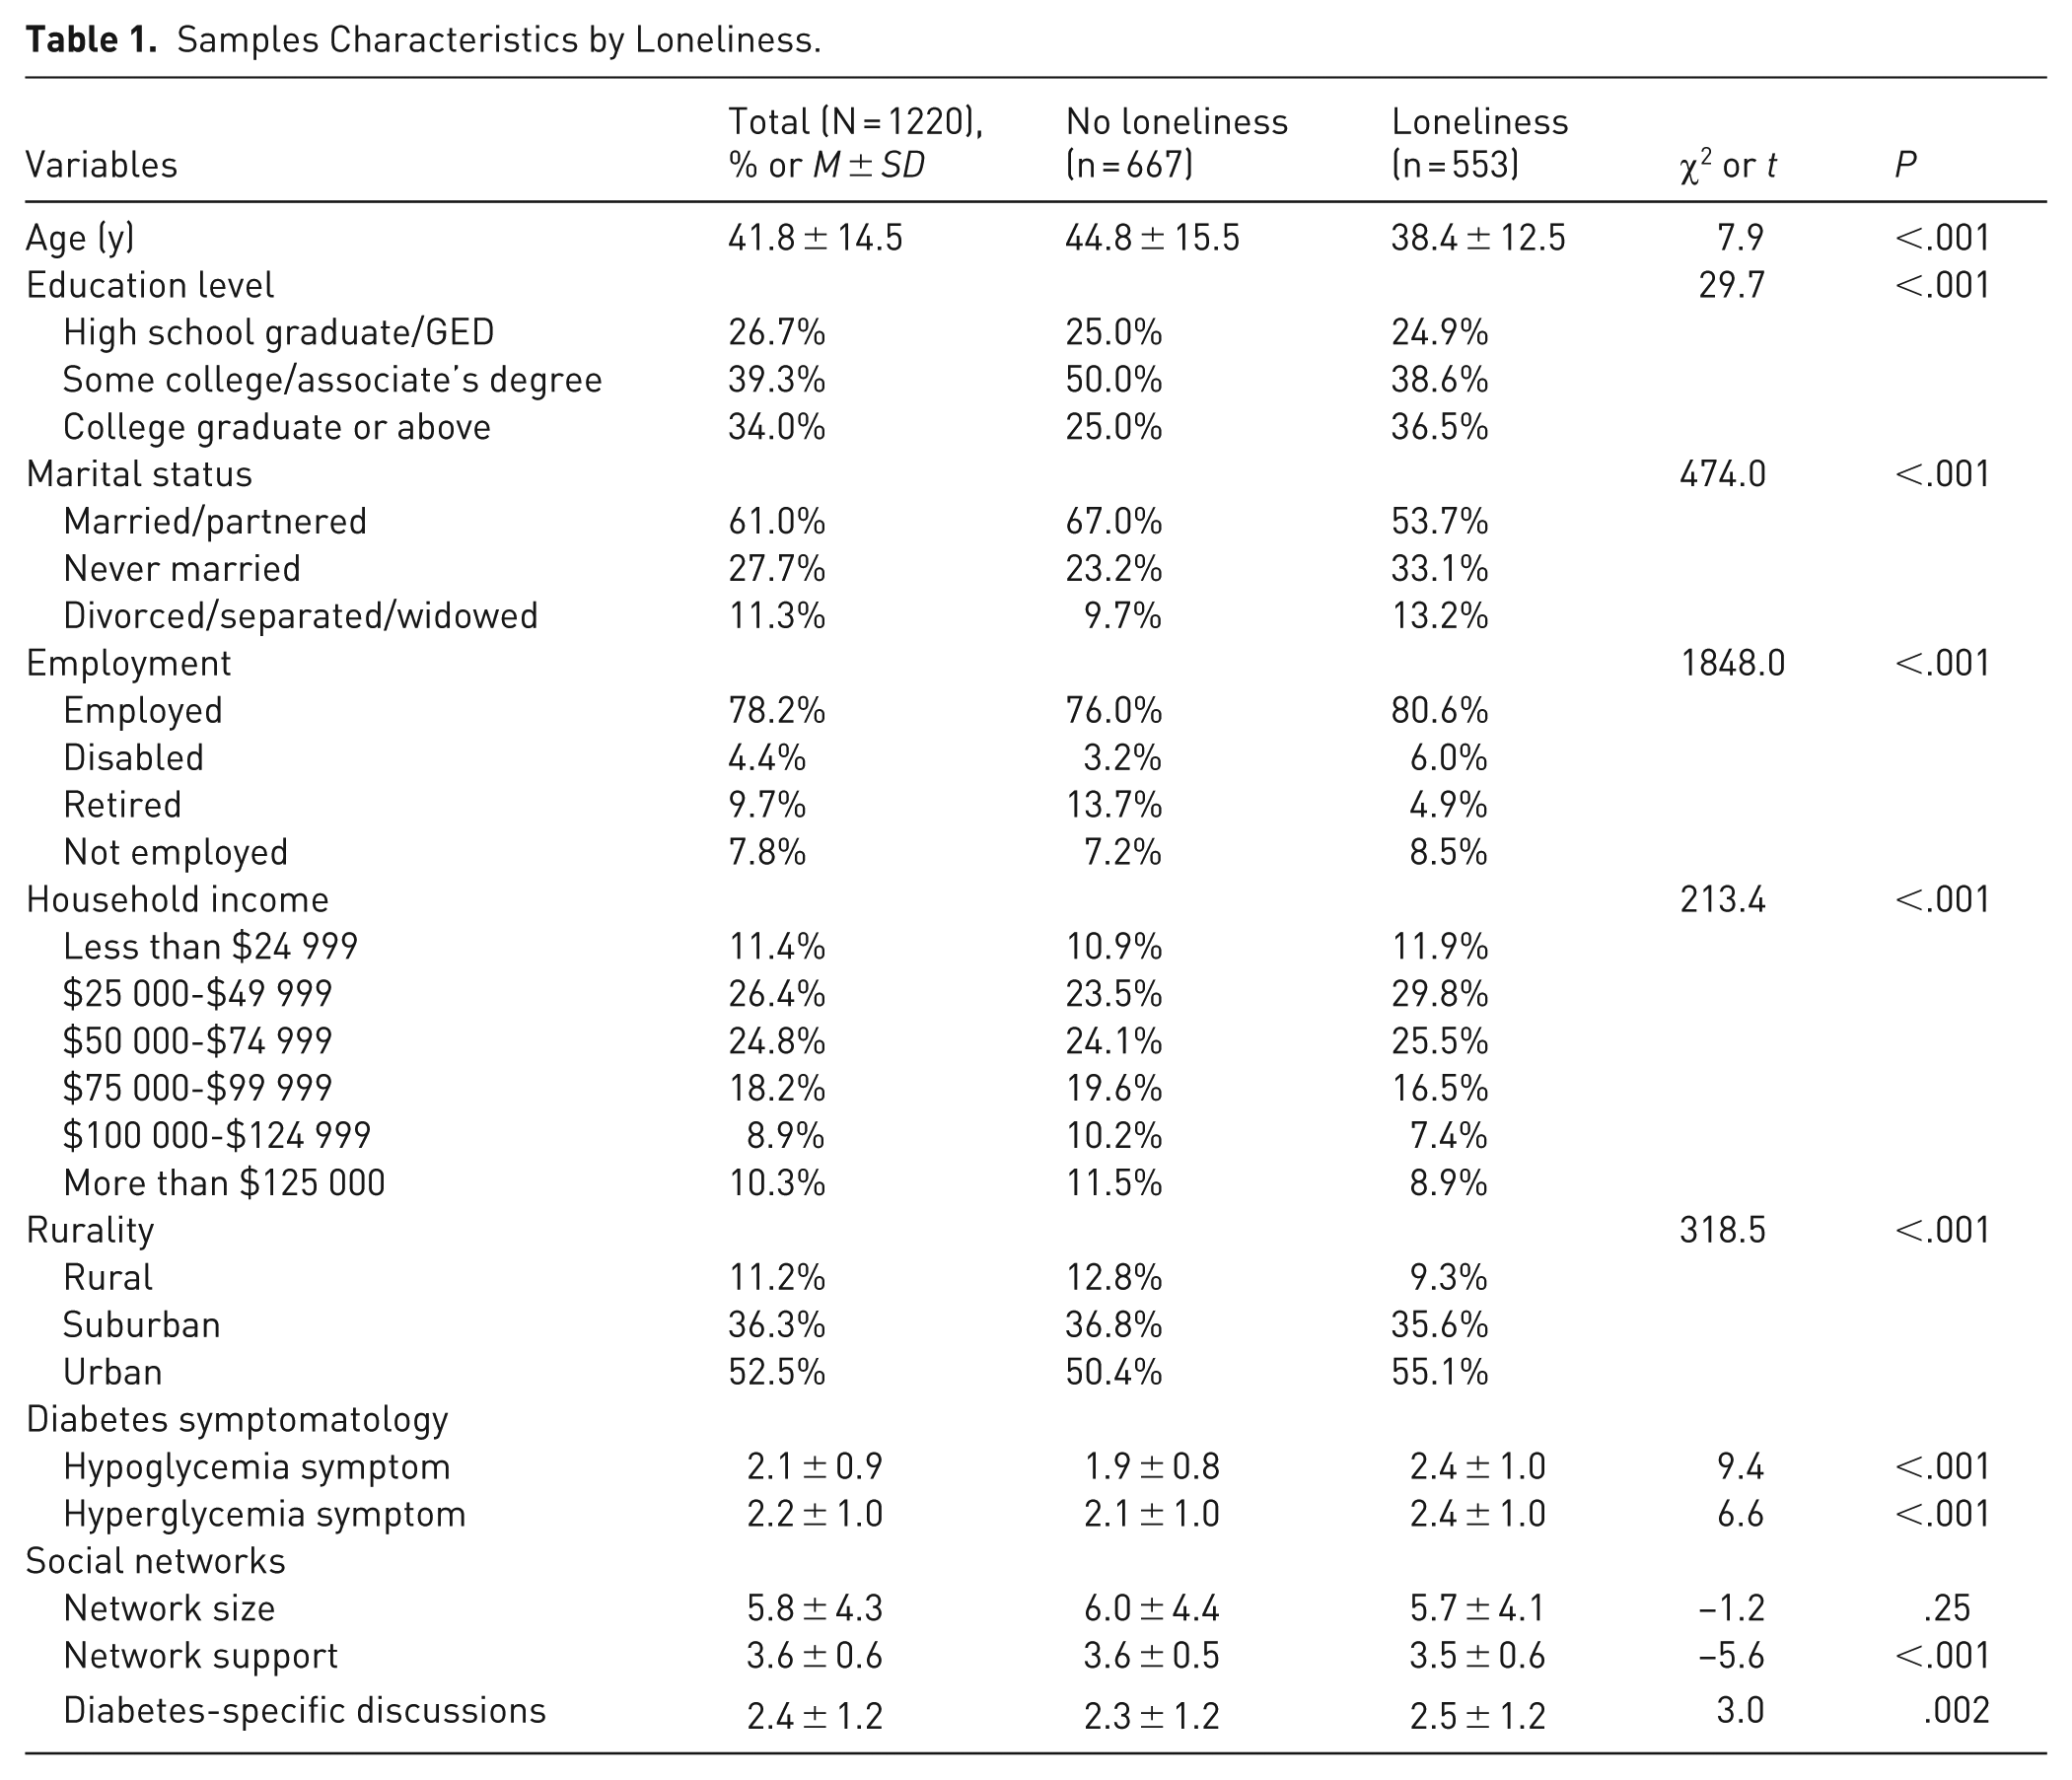
When comparing participant characteristics by loneliness status, on average, participants who were lonely were younger than those who were not lonely (38.4 years vs 44.8 years; t = 7.9, P < .001). Compared to men who were not lonely, significantly larger proportions of lonely men had a college degree or more education (χ2 = 29.7, P < .001), were never married or divorced/separated/widowed (χ2 = 474.0, P < .001), and were employed, disabled, or not employed (χ2 = 1848.0, P < .001). Larger proportions of men who were lonely reported lower categories of annual household incomes (χ2 = 213.4, P < .001) and resided in urban areas (χ2 = 318.5, P < .001) relative to nonlonely men. Regarding diabetes-related symptoms, on average, compared to nonlonely men, men who reported being lonely reported more frequent hypoglycemia (t = 9.4, P < .001) and hyperglycemia (t = 6.6, P < .001) symptoms. Regarding social network characteristics, on average, men who were lonely reported less network support (t = –5.6, P < .001) and more frequent diabetes-specific discussions (t = 3.0, P = .002) compared to their nonlonely counterparts. See Table 1 for complete comparisons.
Model 1 (Demographics Only)
In Model 1, younger age was associated with higher odds of reporting loneliness (PR 0.98, 95% CI, 0.98-0.99). Compared with those who were employed, participants reporting a disability were more likely to report loneliness (PR 1.53, 95% CI, 1.21-1.94). Having higher annual household income levels (PR 0.93, 95% CI, 0.88-0.98) and living in rural areas (vs urban) were associated with lower odds of reporting loneliness (PR 0.78, 95% CI, 0.62-0.97; Table 2).
Series of Sequential Poisson Regressions Examining Factors Associated With Loneliness.
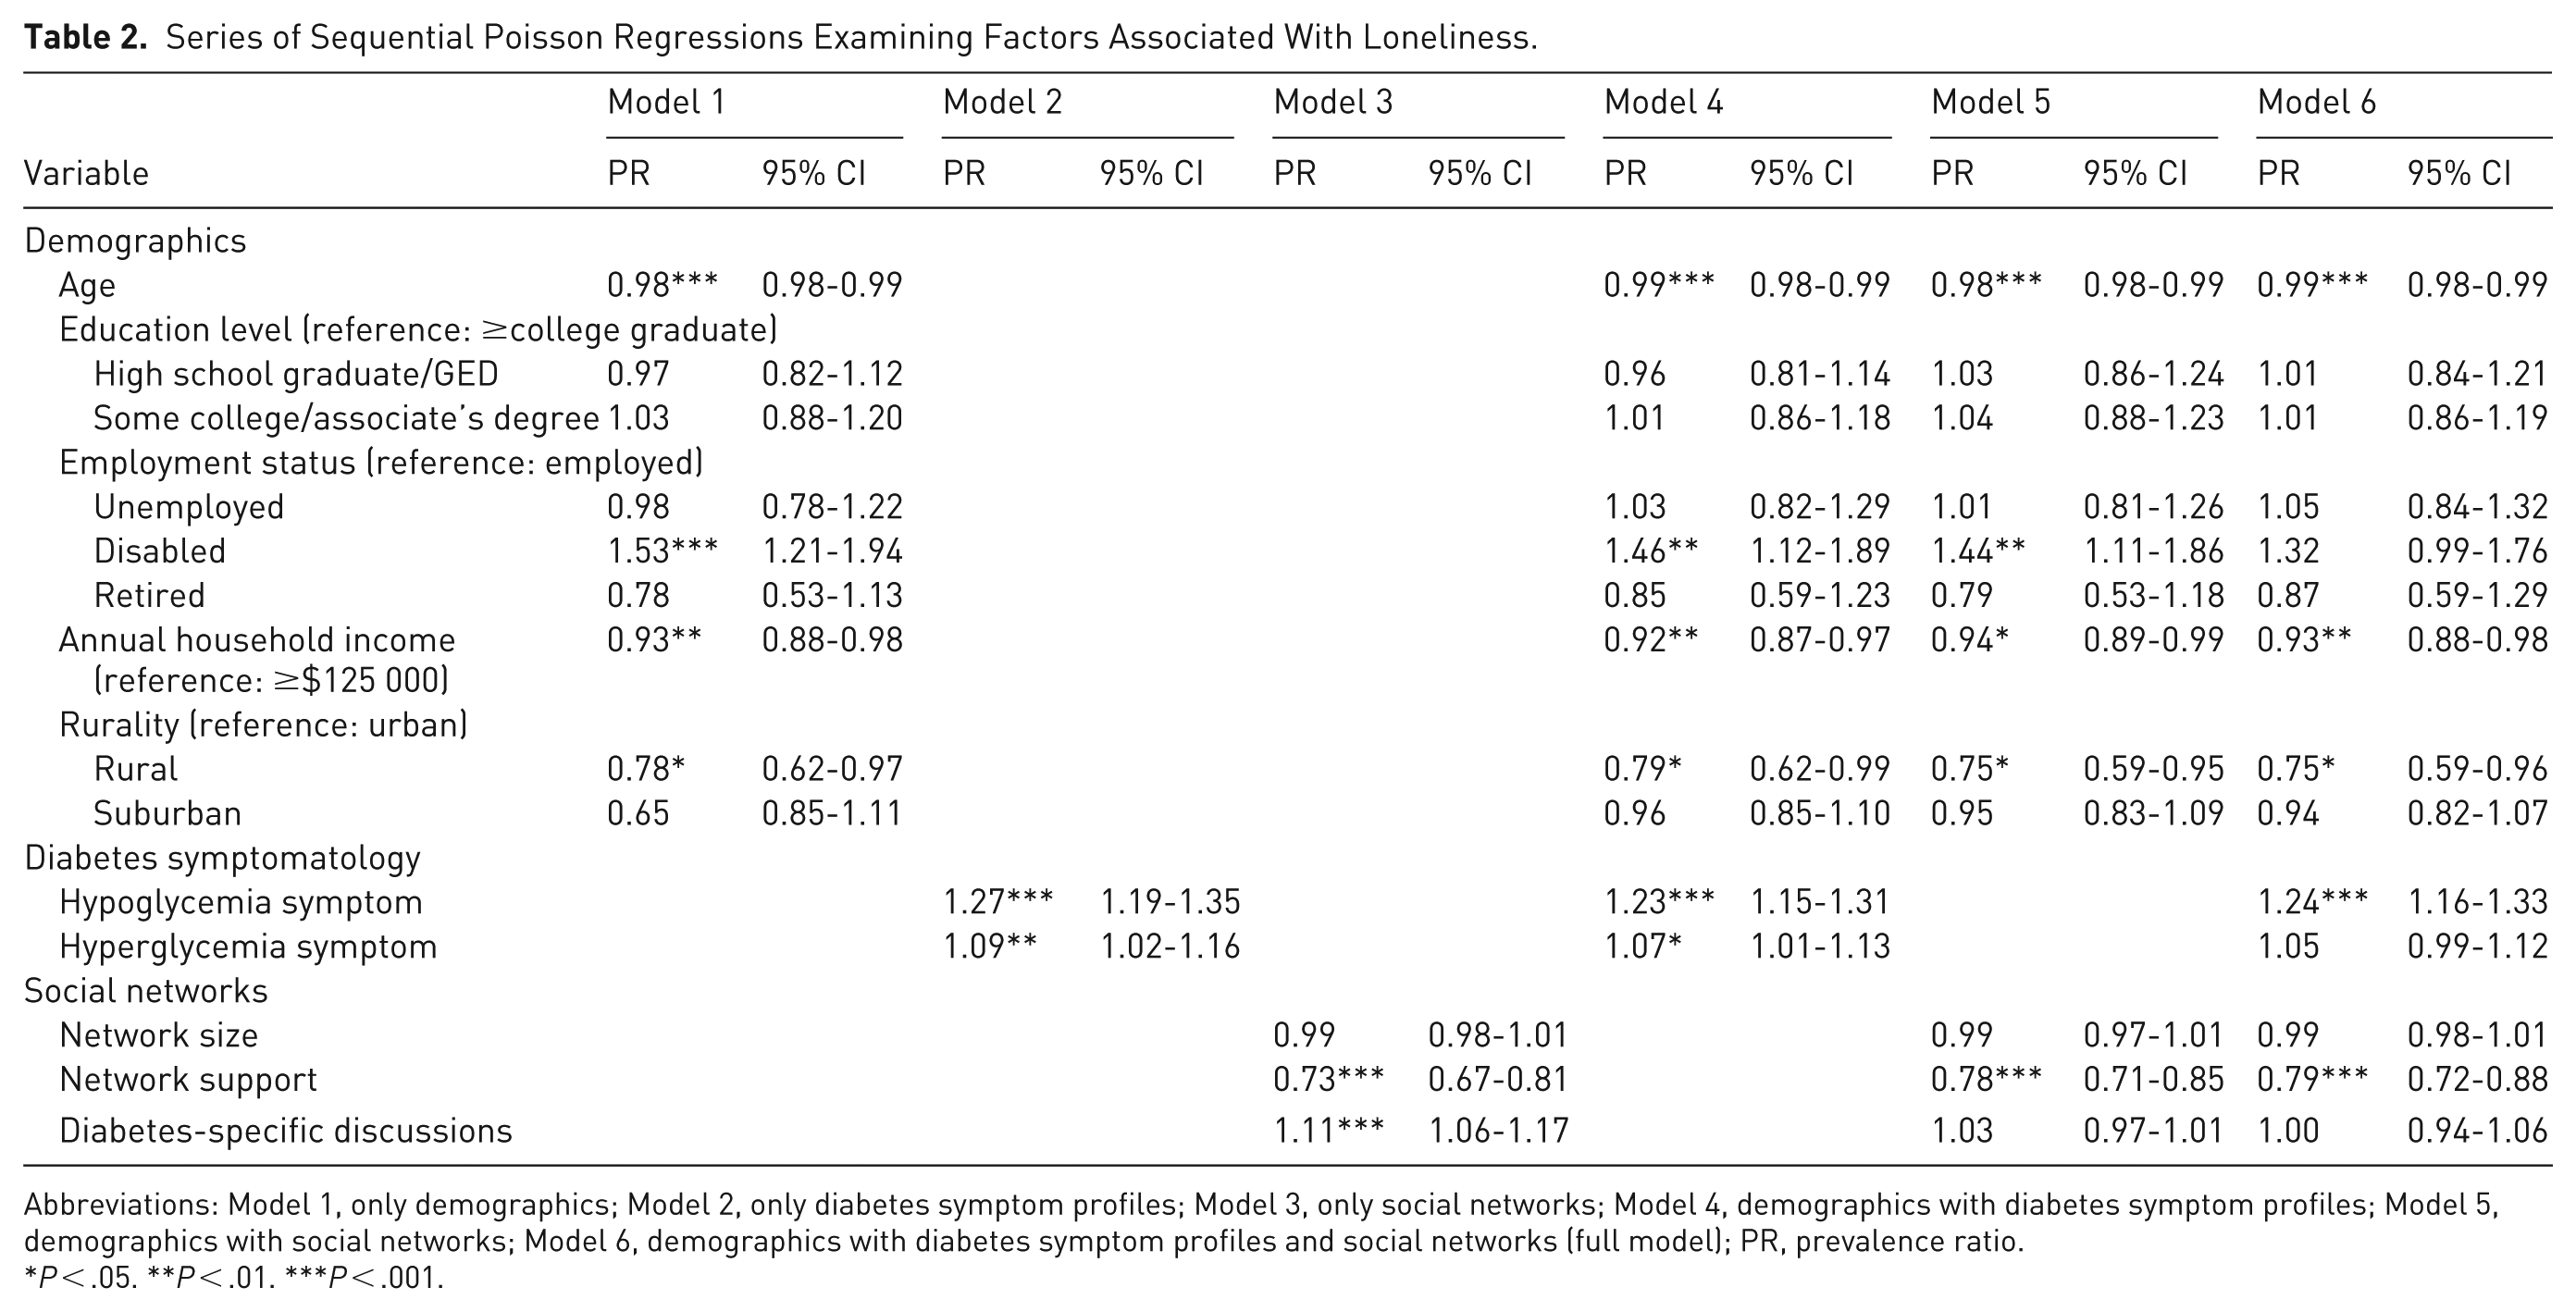
Abbreviations: Model 1, only demographics; Model 2, only diabetes symptom profiles; Model 3, only social networks; Model 4, demographics with diabetes symptom profiles; Model 5, demographics with social networks; Model 6, demographics with diabetes symptom profiles and social networks (full model); PR, prevalence ratio.
P < .05. **P < .01. ***P < .001.
Model 2 (Diabetes Symptomatology Only)
In Model 2, hypoglycemia symptoms (PR 1.27, 95% CI, 1.19-1.35) and hyperglycemia symptoms (PR 1.09, 95% CI, 1.02-1.16) were both positively associated with reporting loneliness (Table 2).
Model 3 (Social Networks Only)
In Model 3, greater network support was associated with lower odds of reporting loneliness (PR 0.73, 95% CI, 0.67-0.81); however, network size was not statistically significantly associated with reporting loneliness (95% CI, 0.98-1.01). More frequent diabetes-specific discussions within one’s network were associated with a higher likelihood of reporting loneliness (PR 1.11, 95% CI, 1.06-1.17; Table 2).
Model 4 (Demographics + Diabetes Symptomatology)
In Model 4, younger age was associated with lower odds of reporting loneliness (PR 0.99, 95% CI, 0.98-0.99). Compared to being employed, disability status was associated with a higher likelihood reporting loneliness (PR 1.46, 95% CI, 1.12-1.89). Annual household income had a negative association with reporting loneliness (PR 0.92, 95% CI, 0.87-0.97). Compared to residing in an urban area, having a rural residence had a lower likelihood of reporting loneliness (PR 0.79, 95% CI, 0.62-0.99). Participants with hypoglycemia symptoms (PR 1.23, 95% CI, 1.15-1.31) and hyperglycemia symptoms had higher odds of reporting loneliness (PR 1.07, 95% CI, 1.01-1.13; Table 2).
Model 5 (Demographics + Social Networks)
In Model 5, men of younger ages (PR 0.98, 95% CI, 0.98-0.99) and higher annual household incomes (PR 0.94, 95% CI, 0.89-0.99) were less likely to report loneliness. Compared to being employed, men on disability had higher odds of reporting loneliness (PR 1.44, 95% CI, 1.11-1.86). Relative to those in urban areas, men residing in rural areas were less likely to report loneliness (PR 0.75, 95% CI, 0.59-0.95). Having higher network support was inversely associated with reporting loneliness (PR 0.78, 95% CI, 0.71-0.85), while no significant association was observed for network size (95% CI, 0.97-1.01) or diabetes-specific discussions (95% CI, 0.97-1.01; Table 2).
Model 6 (Full Model: Demographics + Symptom Profiles + Social Networks)
In Model 6, the fully adjusted model, men of younger ages (PR 0.99, 95% CI, 0.98-0.99) and those with higher household incomes (PR 0.93, 95% CI, 0.88-0.98) were less likely to report loneliness. Compared to residing in urban areas, those in rural areas had lower odds of loneliness (PR 0.75, 95% CI, 0.59-0.96). Education level and employment status were not significantly associated with reporting loneliness, and disability compared with being employed was no longer significantly associated with reporting loneliness. Higher hypoglycemia symptoms increased the odds of reporting loneliness (PR 1.24, 95% CI, 1.16-1.33), whereas hyperglycemia symptoms were not significantly associated with reporting loneliness (95% CI, 0.99-1.05). Having greater network support was associated with lower odds of reporting loneliness (PR 0.79, 95% CI, 0.72-0.88); however, neither network size nor diabetes-specific discussions were significantly associated with self-reported loneliness (Table 2).
Discussion
The present cross-sectional study sought to identify drivers of loneliness among Black/African American men living with T2D in terms of sociodemographic characteristics, diabetes symptom profiles, and egocentric social network features. Older ages and higher household incomes were associated with lower likelihood of loneliness, as was rural residence. Symptomatically, greater hypoglycemia frequency remained positively associated with loneliness, whereas hyperglycemia did not show significant association with loneliness in the full model (Model 6). Regarding networks, higher perceived support was inversely associated with loneliness, while network size and diabetes-specific discussion frequency were not significant in the full model.
In the present study’s full model, younger age, lower household income, and urban residence were independently associated with greater loneliness. In contrast, the link between disability and loneliness association observed in demographic-only models attenuated once symptom burden and network support were included. These patterns mirror broader research on elevated loneliness among younger adults, underscoring the potential conflict between diabetes self-management (eg, regimented meals, self-monitoring) and the competing role demands of peak career and family formation years. 61 Among Black/African American men specifically, masculine role norms that uplift self-reliance and emotional restraint can suppress help-seeking and disclosure, which may be mechanisms amplifying loneliness in younger men navigating breadwinner and workplace pressures.62,63 The association with income level suggests that socioeconomic constraints impede social participation and support, thereby increasing loneliness. Within the context of diabetes, these financial barriers also restrict access to beneficial technologies, reinforcing persistent racial disparities in care. 3 By contrast, rural residence emerged as a protective factor against loneliness in this study. Although faith-based networks and neighborhood cohesion can also be present in both rural and urban settings, rural contexts may differ in the salience, accessibility, and day-to-day reliance on locally embedded informal ties and community social infrastructure, which may strengthen perceived connectedness for some groups. 64 Consistent with this interpretation, research across the rural-urban continuum suggests that patterns of loneliness are context-dependent and that features of social relationships and community embeddedness may be consequential for loneliness risk. 65 In Black/African American communities specifically, congregational relationships can constitute a key component of support networks. 66 Recent work further highlights that engagement with rural social infrastructure, including religious and spiritual organizations and other local gathering places, is associated with lower loneliness when it facilitates meaningful interaction. 67 Finally, attenuation of the disability-loneliness association after adjustment suggests that diabetes symptomatology and support quality may be explanatory pathways rather than mere confounders. This aligns with evidence that adults with disabilities experience chronically higher levels of loneliness that are tightly coupled to functional limitations and accessibility of support.68,69 Therefore, prioritizing routine loneliness screening and tailored supports for younger and lower-income men, especially those living in urban environments, is essential. To improve engagement, programs should leverage masculinity-congruent frameworks, such as skills-building and mastery-based messaging, that align with cultural values of autonomy and responsibility.70,71 Evidence supports partnering with trusted community institutions, such as barbershops and faith-based organizations, not merely as access points but also as venues for connection-enhancing interventions that normalize help-seeking through peer brotherhood and nonclinical support.72,73 In parallel, addressing urban barriers (eg, safety, discrimination, mobility) with place-based programming and reducing economic/technology barriers may indirectly relieve loneliness by improving symptom control and strengthening supportive ties.
Hypoglycemia symptoms showed a strong, persistent association with loneliness across all models, whereas the link between hyperglycemia and loneliness attenuated to nonsignificance after full adjustment. This divergence suggests that interventions should prioritize the specific psychosocial burden of hypoglycemia. This pattern may reflect the distinctive social salience of hypoglycemia. Hypoglycemia (low blood glucose) can occur abruptly and may involve confusion, impaired coordination, and other neurocognitive or behavioral changes that can disrupt everyday social interaction.74,75 Anticipatory concerns about experiencing a hypoglycemic episode in public, needing assistance, or having symptoms misinterpreted by others are central elements of fear of hypoglycemia as assessed in widely used measures.76,77 When fear is elevated, it can promote avoidance and safety behaviors, including restricting time away from trusted support, limiting travel or activity, and planning social engagements around access to monitoring and rescue resources, which can reduce spontaneity and opportunities for connection.77,78 Empirically, prior severe hypoglycemia exposure and depressive symptoms are among the most consistent correlates of fear of hypoglycemia, and severe events are associated with poorer emotional well-being and diabetes-specific quality of life.79,80 In contrast, hyperglycemia (high blood glucose) is often less sudden and can be managed more privately until it becomes clinically urgent, which may help explain its weaker unique association with loneliness once perceived support and other psychosocial factors are taken into account. 75
Collectively, routine loneliness screening in diabetes care using brief tools, such as the UCLA-3, should be paired with a brief assessment of hypoglycemia exposure and fear of hypoglycemia. Furthermore, pragmatic care plans should include medication review and titration to reduce lows, structured prevention and rescue planning, and education plus technology supports. Use of continuous glucose monitors (CGMs) reduces time in hypoglycemia and, across trials and meta-analyses, produces small to moderate improvements in fear of hypoglycemia and related patient-reported outcomes.81,82 Finally, framing hypoglycemia prevention and self-management skills as mastery and autonomy enhancing may be especially resonant for Black/African American men, 70 for whom masculine role norms and discrimination related stress are established barriers to help-seeking. 63 Language that affirms competence and control can mitigate reactance and increase engagement.62,63 Given emerging evidence that loneliness itself elevates future diabetes risk, integrating these components may confer dual benefit for glycemia and social health. 83
In social networks, perceived support rather than network size consistently shows the most reliable protection against loneliness, reflecting the key distinction between structural connection and functional support. Structural indicators such as number of ties or contact frequency do not ensure emotional availability or appraisal support, whereas perceived responsiveness and quality do, and these functional aspects predict better mental and physical health as well as lower loneliness.84-86 In diabetes contexts, supportive family and peers facilitate day-to-day self-management through instrumental aid, collaborative problem-solving, and encouragement, and they can buffer diabetes-related distress.87,88 In contrast, critical or controlling exchanges are reliably linked to poorer adherence and worse glycemic control, 89 underscoring that the tone of interaction matters more than the simple presence of network members.
In this study, diabetes-specific discussion frequency related positively to loneliness in each separated model but not the full model. This pattern is compatible with selective mobilization, in which people who feel lonelier and more symptomatic talk about diabetes more often out of necessity. 90 However, whether such conversations reduce loneliness appears to depend on their affective quality rather than their frequency, consistent with work showing that negative or critical exchanges carry stronger effects on well-being than positive exchanges and that perceived supportive quality is the active ingredient.84,91 Intervention efforts should therefore prioritize skills that enhance perceived supportive quality for both patients and network members. Brief coaching in validating and nonblaming communication, problem-focused collaboration, and autonomy-supportive responses can be layered onto routine care and peer programs. Network-informed strategies can also be used to seed these skills through influential alters and supportive subgroups rather than simply increasing the volume of diabetes-related talk. 92
Loneliness is a modifiable risk factor linked to broad morbidity and mortality, making it a legitimate target for diabetes care and population health strategy.93,94 For Black/African American men with T2D, routine clinical workflows should integrate brief loneliness screening (eg, UCLA-3) alongside targeted assessment of hypoglycemia frequency and fear because optimizing hypoglycemia prevention and response (eg, medication titration, CGM education, rescue plans) can reduce activity restriction and social withdrawal that perpetuate loneliness. Additionally, health systems should adopt a stepped-care pathway that pairs screening with warm handoffs to behavioral health and referrals to community-based diabetes and disease self-management programming39,95 while addressing technology inequities by prioritizing access to CGMs in safety-net settings where disparities are pronounced. 3 Program design should be culturally resonant and masculinity-congruent, emphasizing mastery, autonomy, and peer “brotherhood,”50,96 and delivered through trusted venues, such as barbershops, churches, and fraternal organizations, that have demonstrated effectiveness for cardiometabolic risk reduction among Black/African American men. 62 Finally, because perceived support buffers loneliness, interventions should cultivate supportive communication skills among patients and their natural helpers (eg, partners, friends, and pastors), focusing on validating, nonblaming dialogue and practical problem-solving rather than simply increasing diabetes-related talk.
Limitations
Study strengths include a large nationwide US sample of Black/African American men with T2D, attention to both structural and functional network features, and simultaneous modeling of demographics, symptoms, and networks. Several limitations warrant caution. First, the cross-sectional design precludes causal inference; loneliness may exacerbate symptom perception or vice versa. Second, key measures were self-reported, and diabetes symptoms were assessed using a brief questionnaire subset rather than clinician-administered assessment. Third, the internet-based, opt-in panel may limit generalizability to men with lower digital access. Fourth, unmeasured correlations (eg, depressive symptoms, diabetes distress, perceived discrimination, neighborhood cohesion) could account for residual confounding. Finally, objective glycemia and clinical history (eg, A1C, severe hypoglycemia events) were not available to triangulate symptom reports. Longitudinal and mixed-methods studies are needed to clarify temporal ordering and potential bidirectionality (eg, whether hypoglycemia predicts subsequent loneliness or vice versa), including panel designs analyzed with cross-lagged models within a structural equation modeling framework, to elucidate mechanisms (eg, fear of hypoglycemia, activity avoidance, masculine norms) and identify which network processes (supportive communication vs critical talk) most strongly influence loneliness trajectories. Trials should test multicomponent strategies that combine hypoglycemia prevention with connection building and supportive communication training in trusted community settings while addressing technology disparities in CGM use and telehealth for lower income men. 3 Lastly, place-based work comparing urban micro-environments (eg, neighborhoods with different social infrastructure) can explain the observed rural advantage and inform urban design and programming.
Conclusion
Among Black/African American men with T2D, loneliness is patterned by age, income, and place; is tightly linked to hypoglycemia symptom burden; and is buffered by perceived network support. Screening for loneliness and fear/experience of hypoglycemia, optimizing hypoglycemia management, and strengthening supportive communication within culturally resonant networks represent pragmatic, equity-minded levers to reduce loneliness and improve diabetes outcomes.
Footnotes
Ethical Considerations
The study was approved by the Institutional Review Board at Texas A&M University (IRB2023-1311M).
Consent to Participate
Written informed consent was obtained from all participants prior to data collection. Consent was documented electronically when participants accessed the survey via the study link.
Author Contributions
Study conceptualization: MLS; Methodology: J-HP and MLS; Data analysis: J-HP; Data collection and cleaning: J-HP and TP; Original draft preparation: J-HP and MLS; Draft review and editing: J-HP, TP, MSP, LDS, HOT, and MLS; Study supervision: MLS; Funding acquisition: TP, LDS, and MSP.
Funding
The authors disclosed receipt of the following financial support for the research, authorship, and/or publication of this article: The present study was supported by the National Institute of Minority Health and Health Disparities R21 grant (R21MD019048).
Declaration of Conflicting Interests
The authors declared no potential conflicts of interest with respect to the research, authorship, and/or publication of this article.
Data Availability Statement
The data sets used and/or analyzed during the current study are available from the corresponding author upon reasonable request.