
Abstract
Variability in glial fibrillary acidic protein (GFAP) and ubiquitin carboxy-terminal hydrolase L1 (UCH-L1) values across different assay platforms complicates cross-study comparisons and pooled analyses. We compared GFAP and UCH-L1 concentrations analyzed using the Abbott Alinity i TBI test (Alinity) and the Quanterix Neuro Four-plex B assay (Quanterix). We analyzed paired plasma samples from patients enrolled in the Transforming Research and Clinical Knowledge in Traumatic Brain Injury study. GFAP was measured in 185 participants, and UCH-L1 in 181. We assessed the correlation between the two assays using Spearman’s correlation coefficient and agreement using the Bland–Altman plot. We applied Passing–Bablok regression to generate the conversion equations from Alinity to Quanterix. The Quanterix platform reported higher GFAP concentrations (median = 2229 pg/mL) than the Alinity platform (median = 423 pg/mL), with a strong correlation (ρ = 0.992). Passing–Bablok regression comparing the full range of Quanterix versus Alinity on log-transformed data produced a slope of 1.05 (95% confidence interval [CI]: 1.03–1.07) and an intercept of 0.64 (95% CI: 0.59–0.69), indicating a systematic difference across the range. For UCH-L1, the Alinity platform yielded higher values (median = 379 pg/mL) compared with Quanterix (median = 128 pg/mL), with a moderate correlation (ρ = 0.724). The regression slope for the full range log-transformed values was 0.74 (95% CI: 0.65 to 0.84) with an intercept of 0.22 (95% CI: −0.04 to −0.45), indicating a significant proportional difference between the two platforms. GFAP measurements were closely aligned between platforms, while the UCH-L1 values had more variability. Findings support the feasibility of cross-platform conversion.
Introduction
Several assays for measuring glial fibrillary acidic protein (GFAP) and ubiquitin carboxy-terminal hydrolase L1 (UCH-L1) are currently available.1–4 These include assays approved by the Food and Drug Administration (FDA) for clinical diagnostic use and assays intended exclusively for research purposes. In traumatic brain injury (TBI), measuring blood concentrations of GFAP and UCH-L1 can assist clinicians in deciding whether to perform brain Computed Tomography (CT) imaging among TBI patients with Glasgow Coma Scale (GCS) of 13–155–7 and help in predicting clinical outcomes 8 and monitoring response to therapy. 9 However, GFAP and UCH-L1 concentrations obtained from assays produced by different manufacturers may not be interchangeable. This is primarily because these assays may differ in their detection methods, antibodies, reagents, and calibration standards. Consequently, these analytical differences limit direct comparison of results between studies and the ability to perform meta-analyses or pooled analyses across datasets.
Plasma concentrations of GFAP and UCH-L1 measured using the Quanterix Single Molecule Array (Quanterix platform) (Simoa) Neurology Four-plex B assay (Quanterix) and the Abbott Alinity TBI plasma (Alinity) test have been widely reported in the literature. The two largest observational cohort studies in TBI reported GFAP and UCH-L1 concentrations using different assays. The Europe-based CENTER-TBI (Collaborative European NeuroTrauma Effectiveness Research in TBI) study has utilized the Quanterix assay. 10 In contrast, the US-based Transforming Research and Clinical Knowledge in Traumatic Brain Injury (TRACK-TBI) study has reported values measured by the Abbott Alinity test. 8 It remains unclear whether data from these two large cohorts, or from other studies using these assays, can be meaningfully combined in a pooled analysis.
This study aimed to compare GFAP and UCH-L1 concentrations measured using the Alinity and Quanterix assays and to develop equations for converting values between platforms.
Methods
Study cohort
The TRACK-TBI study (NCT01565551) is a prospective longitudinal study of the natural history of TBI. 11 Participants included patients who had experienced acute TBI by the original American Congress of Rehabilitation Medicine criteria. 12 These criteria specify that patients must have evidence of a traumatic disruption of normal brain function, demonstrated by loss of consciousness, altered mental status, or amnesia. Eligible participants were individuals across the GCS spectrum (3–15) who underwent a clinically indicated noncontrast brain CT scan within 24 h following injury. We excluded patients with penetrating head injuries, those participating in other interventional trials, spinal cord injury with significant motor impairment (American Spinal Injury Association score of C or worse), and patients with severe preinjury neurological or psychiatric conditions. Institutional Review Board approval was obtained, and informed consent processes adhered to the established TRACK-TBI study protocol. Blood samples were collected following the National Institute of Neurological Disorders and Stroke (NINDS) TBI Common Data Elements (CDE) Biospecimen and Biomarkers Working Group Guidelines, 13 centrifuged and stored at −80°C within 2 h of collection. They were thawed and centrifuged before GFAP and UCH-L1 were measured in batches. Brain CT scans were read by a board-certified neuroradiologist following the established neuroimaging standards of the NINDS TBI CDE. 14
We measured GFAP and UCH-L1 concentrations from the same blood draw, using paired plasma aliquots collected from each patient. We utilized two assay platforms: the Abbott Alinity i system (hereafter referred to as Alinity) and the Quanterix Simoa Neurology 4-Plex B assay (hereafter referred to as Simoa). The Alinity assay, cleared by the FDA for clinical use, has an analytical measuring range for GFAP of 6.1–42,000 pg/mL, with a lower limit of detection (LLOD) of 3.2 pg/mL, a lower limit of quantitation (LLOQ) of 6.1 pg/mL, and intraassay and interassay coefficient of variations (CVs) of 2.5–5.0%. For UCH-L1, the Alinity assay has an analytical measuring range of 26.3–25,000 pg/mL, an LLOD of 18.3 pg/mL, an LLOQ of 26.3 pg/mL, and intraassay and interassay CVs of 2.6–6.0%. The Simoa platform is designed for high-sensitivity research applications. With the Simoa Neurology 4 plex B (ITEM # 103345), run on the High Definition Analyzer (Simoa instrument) (HDX) instrument. The GFAP assay has a dynamic range of 1.51–40,000 pg/mL, an LLOD of 1.51 pg/mL, an LLOQ of 9.38 pg/mL, and interassay and intraassay CVs of 4.1–13.4%. The UCH-L1 assay spans 1.90–40,000 pg/mL, with an LLOD of 1.90 pg/mL, an LLOQ of 9.38 pg/mL, and interassay and intraassay CVs of 3.3–14.7%. For each assay, previously frozen plasma samples were thawed and run in batches on the automated assay systems according to the manufacturer’s protocol, with all assays performed by operators blinded to clinical data. The Alinity i TBI assay uses a six-point calibration curve for each analyte to convert chemiluminescent signal into analyte concentration, with calibrators manufactured gravimetrically and traceable to internal reference standards. The Simoa assay uses an analyte-specific calibration curve for each analyte to convert single-molecule array fluorescence signal (average enzymes per bead) into analyte concentration, with calibrators value-assigned per lot to maintain consistency of results across kit lots.
Statistical analysis
We summarized biomarker values (pg/mL) from each platform and differences between the two platforms using descriptive statistics, including median, interquartile range (IQR), and range. Biomarker data were found to be right-skewed; therefore, descriptive analyses used nonparametric approaches. Spearman’s rank correlation coefficient (ρ) was calculated to assess the strength of monotonic association between measurements from the two platforms. A Bland–Altman plot was produced to evaluate the agreement between the two platforms. Due to the skewness of the biomarker distribution and a significant increase in differences at higher biomarker levels observed in the Bland–Altman plot, we log-transformed the data and applied Passing–Bablok regression 15 to quantify the relation of log-transformed Simoa values versus the log-transformed Alinity values. The nonparametric Passing–Bablok regression method estimates slope and intercept from the medians of slopes between all point pairs. It assumes both assays have measurement error and is robust to outliers. The 95% confidence intervals (CIs) for the regression parameters were calculated using a bootstrap resampling method. Residual plots were examined to ensure the relationship was linear and the variance remained roughly constant across the measurement range. Sensitivity analysis was also performed on a shared range subset where biomarker values were within the analytical range of each platform. All statistical analyses were conducted using R version 4.4.1. The “mcr” package was used for the regression analysis. 16
Results
Study population
The study included 185 participants with suspected TBI, with an average age of 40.3 years (SD 17.5) and 64.3% male. Most participants were White (72.4%), followed by Black (18.9%) and Hispanic (12.0%). Road traffic incidents (54.6%) and falls (26.8%) were common injury mechanisms. Loss of consciousness occurred in 81.0%, and 79.3% had post-traumatic amnesia. A total of 74.9% could be classified as mild TBI based on a presenting GCS of 13–15, and 55.0% had CT-positive findings. Blood samples were drawn <17 h post-injury in 50.8% of participants. See Table 1. for a detailed description of the demographic and clinical characteristics of the study population.
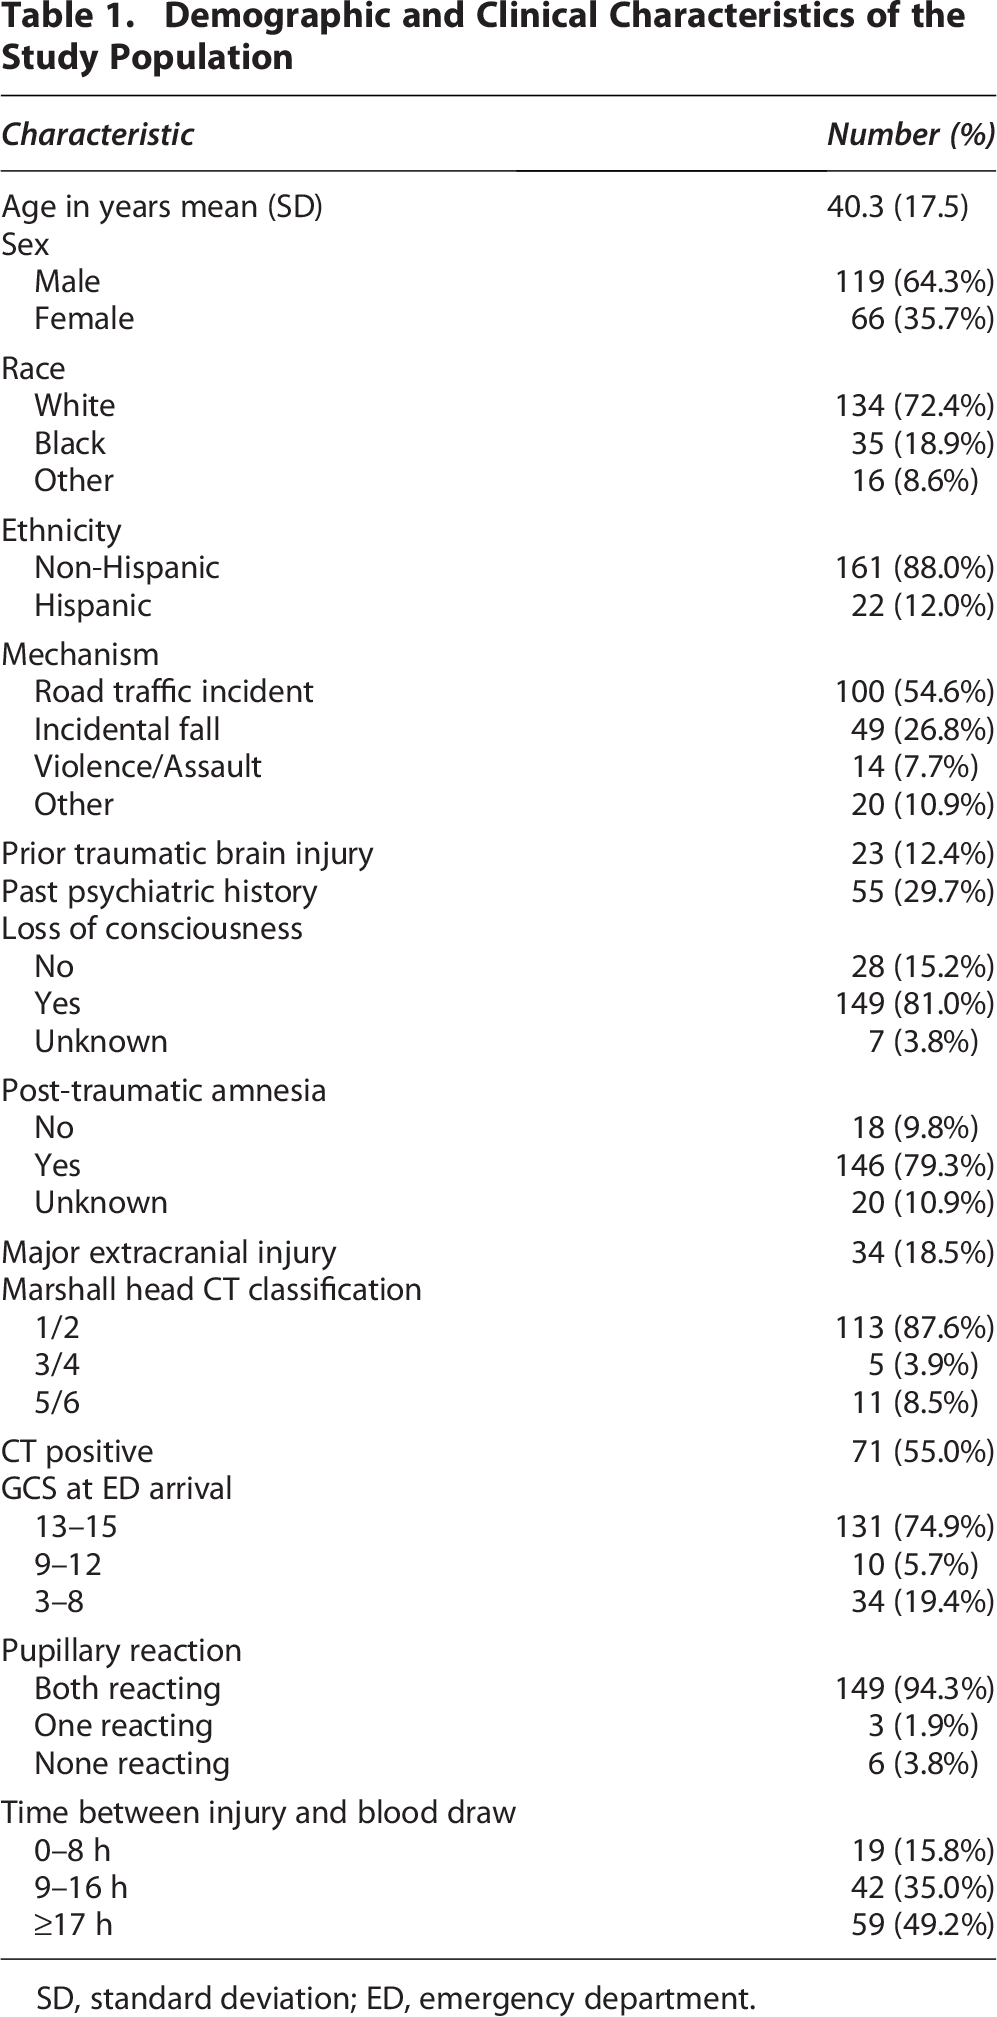
SD, standard deviation; ED, emergency department.
Correlation between Simoa and Alinity assays and the Passing–Bablok regression conversion from Alinity to Simoa for GFAP
GFAP was measured in 185 participants, and UCH-L1 in 181. Descriptive statistics indicated substantial differences in absolute concentrations between platforms. For GFAP, the Simoa assay reported a median concentration of 2229 pg/mL (IQR: 495–13,210), while the Alinity assay reported a median of 423 pg/mL (IQR: 94–2078). The median difference between platforms (Simoa minus Alinity) was 1852 pg/mL (IQR: 389–10,756). Despite these magnitude differences, the correlation between platforms was strong, with a Spearman’s ρ of 0.992. The Bland–Altman plot on the raw scale showed a significant increase in the differences in GFAP values at higher GFAP levels, suggesting a proportional bias. In contrast, the Bland–Altman plot on the log-transformed data showed a fairly stable difference across the measurement range (Fig. 1), indicating that the log transformation effectively stabilized the variance. Passing–Bablok regression on the log-transformed data produced a slope of 1.05 (95% CI: 1.03–1.07) and an intercept of 0.64 (95% CI: 0.59–0.69), indicating a consistently higher log-transformed GFAP concentration from Simoa compared with Alinity (Fig. 2A). Because the slope is close to 1 while the intercept is well above 0, the difference between platforms reflects a roughly constant fold increase in Simoa values across the measurement range, rather than a bias that increases with increasing concentration. Correspondingly, we can convert the raw Alinity values to the raw Simoa values using the following equation: GFAPSimoa = 4.352 × (GFAPAlinity)^1.05. A sensitivity analysis (n = 169) restricted to values within the analytical range of both assays (Alinity: 6.1–42,000 pg/mL; Simoa: 1.51–40,000 pg/mL) yielded similar results, with a Passing–Bablok regression slope of 1.04 (95% CI: 1.02–1.06) and an intercept of 0.65 (95% CI: 0.61–0.71), supporting the robustness of the conversion across clinically relevant concentrations. The conversion equation for GFAP limited to the analytical range of the assays is GFAPSimoa = 4.499 × (GFAPAlinity)^1.042.
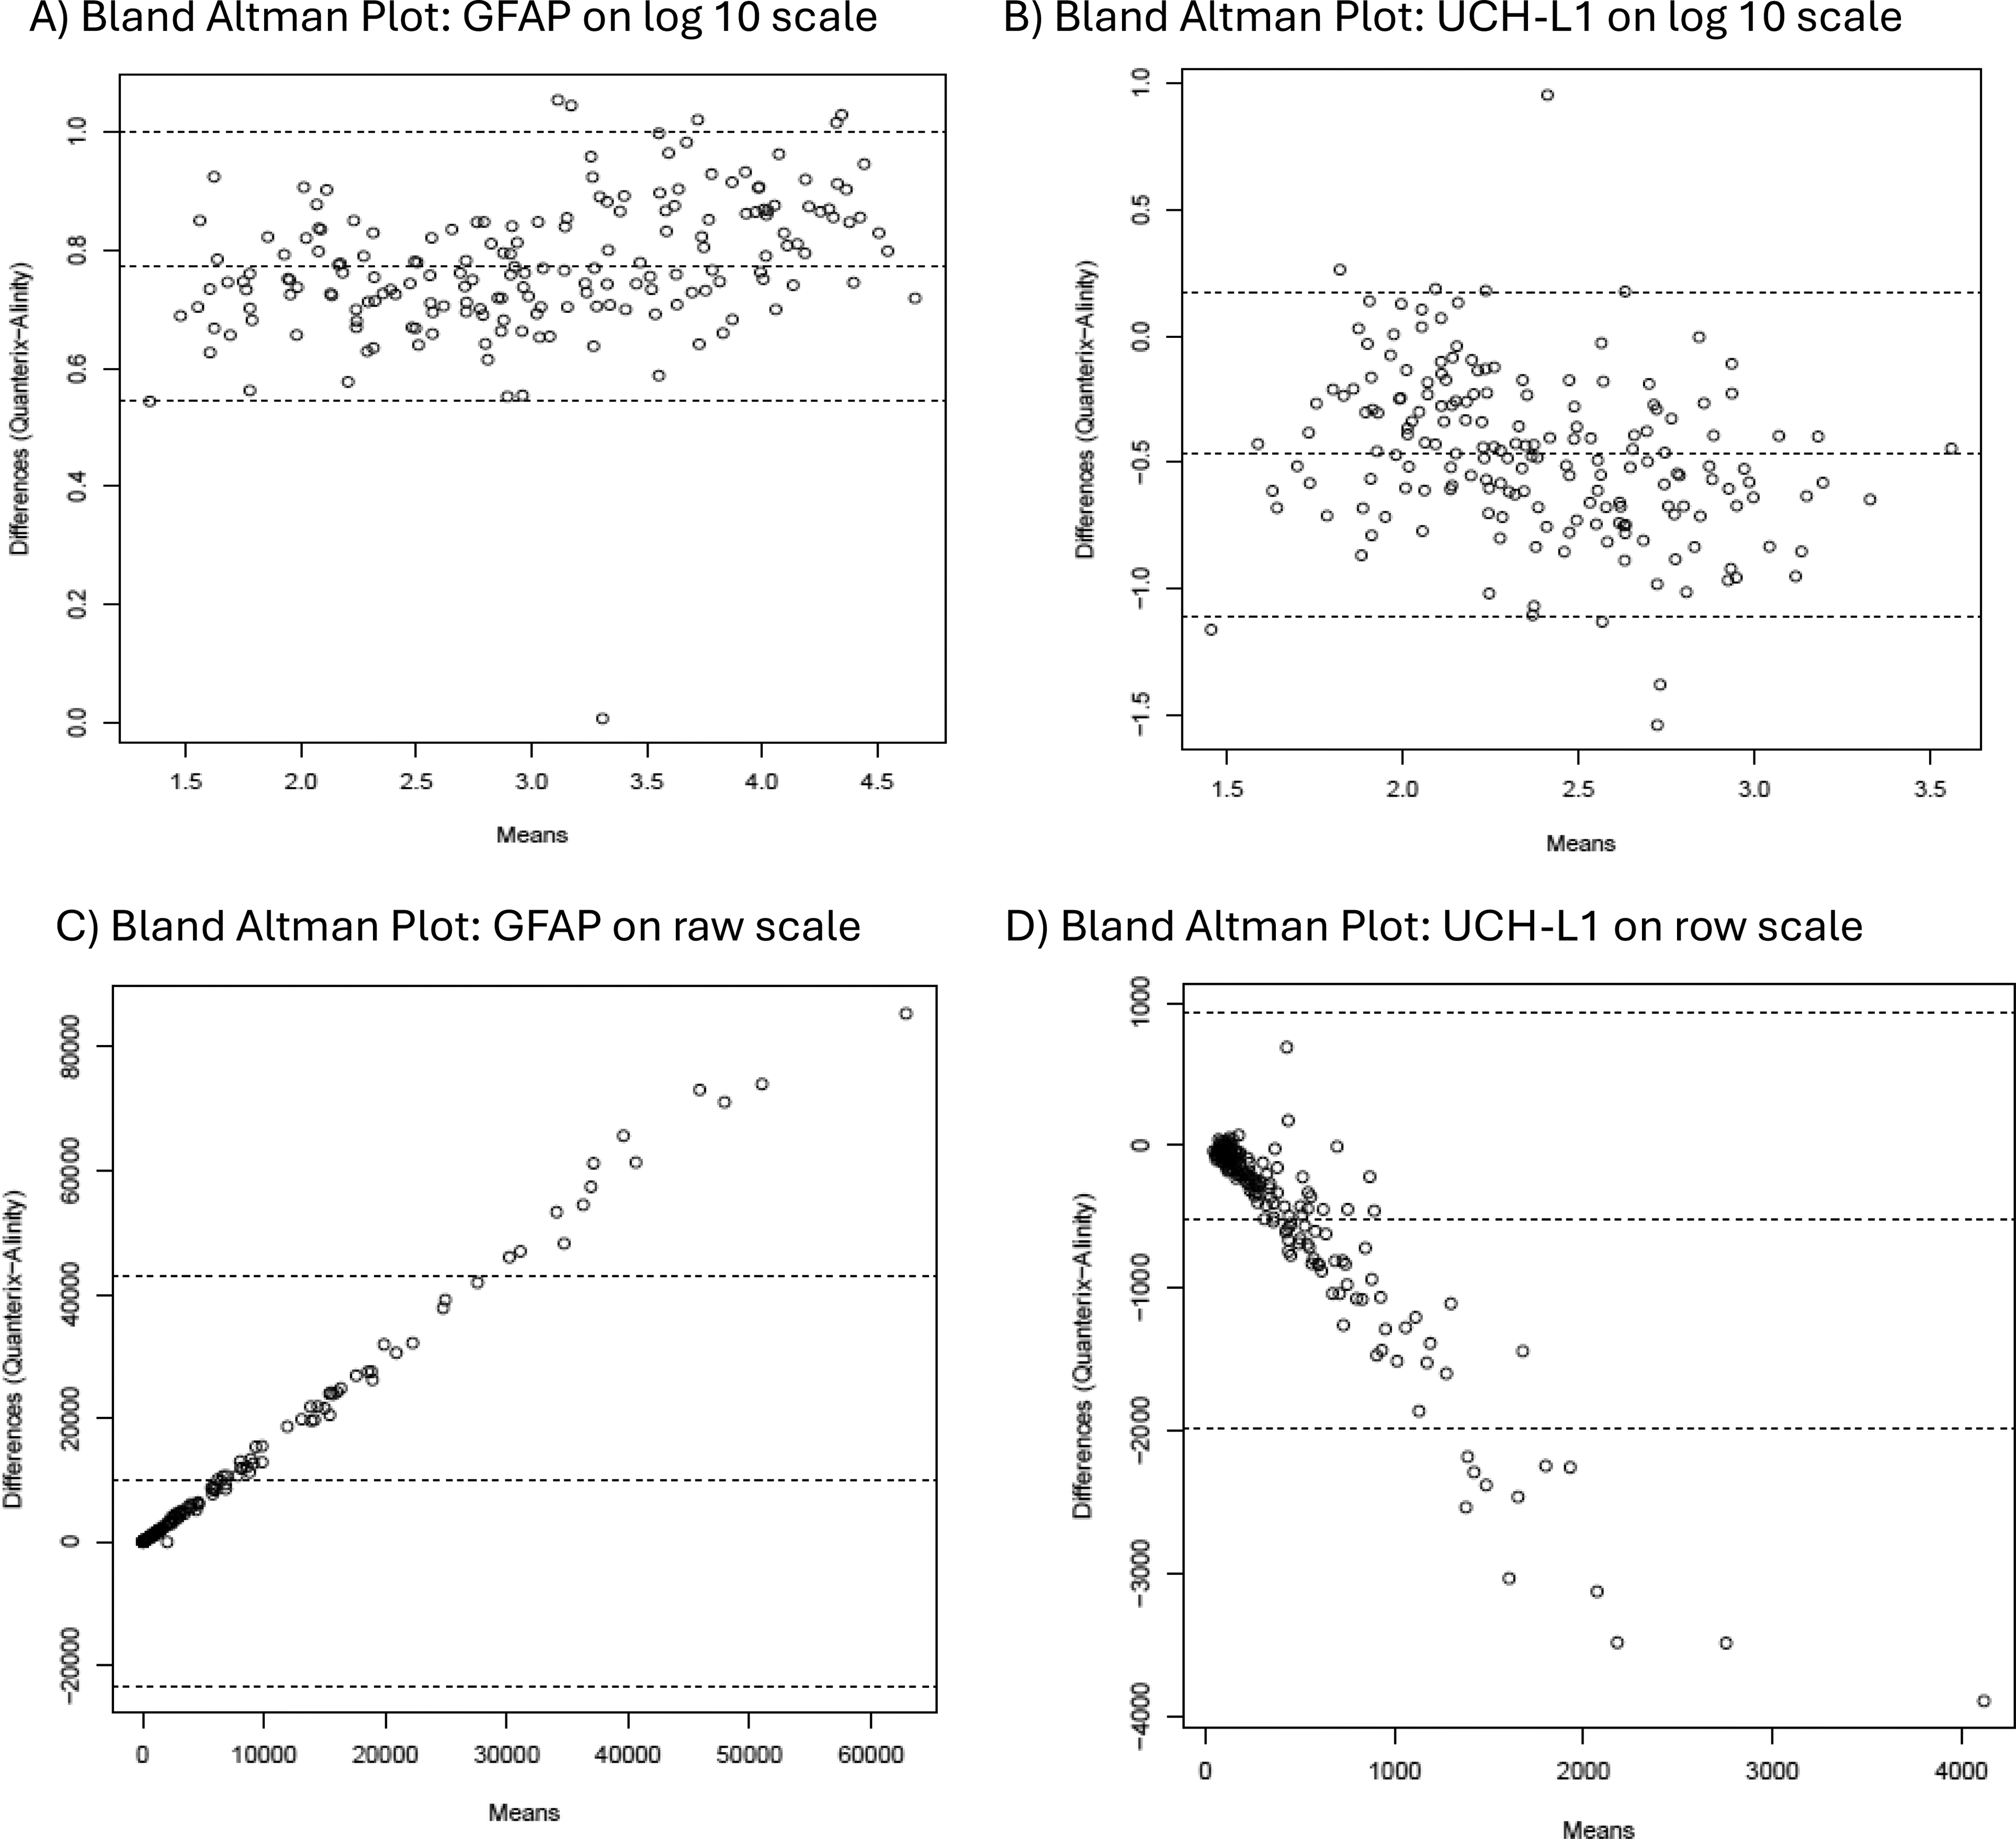
Bland–Altman plots assessing the agreement between Simoa and Alinity platforms. Bland–Altman plot illustrating the agreement between GFAP concentrations
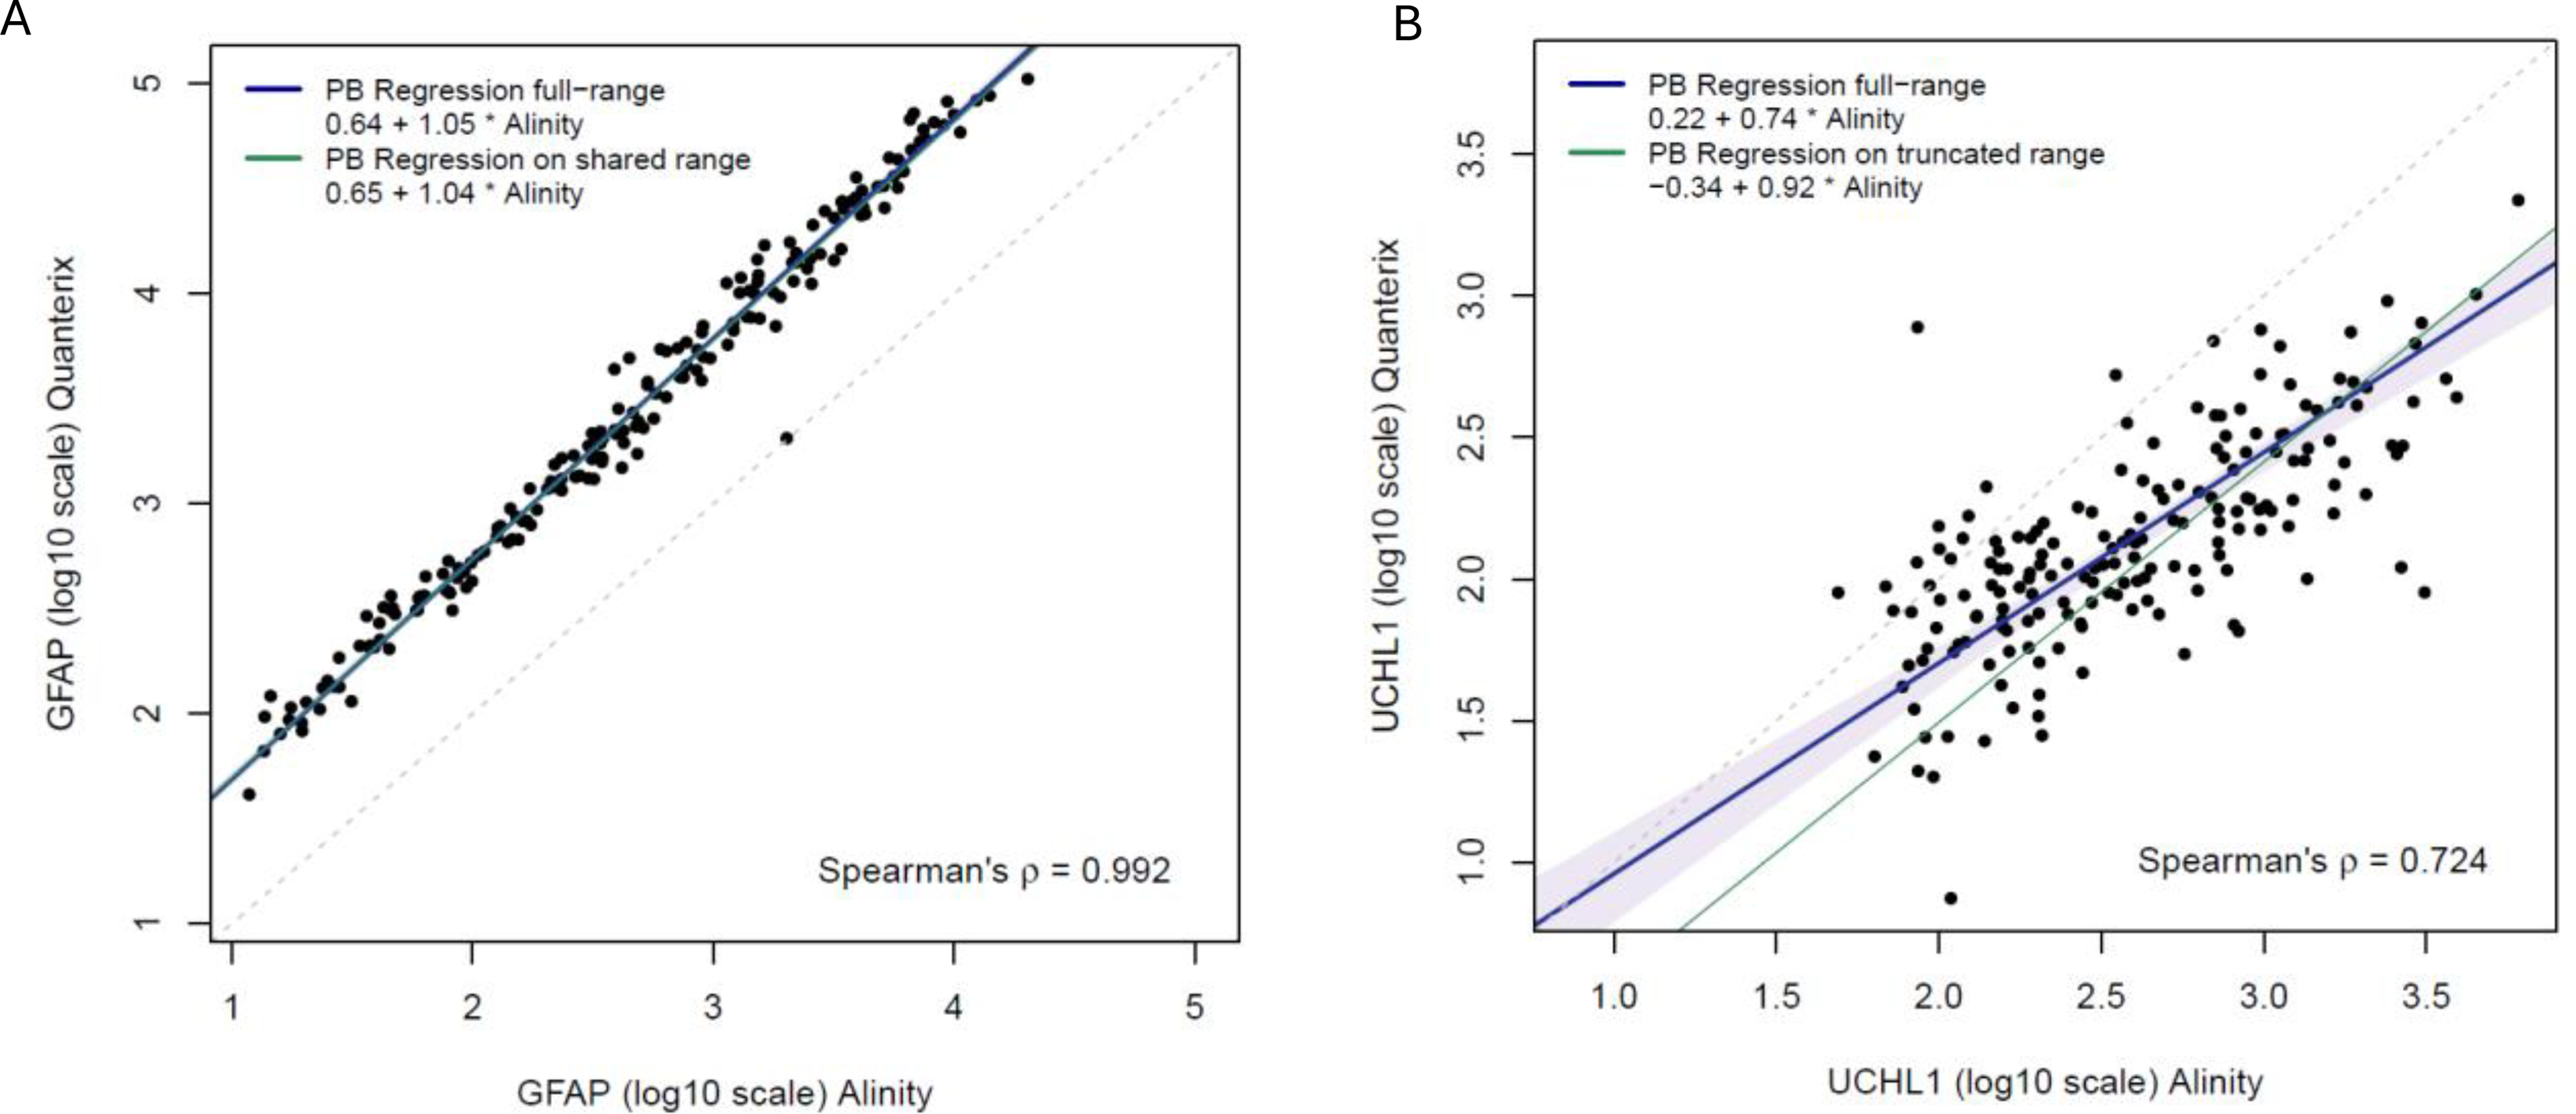
Regression analysis comparing GFAP and UCH-L1 concentrations (in log10 scale) measured by Simoa and Alinity platforms. Passing–Bablok and regression analyses comparing
Correlation between Simoa and Alinity assays and the Passing–Bablok regression conversion from Alinity to Simoa for UCH-L1
For UCH-L1, the Simoa assay reported a median concentration of 128 pg/mL (IQR: 83–243), while the Alinity assay reported a higher median of 379 pg/mL (IQR: 162–907). The median difference between platforms (Simoa minus Alinity) was −230 pg/mL (IQR: −687 to −79). Compared with GFAP, the correlation of UCH-L1 values between platforms was lower, with a Spearman’s ρ of 0.724. The Bland–Altman plot on the raw scale revealed a significant proportional bias, while the plot on the log-transformed data showed relatively stable differences, though the variability was larger than for GFAP (Fig. 1). Given the observed proportional bias and increasing variability at higher concentrations on the raw scale, the regression analysis was performed on log-transformed values to stabilize variance and improve model fit. Passing–Bablok regression on the log-transformed data yielded a slope of 0.74 (95% CI: 0.65–0.84) and an intercept of 0.22 (95% CI: −0.04 to 0.45), indicating lower log-transformed UCH-L1 values on Simoa compared with Alinity at higher concentrations (Fig. 2B). Based on the regression model, raw Alinity values can be converted to estimated raw Simoa values using the following equation: UCH-L1Simoa = 1.645 × (UCH-L1Alinity)^0.744. A sensitivity analysis (n = 124) limited to values within the truncated range of both assays (Alinity: 200–25,000 pg/mL; Simoa: 1.90–40,000 pg/mL) showed improved agreement, with a Passing–Bablok regression slope of 0.92 (95% CI: 0.81–1.06) and an intercept of −0.345 (95% CI: −0.753 to −0.004), indicating better concordance between platforms within this shared range. The conversion equation for UCH-L1 limited to the analytical range of the assays is UCH-L1Simoa = 0.452 × (UCH-L1Alinity)^0.919.
Discussion
In this study, we compared GFAP and UCH-L1 concentrations measured from the same blood draw using two immunoassay platforms and evaluated their relation in a well-characterized cohort of patients with TBI. Our findings demonstrate a strong correlation and a systematically higher Simoa versus Alinity values across the range for GFAP in log scale, supporting the feasibility of cross-platform conversion. In contrast, UCH-L1 measurements showed greater variability and a moderate correlation, limiting the reliability of direct conversion.
The Simoa GFAP assay has a higher analytical sensitivity and a broader dynamic range than the Alinity GFAP assay. However, it is designated for research use only and has not been validated for clinical use. Despite its tendency to yield higher GFAP values than the Alinity for a given sample, the near-perfect correlation for GFAP (Spearman’s ρ = 0.992) and the narrow CIs of the Passing–Bablok regression parameters suggest a stable and predictable relationship between the platforms. The resulting conversion equation provides a practical approach for harmonizing data across studies or transitioning between assay technologies in clinical and research settings. The proportional bias observed in the Bland–Altman plot suggests the importance of log-transforming the data for regression analysis. In a previous study, we observed a strong correlation between the point-of-care Abbott i-STAT plasma TBI test and the Abbott ARCHITECT platform (functionally analogous to the Abbott Alinity system) for GFAP and UCH-L1 measurements. 17 Taken together, these findings support the feasibility of integrating GFAP data obtained from these assays across multiple studies.
Conversely, UCH-L1 values showed a lower correlation (ρ = 0.726) and greater variability across platforms. Although the Passing–Bablok regression yielded conversion equations, the broader CIs of the regression slopes and intercepts and wider limits of agreement in the Bland–Altman analysis highlight the challenges in achieving consistent quantification across assays for this biomarker. Differences in assay calibration, antibody specificity, or matrix effects may contribute to this discrepancy and warrant further investigation. We provide conversion equations derived from both full- and analytical-range Passing–Bablok regression analyses. For GFAP, the two equations are similar. However, for UCH-L1, the equation derived from values within the shared analytical range demonstrates improved agreement and should be preferred when converting concentrations within that window, as interplatform comparability is strongest across the overlapping, analytically validated range. In contrast, the full-range equation may be more appropriate for broader exploratory analyses. However, both equations should be used cautiously, as the estimates have wider CIs and the between-platform correlation is lower.
These results underscore the importance of rigorously comparing assays before interpreting or pooling biomarker data across platforms. While GFAP appears suitable for cross-platform standardization, UCH-L1 requires further validation and may require platform-specific calibration strategies. Notably, our approach, which uses Passing–Bablok regression on log-transformed biomarker data, provides a robust framework for deriving conversion models when both assays are subject to measurement error.
A key strength of our study is the use of identical blood samples for both assays, which eliminates biological variability and allows for a direct comparison of analytic performance. In addition, samples were subject to the same preanalytical conditions for processing and storage.
Limitations
Our study has limitations that are worth considering. These include the lack of external validation of our conversion equation and potential unmeasured preanalytical differences between assays. The conversion equations between the Alinity and Simoa platforms were developed using data from a single cohort (TRACK-TBI) and have not yet been externally validated. As such, the generalizability of these equations to other populations or clinical settings remains uncertain and should be confirmed in independent datasets. While GFAP values showed excellent agreement across platforms, UCH-L1 values demonstrated only moderate correlation and greater variability, particularly at higher concentrations, which limits confidence in cross-platform harmonization for this biomarker. Furthermore, although we attempted to minimize biological variability via using identical blood draws and standardized processing protocols, potential preanalytical differences—including potential “freeze–thaw effects” or “reagent batch variability”—may still influence the results. Finally, differences in the analytical range and sensitivity of the two assays may impact comparability, especially at extreme concentrations where conversion models may be less reliable. Future studies should assess whether these conversion equations hold in independent cohorts and across broader clinical settings.
Conclusion
Our data support the interchangeability of GFAP values between the Alinity and Simoa platforms using a regression-based conversion model. However, caution is warranted when interpreting UCH-L1 values across platforms due to less consistent agreement.
The TRACK-TBI Investigators
Edilberto Amorim, MD, University of California, San Francisco; Gretchen Brophy, PharmD, Virginia Commonwealth University; Shawn Eagle, PhD, University of Pittsburgh; Shankar Gopinath, MD, Baylor College of Medicine; Ruchira Jha, MD, MSc, Barrow Neurological Institute; Vijay Krishnamoorthy, MD, Duke University; Christine Mac Donald, PhD, University of Washington; Debbie Madhok, MD, University of California, San Francisco; Rebekah Mannix, MD MPH, Boston Children’s Hospital; Michael McCrea, PhD, Medical College of Wisconsin; Randall Merchant, PhD, Virginia Commonwealth University; Pratik Mukherjee, MD, PhD, University of California, San Francisco; Laura B. Ngwenya, MD, PhD, University of Cincinnati; Claudia Robertson, MD, Baylor College of Medicine; Richard B. Rodgers, MD, Goodman Campbell Brain and Spine; David Schnyer, PhD, University of Rhode Island; Sabrina R. Taylor, PhD, University of California, San Francisco; Nancy Temkin, PhD, University of Washington; Ross Zafonte, DO, University of Missouri.
Authors’ Contributions
G.T.M.: Conceived and leads the TRACK-TBI studies. X.S. and S.J.: Performed the data analyses. G.T.M., F.K.K., K.K.K.W., and R.D.-A.: Drafted the manuscript. J.K.Y., A.M.P., D.O.O., E.K.Y., P.M., F.K., S.A.D., R.C., J.A.M., and B.M.Q. provided critical review and substantive revisions to the manuscript.
Footnotes
Author Disclosure Statement
No competing financial interests exist.
Funding Information
No funding was received for this article.
Supplemental Material
Abbreviations Used
References
Supplementary Material
Please find the following supplemental material available below.
For Open Access articles published under a Creative Commons License, all supplemental material carries the same license as the article it is associated with.
For non-Open Access articles published, all supplemental material carries a non-exclusive license, and permission requests for re-use of supplemental material or any part of supplemental material shall be sent directly to the copyright owner as specified in the copyright notice associated with the article.