
Abstract
On the eve of the opening ceremony of the 2002 Salt Lake City Winter Olympics, Fraser Bullock was panicked (Jag, 2024). A foul inversion cloud had settled over the Salt Lake Valley. As chief operating officer for the city’s Olympic organizing committee, Bullock feared the optics of lung-searing pollutants shrouding the city—with news cameras ready to telecast the scene around the world—could ruin the event. The ceremony was to serve as Utah’s introduction to the world and a celebration of post-September 11 American resilience, featuring the Mormon Tabernacle Choir singing “The Star-Spangled Banner” as a tattered American flag recovered from the World Trade Center would open the proceedings. The backdrop of dirty air would be a global embarrassment. But then, a lucky break! A storm blew through the valley the next morning, clearing the skies for a glorious ceremony, and splendid weather reigned over the next 17 days of the Games.
This was not the first time air pollution had threatened to sully a modern Olympics. At the Los Angeles 1984 Summer Olympic Games, runner Steve Ovett collapsed after the 800-m final, blaming the brunt of Los Angeles smog on his asthma exacerbation (Deadman, 2024). At the Beijing 2008 Summer Olympics, many athletes opted out of events or chose to stay outside of China and fly in for their competitions rather than risk prolonged exposure to Beijing’s toxic air (Demick, 2008). This was despite China’s draconian efforts to clear the air by closing thermal power plants, relocating factories permanently out of Beijing and nearby provinces, shutting down other industrial facilities during the Games, retrofitting coal furnaces to use natural gas, and restricting the number of on-road vehicles to half, based on even or odd vehicle registration numbers (Chen et al., 2013).
Today, ensuring air quality for Olympic athletes has become obligatory for host cities to procure the Games. For the Paris 2024 Summer Olympics, for instance, the city closed more than 100 streets to motor vehicles, tripled parking fees for sports utility vehicles, removed roughly 50,000 parking spots, and constructed over 800 miles of bike lanes to encourage more sustainable transport (Gagliardi, 2024). For 2028, Los Angeles promises a “no car Games” for its Summer Olympics (Deadman, 2024).
By most accounts, the 2002 Salt Lake City Winter Olympics were a success, demonstrating Utah’s “Greatest Snow on Earth,” and Utahns generally look back on the Games with pride (Maxfield-Barret, 2024). Winter tourism surged (Lee, 2012), and Utah has become a winter sports training hub and host to international winter competitions that have infused millions of dollars into the state’s economy (Utah Sports Commission, 2014). More recently, Bullock spearheaded Salt Lake City’s successful bid to host the Winter Olympics again for 2034, sparking excitement among a new generation of Utahns.
The state has enacted numerous air pollution regulations and legislation over the years, including incentives for retrofitting and replacing high-emission wood stoves and diesel vehicles, transit upgrades, and public education (Larsen, 2025b). Tier 3 gasoline, a cleaner-burning, low-sulfur fuel, is now standard across the state (Fitzpatrick, 2023). Consumer products sold in Utah must be formulated to reduce volatile organic compounds (VOCs), and new water heaters must use the latest ultralow nitrogen oxides (NOx) technologies compared with conventional water heaters, to name a few (Call, 2025).
Cleaning Utah’s air, nonetheless, is a work in progress. The American Lung Association (2025) recently ranked the Salt Lake City-Provo-Orem region as the ninth worst in the nation for ozone pollution and 25th worst for short-term 24-h PM2.5 (defined as suspended particulate matter with an aerodynamic diameter of 2.5 μm and less). Exposure to PM2.5 emissions has been linked to a variety of cardiovascular and respiratory ailments, cancer, low birth weight, autism, premature death, and depression (Martin et al., 2016). And while U.S. News and World Report (2025a) ranked Utah the “best state in America,” due to its diverse and resilient economy, smart students, low crime, and healthy population, the state came in 34th for air quality for its polluted winter inversions and elevated summer ozone levels (U.S. News and World Report, 2025b).
In November 2025, the US Environmental Protection Agency (EPA) found that the airshed had obtained sufficiently enough “clean data” to be reclassified as “attainment” (Larsen, 2025b). Utahns, nevertheless, are still concerned about the air they breathe. A 2025 Utah survey found that nearly 77 percent of respondents indicated that they agree or strongly agree that air pollution is a serious issue and poses a significant problem. Further, over 71 percent of respondents indicated they agree or strongly agree that they are concerned about air pollution causing long-term health problems like asthma, lung cancer, and throat cancer, with over half believing they’ll experience health problems from air pollution in the future (Theophilus & Ulrich-Schad, 2025).
“Air scares the heck out of me,” acknowledged Bullock in 2022, “It scares me because we got so lucky last time because we had an inversion the day before and, the morning of the opening ceremonies, in comes a storm, blows it all up [and] we had really great weather. Inversions drive me crazy!” (Jag, 2024). Over 500,000 spectators are expected to descend onto Utah for the 2034 Olympics, and as they travel to events, the prospect of bad air could menace the Games in both optics and competitions (Stafford, 2024).
The run-up for Utah 2034 presents an opportunity for Utah to take bold stewardship of its air. Drawing on past Olympic experiences and understanding of Utah’s unique air pollution challenges, we propose eight opportunities on how Olympic preparations can reduce the risk of a polluted inversion before, during, and beyond the Games. We first overview how sustainability and air quality became priorities for Olympic preparations, explain why Utah is prone to air pollution, and conclude with recommendations for championing clean air as part of Utah’s Olympic legacy.
Sustainability at the Olympics
All modern Olympic stagings by their sheer scale have had to manage their environmental impacts (Karamichas, 2017). Indeed, many question whether mega-events such as the Olympic Games can ever be sustainable given the environmental impacts of venue and infrastructure construction, influx of spectators and their transport to events, waste generation, and resource consumption (Muller et al., 2021). Others argue, however, that the Olympics offer political leverage to encourage and showcase innovative solutions for global and host-city environmental challenges (Hartman and Stafford, 2006).
In 1986, Juan Antonio Samaranch, the seventh president of the International Olympic Committee (IOC), declared the environment as the third pillar of Olympism (along with sport and culture). The environment, however, didn’t become a flash point until the preparations for the 1992 Winter Olympics in Albertville and across the Savoy region of the French Alps (Karamichas, 2017). Competitions were spread across 13 Alpine communities requiring the construction of new event venues, resorts, and connecting motorways (Atagon-Perez, 2017). Landslides, deforestation, disruption of natural habitat and animal migration routes, construction of resorts and facilities without plans for postevent use, nonrecyclable waste, blighting of the countryside, diversion of streams, water extraction for the production of artificial snow, and the deployment of 40 tons of ammonia to freeze bobsleigh tracks were just some of the environmental conundrums that sparked outrage and protests (May, 1995).
Consequently, later that year, the IOC participated in the 1992 United Nations (UN) Conference on Environment and Development (i.e., Earth Summit) at Rio de Janeiro, Brazil, where most UN member nations committed themselves to environmentally protective development (Karamichas, 2017). The UN Environmental Programme drafted Local Agenda 21 (as part of the broader Agenda 21) as a voluntary framework to integrate economic, social, and environmental considerations into local decision-making at the country and community levels. By 1999, the IOC modeled its own version of Local Agenda 21, entitled the Olympic Movement’s Agenda 21, which called for promoting environmental sustainability, raising awareness, and leaving a positive post-Game legacy. At its heart, the Olympic Movement’s Agenda 21 recognized that athletes needed a healthy environment to train and perform at their peak (International Olympic Committee, 2012).
In the wake of Albertville 1992, environmental groups and residents pressed the Lillehammer 1994 Olympic Organizing Committee to take into account of environmental issues in preparations. Venues were built where possible with local materials, ski runs were fashioned to avoid impacting virgin forests, and spectators used millions of recyclable plates and utensils (IOC, 2012).
Lillehammer provided a benchmark for the Sydney 2000 Summer Olympic Games, which was awarded in 1993 on the basis of a strong environmental action plan, encouraged by the environmental group Greenpeace that prepared the Games’ environmental guidelines (Stafford, 2000). Throughout preparations, Greenpeace engaged Olympic organizers and sponsors, including Coca-Cola, McDonald’s, and Unilever, among others (Hartman and Stafford, 2006). Ultimately, Sydney’s Summer Olympics earned the title as the first “Green Games” because it pioneered innovations in solar power, water recycling, waste management, energy efficiency, and other environmental best practices (Stafford, 2000). Sydney’s Olympic Village, for example, became the world’s largest solar-powered suburb at the time, which continues to serve as a home to over 5,000 residents (New South Wales Government, 2024). Sydney’s Olympics set a precedent that prospective hosts have been trying to emulate ever since, with some cities more successful than others (Karamichas, 2017).
The Huff Over Air Quality
Air pollution’s negative impact on athletic performance has been widely studied and has become a major concern for Olympic preparations. Exercise-induced asthma, for example, is estimated to affect 15–30 percent of all Olympic athletes, and the percentage increases significantly for those engaged in endurance events, including swimming, long-distance running, and cycling (Ora et al., 2024). Prior to runner Steve Ovett’s collapse after the 800-m final at Los Angeles in 1984, the city’s notorious smog was already an apprehension (Deadman, 2024). Ironically, organizers were optimistic about local air quality for the event. In 1983, Thomas Heinshemer, board chairman of the South Coast Air Quality Management District predicted, “We’re going to put on a smog-free Olympics…We don’t expect any diminution in athletic performance due to air pollution,” he added, but conceded that “good citizenship will certainly be called into play here… our reputation as a city and as a country is on the line” (Barabak, 1983). Televised public service announcements featuring Hollywood celebrities urged locals to reduce car trips, and businesses were asked to stagger shifts. Many events were scheduled to be held indoors, and outdoor marathon events were scheduled early in the mornings when air pollution levels were typically at their lowest (Deadman, 2024).
Around 4,000 local businesses were asked to cut operations during the Games, and initiatives were implemented to reduce car usage, especially during peak hours. Carsharing was promoted, and Operation Breezeway was introduced to require deliveries to be made at night, reducing daytime truck traffic. Additional buses and bus lanes were added, and new automated traffic surveillance and control systems were implemented to improve traffic flow (Deadman, 2024). While these efforts did result in unusually low levels of air pollution and traffic congestion during the Games, air quality gains were only temporary.
For Beijing 2008, China’s drastic measures did reduce air pollution by 29.6 percent from the previous year, but those improvements faded the following year (Chen et al., 2013). In 2013, the “Airpocalypse” struck Beijing, where pollution hit staggering record levels, bringing international attention, widespread public angst, and a sharp drop in tourism (Associated Press, 2022). When Beijing was awarded the 2022 Winter Olympics in 2015, the Chinese government launched more long-term air quality initiatives (Wu et al., 2023), including energy efficiency measures (Baiyu, 2022), restrictive emissions standards on coal-fired power plants, and expedited elimination of polluting vehicles from roads. Local officials were given environmental targets, and coal-fired boilers in homes were replaced with gas or electric heaters (Associated Press, 2022). China also encouraged ultralow emissions refits for the steel industry and promoted the implementation of cleaner technologies in its most polluting industries (Baiyu, 2022). These measures resulted in a 25 percent reduction in the air quality index compared with 2014 for Beijing and surrounding areas, resulting in longer life expectancy for locals (Baiyu, 2022).
Of concern at the Milan 2026 Winter Olympic Games were temperature inversions in the surrounding Po Valley that routinely trapped cold air and pollutants due to its “bowl-shaped” topography, similar to valleys in Utah (IQAir, 2026). To mitigate potential pollution, authorities adopted provisions to reduce traffic-related emissions, including incentives for electric vehicles (EVs), restrictions on older, high emission cars, vehicle scrapping programs, and increased rail service and deployment of electric buses in the “Ride for the Rings” initiative. Consequently, no significant air pollution problems were reported during the Games.
For the 2028 Summer Olympics, Los Angeles has launched the “Twenty-Eight by ’28,” project, which includes 28 public transportation infrastructure initiatives, costing an estimated $4.9 billion (Deadman, 2024). Projects include expanding light rail and creating more bus services, many of which will be electrified, cycle and walking infrastructure, free express lanes for carpools and buses, and tolls for solo drivers. Like 1984, Los Angeles is appealing to its citizens’ civic pride to not drive to work and to work staggered shifts or remotely during the events (Deadman, 2024). The legacy of these measures remains to be seen. While the Utah Division of Air Quality (DAQ) continues developing new rules and controls per EPA state implementation plan requirements, the Utah Olympic Organizing Committee has not announced any significant initiatives to address local air pollution for the 2034 Games as of this writing.
Utah’s Air Pollution
Like Italy’s Po Valley, Utah’s Salt Lake and other valley regions along the heavily populated Wasatch Front suffer occasionally from some of the nation’s worst air pollution, especially during the winter, due to their bowl-shaped topography that traps cold air and pollution (Scribner, 2017). Under normal weather conditions, air is warmer near the ground and cooler at higher elevations. Because warm air rises and cold air falls, there is a constant vertical mixing of warm and cold air, preventing pollution buildup. Inversions occur, however, when the situation reverses (hence “inversion”) enhanced by cold snow-covered valleys reflecting rather than absorbing light and heat, preventing vertical mixing of warm and cold air. Consequently, warm air above acts like a lid, trapping valley cold air and pollution.
Cars and trucks account for about 48 percent of Utah’s winter air pollution (Call, 2025). Of concern is PM2.5, which is invisible to the naked eye and can penetrate deep into the lungs and bloodstream (Martin et al., 2016). PM2.5 concentrations are formed through direct emissions and photochemical reactions in the atmosphere from NOx, VOCs, sulfur dioxides (SOx), and ammonia—often referred to as “precursors” for PM2.5 (Martin et al., 2016). About 39 percent of air pollution comes from smaller stationary or area sources, such as from home heating, smoke from wood burning, and small businesses like restaurants and dry cleaners. The remaining 13 percent of air pollution comes from larger point sources such as factories, industrial or commercial facilities (Call, 2025).
Over the last decade, Utah winters have included four to six multiday inversion episodes varying from 0 to 14 days of high PM2.5 levels exceeding the 24-h National Ambient Air Quality Standard (Utah Department of Environmental Quality, 2025b). Often, a strong storm or low-pressure system is needed to clear out the inversion, but fresh snow on the ground coupled with stagnant high-pressure systems can restart photochemical reactions and the cycle over again.
Another emerging source of pollution is dust blown from the estimated 1,000-plus square miles of exposed shorelines of the desiccating Great Salt Lake (GSL) west of the Salt Lake Valley, resulting in an uptick of potentially toxic atmospheric PM10 concentrations (dust particle contaminants 10 μm and less). Although PM10 is coarser and technically includes the subset of PM2.5, the coarse fraction of these particles is typically trapped within the upper respiratory tract, causing respiratory health concerns (Utah Department of Environmental Quality, 2025a). PM10 may contain concerning concentrations of hazardous arsenic and lithium exceeding EPA residential regional screening levels, as well as other metals, including copper, manganese, iron, and aluminum (Attah et al., 2024). Dust-derived PM10 particles are not currently considered contributors to Utah’s winter inversion pollution, as dust-blown episodes typically occur during spring and fall. Wind events can happen in any month; however, this could also threaten the Games. The latest research suggests that Utahns may be eating the hazardous dust as leafy greens grown on nearby farms may absorb the metals blown off the lake's drying playa (Blakowski et al., 2026). Although the EPA determined in November 2025 that the Salt Lake and Provo areas had reached attainment for 24-h National Ambient Air Quality Standards for PM2.5 for the first time in 15 years (Larsen, 2025b), a multiday inversion episode in January 2026 could jeopardize the region’s attainment, based on 3-year running averages, when evaluated again (Ruzanski, 2026).
Clean Air Opportunities
Table 1 provides an overview of eight high-impact clean air opportunities to help reduce the likelihood of a polluted winter inversion during the 2034 Olympic Games and leave a lasting healthy air legacy. As a starting point, these opportunities include electrifying transportation and buildings, building out EV charging infrastructure, expanding renewable electricity generation, investing in education outreach, expanding air pollution monitoring, restoring the GSL, and enhancing green infrastructure.
Opportunities to Clean Utah’s Air by Utah 2034
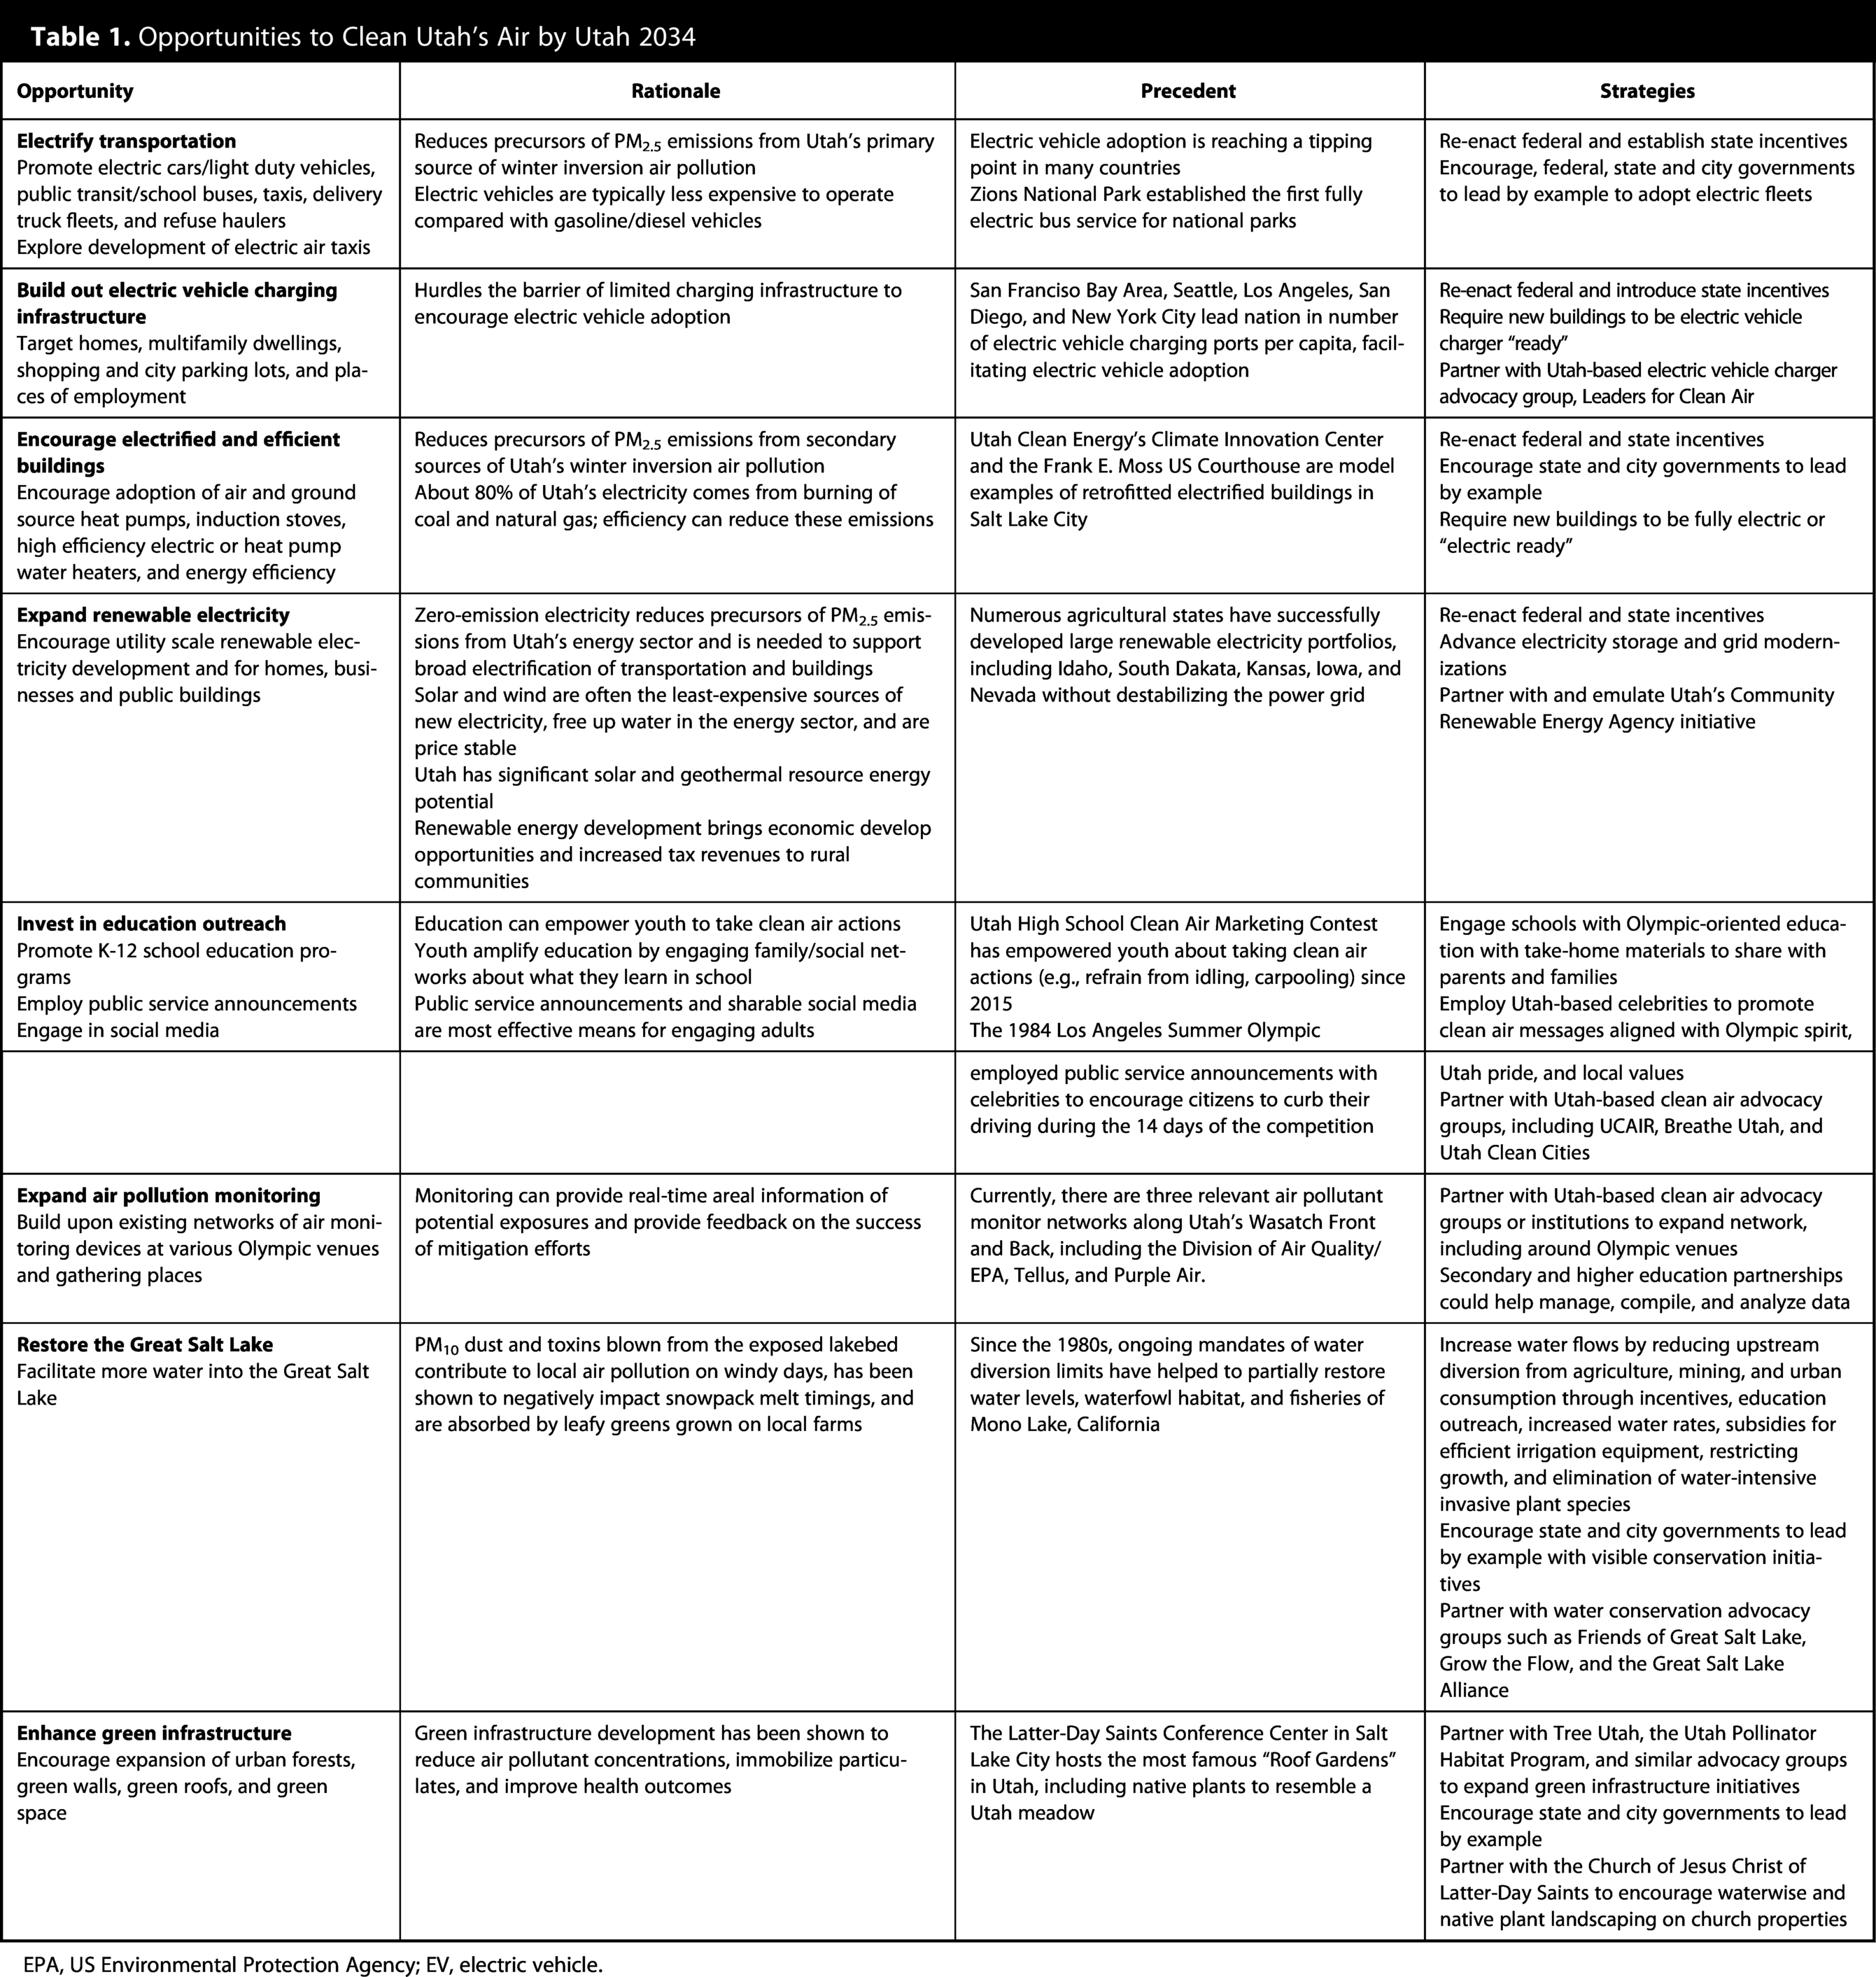
EPA, US Environmental Protection Agency; EV, electric vehicle.
Electrify transportation
Since half of Utah’s winter inversion air pollution comes from cars and trucks, wide adoption of EVs would reduce PM2.5 emissions and their precursors (e.g., SOx, NOx, VOCs). EV adoption has reached or is approaching a tipping point in many leading markets, including China and Europe, and is becoming self-sustaining, driven by technological improvements, declining costs, supportive policies and incentives, and social acceptance (Mercure et al., 2026). Indeed, in 2025, EVs in Norway represented 96 percent of all car sales (Meredith, 2026).
As of 2024 in Utah, however, EVs represented 1.26 percent of Utah’s fleet, and the state lagged behind the national average of EV sales (Fitzpatrick, 2024b). Further, EV sales in the United States have slowed due to perceived upfront costs, lack of charging infrastructure, and the elimination of federal tax incentives (Mercure et al., 2026). Consequently, these barriers could be hurdled, in part, by re-enacting federal and introducing state incentives.
Beyond personal EVs, electrified corporate and government fleet vehicles are increasingly feasible and should be encouraged, including buses, taxis, delivery trucks, and refuse haulers. For example, over half of London, England’s cabs are electric “zero emission capable” (Morris, 2024). In the United States, Amazon has deployed over 30,000 Rivian electric delivery vans (Amazon News, 2025), with many already operating in Utah (Hasler, 2025). By 2028, the US Postal Service plans to launch 66,000 EVs (United States Postal Service, 2025), and deployment in Utah should be prioritized.
Some Utah government entities have already adopted electric buses, including Zion National Park and Salt Lake and Park City school districts, demonstrating their feasibility in Utah’s climate (Potter, 2025). Admittedly, Park City’s initial Proterra metro electric buses, purchased in 2017, experienced maintenance and battery range problems due to cold weather. Proterra has since gone bankrupt, and Park City has replaced those vehicles with more advanced and reliable ones manufactured by GILLIG (M, 2025). In Europe, 6 out of 10 new buses deployed in 2025 were zero emission (Molliere, 2026), and in China, nearly 100 percent of city buses sold in 2025 were electric (Jaeger, 2025).
Finally, electric flying taxis are predicted to launch in both Dubai and the United Kingdom by 2028 (Cook & Edwards, 2025). These vehicles are designed with a 100-mile range at speeds approaching 150 miles per hour and with estimated costs comparable to traditional premium cabs (Cook & Edwards, 2025). Use of these technologies in Dubai and the United Kingdom will allow ample time for Utah to gauge their feasibility. At a demonstration of a Beta Technologies electric aircraft in Utah in March 2025, a trip using the aircraft was described as using about $17 of electricity; by contrast, a comparable trip using a gasoline powered aircraft would have been $700 (Goddard 2025)!
Build out EV charging infrastructure
A principal barrier inhibiting EV adoption is the lack of convenient charging stations (Pamidimukkala et al., 2024). As of 2026, there are 237,823 EV charging ports (one port accommodates one EV to charge) across the United States, with California leading the nation with 62,500 of those ports (Daly, 2026). By contrast, Utah has only 2,881 ports (Daly, 2026), concentrated primarily along the I-15 corridor between Ogden and Provo (Felt, 2026). Only when drivers see EV charging as ubiquitous as gasoline stations, EV adoption is expected to expand (Stafford, 2017). Olympic preparations should include the buildout of charging infrastructure in homes, multifamily dwellings, and parking lots of shopping centers, cities, and businesses.
Currently, EV owners are advised to charge at home overnight. Utilities fear, however, that as EV adoption accelerates, increasing at-night charging may increase peak demand during evening hours that will strain existing grid infrastructure and increase the need for more polluting natural gas-power electricity to cover that demand (Powell et al., 2022).
One solution is encouraging EV charging during the day to take advantage of utilities’ lowest cost electricity—daytime solar—to capture that low-cost power, smooth demand, and curb the need to burn natural gas at night. This is the objective of Utah-based Leaders for Clean Air (LFCA), a nonprofit encouraging broad EV adoption in Utah. LFCA advises on and donates EV chargers to organizations for workers to charge their EVs during the day, paid for by the organizations, as a free perk (Leaders for Clean Air, 2026). LFCA uses a pay-it-forward model where recipients of donated EV charges may donate financially to LFCA to cover the cost of donated chargers for the next recipients. Olympic preparations could partner with LFCA to further expand EV charging infrastructure across the state.
Encourage electrified and efficient buildings
About 39 percent of Utah’s winter air pollution comes from smaller stationary sources, such as home natural gas and propane heating, smoke from wood burning, and emissions from small businesses like restaurants and dry cleaners (Call, 2025). Electrified technologies, such as air source and ground source heat pumps, induction cooktops/stoves, and high efficiency electric or heat pump water heaters, can reduce reliance on burning fossil fuels for heating and cooking (Holowka, 2022) and enable buildings to use (or set them on a path to use) zero-emission electricity, such as solar, wind, geothermal, and battery storage.
Utah already has several fully electric residential, commercial, and public buildings, including the Project Open in Salt Lake City developed by the Giv Group (Fitzpatrick, 2022), Utah Clean Energy’s Climate Innovation Center (Cabrera, 2025), and the newly renovated Frank E. Moss US Courthouse (Fitzpatrick, 2024a). Kanab, Utah’s Sego Restaurant employs a fully electric commercial kitchen (Stafford and Stafford, 2024).
Olympic preparations should partner with Utah Clean Energy, Utah Clean Cities, and other advocacy groups to encourage building electrification. The most significant barrier facing the replacement of gas-fired stoves, heaters, and water heaters is the cost of upgrading electric panels and wiring to accommodate electric appliances. Consequently, at a minimum, new buildings should be “electric ready,” defined as having the appropriate wiring and plugs to allow consumers to upgrade to electric equipment more easily (Fitzpatrick, 2022). The Inflation Reduction Act of 2022 provided incentives for building electrification and renewable energy development, but these were phased out by the Trump Administration (Smith, 2025); reinstating federal and introducing state incentives could help with this transition.
Expand renewable electricity
To support electrified transportation and buildings, Olympic preparations should also encourage renewable electricity development across Utah for utilities, homes, businesses, and public buildings. Wind and solar power have become lower in cost than natural gas-fired electricity without subsidies (Lee, 2025), and utilities across the nation are increasingly adding renewables to meet growing power demand for data centers and artificial intelligence (Stock & Chediak, 2025). Unlike fossil fuel-fired electricity, solar and wind don’t consume water to produce electricity (freeing water for other uses, such as restoring the GSL) and are price stable (Stafford, 2021). Renewable energy development can bring significant economic development impacts and tax revenues for rural communities as well. A recently completed solar farm in Utah’s Juab County, for example, is expected to generate $5.7 million in property taxes over the project’s 20-year lifespan, a boon to local schools and county services (Weise, 2026). Geothermal is another promising renewable source in rural Utah.
In 2025, 45 percent of Utah’s electricity came from coal and 32 percent from natural gas (United States Energy Information Administration, 2026), with the rest coming from renewable resources (solar accounts for 15% [Damon, 2025]). While Utah is among the states with the greatest solar energy production potential, many Utah political leaders favor fossil fuels, believing increasing levels of “variable” wind and solar energy could take agricultural lands out of food production and destabilize Utah’s power grid. Consequently, Utah’s legislature has passed laws to slow solar development by curbing incentives and taxing solar generation and extending the life of coal-fired power plants (Damon, 2025).
Interestingly, other agricultural states have not experienced grid instability with renewable energy and have built significant renewable electricity portfolios through grid modernization and long-duration storage technologies, defined as those storing energy for 12 h or longer (United States Energy Information Administration, 2026). Neighboring Idaho, for example, procured 69 percent of its electricity from renewable sources in 2024; Nevada and Wyoming procured 23 and 31 percent, respectively. Iowa sourced 63 percent of its power from wind; Kansas, 52 percent from wind; and South Dakota, 81 percent from renewables. Utah can follow suit through the reinstatement of federal and state incentives and grid modernization.
In 2019, Utah legislation created the Community Renewable Energy Agency (renamed Utah Renewable Communities), a coalition of Utah cities and counties to launch a default net-100% renewable option for customers from their utility, Rocky Mountain Power (RMP), in their respective communities by 2030 at a minimal cost (Skill et al., 2020). Net-100% renewable electricity means the program’s annual electricity usage is balanced by renewable energy generated through RMP’s system. Sixteen Utah communities are members, including populous Salt Lake City, Salt Lake County, and Ogden (Vandenack, 2026). While implementation of the program is still underway and is not open to new members, the program may serve as a model for other Utah cities seeking to procure net-100% renewable electricity and spur local renewable electricity development.
Invest in education outreach
Olympic preparations should include educational outreach about the importance of clean air for the Games, especially among youth. To date, information about Utah’s air pollution is not part of Utah’s K-12 educational curriculum (Stafford & Brain McCann, 2022). Because Olympic organizers will rely on Utah’s youth to serve as volunteers when hosting Utah 2034, school education programs about air pollution, its impact on athletic performance, and how to preserve air quality (e.g., refraining from idling, carpooling, taking public transit) may catalyze interest in the Olympics. Youth often communicate what they learn in school to their families and social networks, potentially expanding the reach of education outreach (Stafford & Brain McCann, 2022). The annual Utah High School Clean Air Marketing Contest is a recognized statewide competition that has been educating high schoolers and their parents about Utah’s air pollution since 2015.
As with Los Angeles 1984, Utah’s preparations may employ public service announcements and social media about how individuals can help preserve air quality for the Games. Utah-based celebrities could promote clean air messages that resonate with Olympic spirit, Utah pride, and local values (e.g., love of family, outdoors, and sports) on how all Utahns must play their part for welcoming the world to a clean, healthy, and beautiful Utah. Olympic preparations may also involve partnerships with Utah-based nonprofits, such as Utah Clean Air (UCAIR), BreatheUtah, and Utah Clean Cities, to further carry the message on billboards and social media.
Finally, one symbolic strategy could involve the re-naming of the Olympic mascots to promote clean air. In 2002, the playful animated Olympic mascots included a rabbit, a bear, and a coyote, named, respectively, Powder, Coal, and Copper (to celebrate Utah’s natural resources) (Sacks 2024). For 2034, perhaps organizers may retire Coal and Copper so Powder can remain in Utah’s future, joined instead by two new companions named Sunny and Sky to herald solar energy’s vast potential in Utah and remind Utahns of our desire to have clear skies for 2034.
Expand air pollution monitoring
In addition to education, improved understanding about Utah’s air pollution may be enhanced by expanding public air pollutant monitoring networks targeting various Olympic venues and public gathering areas. The continued development of reliable and accurate low-cost sensors for PM2.5, NOx, and carbon monoxide (CO) could provide real-time exposure assessments prior to the Games and for athletes, spectators, and the local population during the Games. At present, air monitoring networks include the Utah Division of Air Quality (DAQ)/EPA, the Tellus (https://airview.tellusensors.com/), and Purple Air (https://map.purpleair.com/) particulate monitors. Locationally targeted sensors could be added to these existing networks, as well as sensors designed to measure other important gas-phase pollutants. The expansion of such measurements would also help evaluate mitigation initiatives. Olympic preparations could include state appropriations to fund expanding Utah DAQ’s network. A recent example of such cooperation is the addition of a PM10 GSL dust scientist at Utah DAQ and commensurate programs to enhance and expand PM10 monitoring around the GSL, including upwind and background locations (https://deq.utah.gov/air-quality/great-salt-lake-dust). Preparations could also include Utah-based clean air advocacy groups and secondary and higher ed institutions to help manage, compile, and analyze data as well.
Restore great salt lake (GSL)
In 2022, the GSL reached its lowest level in recorded history, sparking alarm that its further desiccation would result in a public health disaster, the collapse of an ecosystem that supports millions of migrating birds, and devastate the state’s tourism, skiing, mining, and real estate industries (Larsen, 2025a). For example, minerals from the GSL are used in beverage cans and fertilizers, the GSL’s brine shrimp eggs support a global seafood industry, and the GSL creates “lake effect” snow that creates Utah’s “Greatest Snow on Earth.” In terms of air pollution and public health, exposed lakebed dust ladened with arsenic and other heavy metals increasingly blow into the Salt Lake Valley and along the Wasatch Front, impacting two-and-a-half million residents. In addition to being absorbed by leafy green crops grown on nearby farms, windblown dust has been shown to deposit on snowpack, darkening the snow and accelerating snowmelt and runoff; this in turn threatens the ski season and the snowpack’s ability to serve as a natural reservoir for water (Lang et al., 2023).
The ideal solution is to get more water into the GSL. To date, however, no desiccating inland lake has ever been restored; advocates hope Utah could be the first. One of the most famous cases of attempted lake restoration is Mono Lake on the eastern side of the Sierra Nevada Mountains in California. After 50 years of excessive water diversions by the Los Angeles Department of Water & Power (DWP), historic litigation beginning in the 1980s required DWP to raise Mono Lake to a healthy level. As of 2024, Mono Lake has reached about 50 percent of that goal (McQuilkin, 2024).
Like Mono Lake, the GSL’s decline is mostly human caused, and refilling it to a minimum healthy level over the next 30 years requires the freeing up of enough water to support the equivalent of at least a million households annually (Larsen, 2025a). Agriculture uses about 71 percent of the water that would otherwise flow to the lake, and water-intensive alfalfa is the state’s primary cash crop, needed to support Utah’s dairy and beef industries (Larsen, 2025a). Consequently, simultaneously incentivizing farmer engagement in perpetual conservation easements, increasing water rates, and providing state incentives aimed at increasing agricultural conservation is warranted (Brain et al., 2014; Steed, 2024). Subsidies could be provided for efficient irrigation equipment, donating water to the lake, removing water-thirsty nonnative plant species (e.g., phragmites), and switching to more water-efficient crops, such as wheat or perennial grains (Larsen, 2025a; Williams, 2025). Though cities use only 17 percent of the water that would flow to the GSL, city and state governments should lead by example by implementing highly visible conservation initiatives, such as limiting or replacing nonfunctioning turf to waterwise landscaping and drip irrigation to build awareness (Larsen, 2025a).
Recently, Perry (2026) compiled and compared 12 possible playa dust mitigation strategies and their costs, including water (surface wetting, dynamic water management, managed vegetation, etc.) and nonwater (gravel, tillage, artificial surface elements) engineering approaches. Perry estimated remediation costs of $3 million to $450 million/sq. mile or $3.2 to $31 billion across all currently active dust hotspots. If the lake’s playa were to continue to desiccate, these costs could increase by almost 300 percent.
Olympic preparations may partner with Friends of the GSL, Grow the Flow, the GSL Alliance, and other water conservation groups to build awareness and facilitate more water to the lake.
Expand green infrastructure
Green infrastructure, interconnected networks of natural and engineered green space, can provide various ecosystem services in urban areas, including improved building energy efficiency, stormwater management, urban heat island mitigation, and the reduction of air conditioning needed in buildings (Dunlop et al, 2024). Examples include diversified urban forests through mixed trees, shrubs and vegetation, traffic calming vegetated bulb-outs with curb cuts capturing and filtering stormwater runoff, green walls (or living walls) of vertical structures covered in vegetation, and green roofs (or vegetative roofs) of living, functional layers of plants, soil, and waterproofing installed over a roof structure. Utah’s most famous green roof sits atop the Latter-Day Saints Conference Center in Salt Lake City, consisting of native plants to resemble a meadow, and serves as an oasis in the bustling city (Sandau, 2025).
Green infrastructure can improve air quality through pollutant and particulate capture (Andreson & Gough, 2020; Gopalakrishnan et al., 2019). New York City’s MillionTreeNYC initiative, initiated in 2007, for example, led to over one million trees planted across five boroughs, resulting in notable declines in PM2.5 concentrations in neighborhoods with high tree density (Thompson, 2025). London’s Green Infrastructure Task Force incentivized green roofs and living walls on commercial and public buildings that lowered concentrations of NO2 and particulates, reduced building temperatures, and improved stormwater absorption (Thompson, 2025).
Experiments have shown that the leaf surfaces of coniferous evergreen trees can capture more air pollutants year-round compared with deciduous trees, which shed their leaves and limit their pollution capture in winter (Zepletal et al., 2021). By strategically expanding Utah’s urban forests with the right mix of trees and vegetation, green infrastructure can act as both the “lungs” of a city (by providing oxygen) and the “liver” (by filtering PM2.5, SOx, and NOx).
Olympic preparations may partner with Tree Utah, the Utah Pollinator Habitat Program, and similar organizations to expand green infrastructure. State and city governments could lead by example with green infrastructure initiatives in public buildings and spaces, and the regionally important Church of Jesus Christ of Latter-Day Saints could also lead by example to encourage waterwise and native plant landscaping and green infrastructure on church properties.
Other opportunities
While the opportunities presented here may have the greatest impact on reducing Utah’s air pollution, other initiatives can also be promoted in Olympic preparations, including expanding walkable communities and bike lanes, promoting electric bikes and electric pedal-assisted cargo delivery quads, and electrifying snow removal and yard equipment, to name a few. Public service announcements should encourage Utahns to carpool, bike, take public transit, and refrain from idling. Schools should consider car-free zones; a recent study found that car-free drop-offs at elementary schools decreased ambient air pollution within school boundaries by 93 percent (Lutz et al., 2025)! Such initiatives could help further sensitize Utahns about air quality and build support for clean air Olympic preparations.
Olympic Legacy
The Olympics offers opportunities for host communities to tackle local sustainability challenges as part of their preparations. Ensuring clean air and a clean environment for Olympic athletes is expected for host communities, and air pollution is Utah’s foremost environmental challenge, destined to invite media scrutiny for 2034 (along with the desiccation of the GSL as a contributor to that air pollution).
The foul inversion over the Salt Lake Valley on the eve of the 2002 Salt Lake City Winter Olympics and the happenstance of a storm blowing that pollution out in time for the televised opening ceremony should be a wakeup call. Will Utah be so lucky in 2034? Pursuing the air quality opportunities outlined here will demonstrate to the world that Utahns took bold stewardship of their air, not just for the Games, but as an Olympic legacy as well.
Footnotes
Acknowledgments
The authors thank Steve Altman, Rachel Chamberlain, Anna Clark, Ben Norton and Lindsie Smith for their insightful comments on an earlier draft of this commentary.
Author Disclosure Statement
No competing financial interests exist.
Funding Information
Research did not receive any external funding.