






Abstract
Farmers’ markets temporarily transform public spaces into markets, increasing access to fresh, locally farmed produce. While their effects on public space and food environments are clear, little is known about their effects on human behavior. This study uses the Understanding America Study survey data, representative of Los Angeles County, to evaluate whether people who visit farmers’ markets report healthier and more sustainable lifestyles. We used propensity score-matched samples to compare lifestyle choices, food choices, attitudes toward climate change, food insecurity, and self-reported health between farmers’ market shoppers and nonshoppers. Results indicate that more frequent visits to farmers’ markets are associated with healthier and more sustainable food choices. Multivariate analysis of variance suggests the associations are modest but consistent in cross-sectional and longitudinal samples. As suggested by the Sustainable Development Goals, transitioning toward healthier and more sustainable food systems requires changes in both the food environment and human behavior. Results here suggest that increasing exposure to farmers’ markets could play a role in this transition by promoting healthier and more sustainable food choices among grocery shoppers.
Introduction
The United Nations Sustainable Development Goals recommend moving toward more sustainable and healthier food systems (Goal 2) and responsible forms of consumption and production (Goal 12) (United Nations, 2015,2023). Accomplishing these goals requires a profound understanding of the linkages between food systems, food environments, and food choice (Blake et al., 2021). Sustainability is defined in different and sometimes competing ways, but core to most definitions is a balancing of population and economic growth with the capacity of the earth to provide over the long term (Pelenc, 2015; Purvis et al., 2019; Vos, 2007). If adopted consistently across a large part of the population, changing daily lifestyle choices can contribute significantly to sustainable development (Böhme et al., 2022). These include behavioral changes in multiple areas of life, such as diet, energy use, and political orientation. In this study, we evaluate activities that aim to reduce waste and save resources, such as composting and limiting the use of water at home. We also evaluate food choices like consuming less meat and less processed food and more locally farmed fruits and vegetables, which are all linked to both better health and lower environmental impacts (Brookie et al., 2018; Orta-Aleman et al., 2024; Scarborough et al., 2023; Slavin & Lloyd, 2012; Willett et al., 2019).
The retail environment is known to both influence food choice and reflect personal beliefs and motivations (Chen & Antonelli, 2020; Cicia et al., 2021; Dodds et al., 2014). In the United States, choosing farmers’ markets over conventional food outlets, such as supermarkets, is often considered healthier and more sustainable. They imply choosing fresher and more sustainably produced foods, albeit at higher costs, lower variety, and limited accessibility (Lowery et al., 2016; Thomson et al., 2024). Despite limitations, studies show farmers’ markets temporarily increase access to fresh local foods (Lowery et al., 2016; Lucan et al., 2015; Morales, 2021; Zazo-Moratalla & Orellana-McBride, 2024). They are a burgeoning sector in the United States that produced US$8.7 billion in revenue in 2019 (Leitner et al., 2020) and contribute to local economies by allowing producers to sell directly to customers with low overhead costs (Morales, 2021).
It is clear that farmers’ markets temporarily transform local food environments, but our understanding of how they affect human behavior is limited. Some case studies report that farmers’ markets provide consumer conditions that serve as cues to make healthier and more sustainable food choices, as well as mitigate food insecurity, including improving food choice, knowledge about food, and overall health (Caron-Roy et al., 2022; Joseph & Seguin, 2023; Lucas et al., 2024). In this sense, our study contributes to existing literature by leveraging longitudinal survey data in Los Angeles County to evaluate associations between shopping at farmers’ markets and healthier and more sustainable lifestyles.
This study tests for positive associations between shopping at farmers’ markets and five groups of indicators: sustainable lifestyle choices (7 indicators), attitudes toward climate change (4 survey questions), healthier and more sustainable food choices (7 indicators), food insecurity (4 indicators), and self-reported health (3 indicators). People who visit farmers’ markets are more likely to recycle, compost, buy locally produced products, worry about climate change, limit car use, limit water use, limit electricity, limit food waste, limit plastic, limit air conditioning (AC), and limit clothes dryer use cross-sectionally and over a 1-year period. People who visit farmers’ markets are more likely to believe climate change is the result of human activity, climate change is a threat to humanity, and the government and our individual actions can contribute to reducing climate change. People who visit farmers’ markets are more likely to eat less beef, eat less processed foods, buy food with less packaging, eat organic foods, eat locally produced food, and eat sustainably produced food. People who visit farmers’ markets are less likely to worry about having enough money to eat, go without food, or need to travel more than 2 miles to purchase food. People who visit farmers’ markets are more likely to self-report better social lives and overall health.
Methods
The methods consist of extracting a cross-sectional and longitudinal sample of survey participants who were labeled as farmers’ market shoppers and comparing their survey responses to those of participants who did not. We then compared how groups responded to each of the survey questions with t-tests. Finally, we evaluated the association between having shopped at farmers’ markets and the groups of responses using multivariate analysis of variance (MANOVA).
Sampling survey data
Data comes from the Understanding America Study (UAS), a panel study of households with approximately 14,700 respondents representing the entire United States. We used questions from the LA Barometer, which is a biannual subpanel survey of the UAS that monitors social and economic conditions of a subset of respondents representative of Los Angeles County with approximately 2,000 participants for each wave (Thomas et al., 2020,2023). For this study, we used data from two surveys for 2 years: Mobility and Sustainability (N2023 = 1,207, N2024 = 1,499) and Livability and Affordability (N2023 = 1,523, N2024 = 1,507) (Thomas et al., 2020,2023).
Based on the literature and preliminary data assessment, we included gender, household income, education, and race as covariates. Education, gender, and income are associated with the likelihood of visiting farmers’ markets (Byker et al., 2012; Gumirakiza et al., 2014). Race categories are included as covariates because previous studies have suggested that White populations have better access to farmers’ markets (Alkon, 2008; Alkon & McCullen, 2011; Lowery et al., 2016). Education and household income were included as covariates because more highly educated and more affluent populations have higher access to farmers’ markets. Indicators were recoded as ordinal variables. Education was recoded to have three levels: some college or lower (51 percent), bachelor’s degree (31%), and graduate school (18%). We recoded household income into three categories: up to 35K (27%), from 35K to 75K (24%), and more than 75K (49%). We also controlled for White, Black, Asian, Mexican, and Central/South American races. All other races were grouped into another category. For age, respondents were grouped into three categories: 18–39 (40%), 40–59 (34%), and 60 or older (26%).
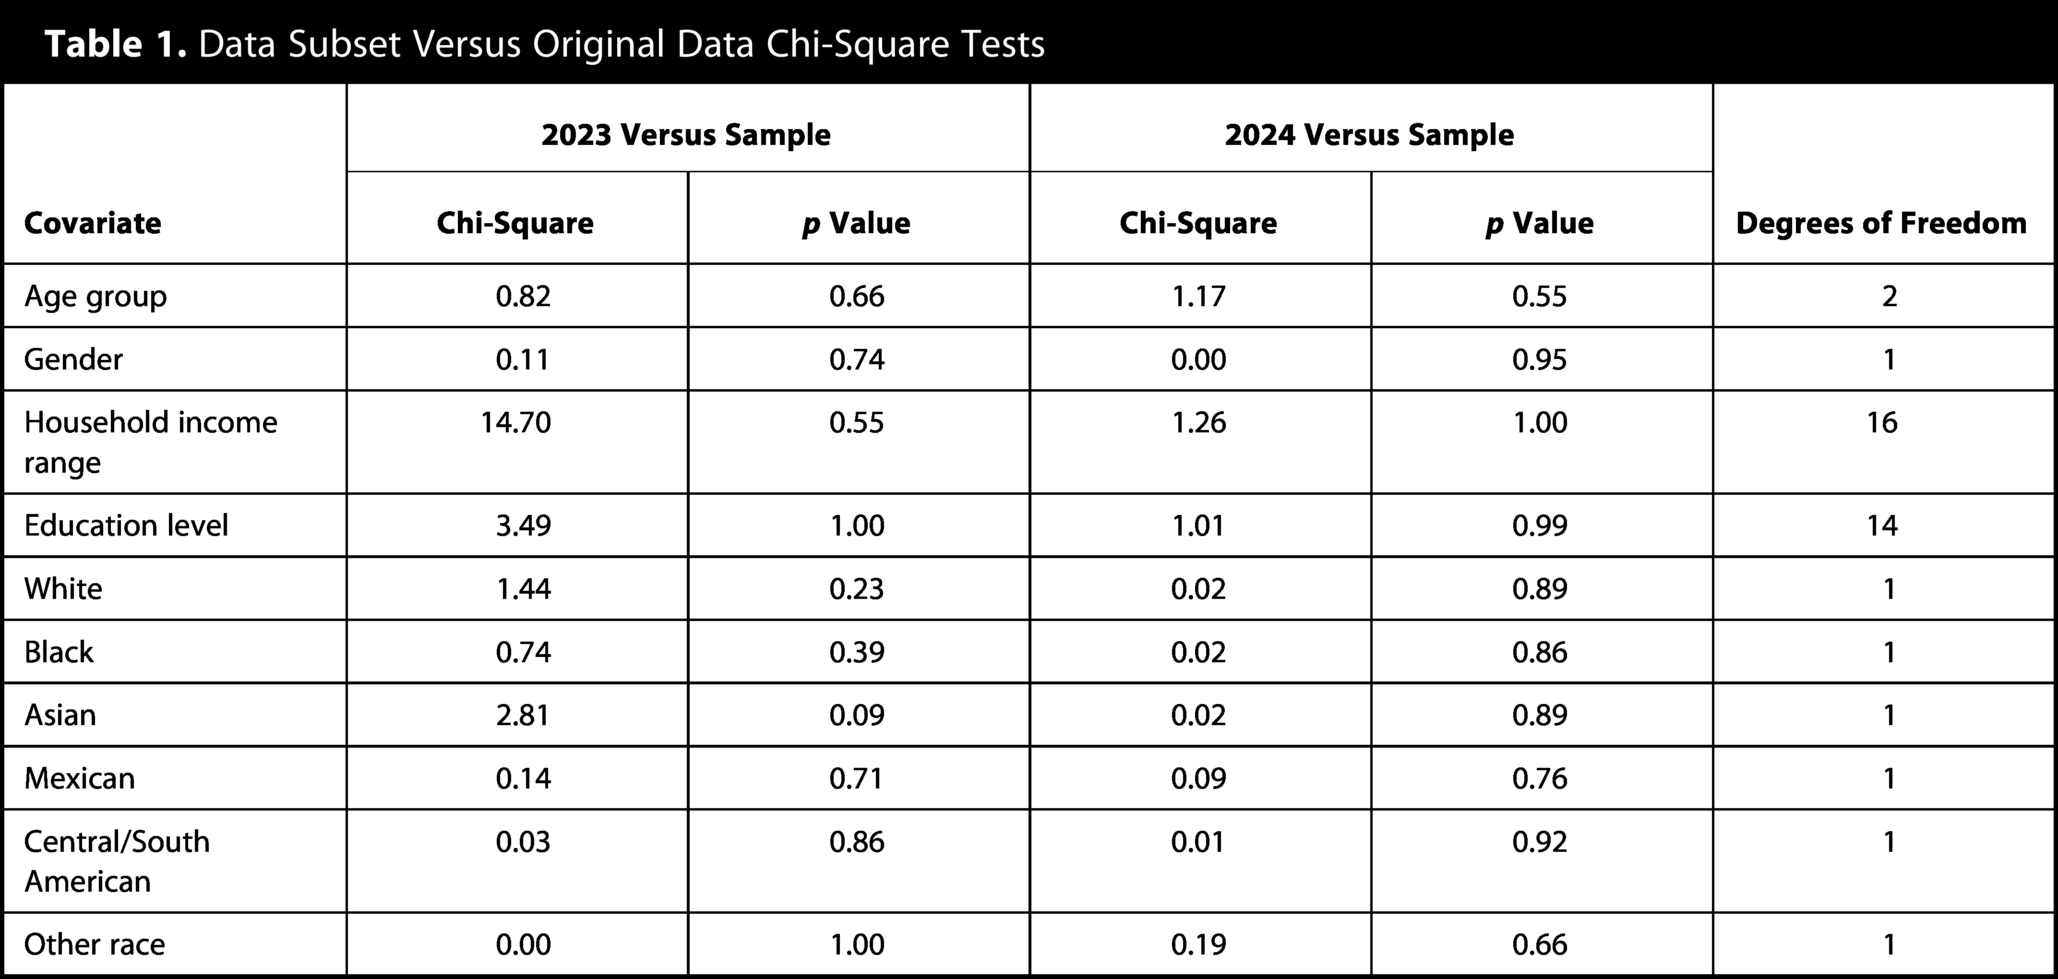
After excluding individuals who answered all questions for both years, the sample was reduced to 845 respondents for 2023 and 1,083 respondents for 2024. Because we are interested in the longitudinal effects of consuming at farmers’ markets in Los Angeles County, we limited our sample to respondents who answered all questions both years and were from Los Angeles County (N = 720). We created a cross-sectional sample that consisted of individuals who shopped in farmers’ markets both years (NCROSS = 40). The longitudinal sample consisted of individuals who did not shop at farmers’ markets in 2023 but did so in 2024 (NLONG = 57). Finally, our reference group consisted of individuals who did not shop at farmers’ markets at all (NREFERENCE = 563). To ensure the demographic characteristics of the survey data remained consistent across samples, we performed chi-squared tests to compare demographics between the sample data and the original data for both years. Table 1 shows that covariates are not statistically different between samples.
Data Subset Versus Original Data Chi-Square Tests
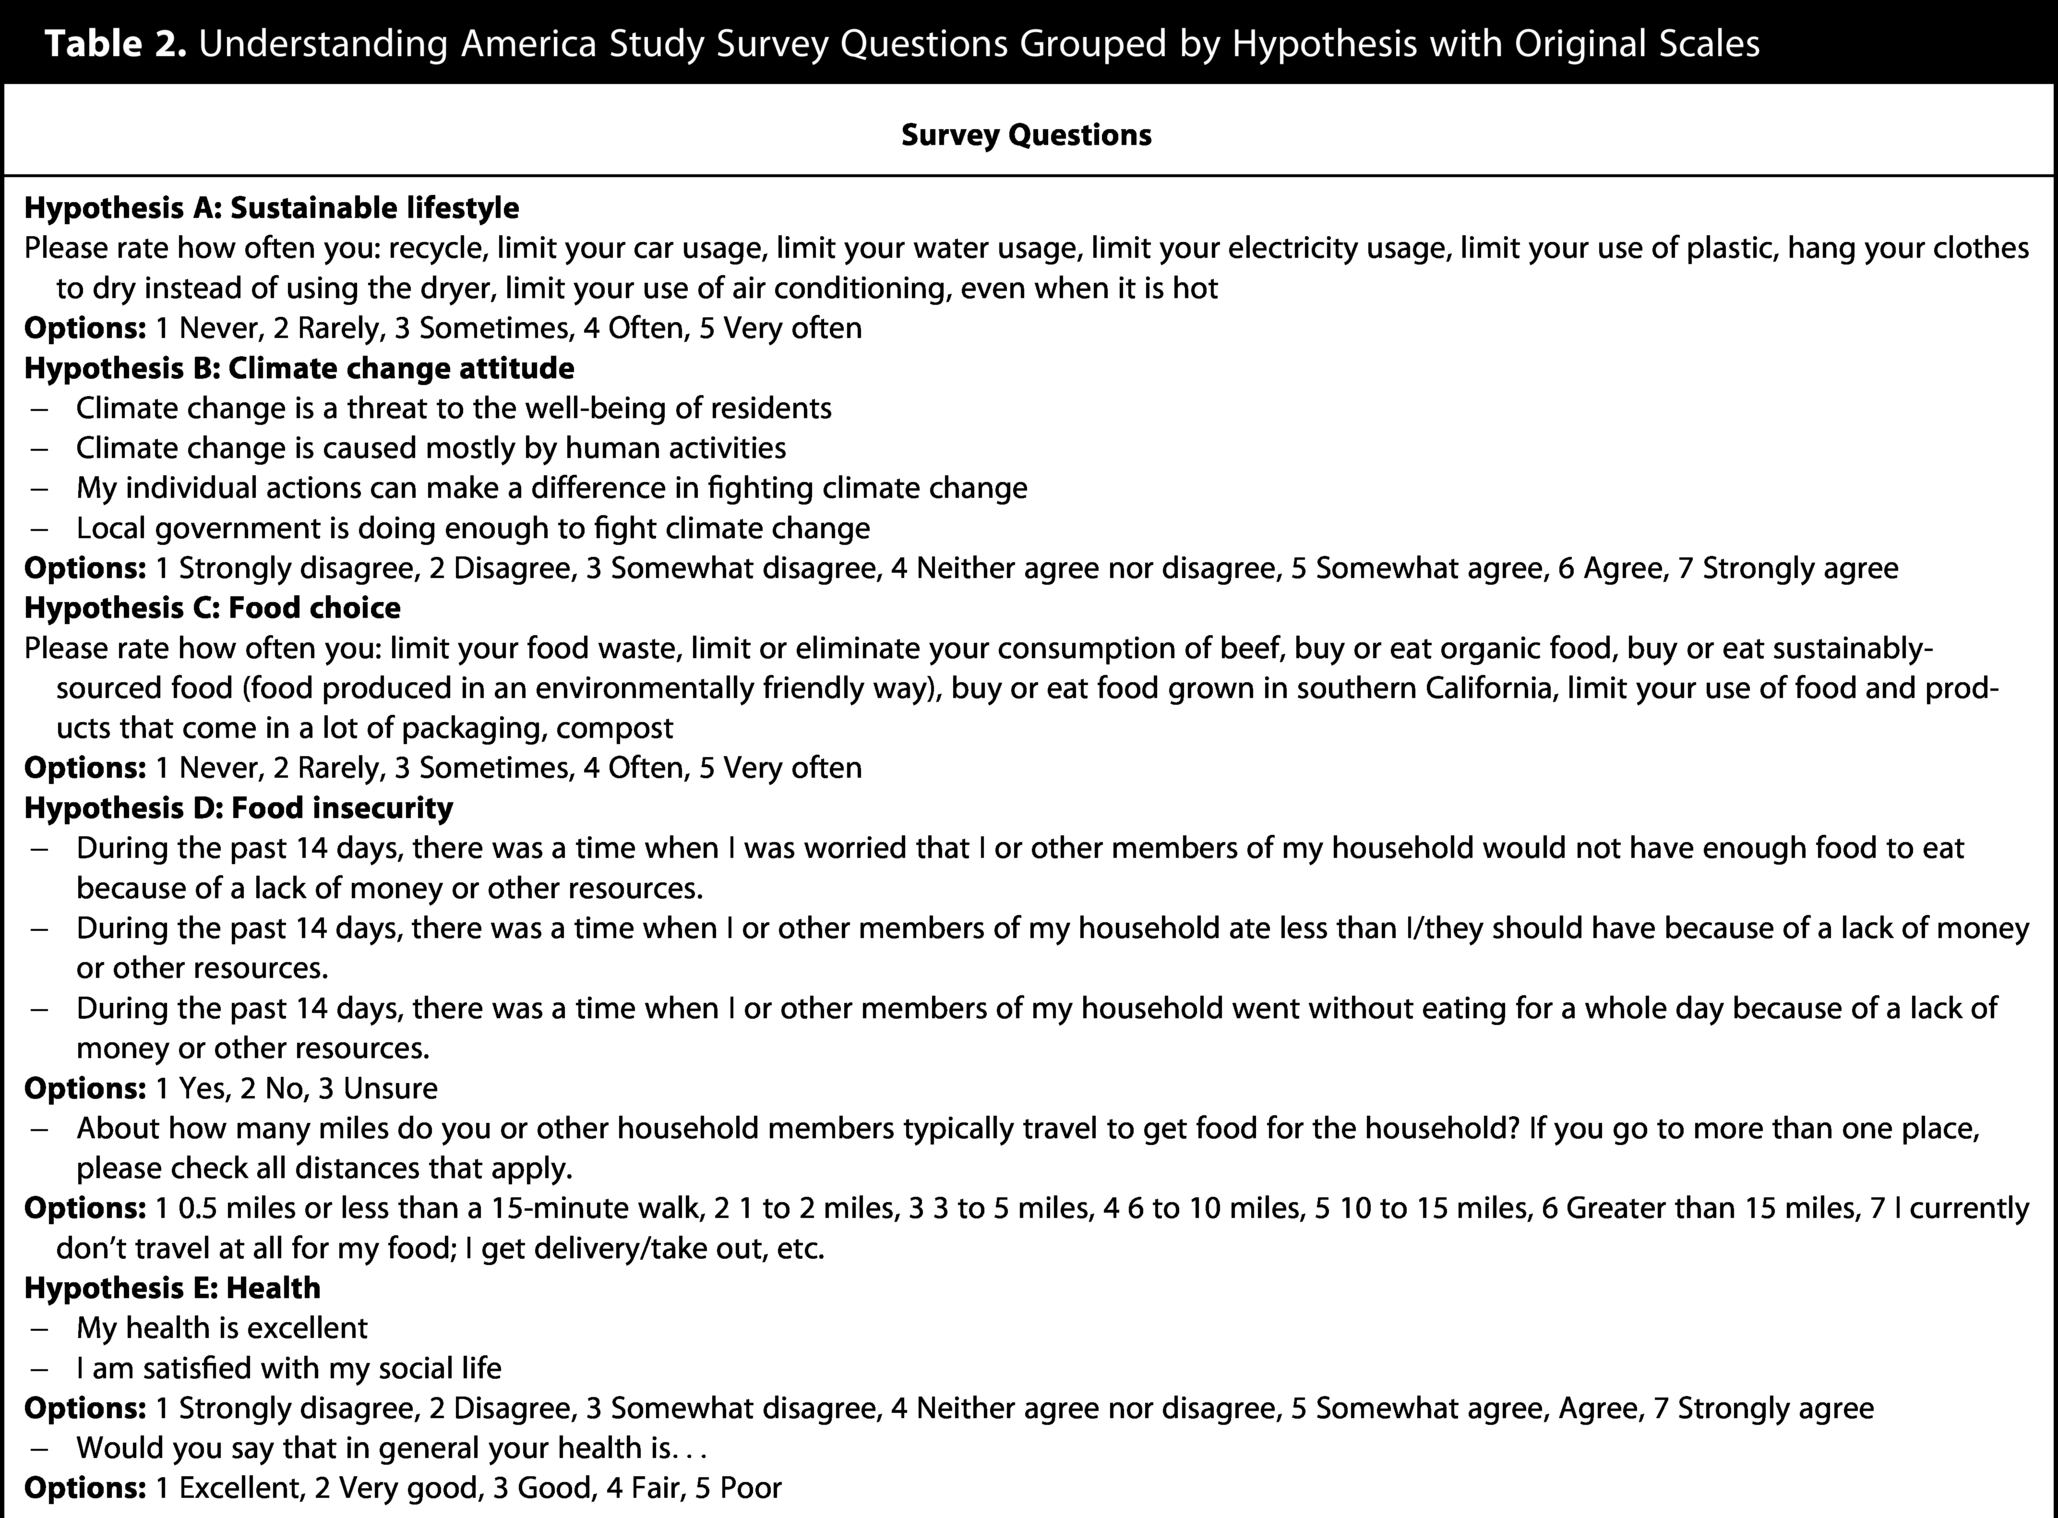
To evaluate the hypotheses, we compared how the groups responded to 25 questions from the UAS survey data regarding FM usage, sustainable lifestyles, healthy dietary behaviors, and food insecurity relevant to this study. The survey questions were grouped according to the hypotheses (Table 2). For sustainable lifestyle choices and food choice variables, we used a recoded ordinal scale that ranges from 1 to 5 (1: Never, 2: Rarely, 3: Sometimes, 4: Often, 5: Very often). Similarly, we recoded questions related to health and attitudes toward climate change to a 7-point scale ranging from 1 (Strongly disagree) to 7 (Strongly agree). Food insecurity questions in the UAS survey allowed one of three answers: 1. Yes, 2. No, 3. Unsure. In this case, we recoded the scale so that a higher score reflected lower food insecurity. The last question concerns the amount of distance traveled to acquire food, which allows multiple answers (1 0.5 miles or less than a 15-min walk, 2 1 to 2 miles, 3 3 to 5 miles, 4 6 to 10 miles, 5 10 to 15 miles, 6 greater than 15 miles, 7 I currently don’t travel at all for my food; I order delivery/takeout, etc.). In this case, we recoded the final option to 0 and took the mean of their choices as a measure of distance traveled to buy food. Finally, all scores were minimum–maximum normalized and rescaled to a 1–5 scale for comparability. Table 2 presents all survey questions and their original answer scales.
Understanding America Study Survey Questions Grouped by Hypothesis with Original Scales
Analysis
The survey data sample for this study, described previously, is unbalanced because it reflects that shopping in farmers’ markets is much less common than shopping at other types of food outlets: 563 individuals who never shopped at farmers’ markets, 40 individuals who shopped at farmers’ markets both years, and 57 individuals who shopped at farmers’ markets in 2024 but not in 2023. For this reason, all our comparisons used propensity score matching (PSM), which represents the likelihood a participant will shop at farmers’ markets. Matching participants of the compared groups helps reduce bias from confounding. PSM improves statistical tests when randomization is not possible or sample sizes are small by balancing the characteristics of the compared groups. It is common in studies that compare food choices and food-related policies (Gidey & van der Veen, 2015; Holmes, 2013; Kane et al., 2020; Mayne et al., 2015). In this case, UAS demographic variables allow estimating a propensity score to match farmers’ market shoppers to a sample of demographically similar non-shoppers.
After recoding the survey data, we estimated propensity scores with a total of 25 demographic variables. Propensity scores can be estimated using any type of regression or machine learning classification methods to compare respondents from different groups that are statistically demographically comparable (Kane et al., 2020; Kurth et al., 2006; Lee et al., 2010). We checked robustness by running tests using different types of regressions and machine learning methods to estimate propensity scores and settled on a logistic regression [Eq. (1)] because it was less sensitive to changes in variables, overfitting, and survey sampling weights. Furthermore, we tested sensitivity with sampling weights developed by UAS designed to ensure the data are representative of the national population (Angrisani et al., 2020).

Thus, p(x) is the probability a randomly selected individual from a comparison group will visit an FM based on their demographic characteristics (D n ).
The area underneath the curve (AUC) for the regressions was 0.71 for the cross-sectional sample and 0.62 for the longitudinal sample. AUC scores <0.7 are considered poor for clinical studies but common in survey studies with noisy data, which is the case here. However, in propensity score-matched models, the standardized mean difference (SMD) is more relevant. Models with balanced covariate means (SMD between 0.10 and 0.20) can be predictive even with low AUC scores (Austin, 2011,2015; Austin & Stuart, 2015; Franklin et al., 2014; Stuart, 2010). The majority of the covariates passed the SMD test, validating our method (Fig. 1).
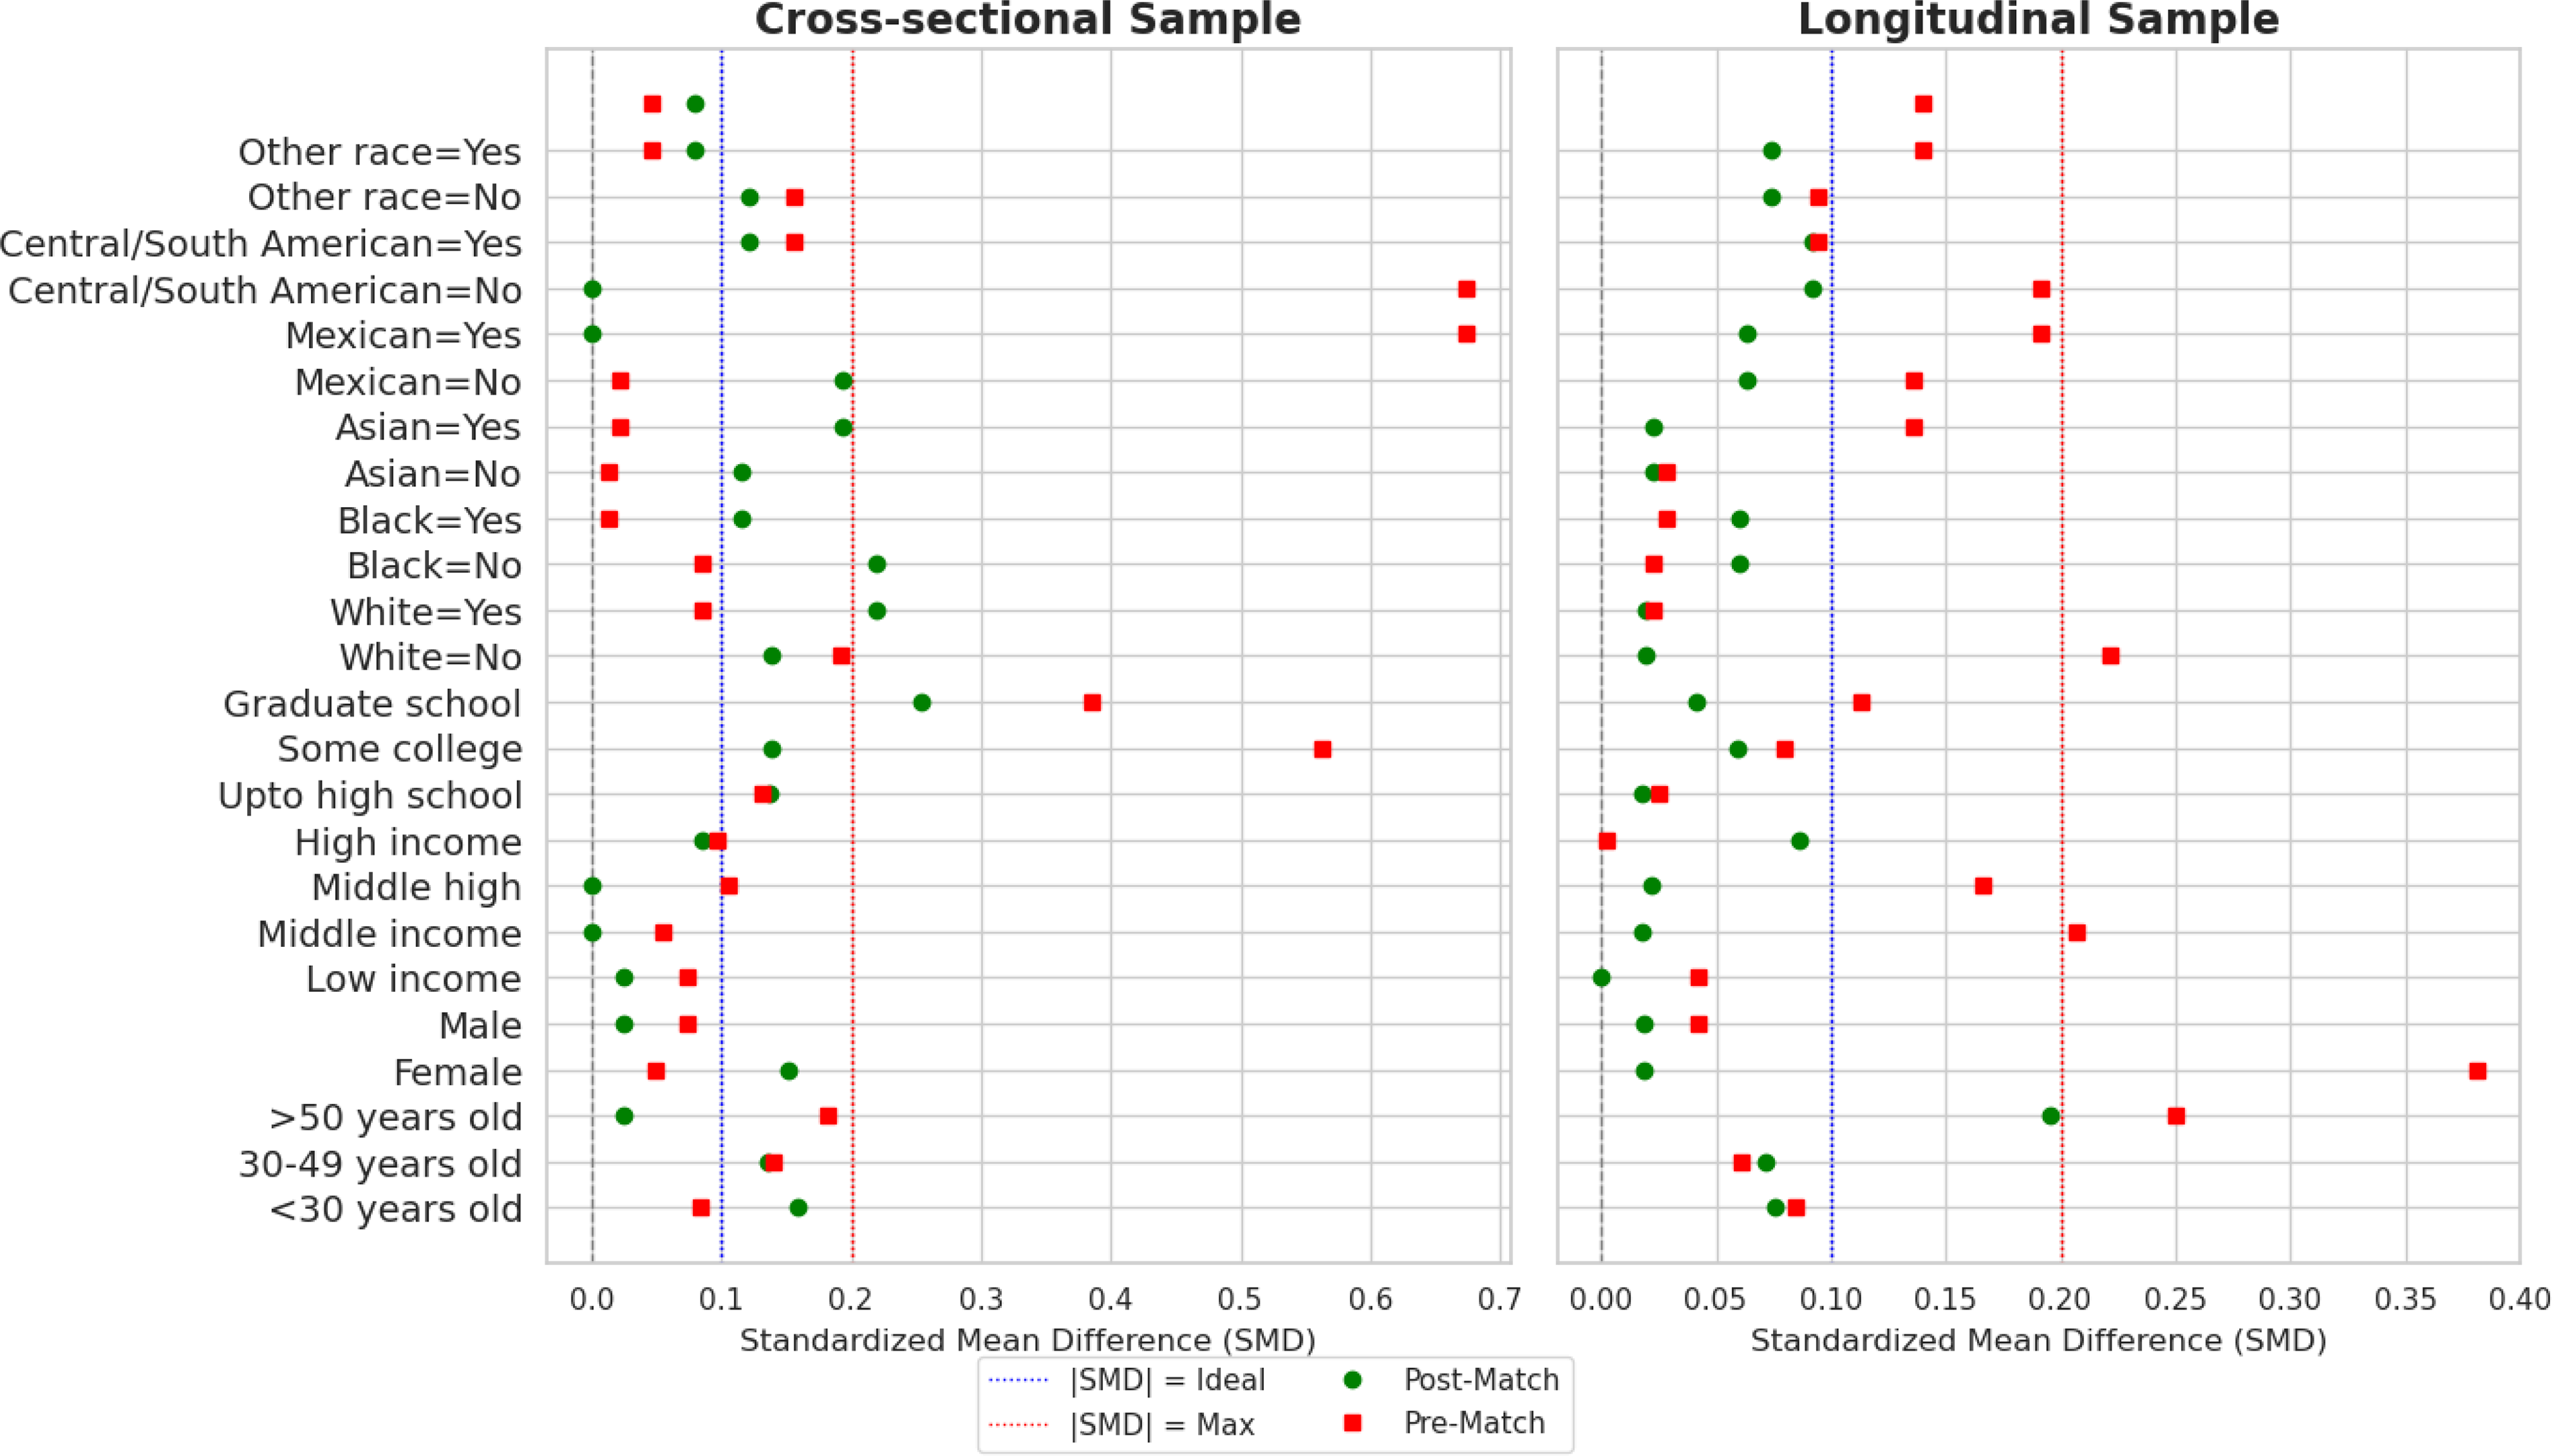
Covariate standardized mean differences (SMD). In both samples, most covariates are below 0.2, both pre and post propensity score matching. This indicates reasonably balanced SMD and validates statistical comparisons between samples.
This second part of the study evaluates associations between farmers’ markets and 25 outcome variables that are grouped in five categories, one for each of the tested hypotheses. MANOVA is applicable when grouped outcome variables need separate analysis. In this case, the predictor variables are categorical, and the outcome variables show some correlation but not enough to group them into a single indicator/score (e.g., with factor analysis or clustering) (Kraska, 2010).
This method uses matrix algebra to perform linear regressions on five matrices of outcome variables for sustainable lifestyles, attitudes toward climate change, food choice, food insecurity, and health with a matrix of the predictor variable (exposure to farmers’ markets), based on whether they or someone else in their household bought food from farmers’ markets in the last 14 days, coded as 1 = yes and 0 = no.

MANOVA is an appropriate statistical approach in this case because it treats the five groups of outcome variables that are correlated, but the association is not strong enough to group them into a score (i.e., using factor analysis did not reduce dimensionality) (Kraska, 2010; Stockburger, 2018; Warne, 2014). We ran correlation and multiple correspondence analysis to check the significance of the relationship between variables. MANOVA is applicable when the correlation between outcome variables is between 0.3 and 0.7 (Pituch & Stevens, 2016; Tabachnick & Fidell, 2019). Figure 2 shows the correlations between variables, which justifies variable grouping.
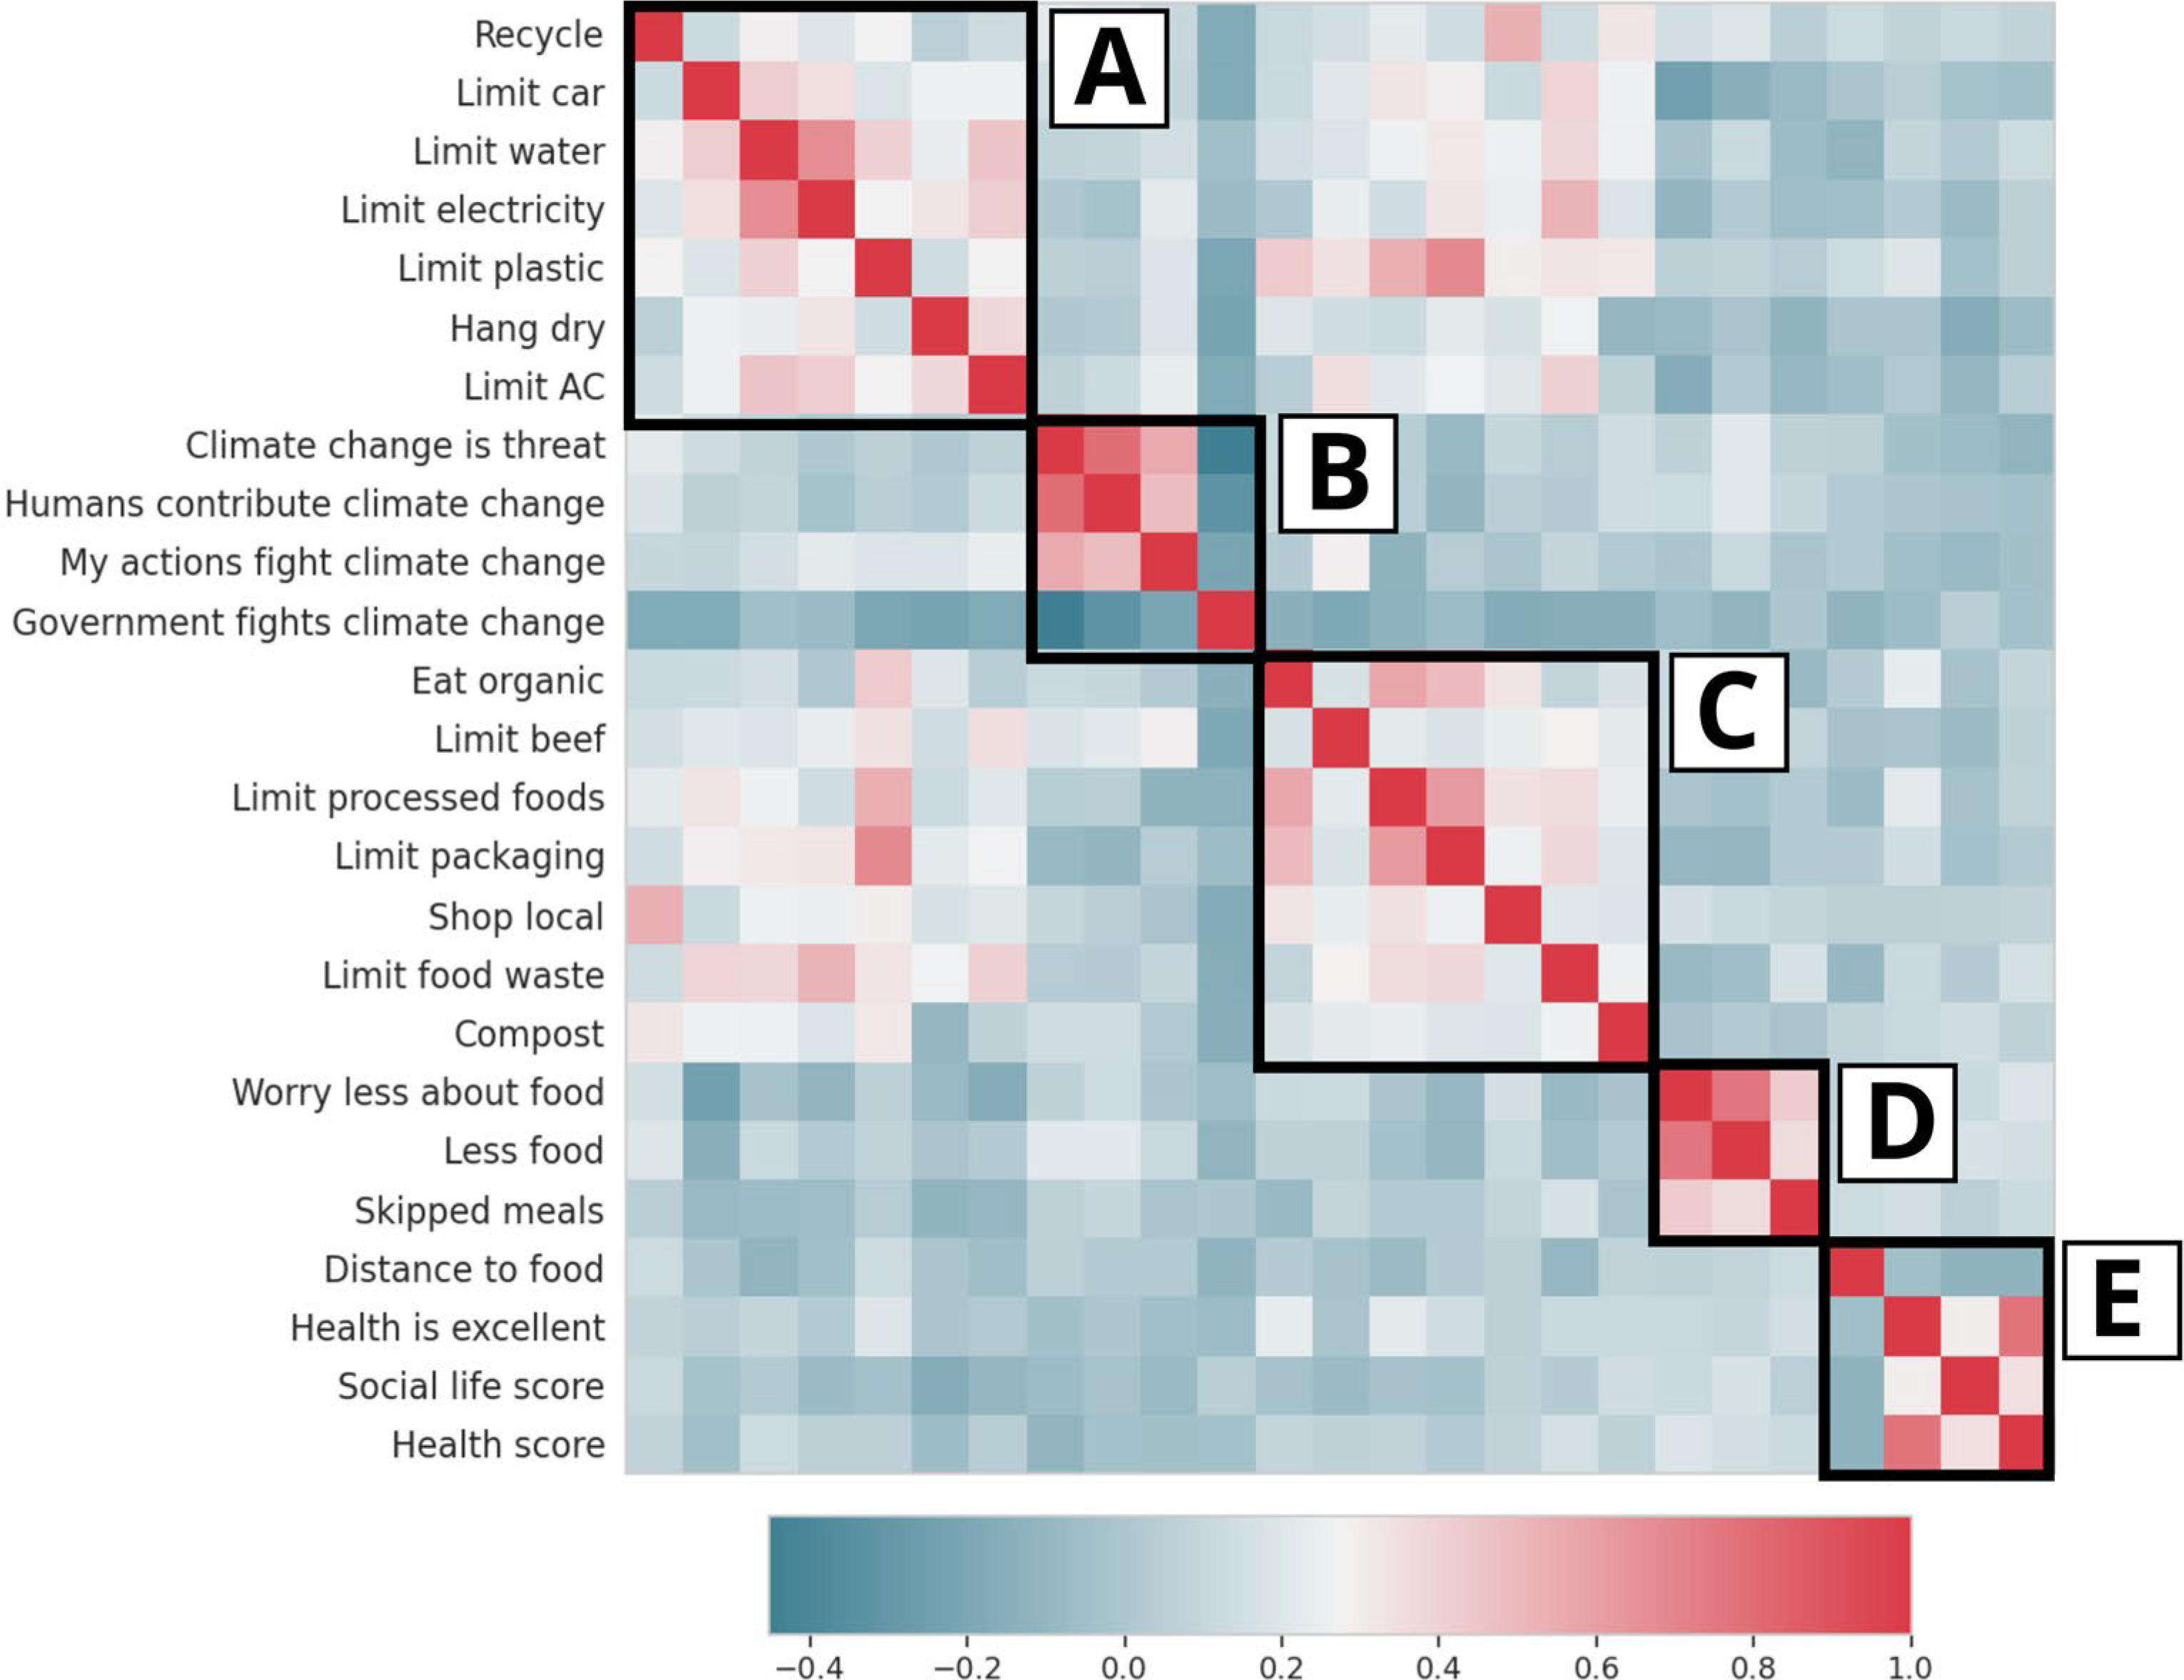
Correlation of indicators related to
Results
The cross-sectional assessment compares individuals who shopped at farmers’ markets in both 2023 and 2024 (NCROSS = 40) to a matched sample of 80 individuals who did not shop at farmers’ markets in either year. Except for attitudes toward climate change, differences between farmers’ market shoppers and nonshoppers suggest that shopping at farmers’ markets is associated with more sustainable lifestyles and healthier food choices. However, the differences are only statistically significant when it comes to eating organic food, eating less processed food, purchasing local food, and composting. They also reported a lower incidence of reducing food or skipping an entire day without eating due to a lack of money or other resources.
The longitudinal sample confirmed previous results. We compared the responses from individuals who did not shop at farmers’ markets in 2023 but did so in 2024 (NLONG = 57) to 114 propensity score-matched individuals who did not shop at farmers’ markets at all. In this test, individuals who shopped at farmers’ markets consumed organic food, less processed food, and locally sourced foods more often than those who did not. These results are summarized in Table 3.
Outcome Variable Comparisons
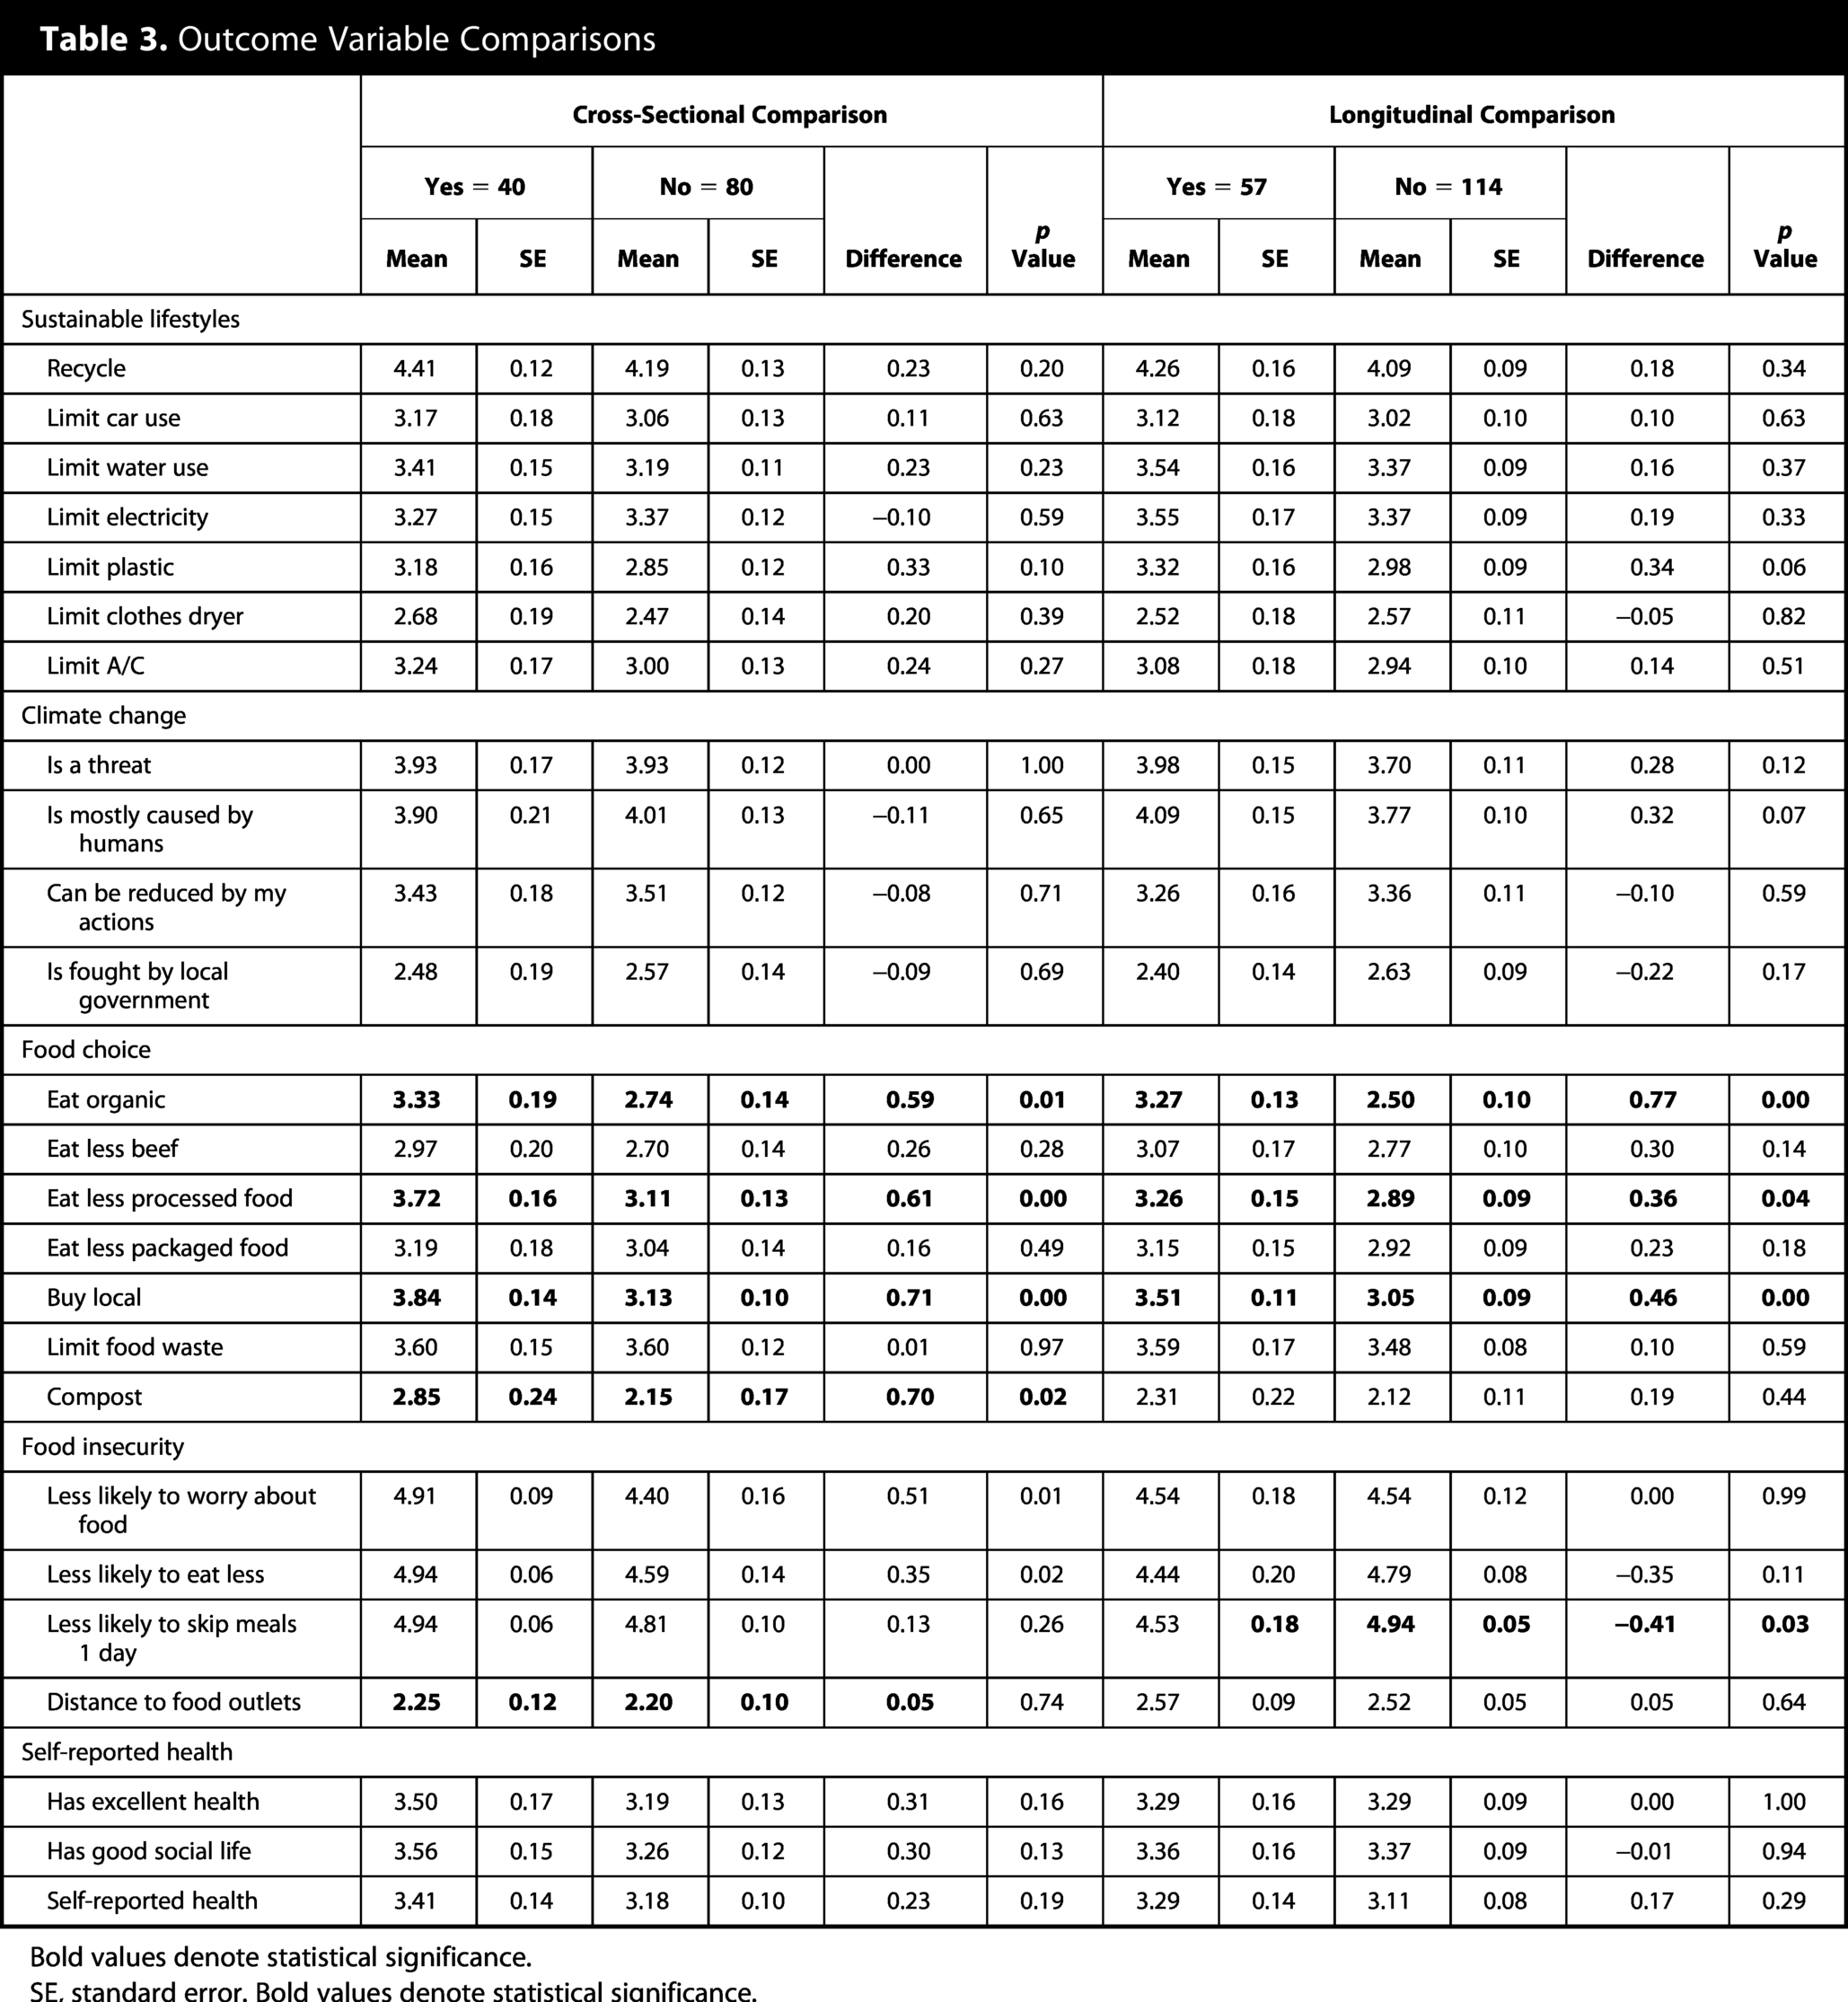
Bold values denote statistical significance.
SE, standard error. Bold values denote statistical significance.
For these comparisons to be valid, the distribution of the propensity scores between the treatment groups and the matched comparison group individuals should be similar. Figure 3 shows that the matched samples have similar distribution curves and confirms they are statistically comparable.
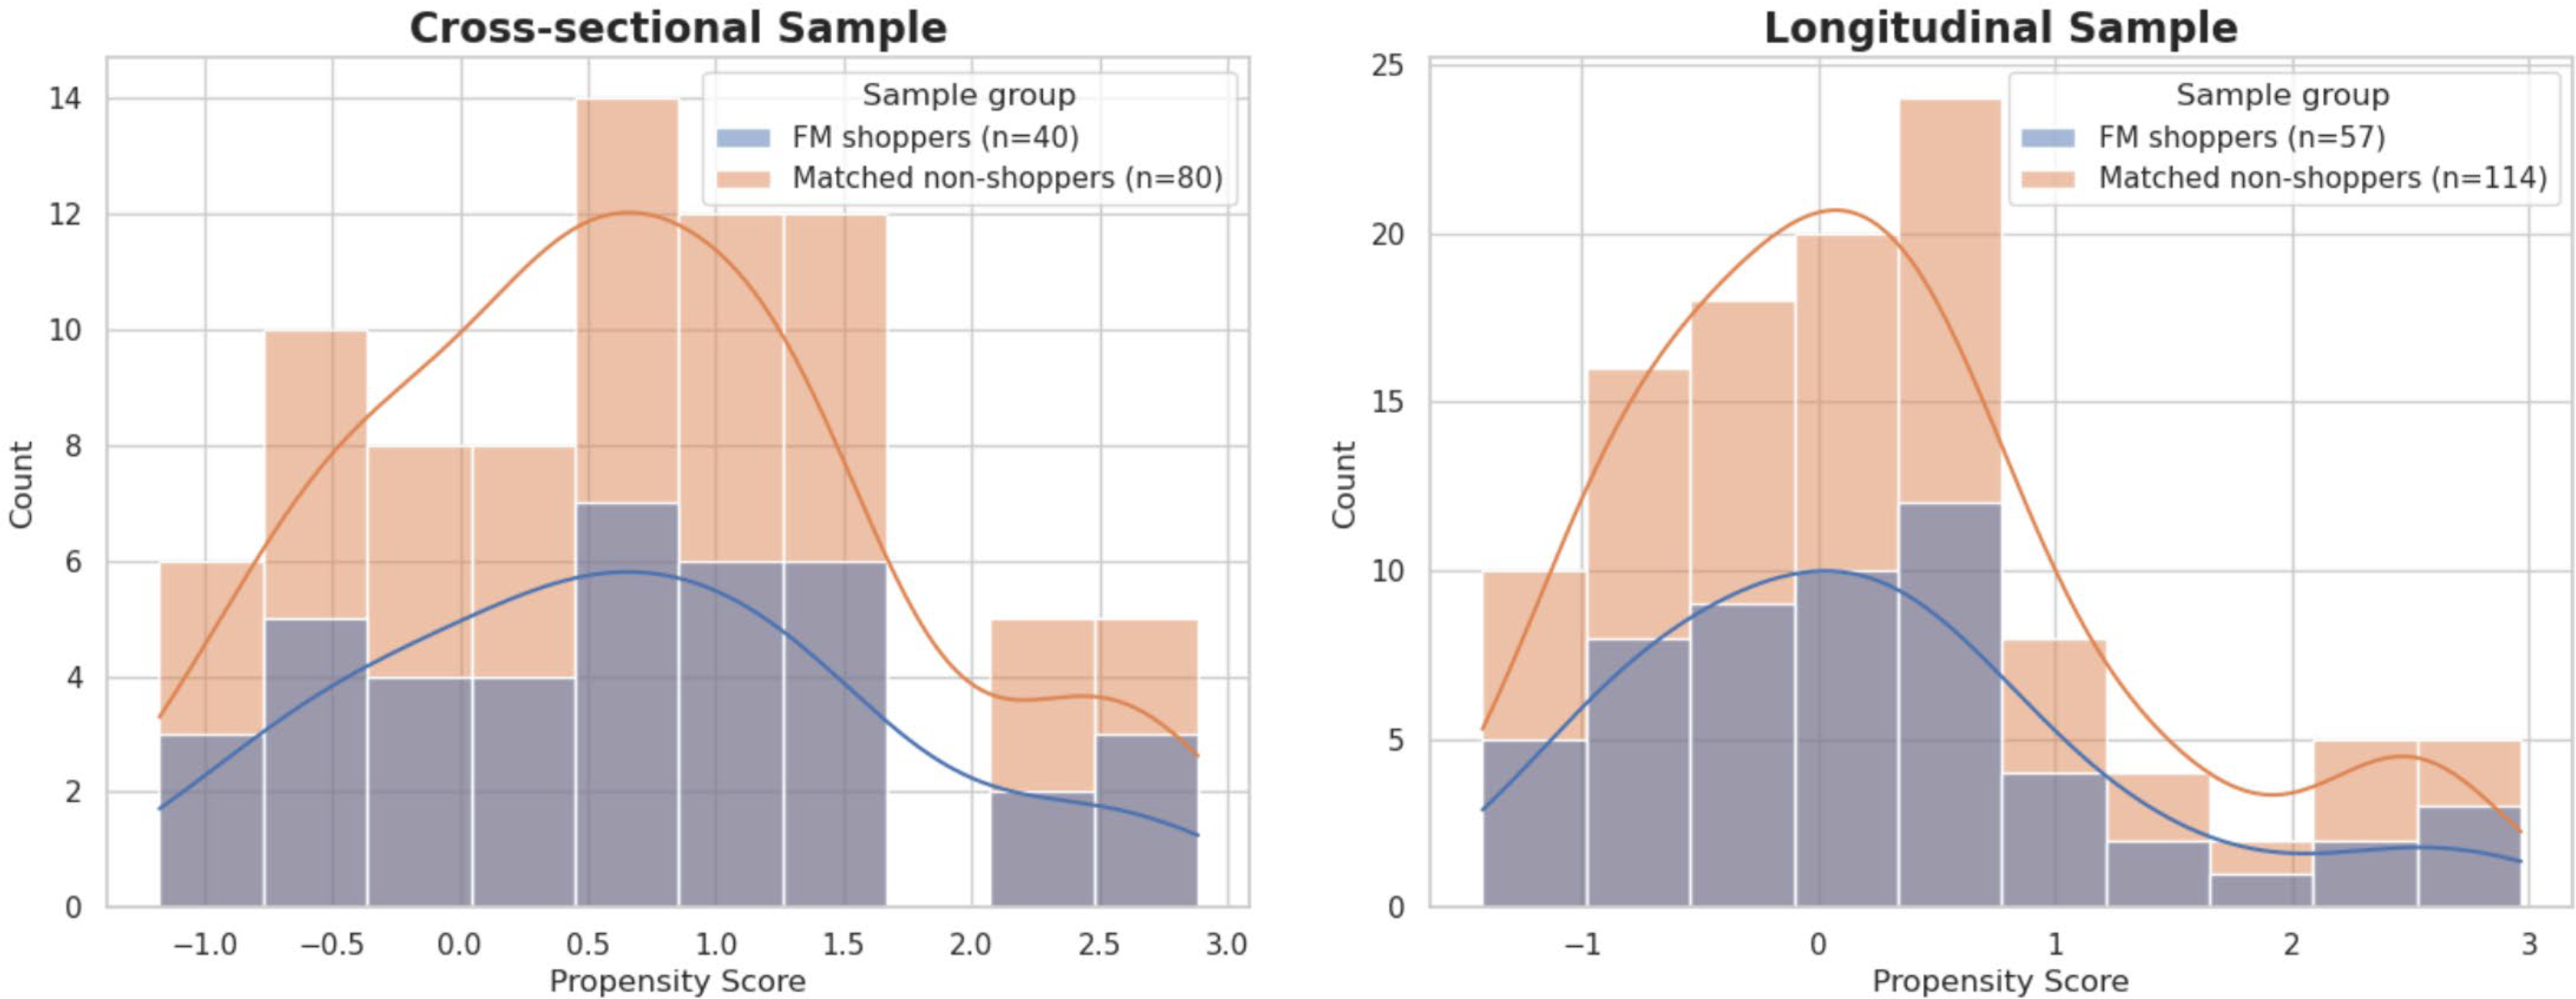
Propensity score distributions for cross-sectional and longitudinal samples. Propensity score distributions for farmers’ market shoppers and matched nonshoppers in both cross-sectional and longitudinal samples exhibit similar distributions, validating statistical comparisons.
The MANOVA results confirm that differences related to food choice and no other indicator groups are associated with exposure to farmers’ markets (Table 4). The influence of farmers’ markets is more significant in the cross-sectional tests than in the longitudinal tests (Wilks’ lambda 0.82 and 0.91, respectively).
Overall Influence of Farmers’ Markets on the Outcome Variables
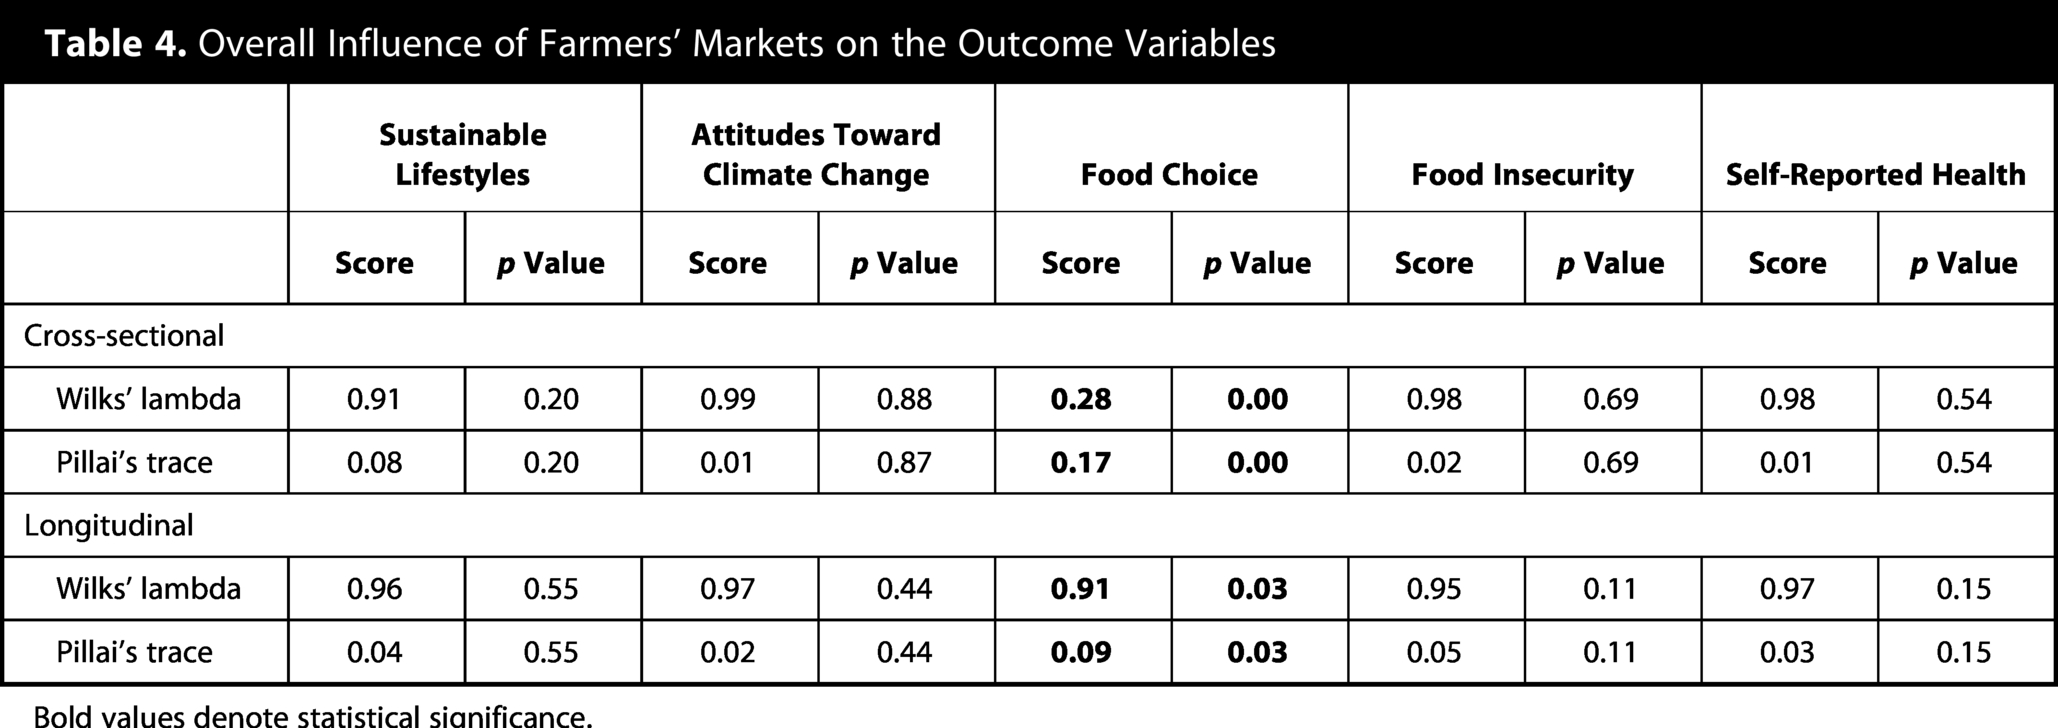
Bold values denote statistical significance.
Discussion
Overall, these results indicate that shopping at farmers’ markets is associated with sustainable and healthier lifestyles. However, the differences are significant only when it comes to food choice. Specifically, the propensity score-matched comparisons and MANOVA tests suggest people who consistently consume at farmers’ markets (cross-sectional sample) compost more, consume more organic foods, consume less processed foods, and purchase more local foods. Longitudinal results coincide with cross-sectional results except for composting. The UAS survey provides data for a representative sample of the population of Los Angeles County. However, the sample size shrinks substantially after matching and cleaning data, justifying the use of propensity score-matched comparisons and MANOVA. A longitudinal sample allows evaluating if exposure to farmers’ markets precedes the outcomes, which is more consistent with causality. However, despite methodological robustness, there are limitations that reveal gaps for future research.
In addition to the small sample size, there are two limitations inherent to survey data itself. First, indicators are self-reported, which may introduce self-selection bias. Second, we combine questions from two different UAS surveys, assuming omitted questions are not associated with farmers’ market shopping. One final limitation is that farmers’ markets in Los Angeles County are diverse. Some provide more access to fresh fruits and vegetables than others, but we do not know what specific farmers’ markets respondents visited. Given the aforementioned limitations, future work could include studies that focus exclusively on comparing shopping habits between different farmers’ markets and other types of food outlets. Because farmers’ markets may vary, future work could also evaluate lived experiences across different shopping locations that help uncover the underlying mechanisms of food choice within diverse food environments.
As discussed in the “Introduction” section, advancing toward more sustainable and healthier food systems (SDG 2) and more responsible patterns of consumption and production (SDG 12) requires a deeper understanding of the relationships among food systems, food environments, and food choice. Widespread behavioral change plays an important role in this transition. Food choice is particularly relevant because of its implications for both public health and the environment. In this context, the results presented here suggest that increasing exposure to farmers’ markets could be part of a broader strategy to promote healthier and more sustainable food systems.
Authors’ Contributions
I.W. performed all analysis and wrote this article. R.V. and J.U. contributed to method design.
Footnotes
Acknowledgment
The authors thank UAS for providing access to data.
Availability of Data and Material
Data were provided by UAS and cannot be shared to general public.
Author Disclosure Statement
The authors have no competing interests.
Funding Information
The authors did not receive any funding for this study.