
Abstract
Background:
The objective of this study was to create normative growth curves for pediatric upper airway volume using 3D computed tomography with emphasis on the neonatal age group.
Methods:
We completed a single-institution, retrospective review of all patients with available CT scans between the ages of 0 and 60 months. Patients were excluded if they exhibited any maxillofacial dysmorphism or upper airway pathology or if scans showed the presence of airway appliances or tubes. 3D volumetric upper airway analysis was performed and 2D cephalometric measurements and growth parameters including height, weight and age were recorded for all patients. Linear regression analysis was used to develop a prediction model for airway volume in terms of age adjusting for cephalometric and growth parameters stratified by sex and the resulting model was used to create separate percentile curves for each sex group.
Results:
The growth curves were created based on CT scans from 217 healthy patients. Mean airway volume was significantly larger in males than females (3.23 ± 1.98 mm3 vs 2.61 ± 1.64 mm3, p = 0.017).
Conclusions:
Normative growth curves for neonatal and pediatric upper airway volume are a useful tool for tracking changes in airway volume in the growing infant.
Keywords
Introduction
The human upper airway is a geometrically complex structure which, until recently, has been challenging to study in vivo. Fortunately, the imaging and software tools necessary to perform three-dimensional (3D) assessment and quantification are now widely available, including high resolution computed tomography (CT) and a variety of 3D image processing packages.1,2 These techniques are now in routine clinical use and are capable of generating a variety of potentially informative 3D metrics.
In recent years, MDO has been shown to deliver better outcomes relative to other surgical approaches and has become the preferred treatment for severe cases of RS that have failed conservative measures in many centers.7-11 Imaging is a critical component of the workup prior to and after MDO. Specifically, the 3D upper airway volume as calculated from high-resolution CT images has emerged as a useful parameter. Indeed, our group among others has published investigations about the utility of image-based airway volume calculation in guiding surgical planning and evaluating postoperative results.12-17 In addition to showcasing the potential utility of 3D airway volume measurements, these and other reports also serve to highlight a conspicuous lack of reliable normative data relating to airway volume and how it changes during growth and development.
The medical literature does contain several references to airway volume and growth.12,18-23 However, these studies are limited by small sample sizes, and in most cases, by failure to include subjects under the age of 5 years. Lack of information in this age group is a limiting factor for their application to patients with RS and other tongue-based causes of airway obstruction as these patients often present for evaluation and treatment during the first few years of life. To address this need, we have attempted in the present study to generate normative data on age-related changes of upper airway volume in the early childhood period, and to construct from this data a clinically usable airway growth chart.
Materials and Methods
Development of Upper Airway Volume Growth Curves
Following institutional review board approval (#IRB20-0263), we conducted a retrospective review of the radiologic database of the University of Chicago Medicine to identify high resolution CT scans covering the upper airway in children aged 0 through 59 months. The search encompassed a 10-year period between 2006 and 2016.
Patients
Exams were excluded for the following technical reasons: (1) lack of thin section images (1 mm slices or less), (2) excessive motion artifact, (3) presence of airway appliances or tubes, and (4) presence of maxillofacial dysmorphism or any visible pathologic process likely to alter the airway anatomy. In addition, the medical records of potential study subjects were reviewed and those subjects were excluded with a history of prematurity, airway compromise including obstructive sleep apnea, or with a diagnosis of known developmental maxillofacial syndromes. Effort was made to ensure that all months of age from 0 to 59 were represented by inclusion of at least one scan and ideally 5 to 6 for each month of age.
Image Analysis
All scans were performed for clinical purposes with standard image acquisition parameters. Scans included CT neck soft tissue exams (n = 124), CT craniofacial (n = 78) and CT angiogram neck exams (n = 15). Imaging was performed on one of several Philips Brilliance multidetector row CT scanners (16-slice, 64-slice, or 256-slice; Philips Medical Systems, The Netherlands) based upon availability. Parameters of the CT neck soft tissue exam were as follows: detector collimation = 0.625 mm; slice thickness = 0.9-1.0 mm; slice increment = 0.4 mm; kilovoltage peak (kVp) 100 kVp; milliampere-seconds (mAs) = 90-100 mAs. Parameters of the CT craniofacial and CT angiogram neck exams were as follows: detector collimation = 0.625 mm; slice thickness = 0.8-0.9 mm; slice increment = 0.4 mm; kilovoltage peak = 100-120 kVp; milliampere-seconds = 250-325 mAs.
The included scans were subjected to 3D volumetric upper airway calculation using Vitrea Enterprise Suite (Vital Images, Minnetonka, Minnesota). Semi-automated airway segmentation was performed using the available tools included for this purpose in the software suite. The boundaries of the volume of interest were defined as previously described 18 with slight modification to accommodate the young age of our subjects (Figure 1a and b): superiorly to the level of the hard palate at midline; anteriorly to the junction of the hard and soft palate at midline, or to a vertical line drawn tangent to the anterior margin of the sphenoid sinus; inferiorly to a horizontal line drawn tangent to the inferior margin of the hyoid bone and/or through the C2/3 disk space. To serve as normalizing factors, several 2D craniofacial measurements were also taken from the imaging studies including bizygomatic width (BIZ), bigonial width (BIG), nasion-to-basion distance (NAS), and porion-to-porion width (POR) (Figures 1c-f).
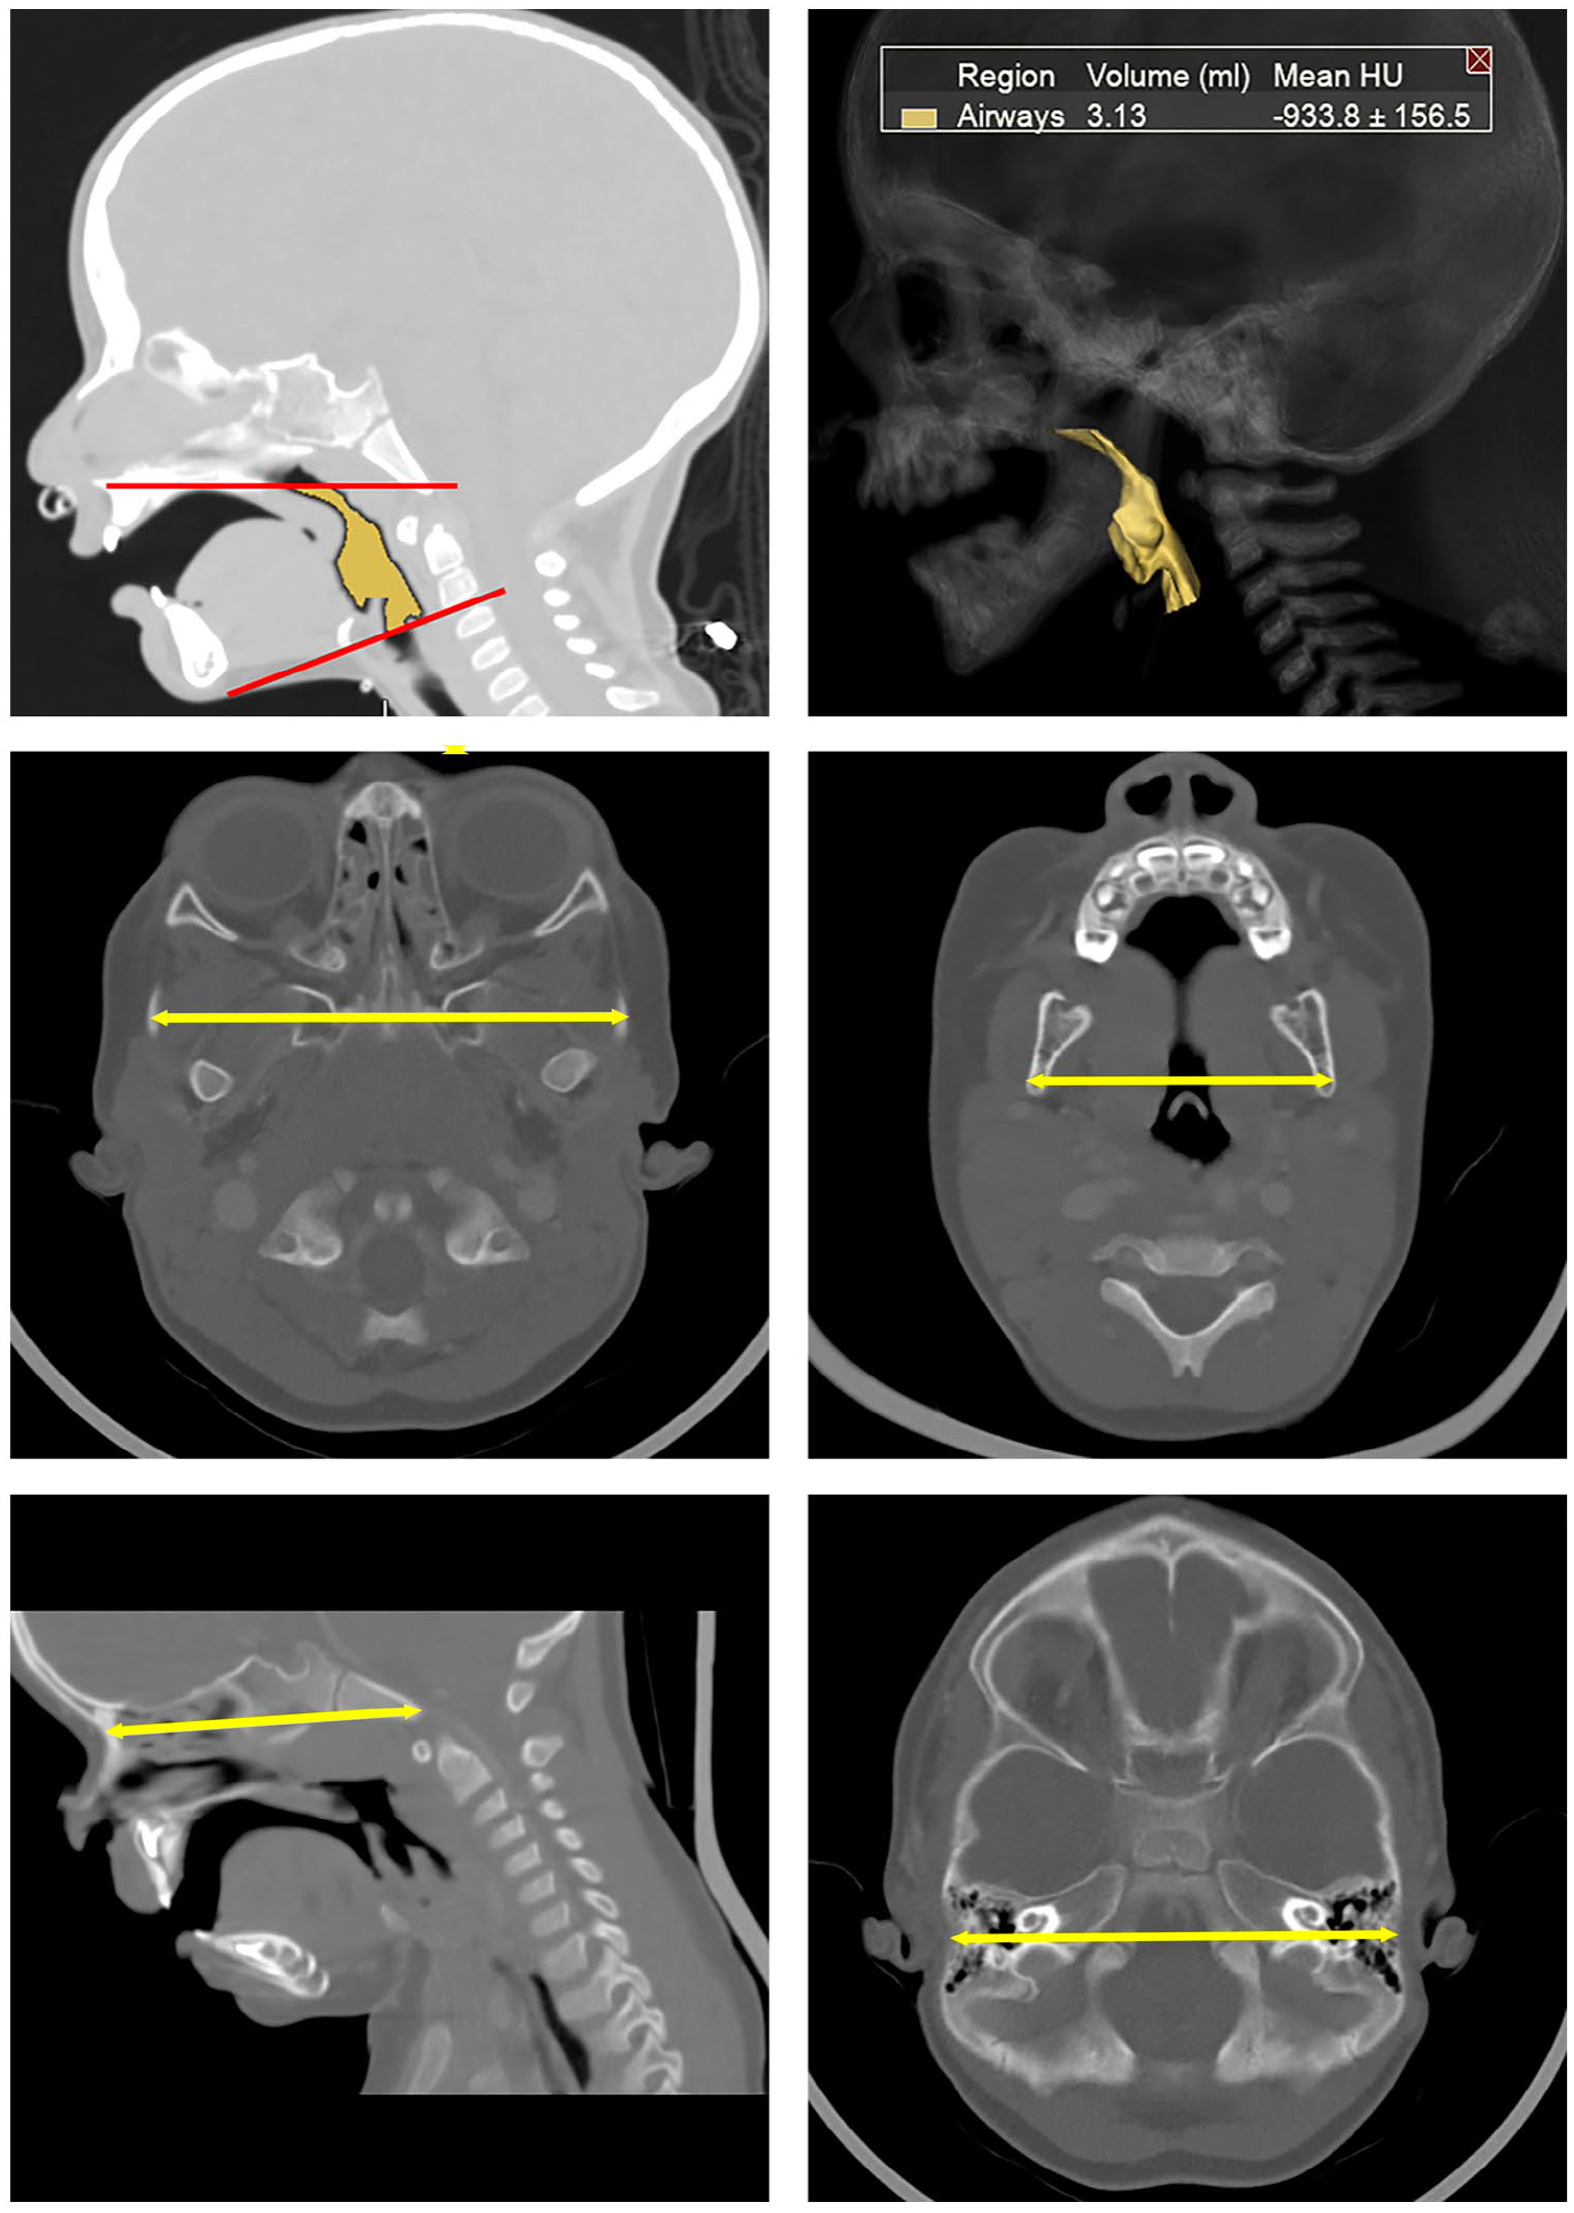
(a) CT segmentation for 3D volumetric airway calculation with superior and inferior borders highlighted and (b) 3D airway reconstruction, (c) 2D craniofacial measurements for growth normalization included bizygomatic width, (d) bigonial width, (e) nasion-to-basion distance, and (f) porion-to-porion width.
Statistical Analysis
Statistical analysis was performed using the R software (R Foundation for Statistical Computing, Vienna, Austria), version 4.2.0. The methodology for constructing growth curves was based on prior report. 24 Cephalometric parameters (BIG, BIZ, NAS, POR) based on CT imaging and available growth parameters (height, weight, Age and Sex) were collected for all patients when available (Table 1).
Patient Demographics for Healthy Patients Used for Growth Curve Calculations.
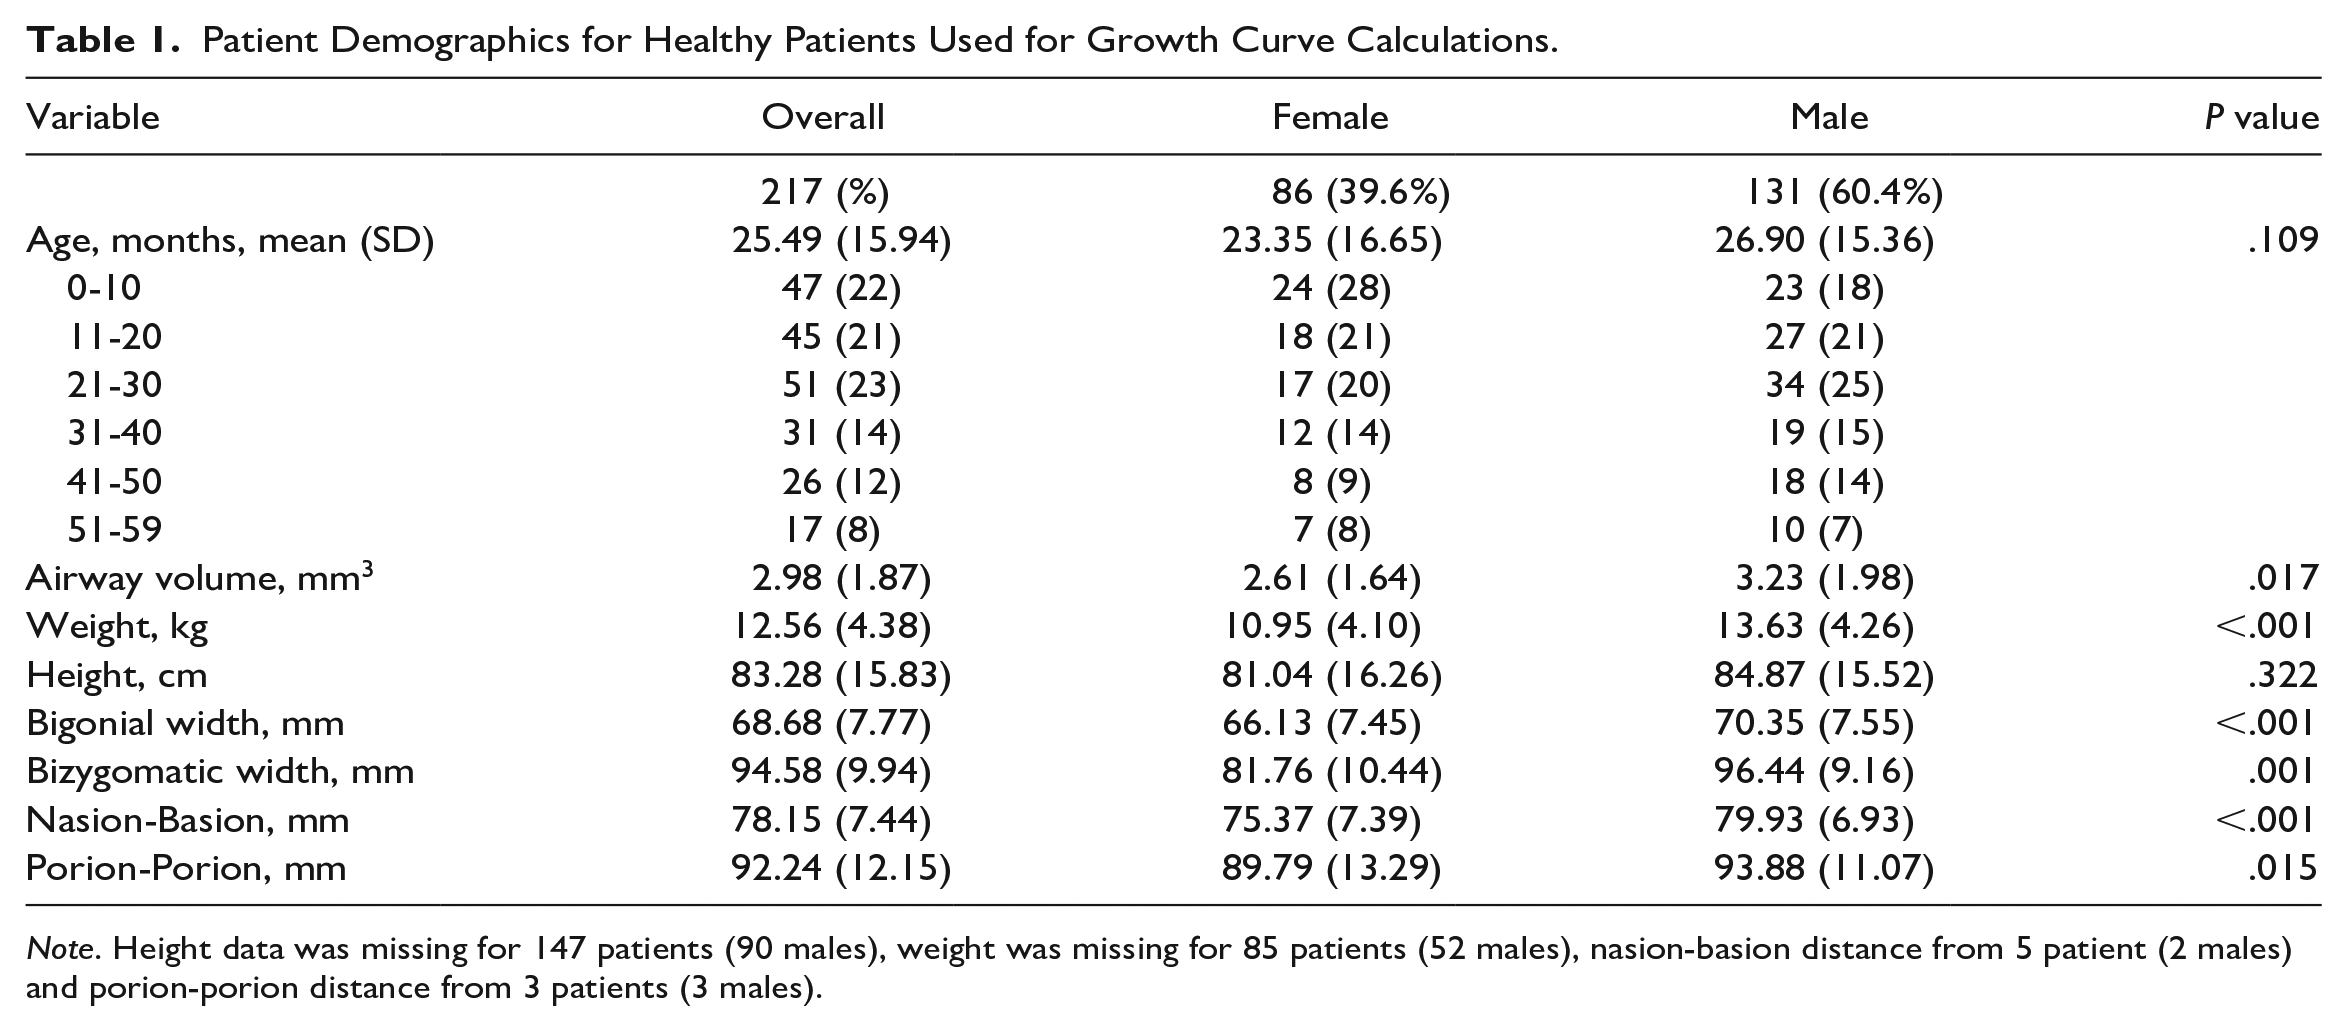
Note. Height data was missing for 147 patients (90 males), weight was missing for 85 patients (52 males), nasion-basion distance from 5 patient (2 males) and porion-porion distance from 3 patients (3 males).
Estimating Normalized Ranges for Airway Volume
Linear regression models were developed for the airway volume (AirV) versus age with linear and quadratic effects of height, weight, and the craniofacial parameters for each sex group. Age and nasion-basion distance were found to be significantly correlated and the regression models were refit with these variables. To account for missing data points for height and weight, we conducted multiple imputations via chained reactions by generating M = 1000 data sets with complete data for each group. For each imputed data set, we conducted best subset variable selection and found that the model adjusted for BIG, NAS, WT and Age had the highest selection proportion of the dataset. These models were then used to calculate normalized ranges for airway volume stratified by sex.
To estimate normalized ranges for airway volume, the models were first fit to the complete data set. Raw residuals were then calculated by subtracting the fitted values from the observed values. Scaled absolute residuals (SAR) were then calculated by multiplying the absolute values of raw residuals by a factor of 1.25. These SAR values are unbiased estimates of the standard deviations of the errors under the assumption of normally distributed errors. Since there is evidence of heterogeneity in standard deviations, we fit a linear model for SAR vs Age. Then, to calculate the normalized (z-score) AirV value, we divided the “raw residuals” to fitted SAR values for each patient. We confirmed the normal distribution of our normalized ranges via Kolmogorov-Smirnov test for each group. Finally, to determine the percentile for each patient, we applied the normal ranges to the standard normal curve adjusting for age, height, weight and selected 2D CT parameters for each sex group.
To estimate the percentile curves (ranging from 10th to 90th percentile), we fit quadratic regressions for height, weight and selected CT parameters vs age, which allowed us to predict these mean values as functions of age. These values were used to predict the mean AirV values using our regression model only in terms of age. Percentile curves were obtained for females (Figure 2a) and males (Figure 2b) by multiplying the percentiles of the standard normal distribution by the predicted standard deviations which are added to the predicted mean AirV.
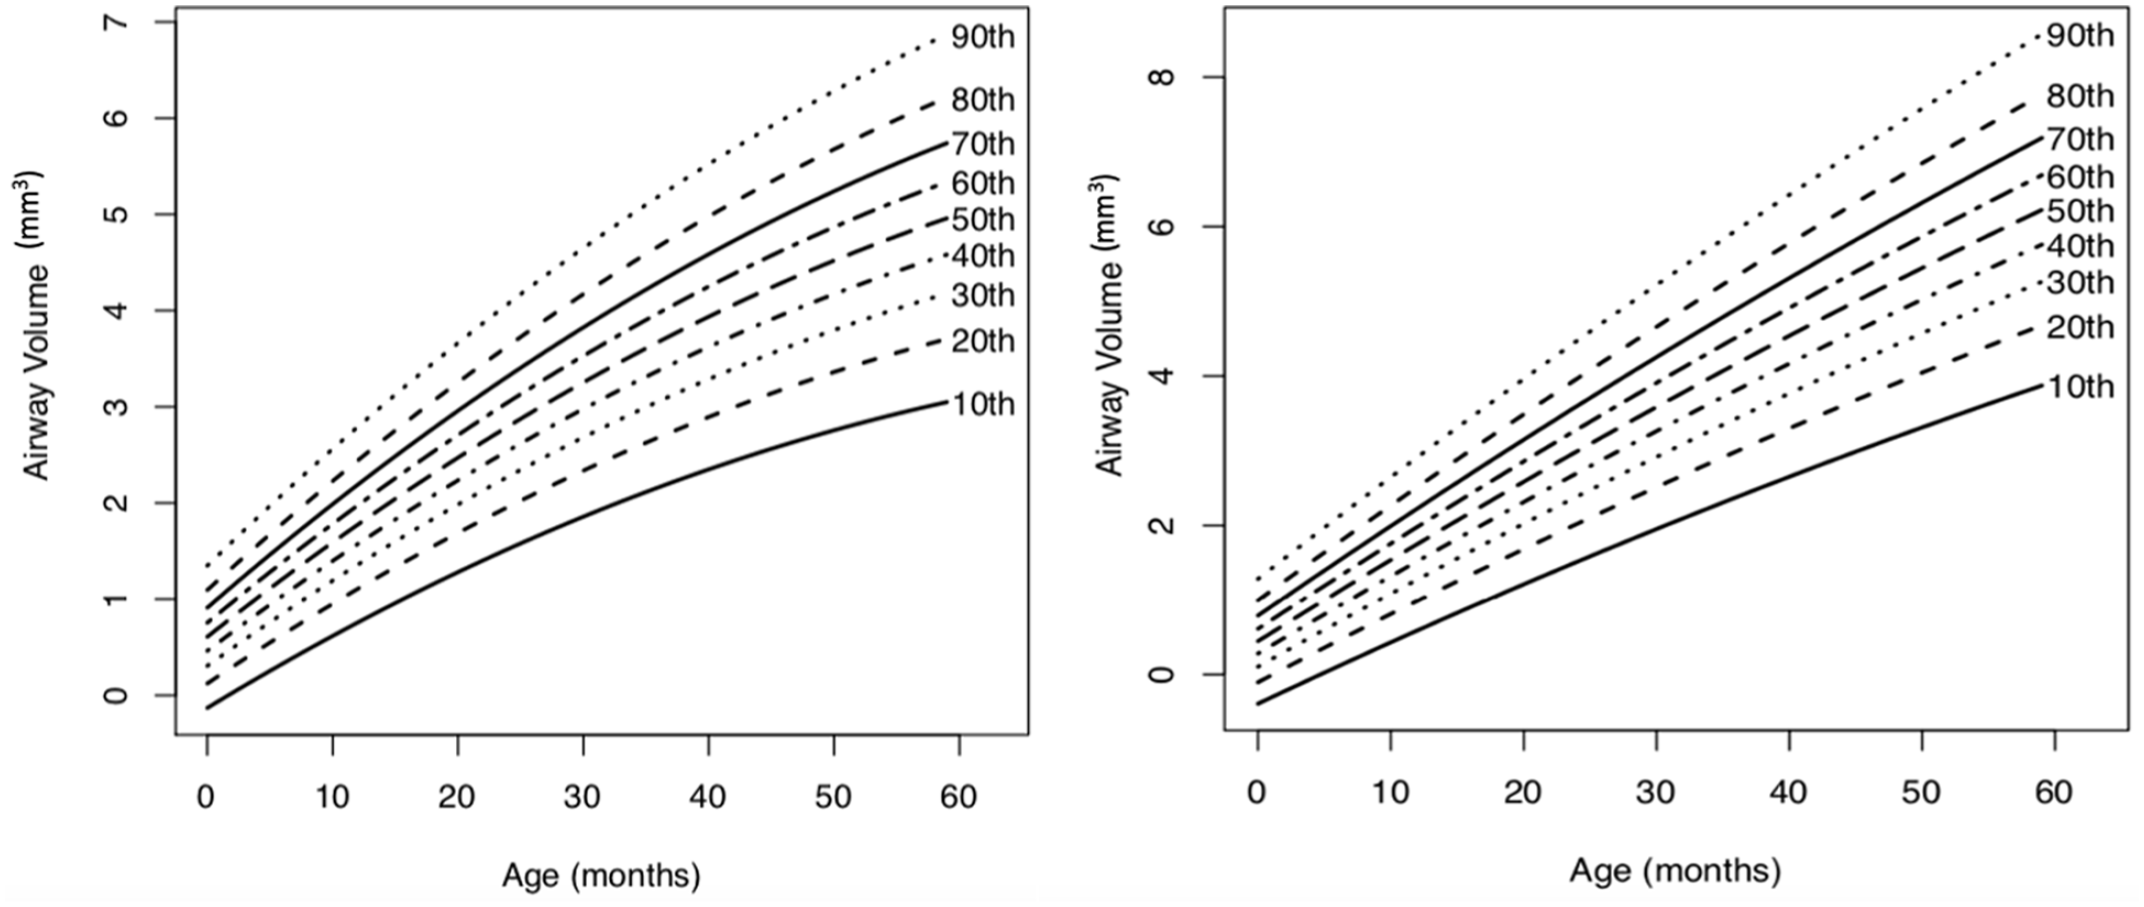
Predicted normative percentile growth curves for airway volume (mm3) by age (months) for (a) females and (b) males.
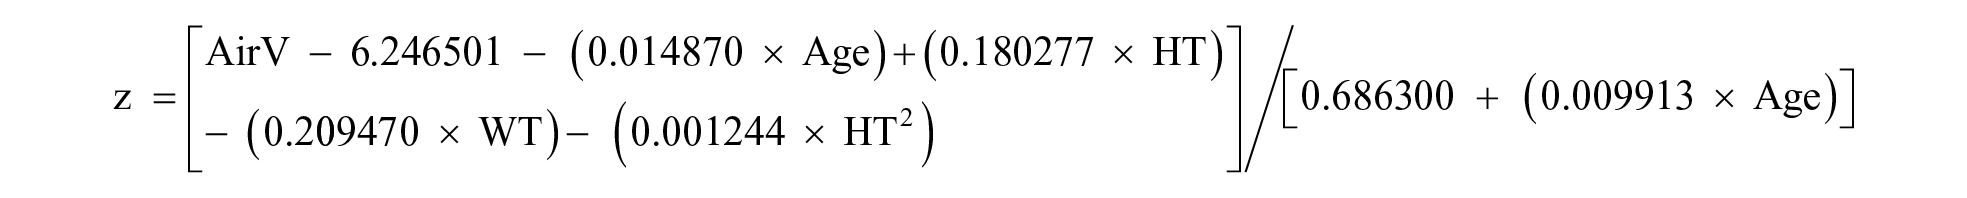
Separate formulas were created adjusting for physical characteristics (HT, WT, Age) only and both physical characteristics and CT parameters (NAS, BAS, BIG, BIZ) to calculate the z-scores for the normative percentile assuming normal distribution of the data.
Females
Basic model
Adjusted model
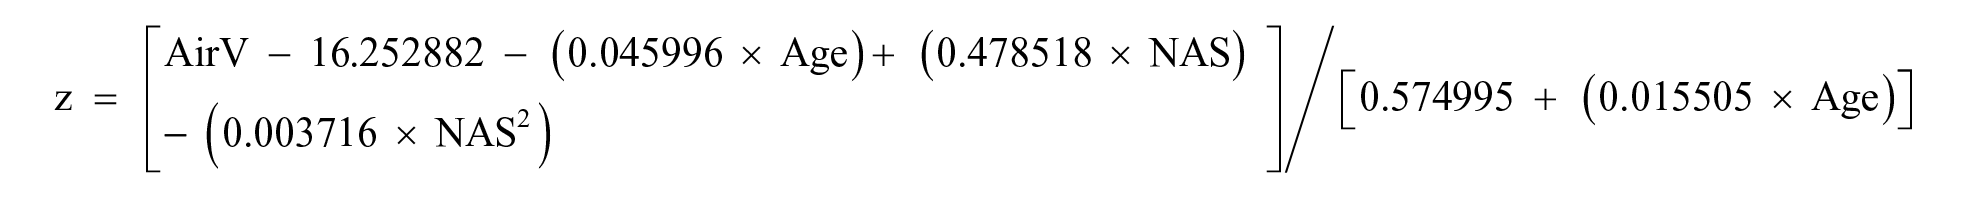
Males
Basic model
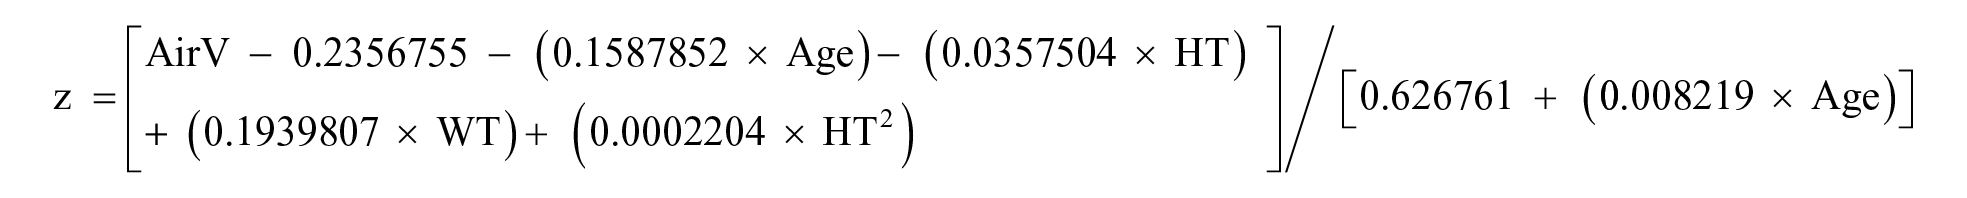
Adjusted model
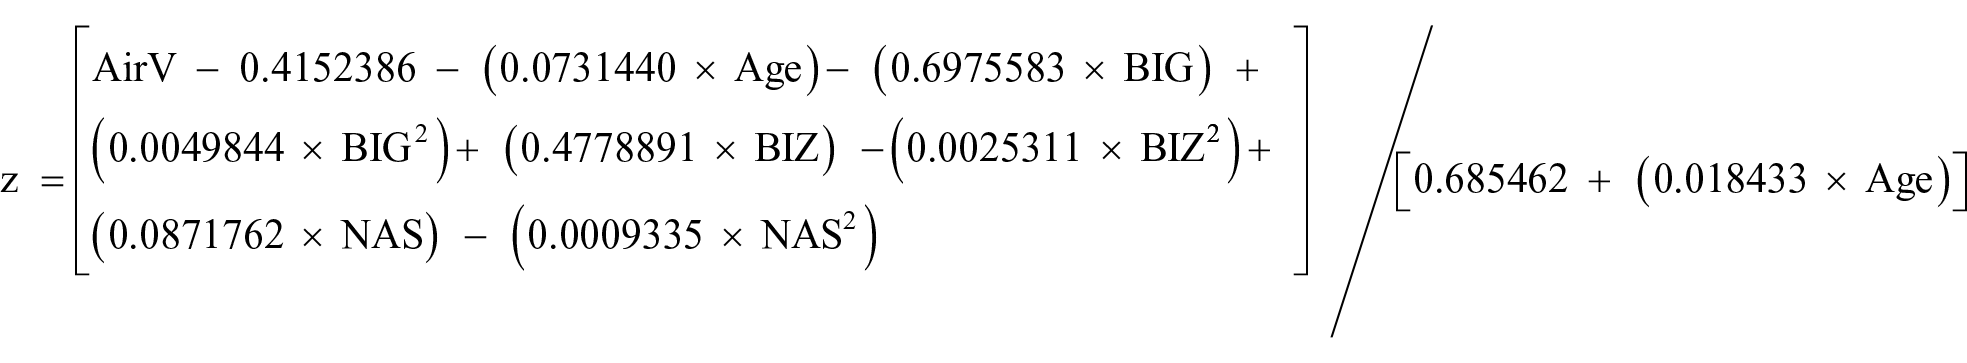
where z is the normalized AirV z-score, which is converted to the normative percentile using the standard normal curve.
Results
Upper Airway Volume Growth Curves
Our initial search yielded 500 CT scans. After screening, a total of 217 scans met the inclusion criteria and were selected for further analysis. These consisted of 86 females (39.6%) and 131 males (60.4%). Table 1 outlines the age distributions from 0 to 59 months. There was no significant difference in ages between males and females (26.90 ± 15.36 vs 23.35 ± 16.65 months; p = 0.11). Airway volume was significantly greater in males than females (3.23 ± 1.98mm3 vs 2.61 ± 1.64mm3; P = .017). Weight as well as all 2D craniofacial parameters (BIZ, BIG, NAS, POR) were found to be significantly greater for males. Correlation coefficients for age vs airway volume was found to be r = 0.76 for males and r = 0.77 for females (Figure 3, Table 2). Height was also found to be a good linear predictor for airway volume (r = 0.74 males, r = 0.77 females). Height data values were missing for 147 patients (90 males), weight data values were missing for 85 patients (52 males), NAS distance data values were missing for 5 patients (2 males) and POR values for 3 patients (3 males).
Correlation (r) Between Airway Volume and Growth Characteristics and CT Parameters.
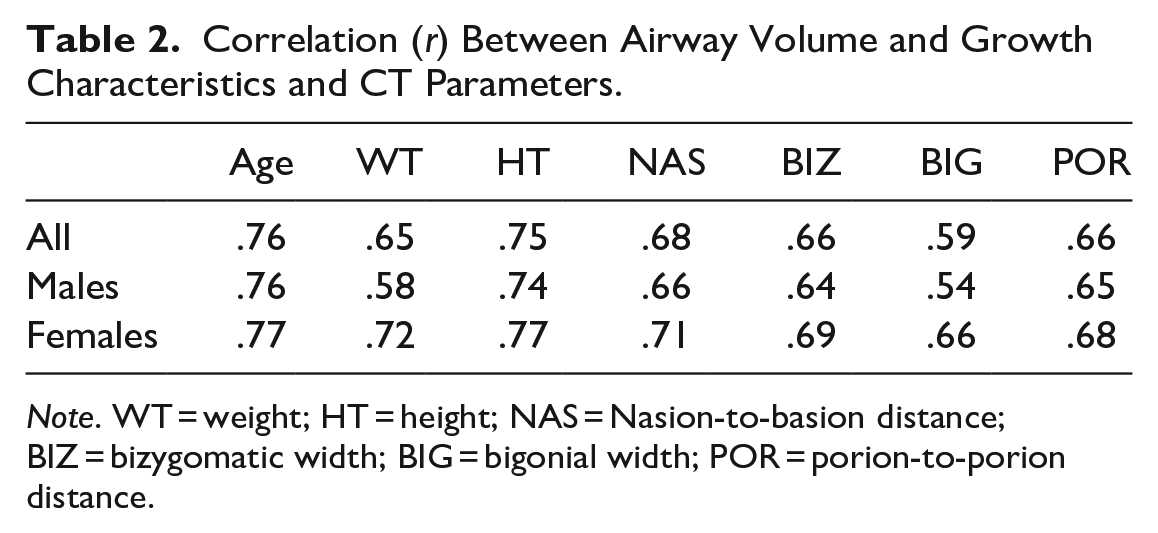
Note. WT = weight; HT = height; NAS = Nasion-to-basion distance; BIZ = bizygomatic width; BIG = bigonial width; POR = porion-to-porion distance.
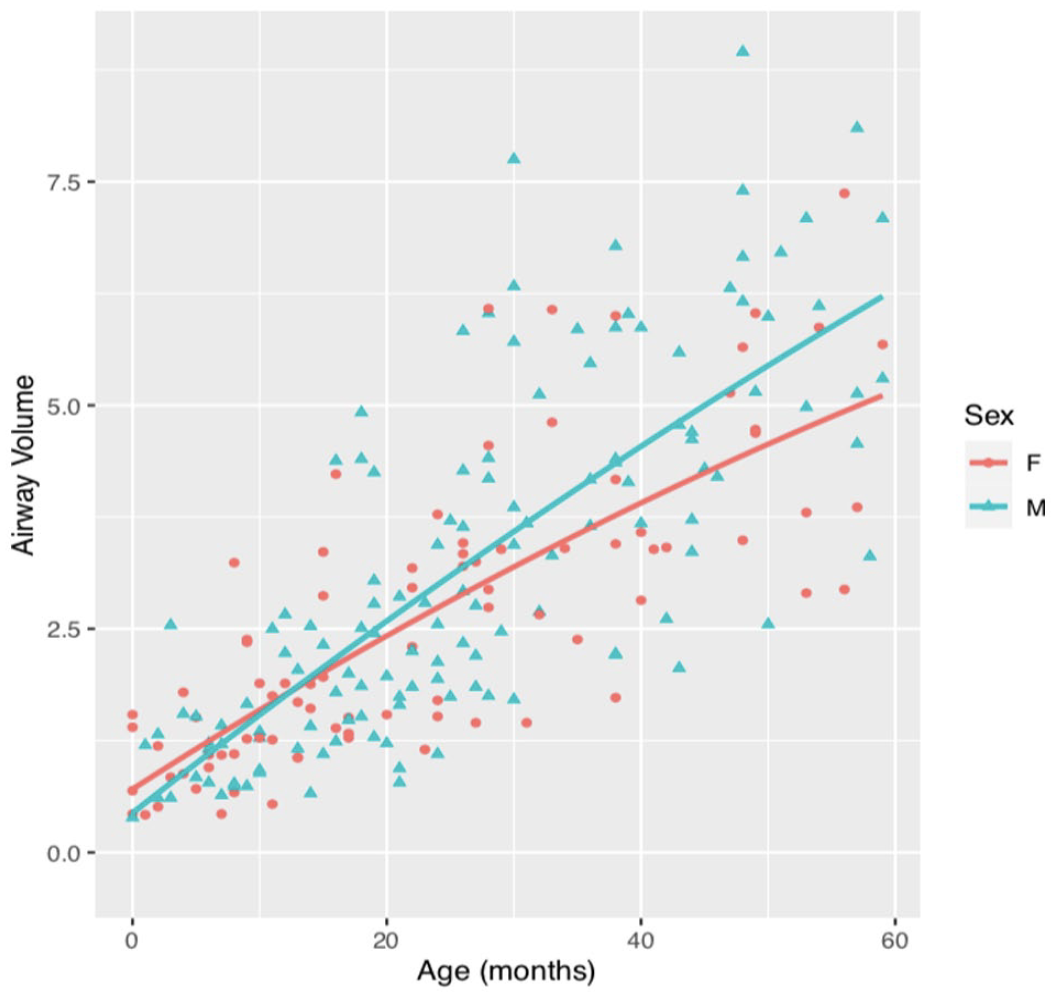
Airway volume (mm3) versus age (months) for healthy females and males.
Discussion
We have previously described the morphologic changes of the upper airway in patients with Robin Sequence treated with mandibular distraction osteogenesis for symptoms of upper airway obstruction and compared these changes to age-matched controls. 17 In this study, we extrapolate on these efforts by creating normative data for airway volume in terms of age adjusting for height, weight and CT parameters stratified by sex in neonatal and pediatric patients to facilitate the tracking of changes in airway volume in this patient population over time.
Growth curves for height and weight are commonly used in pediatric medicine to monitor normal child development and inform the need for early clinical intervention. The aim of this study was to create a clinical tool for airway volume that could be used in a similar manner for patients presenting with symptoms of upper airway obstruction. Our current clinical pathway involves acquisition of standard bedside polysomnography in addition to CT maxillofacial scan to delineate the morphology of the upper airway and identify specific areas of obstruction. 25 3D reconstructions are obtained and volumetric analysis of the upper airway is performed and frequently used in preoperative planning.14,16,26 Previous studies have demonstrated that mandibular distraction is effective in expanding the upper airway.10,27-29 However, predicting how much expansion is necessary to affect a physiologic response is challenging, 16 and an arbitrary percentage of volume increase is often used to determine the approximate length of mandibular advancement.
One of the difficulties with determining an appropriate endpoint for airway volume expansion is the lack of normative data in this age group. In essence, it is unknown what the 50th percentile of normal, for example, translates to in total airway volume and whether this would represent an appropriate endpoint for mandibular distraction. Patients with RS typically present in the first months of life. However, previous studies that have published normative data on airway size and morphology have focused primarily on the pediatric and adolescent patient population.18,19,21 Yi et al 23 studied patients under 6 years of age but the study is limited by small sample size (n = 57) with a disproportionate number of patients in the older age groups. Our study is the first to analyze 3D volumetric data on a large cohort of normal neonatal patients and to translate this data into a relevant clinical instrument.
We analyzed 217 patients and found a significant difference in airway volume by gender, especially in patients greater than 10 months of age. While there was no significant difference in mean age between our male and female patient cohort, the mean airway volume was lower for females compared to males (2.61 ± 1.64 mm 3 vs 3.23 ± 1.98 mm 3 , P = .017). This finding, which is reflected in the percentile curves on our growth charts, contrasts to previous work by Abramson et al 18 who found no difference in airway size or shape in the pediatric or adult age groups. The prior study is also limited by a smaller patient cohort, an older age distribution (mean age 19.7 years) and a lack of percentile calculations. Similar to previous work, we found age to be most strongly correlated to airway volume (r = 0.76), slightly more so than height (r = 0.75). In females age and height were equally correlated with airway volume (r = 0.77), more so than weight or any of the 2D craniofacial parameters.
It is important to emphasize that static anatomic measurements of the airway do not always correlate well with physiologic parameters (ie, obstructive apnea hypopnea index) of obstruction16,17,30-32 and that the growth curves should be used in conjunction with standard polysomnography. The dynamics of airflow through a complex, heterogeneous, compressible 3D structure as the upper airway are difficult to simulate 33 and even more challenging to accurately measure. Expansion in particular segments of the upper airway including the retropalatal and retroglossal regions have been shown to correlate with physiologic response to airway expansion and the overall morphologic changes of the airway may provide a more predictive model than airway volume alone. 17
We have found that a small percentage of our patients, in particular those with an associated syndrome, have a recurrence in obstruction some time post-distraction. The airway volume growth charts may provide a clinical instrument to delineate how the airway of these patients has changed over time both relative to their own prior dimensions as well as compared to the general population. In the absence of the RS, the growth charts could also find application in children with isolated obstructive sleep apnea, which is being diagnosed at younger ages and has been shown to be associated with smaller airway size. 34 In this sense, our tool is agnostic to any technique and can be applied to track and monitor airway size regardless of intervention use (tonsillectomy, orthodontic appliances, etc.).
The reliance on static 3D CT scans is an important limitation in volumetric airway analysis. The images are snapshots in time and influenced by patient positioning 35 and the phases of the respiratory cycle 36 ; the upper airway is slightly more or less compressible in the expiratory and inspiratory phases of breathing, which can influence measurements of airway volume. This may lead to some variability in airway measurements between patients. Many patients also require sedation and assistive airway devices, which can distort the airway and lead to exclusion of these patients from analysis. Recent advances in 4-dimensional computed tomography (4D-CT) have enabled a more objective and dynamic analysis of the upper airway in all phases of respiration,37,38 which may help to remove this limitation.
There are several limitations to the statistical modeling of the reported growth curves. Owing to the retrospective nature of this study, there were several data points with incomplete growth parameters, namely height and weight measurements. Height data was missing for 147 patients (90 males, 57 females) and weight was missing for 85 patients (52 males, 33 females). Rather than eliminate these data points and significantly restrict our patient cohort for analysis, we performed a multiple imputations analysis by replacing the missing data with the mean of observed values for that variable (ie, weight and height). Using additional growth variables in the form of standard 2D craniofacial measurements (BIZ, BIG, NAS, and POR) to ameliorate the effect of missing data, we performed a best subset variable selection to create the most representative model for airway volume growth over time. Nonetheless, given the uncertainty from the substitution of missing data using the imputation model based on the remaining variables in the data set, the model may become less accurate at the extremes of height and weight.
Conclusions
Normative airway volume growth charts present a novel and important clinical instrument for contextualizing the upper airway volume in patients presenting with symptoms of upper airway obstruction relative to the normal neonatal and pediatric patient population.
Footnotes
Author Note
This work was previously presented at the 78th Annual Meeting of the American Cleft Palate Craniofacial Association (ACPA) in Fort Worth, Texas, March 30, 2022; and poster presentation at the 2nd Annual University of Chicago Section of Plastic Surgery Research Symposium in Chicago, Illinois, May 27, 2022.
Declaration of Conflicting Interests
The author(s) declared no potential conflicts of interest with respect to the research, authorship, and/or publication of this article.
Funding
The author(s) disclosed receipt of the following financial support for the research, authorship, and/or publication of this article: This project was supported in part by an industry grant (DPS-TCMF-2020-057) from DePuy Synthes Products, Inc. (Raynham, MA).
Ethical Approval
This research was performed following careful review and approval by the University of Chicago Institutional Review Board (#IRB20- 0263) with strict adherence to the ethical standards set forth by the Declaration of Helsinki.