
Abstract
Environmental remote sensing (ERS) has been a cornerstone technology for decades, allowing for comprehensive monitoring and management of ecosystems. Recent advancements in artificial intelligence (AI), particularly machine learning (ML) and deep learning (DL), have transformed the field of ERS by offering robust, data-driven solutions for analyzing complex, large-scale remote sensing datasets and answering important scientific questions. This intervention explores the diverse applications of AI in ERS, focusing on key domains such as water, agriculture, urban, and wetland monitoring. This work also includes discussions on crucial aspects such as the impact of foundation models in ERS and outlines key points on the ethical and responsible use of AI in ERS. The intervention is concluded by identifying promising next steps for future research.
Keywords
Introduction
The deterioration of the Earth’s environment, driven largely by human activities, has reached unprecedented levels and poses significant challenges to sustainable development (Adger et al. 2024; Díaz et al. 2019; Fletcher et al. 2024). Issues such as resource depletion, deforestation, climate change, and pollution are no longer confined to specific regions but have become global concerns (Hirsch 2020; Nations 2021). For instance, cyanobacterial harmful algal blooms (CyanoHABs), once considered localized water quality issues, have now emerged as widespread ecological threats affecting freshwater and coastal systems across continents (Mishra et al. 2020). Eutrophication, exacerbated by nutrient runoff from agriculture and urbanization, has led to large-scale toxic blooms that endanger drinking water supplies, fisheries, and aquatic biodiversity from the Great Lakes in North America to Lake Victoria in Africa and even in remote Arctic lakes (Feng et al. 2024; Trainer et al. 2020). Similarly, deforestation in the Amazon rainforest not only accelerates regional biodiversity loss but also disrupts global carbon and hydrological cycles, contributing to climate instability worldwide (Lovejoy and Nobre 2018). The intensification of wildfires, such as the recent catastrophic wildfires in Los Angeles, CA, highlights how climate change-driven disasters are no longer isolated events (Marolla 2025). The rapid melting of polar ice due to climate change has similar far-reaching consequences, including rising sea levels that threaten coastal cities from Jakarta to Miami (Masson-Delmotte et al. 2021). Even air pollution, once considered a localized urban challenge, has now been shown to have transboundary effects, with pollutants such as fine particulate matter (PM2.5) traveling thousands of kilometers and affecting air quality and public health far from their sources (Wang et al. 2024). As the intensity and frequency of these environmental crises increase, monitoring and managing these changes has become a critical task.
Over the past 50 years, remote sensing technology has emerged as an indispensable tool for investigating Earth’s resources and monitoring environmental changes at local, regional, and global scales (Chuvieco 2020; Wulder et al. 2022). Its macro-level perspective, comprehensive coverage, and ability to provide dynamic and accurate observations make it invaluable for understanding and mitigating environmental challenges (Avtar et al. 2020; Manfreda et al. 2018; Pettorelli et al. 2014). Traditional remote sensing data processing relies heavily on physical models to derive environmental parameters from sensor observations (Nair, Mangla and Indu 2022). These models are effective in establishing relationships between observed data and environmental conditions. However, they come with significant limitations. The accuracy of physical models depends on prior knowledge of various model parameters, which often suffer from uncertainties due to the high complexity of multi-scalar environmental processes (Brynjarsdottir and OHagan 2014; Warmink et al. 2010). These uncertainties, combined with variations and heterogeneity across time and space, reduce the reliability of remote sensing outputs for environmental monitoring (Zakeri and Mariethoz 2021). As a result, there has been a growing interest in data-driven approaches, specifically artificial intelligence (AI)-based machine learning (ML) and deep learning (DL) techniques, to overcome these limitations and unlock new possibilities in environmental monitoring (Yuan et al. 2020).
The advent of “Big Earth Data” has revolutionized how we perceive, analyze, and interpret environmental changes (Li, Ma and Zhang 2021). Remote sensing data, collected through satellites, drones, and ground-based sensors, has increased exponentially in volume, variety, and velocity (Hong et al. 2024a). This abundance of data has coincided with rapid advancements in ML techniques, leading to the development of highly accurate, scalable, and efficient models for environmental remote sensing (ERS) (Yuan et al. 2020). DL has garnered particular attention due to its ability to approximate complex nonlinear relationships and extract hierarchical features from massive datasets (Ma et al. 2019). Unlike traditional approaches, DL models learn directly from data, capturing intricate associations between environmental parameters and remote sensing observations (Bengio 2013; LeCun, Bengio and Hinton 2015). This capability of AI that encompasses ML and DL has transformed the field of ERS, enabling significant improvements in image processing, classification, retrieval, and predictive modeling. Traditional image processing techniques have been complemented by AI-driven approaches, which have significantly improved tasks like multi-scale and multi-level feature extraction, representation learning, robust classification, and anomaly detection (Mai et al. 2023a; Yuan et al. 2020; Yuan, Shi and Gu 2021; Zhang and Zhang 2022). DL models, in particular, have demonstrated superior performance in handling large, heterogeneous datasets and deriving actionable insights. For instance, convolutional neural networks (CNNs) and vision transformers (Alexey 2020) are widely used for land cover mapping, while recurrent neural networks (RNNs) and video vision transformers (Arnab et al. 2021) are applied for time-series analysis in climate and hydrological studies. These models have not only improved accuracy but also introduced new capabilities, such as real-time monitoring and forecasting.
The success of AI in remote sensing spans diverse environmental applications, including water quality monitoring (O’Shea et al. 2021; Pahlevan et al. 2022), urban settlement monitoring (Li et al. 2023; Neupane, Horanont and Aryal 2021), wetlands monitoring (Campbell et al. 2022; Pei et al. 2022; Wei et al. 2017), and assessing forest health (Hamedianfar et al. 2022). This is particularly crucial in the context of global climate change, wherein timely and accurate data is essential for mitigation and adaptation efforts (Chen et al. 2023; Huntingford et al. 2019). AI in ERS continues to evolve, with significant opportunities for further innovation (Zhang and Zhang 2022). For instance, knowledge-guided ML,which combines physical models with ML and DL frameworks (Liu et al. 2024b; Mai et al. 2025; Sharma et al. 2024) has the potential to enhance interpretability and robustness, especially in the low-data regimes (Mai et al. 2023b; Wang et al. 2020), bridging the gap between traditional methods and modern AI techniques (Liu et al. 2022, 2024b).
This intervention aims to provide a comprehensive analysis of AI applications in ERS, through pilot research results incorporating different kinds of AI such as image classification, detection, and segmentation, time-series forecasting, and bio-optical modeling. We mainly focus on their transformative potential, current limitations, and future directions. These methods are applied in different environmental domains including water quality monitoring, urban environment monitoring, precision agriculture, and carbon flux monitoring. This paper also talks about the role of foundation models in ERS, both vision and language-based. Finally, some important considerations around the ethical and responsible use of AI in ERS are discussed.
Applications of AI in ERS
Sea surface salinity mapping
Sea surface salinity (SSS) is a critical parameter influencing ocean circulation, climate regulation, and the health of marine ecosystems (Boutin et al. 2021). Variations in SSS affect seawater density, thereby driving thermohaline circulation, which plays a pivotal role in distributing heat across the globe and regulating climate patterns (Rahmstorf 2006). Changes in salinity can also impact the Atlantic Meridional Overturning Circulation (AMOC), with potential consequences for global climate systems (Zhu et al. 2023). In estuarine and coastal regions, salinity dynamics are essential for maintaining biodiversity, as they influence the distribution and health of various aquatic species and habitats (Lorrain-Soligon et al. 2023; Smyth and Elliott 2016). Understanding these dynamics is particularly important in the context of climate change, sea-level rise, and extreme weather events, which can alter salinity patterns and, consequently, the structure and function of marine ecosystems (Slater et al. 2023; Wang et al. 2022).
Remote sensing technologies have advanced the monitoring of SSS, offering comprehensive spatial and temporal coverage that surpasses traditional in situ measurements (Chen and Hu 2017; Fu et al. 2021; Kim et al. 2023). Satellite missions such as the European Space Agency’s Soil Moisture and Ocean Salinity (SMOS) and NASA’s Soil Moisture Active Passive (SMAP) have been instrumental in providing global salinity data (Fournier et al. 2019). However, accurately retrieving SSS from satellite observations remains challenging due to atmospheric interference and the complex nature of coastal environments (Chen and Hu 2017). To address these challenges, researchers are increasingly integrating ML algorithms with remote sensing data to enhance SSS estimation. For instance, studies have employed random forest algorithms and other ML techniques to improve the accuracy of salinity predictions in various oceanic regions (Borovskaya et al. 2022; Kim et al. 2023).
Figure 1 presents pilot results as a part of this intervention for SSS estimation using satellite reflectance values, for Georgia’s coastal estuaries. Continuous ocean water encroachment in the estuaries creates a transition zone supporting unique biodiversity including marshes, reefs, and aquaculture. A dataset with 314 samples, comprising in situ SSS measurements (from GCE-LTER) and corresponding satellite reflectance values from Sentinel-2’s multispectral instrument (MSI), was curated. Random forest, a decision tree based ML regressor (Breiman 2001), trained on this dataset achieved an Root Mean Squared Error (RMSE) of 4.68 practical salinity units (psu) for SSS estimation from MSI spectral image input. Figure 1 shows the resulting SSS map, highlighting the model’s ability to capture salinity gradients, particularly in the estuarine regions. This highlights the potential of ERS and AI in monitoring salinity dynamics over larger spatial and temporal scales. Recent studies are focusing on using similar advanced approaches to broaden the understanding of salinity patterns linked with environmental factors such as sea level rise or climate change (Kesavakumar, Shanmugam and Venkatesan 2022; Kim et al. 2023; Nguyen et al. 2021; Nieves, Radin and Camps-Valls 2021). Ultimately, such advancements can support maritime conservation and management, ensuring resilience against future environmental stressors.
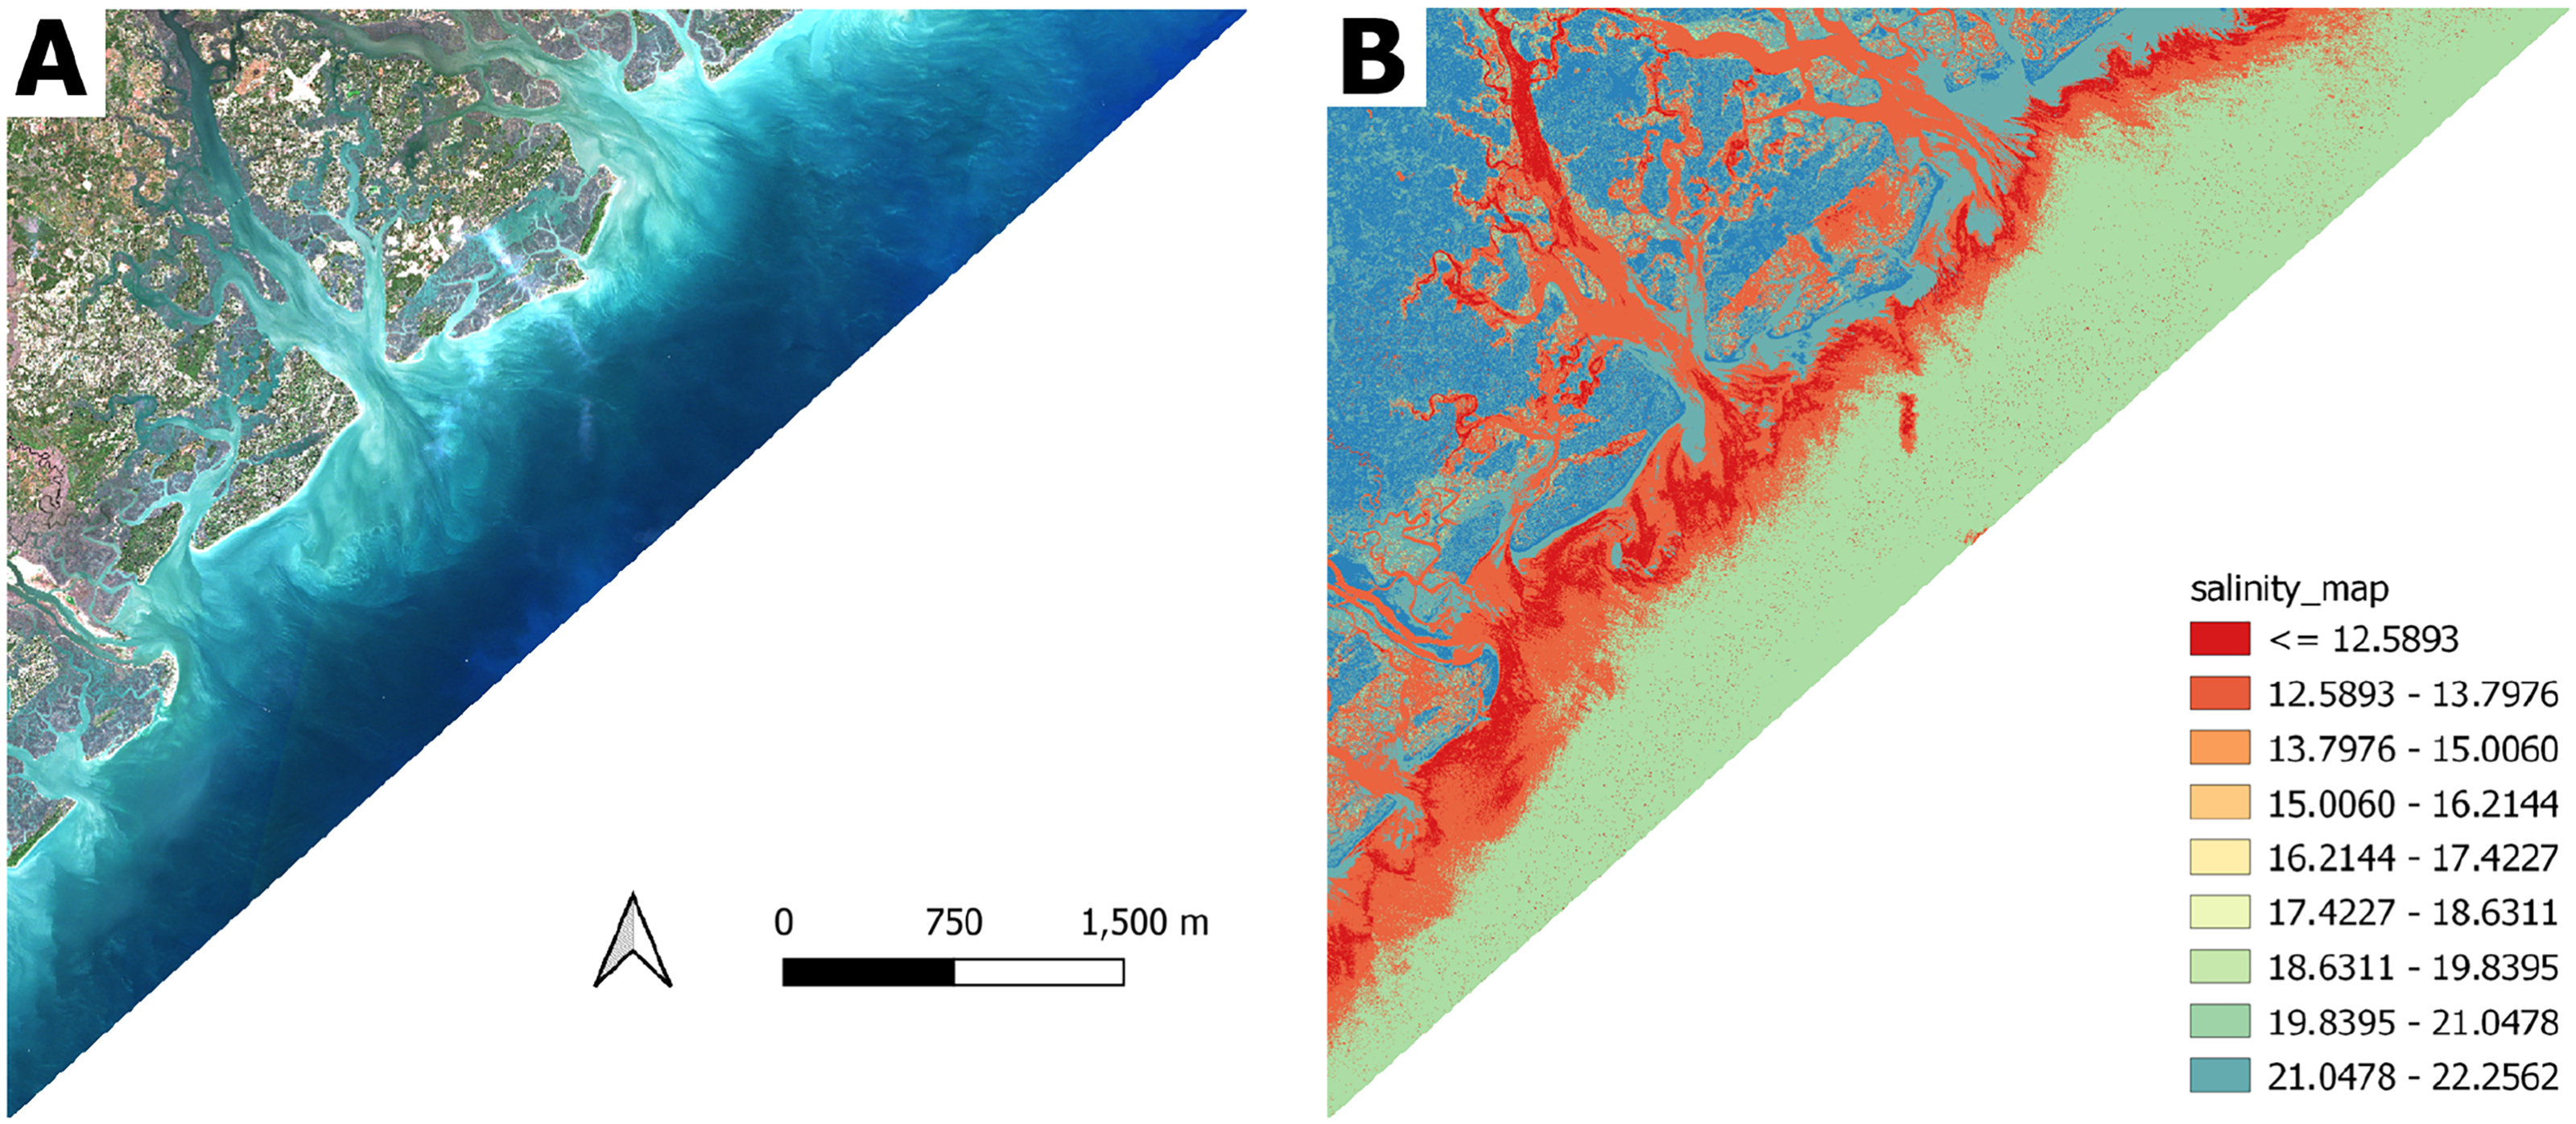
(A) Sentinel-2 MSI true color image of the Georgian coastal estuaries. (B) Sea surface salinity map generated by the random forest using the same image.
CyanoHAB trend forecasting
CyanoHABs are a growing global problem due to their increasing frequency, severity, and adverse effects on ecosystems, public health, and economies (Feng et al. 2024; Huisman et al. 2018; Paerl and Otten 2013; Steffen et al. 2014). Many cyanobacteria produce potent toxins, such as microcystins, anatoxins, saxitoxins, and cylindrospermopsins, which can contaminate drinking water sources and recreational water bodies, leading to severe health risks for humans and animals (Carmichael 2001; Zhang et al. 2022b). Remote sensing has emerged as a powerful tool for tracking and assessing CyanoHABs due to its ability to provide high-frequency, synoptic observations of large water bodies using multispectral and hyperspectral satellite sensors (Dev et al. 2022; Wynne et al. 2021), as well as airborne hyperspectral imaging and drone-based surveys (Wu et al. 2019).
The integration of AI with remote sensing has significantly improved CyanoHAB monitoring infrastructure (Gaur, Pant and Jalal 2023; Marrone et al. 2023). ML and DL algorithms, trained on multi-source satellite imagery and in situ data, perform better than empirical and semi-empirical models, even in optically complex water systems (Feng et al. 2024; O’Shea et al. 2021). Despite the availability of robust monitoring tools, real-time forecasting remains a crucial next step. Recent studies show that the ability to predict bloom formation in advance is essential for mitigating risks and implementing timely interventions (Almuhtaram et al. 2021; Schaeffer et al. 2024; Zahir et al. 2024).
Figure 2 shows an example of forecasting Cyanobacterial Cell Density (CCD) trend, as part of this intervention study, for Lake Okeechobee in Florida—a lake persistently vulnerable to CyanoHABs (Jiang et al. 2025; Mazzei, Sullivan and Loftin 2025; Rosen et al. 2017). A monthly aggregated CCD trend for Lake Okeechobee from October 2016 to April 2021 was extracted using the Google Earth Engine (GEE) based CyanoKhoj dashboard (Maniyar, Kumar and Mishra 2022). Long short term memory (LSTM) networks are typically used to learn seasonal trends (Hochreiter and Schmidhuber 1997). An LSTM network was trained on 24 months of trend (October 2016- October 2018) with a 2-month window size to learn the CCD variations primarily driven by nutrient levels. The model then forecasted the next 14 months of CCD trend, with a RMSE of 19,362.25 cells/
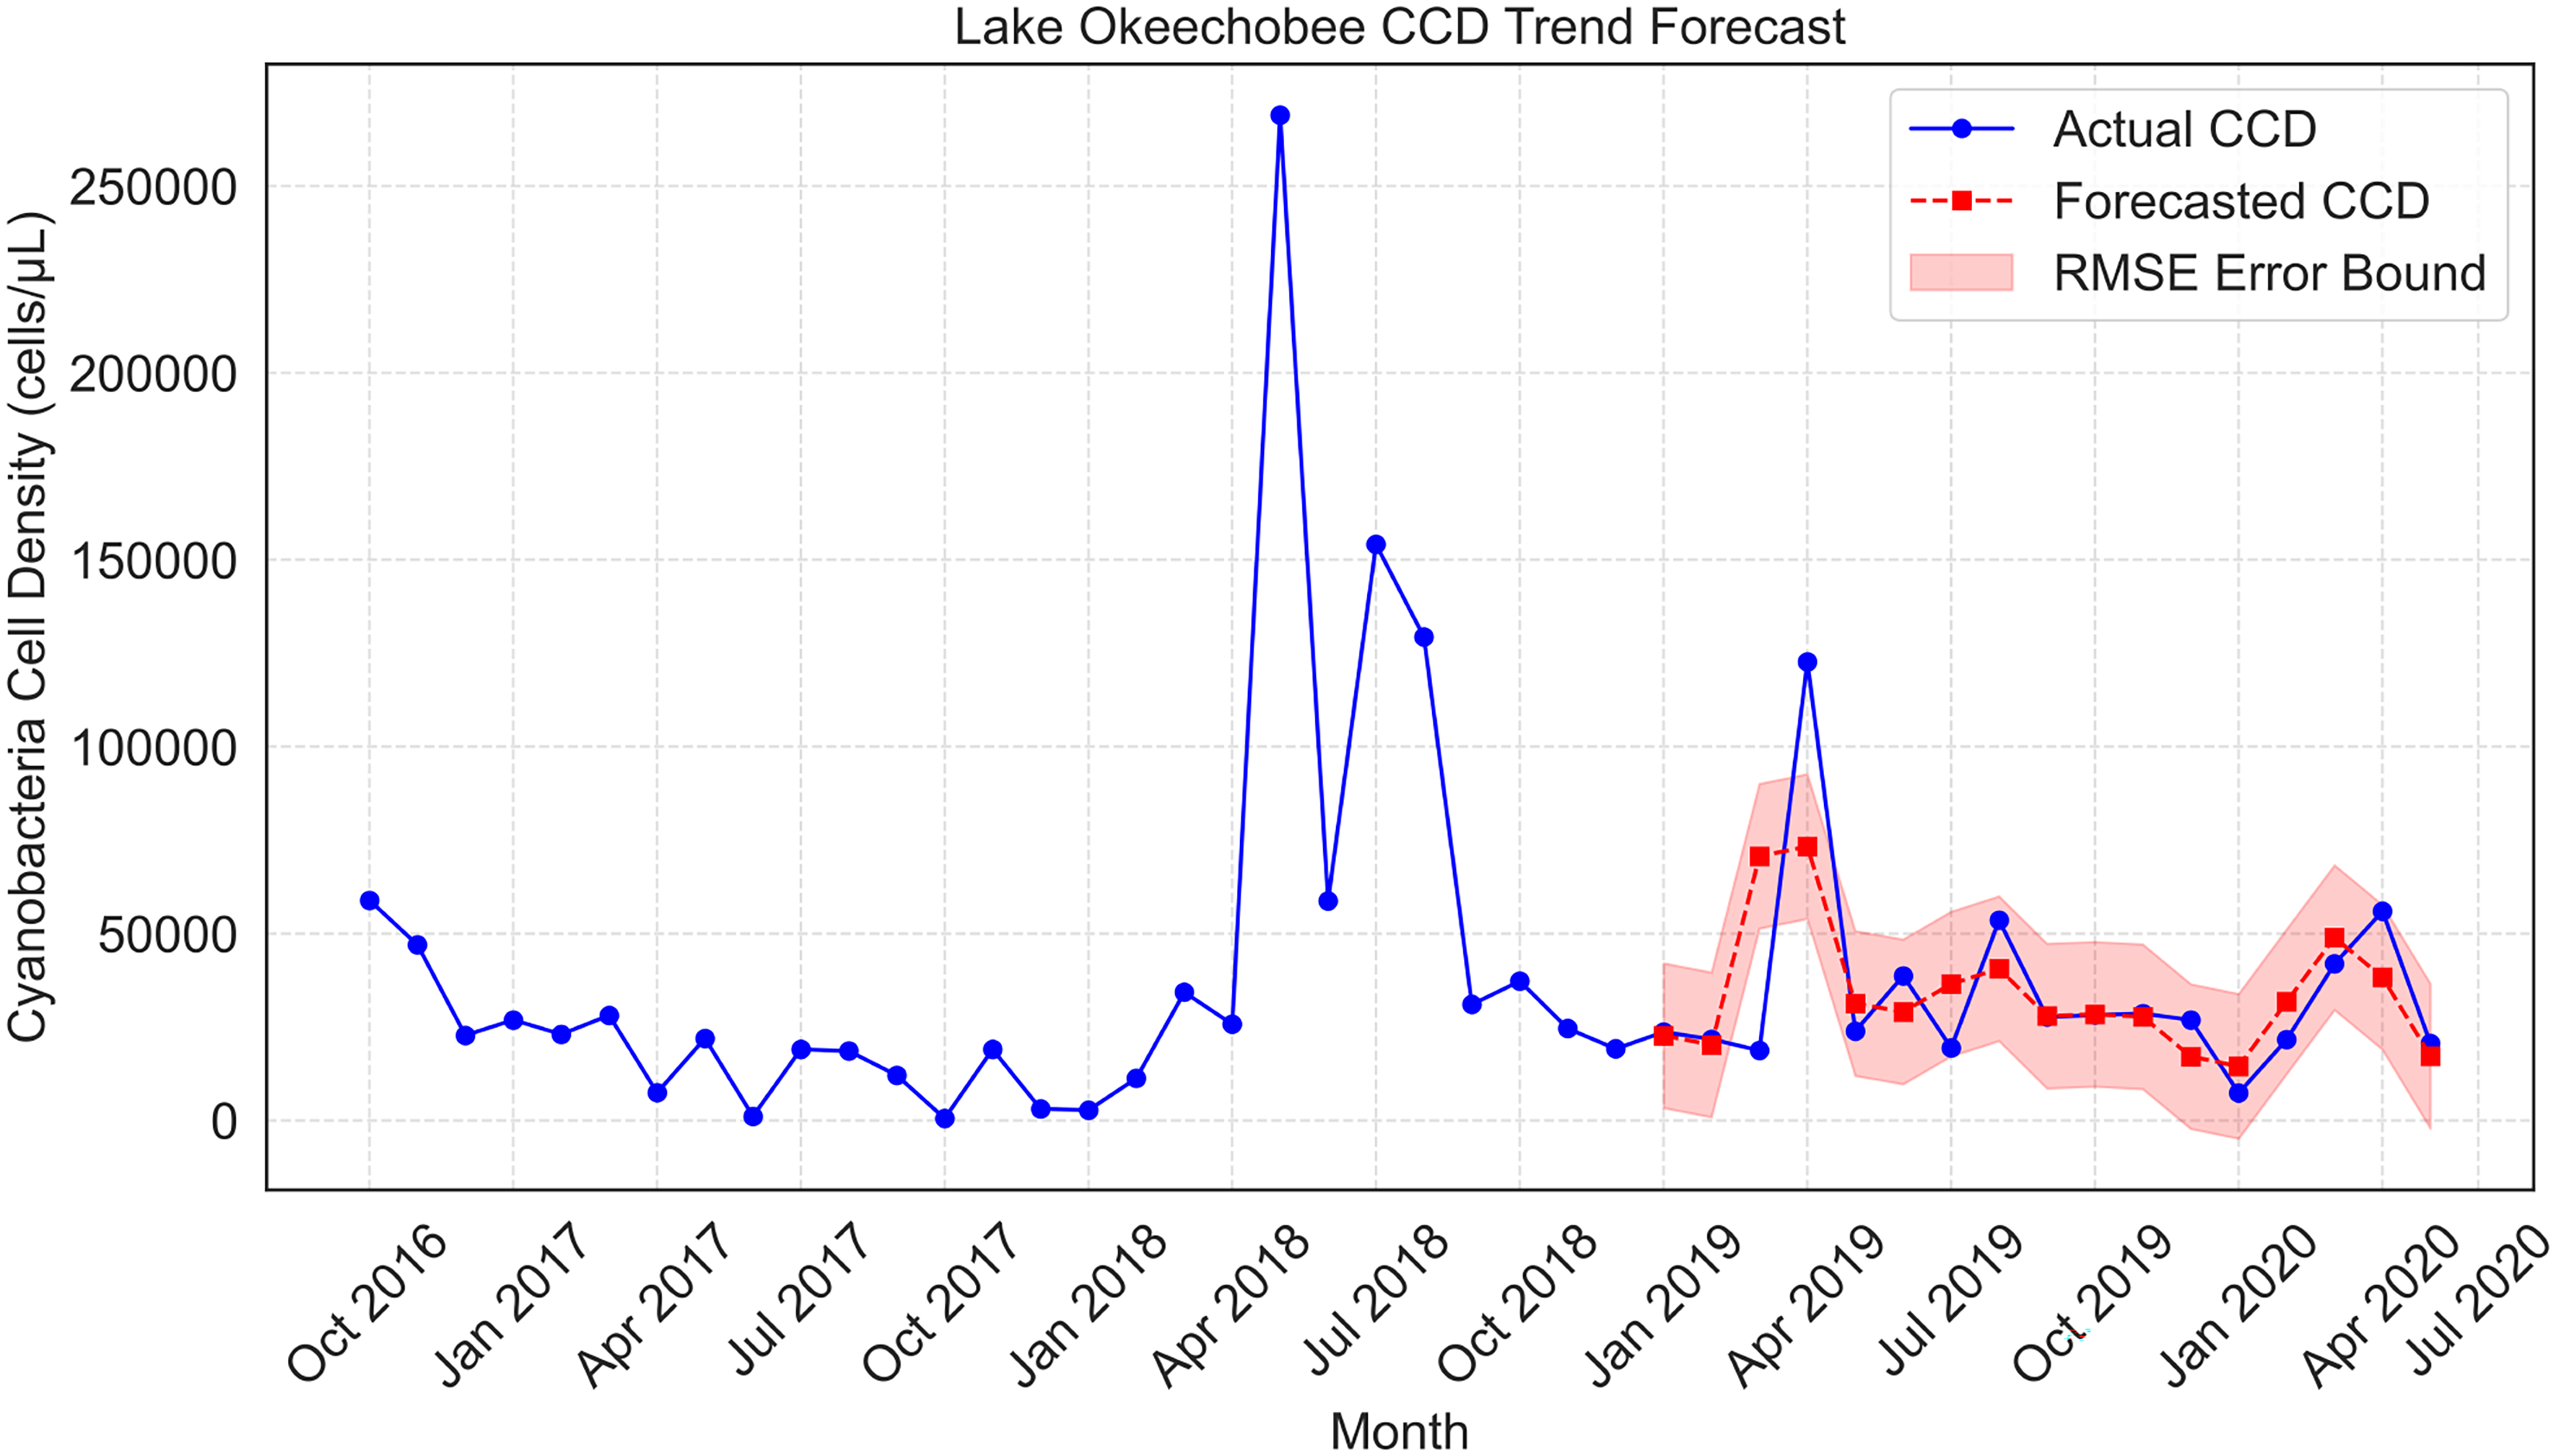
Evaluation of LSTM-based cyanobacterial cell density trend forecasting: The blue-only trend shows training data (Oct 2016–Dec 2018). The red trend shows the forecast, validated against the blue trend in the background (Jan 2019–Apr 2020).
Turf weed management
Weeds pose a significant challenge to turfgrass management by competing with desirable vegetation for essential resources such as nutrients, water, sunlight, and space (Harker and O’Donovan 2013; McCarty and Murphy 1994). Their presence diminishes the esthetic appeal and functional integrity of turf, impacting recreational spaces, sports fields, and urban landscapes. Conventional weed control strategies rely on broad-spectrum herbicide applications, which, while effective, contribute to environmental contamination, non-target species damage, and escalating economic costs (Monteiro and Santos 2022). The non-uniform distribution of weeds further complicates management, necessitating selective herbicide placement to ensure efficacy while minimizing waste. Manual spot spraying, a common alternative to broadcast herbicide application, is time-consuming and labor-intensive, prompting a need for automated solutions (Partel, Kakarla and Ampatzidis 2019). Integrating AI with precision herbicide application presents an opportunity to reduce pesticide use, enhance weed detection accuracy, and improve the sustainability of turf management (Jin et al. 2022; Partel, Kakarla and Ampatzidis 2019; Vasileiou et al. 2024).
Advancements in remote sensing and AI-driven object detection have enabled automated and precise weed identification, fostering more sustainable agricultural and turfgrass management. Previous research has explored vegetation classification using spectral reflectance properties (Feyaerts and Van Gool 2001) and early AI-based systems such as WEEDER, which applied rule-based learning for species differentiation (Fermanian and Michalski 1989). With the emergence of DL, researchers have leveraged convolutional neural networks (CNNs) for plant species classification, weed detection, and yield prediction (Grinblat et al. 2016; Jin et al. 2022; Mohanty, Hughes and Salathé 2016). In turfgrass-specific applications, CNN-based image classification and identification architectures such as AlexNet (Krizhevsky, Sutskever and Hinton 2012), GoogLeNet (Szegedy et al. 2015), and VGGNet (Simonyan and Zisserman 2014) have been employed to distinguish broadleaf weeds from turfgrass (Prabhu, Niranjan and Rai 2024; Yu et al. 2020, 2019). Despite promising classification accuracy, automating real-time spot spraying remains challenging due to variations in lighting, weather, and weed morphology (Rakhmatulin, Kamilaris and Andreasen 2021).
As a part of this intervention study, Figure 3 shows pilot results, from an experiment aimed at addressing current gaps in automated weed detection and spot spraying. A two-step architecture consisting of image classification using ResNet-50 to identify the weed species, followed by object detection using YOLOv8 to locate the weed was developed for automated spot-spraying. A proximal dataset of over 6,000 RGB images was curated, capturing three broadleaf weed species under diverse environmental conditions. Evaluation showed strong performance for both ResNet-50 with an F1 score of 0.96 and YOLOv8 with a mean average precision of 0.92. Figure 3(B–G) shows select weed image classification and detection results. While some uncertainty persists among different weed species (Figure 3(A)), a total inference time of 6.75 ms makes this architecture suitable for deployment in ground-based robotic sprayer systems to automate selective herbicide application, reducing reliance on manual labor while mitigating pesticide overuse. By integrating AI-driven weed detection with precision spraying technologies, this research advances sustainable turf management, aligning with broader environmental conservation efforts (Ramesh et al. 2017). The adoption of real-time “see-and-spray” technologies holds significant implications for precision agriculture, enabling farmers and turf managers to optimize weed control while minimizing ecological impact (Allmendinger et al. 2022; Gerhards et al. 2022; Liu and Bruch 2020; Westwood et al. 2018).
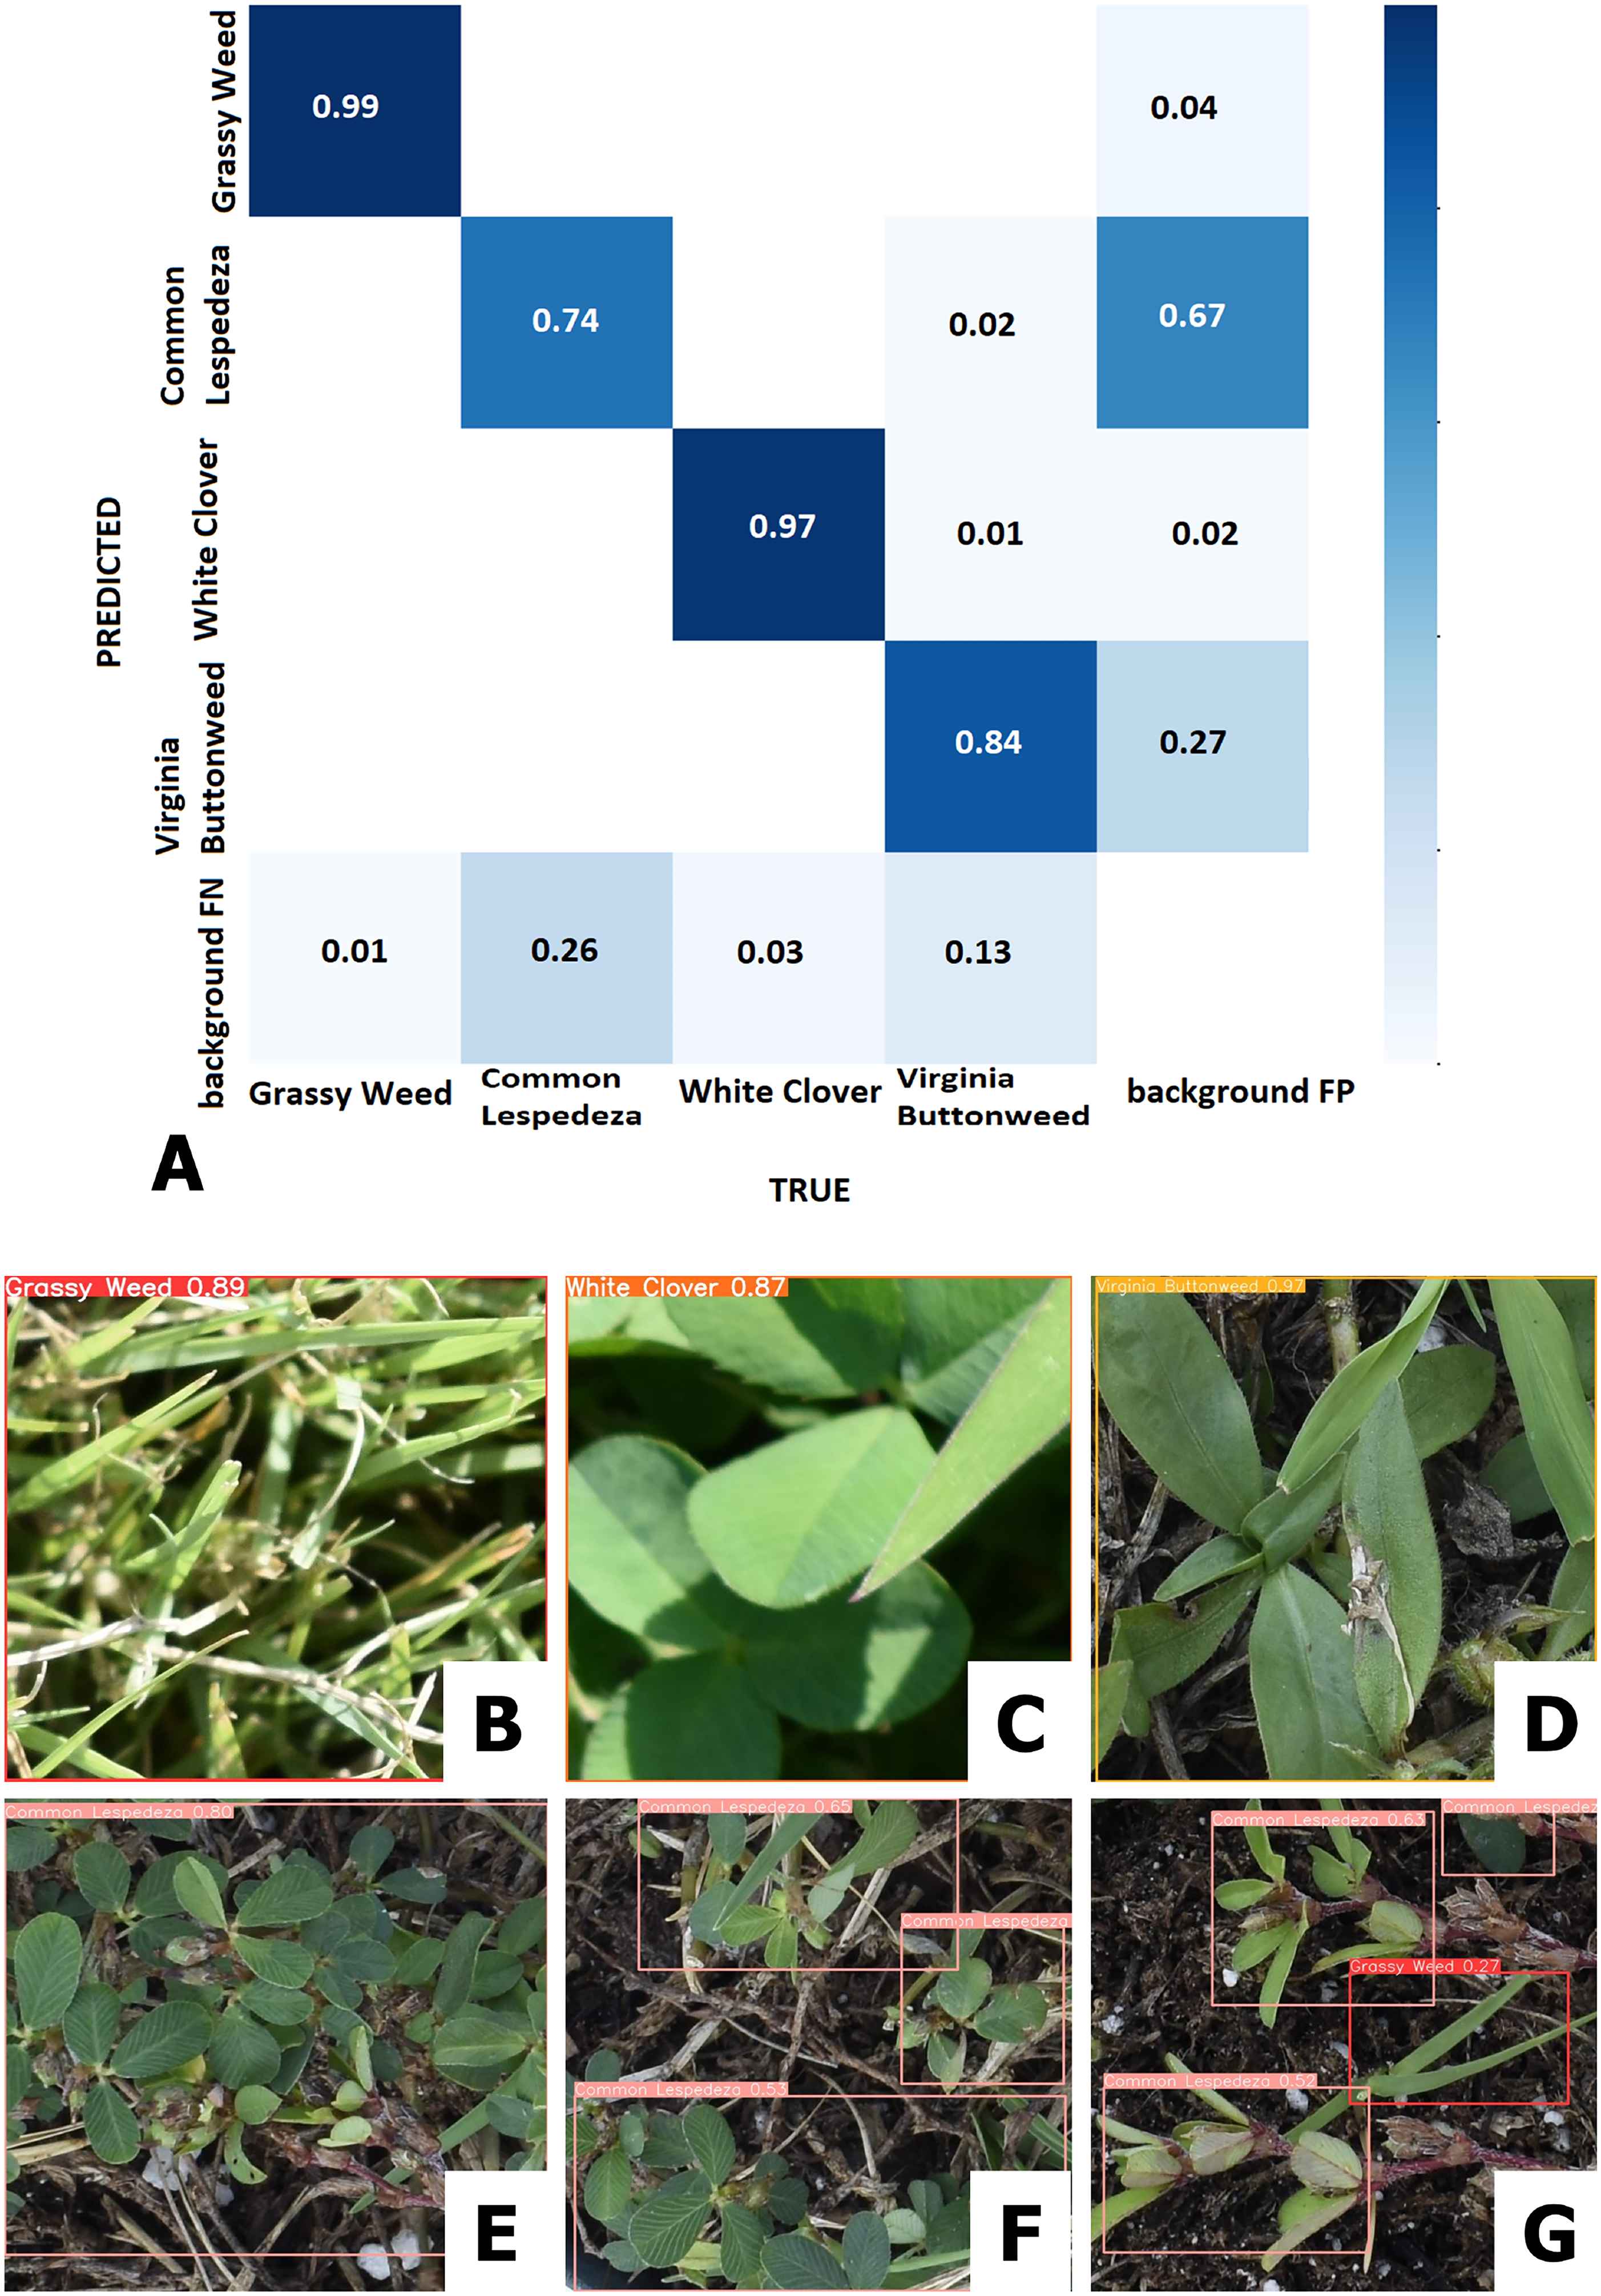
(A) Confusion matrix for resNet50-based image classification on turf pictures into different classes of weed species. (B) through (G) show YOLO8-based object detection results for different weed species against a turf background; with (B) as grassy weed, (C) as white clover, (D) as virginia buttonweed, (E) and (F) as common lespedeza, and (G) showing simultaneous detection of multiple weed species.
Urban environment mapping
Accurate mapping of urban environments using remote sensing techniques is crucial for various applications, including urban planning, climate change analysis, and disaster response (Al Shafian and Hu 2024; Li et al. 2024a; Yin et al. 2021). This section discusses two important aspects of urban monitoring: building segmentation, which involves extracting building footprints from remotely sensed imagery; and building height estimation, which determines the vertical dimension of structures. Both contribute significantly to environmental monitoring by providing insights into urban density, land-use changes, and disaster vulnerability (Gupta and Shah 2021; Li et al. 2020b; Liu et al. 2020). Recent advancements in ML and computer vision have led to the development of high-resolution remote sensing (HRS) techniques that enable precise urban mapping (Yuan, Shi and Gu 2021). Traditional methods, which relied on manual interpretation or rule-based approaches, are increasingly being replaced by DL architectures, which improve efficiency and accuracy (Maniyar and Kumar 2021). These advancements help address challenges such as occlusion, spectral similarity, and shadow-induced errors, thereby refining the accuracy of building footprints and height estimates (Cai et al. 2024; Cao and Weng 2024; Wu et al. 2023). The integration of optical, light detection and ranging (LiDAR), and synthetic aperture radar (SAR) data further enhances urban mapping by leveraging multi-source data fusion techniques to overcome individual sensor limitations (Brunner et al. 2010; Raju, Chaudhary and Jha 2014; Shao, Taff and Walsh 2011; Xu et al. 2015; Yan 2024).
Building segmentation has seen remarkable improvements with the advent of DL models such as U-Net and ResNet, which accurately extract structural details from remotely sensed images by learning to discriminate between foreground and background (Diakogiannis et al. 2020; Ronneberger, Fischer and Brox 2015). Figure 4 presents pilot results for building segmentation from satellite imagery, using a multiscale hybrid Res-U-Net based architecture, trained on aerial and satellite images with spatial resolutions varying from 0.2 m to 4 m (Maniyar and Kumar 2021; Maniyar, Kumar and Mai 2025). The Res-U-Net model was applied to a high spatial resolution (1.24 m) Worldview-3 imagery of Chandigarh, India—a city characterized by dense and complex urban patterns. The model achieved an overall accuracy of 86.5%, an intersection over union (IoU) score of 0.78, and an F1-score of 0.80, showing robust performance in complex urban settings with spectral ambiguities. However, challenges persist, particularly in delineating buildings with irregular shapes and extracting structures under shadows (Li et al. 2024a). Despite these limitations, AI-driven building segmentation plays a critical role in broader environmental monitoring applications, such as disaster management and post-disaster damage assessment (Alisjahbana et al. 2024; Gupta and Shah 2021). Rapid and precise segmentation of urban structures allows for immediate evaluation of affected areas after natural disasters like earthquakes and floods, aiding in emergency response efforts (Al Shafian and Hu 2024). Looking ahead, advancements in self-supervised learning (Cong et al. 2022; Noman et al. 2024), multimodal data fusion (Fuller, Millard and Green 2024; Li et al. 2025), and spatial representation learning (Hu et al. 2023b; Liu et al. 2023b; Mai et al. 2023a, 2024b; Wu et al. 2024) hold promise to further improve building segmentation, enabling more accurate and real-time urban analysis (Gui et al. 2024; Li et al. 2024a).
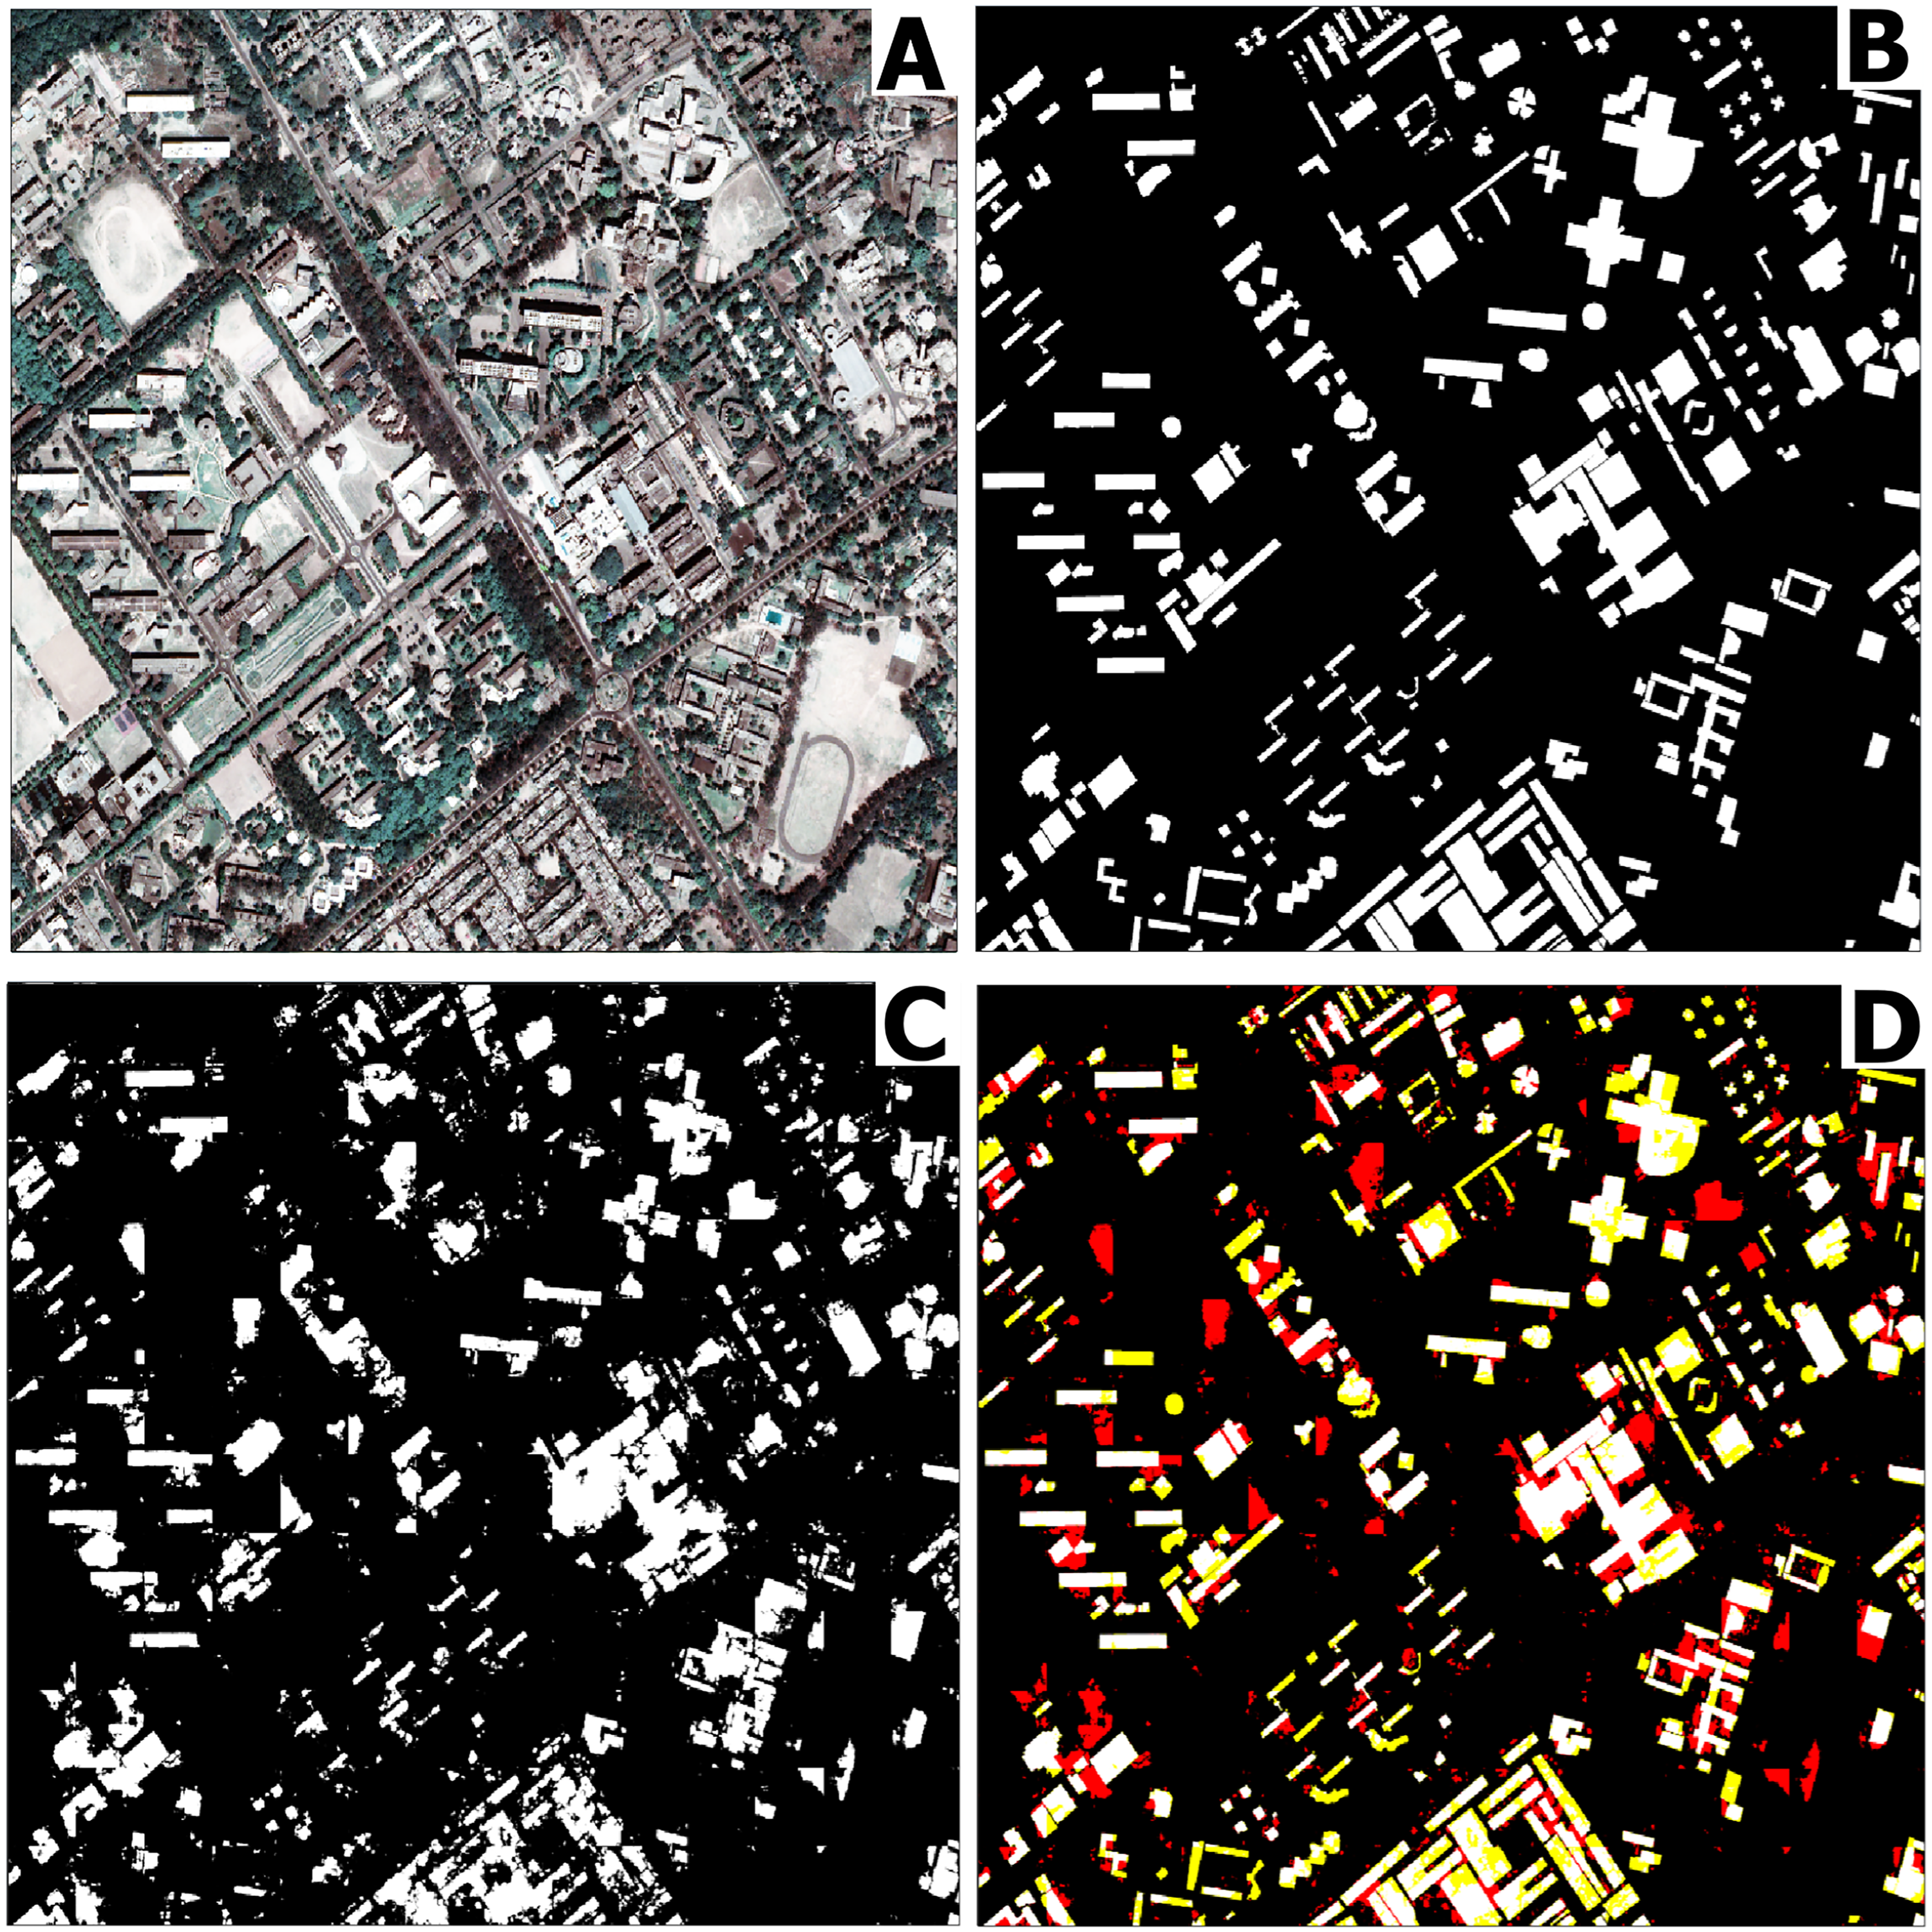
Multiscale hybrid res-U-net building segmentation results. (A) is the true color Cartosat 2F image. (B) is the binary label mask (ground truth) for building footprint. (C) are the building footprints predicted by the model. (D) is model evaluations with true positives in white, true negatives in black, false positives in red, and false negatives in yellow. Figure reproduced and modified with permission from Maniyar, Kumar and Mai (2025).
Similarly, building height estimation has progressed significantly with the integration of SAR, optical imagery, and ML algorithms. Techniques such as Random Forest and Support Vector Machine regression models are commonly used for large-scale estimation, while DL models like convolutional neural networks (CNNs) are better suited for smaller areas (Frantz et al. 2021; Li et al. 2020a; Mahendra and Seto 2019; Wu et al. 2023). The fusion of SAR backscatter, LiDAR, and optical data has proven effective in refining height estimation, addressing issues like double-bounce scattering and terrain-induced distortions (Franceschetti, Iodice and Riccio 2002; Frolking et al. 2013; Li et al. 2020b; Mahendra and Seto 2019). Figure 5 shows pilot results of building height estimation with 10 m spatial resolution based on ensembled multimodel and colocated multi-temporal data from Sentinel-2 (optical) and Sentinel-1 (radar) by establishing a set of spatial–spectral–temporal feature databases, with an
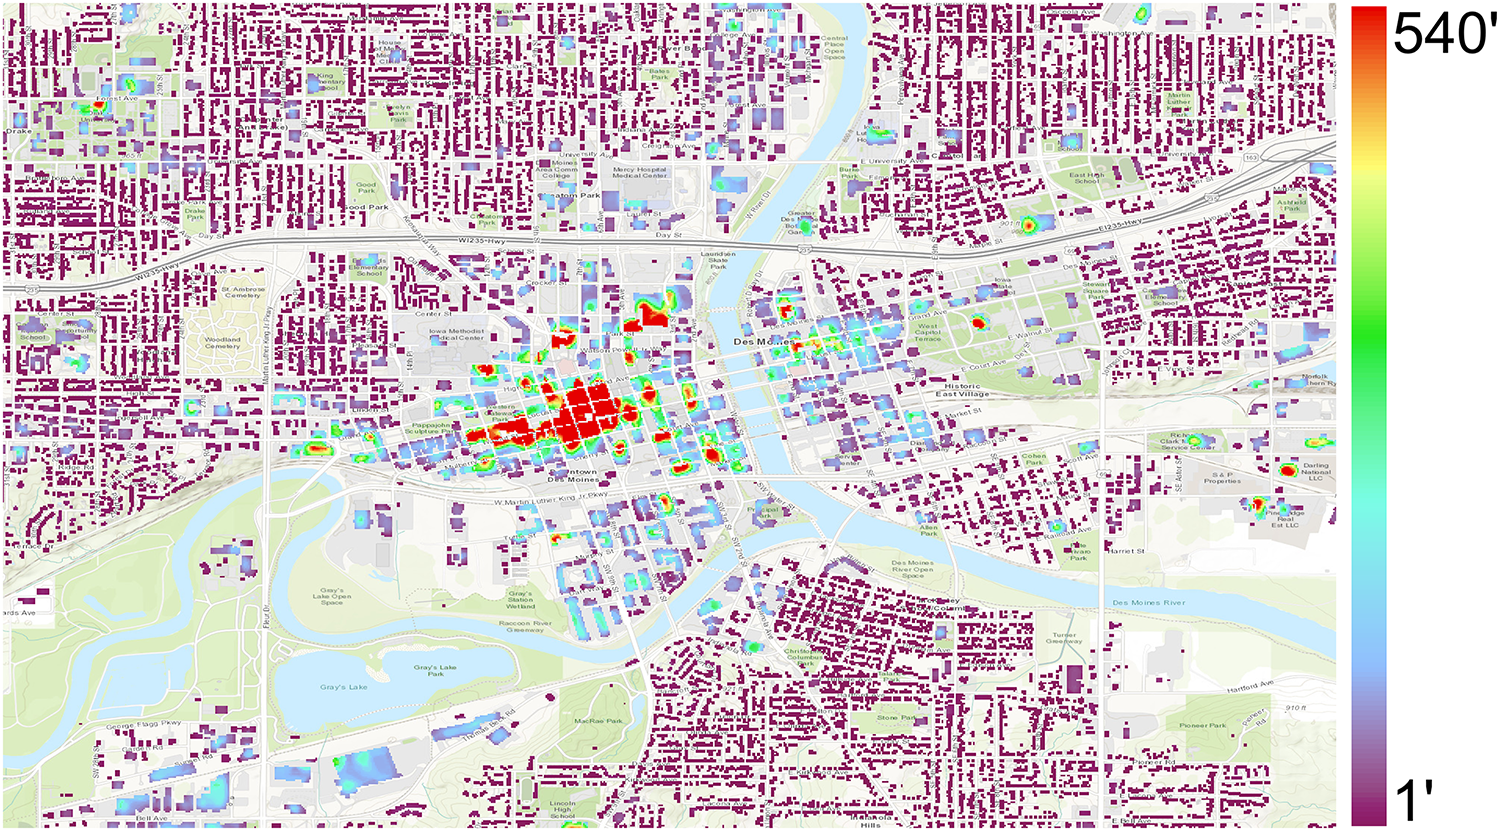
Heatmap of building heights (in feet) as predicted by the random forest model, overlayed onto the open street map of Des Moines, Iowa, USA. Figure reproduced and modified with permission from Yan (2024).
Carbon flux monitoring
The global carbon cycle is primarily driven by vegetation gross primary productivity (GPP), which represents the total carbon fixed through photosynthesis (Anav et al. 2015; Grace 2004). GPP is commonly estimated using the light use efficiency (LUE) model, where
Traditional empirical models, while widely applied, rely on static parameterizations and simplified assumptions, often failing to account for the nonlinear and dynamic nature of LUE responses to environmental fluctuations (Bloomfield et al. 2023). In contrast, AI-based models, such as random forest, offer improved predictive capabilities by learning complex interactions from large datasets (Jafarzadeh et al. 2022). The Random Forest model used in this intervention was trained using flux tower data from the Georgia Coastal Ecosystems LTER Flux Tower (US-GCE), available via AmeriFlux (Robinson et al. 2010). Figure 6 presents the validation fit for LUE predictions at the US-GCE site, where the random forest model, trained on daily data of 7 years, achieved an
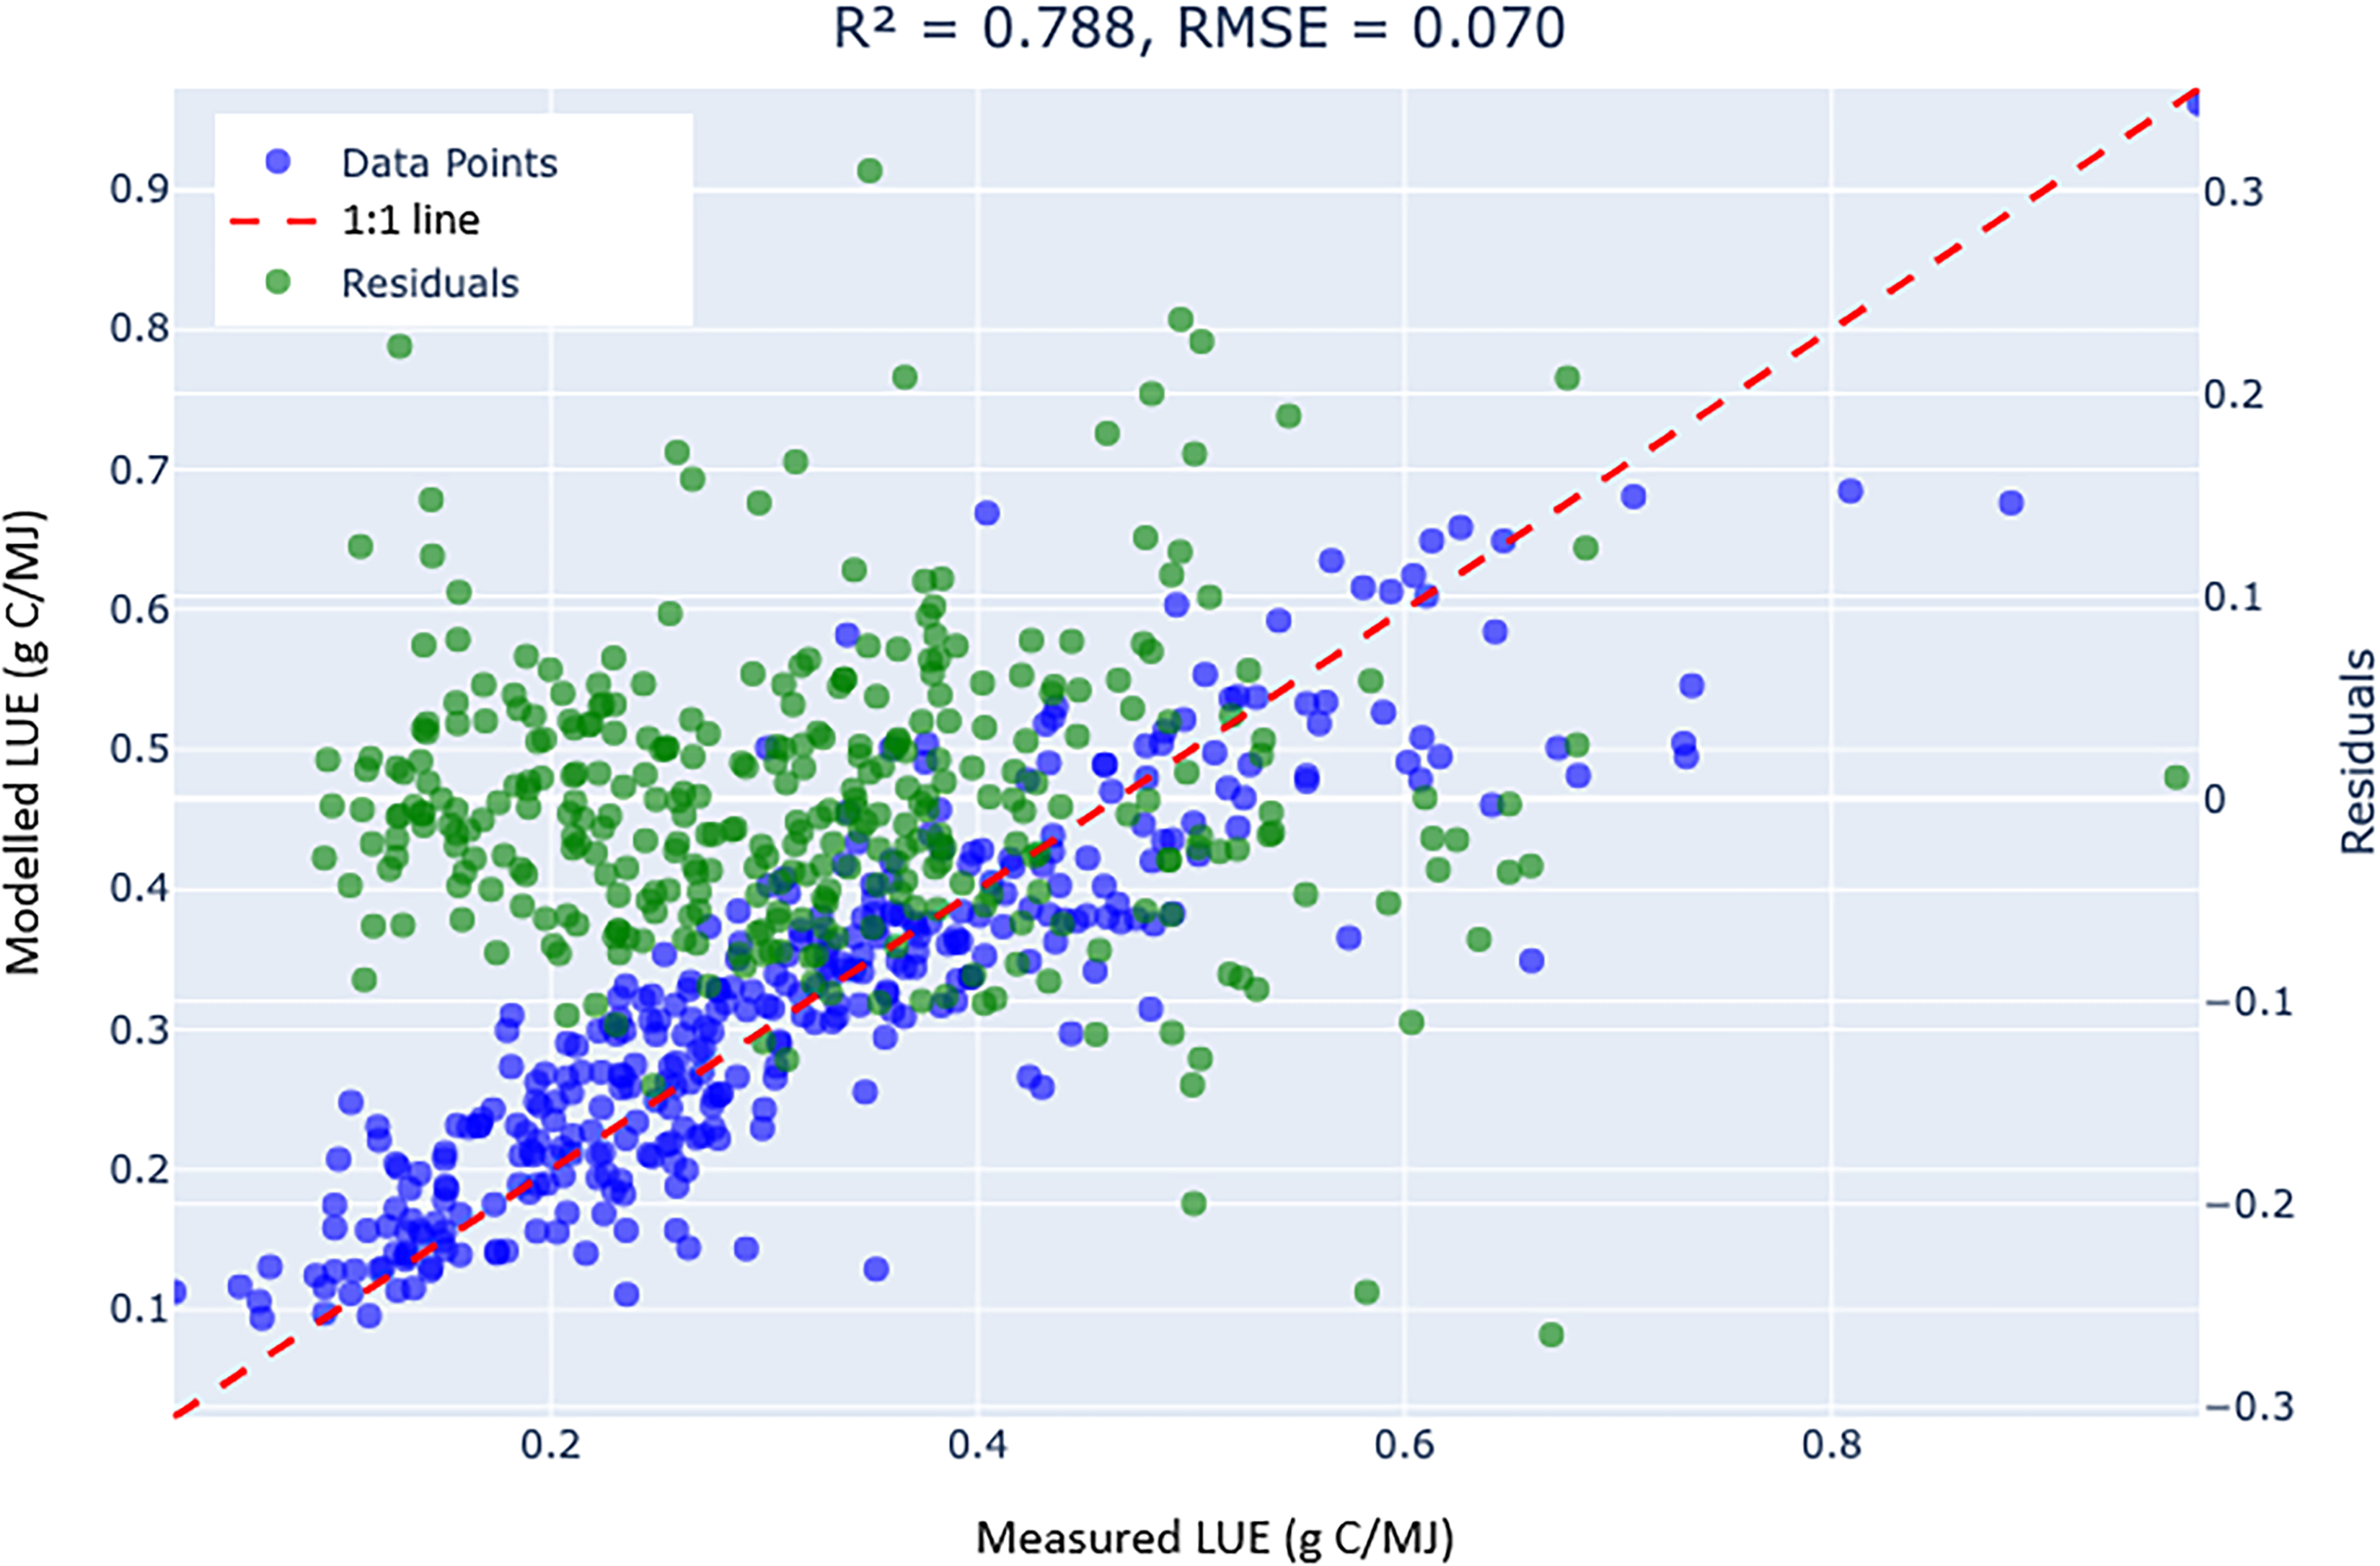
Validation fit for random forest based LUE estimation at US-GCE flux tower site. The red dashed line is the 1:1 line, blue dots are validation scatterplot, green dots are corresponding residual values.
Foundation models in ERS
Foundation models refer to large-scale AI models pre-trained on internet-scale datasets in a task-agnostic manner which can be later adapted to various downstream tasks (Bommasani et al. 2021). Examples include language foundation models viz ChatGPT, LLAMA (Touvron et al. 2023), OPT (Zhang et al. 2022a), and Deepseek R1 (Guo et al. 2025), vision foundation models viz SAM (Kirillov et al. 2023) and DINO (Caron et al. 2021), and multimodal foundation models viz CLIP, GPT-4V (Achiam et al. 2023), LLAVA (Liu et al. 2023a), and O1. The paradigm of foundation models has transformed the research practices of many domains including geography and geoscience (Mai 2024; Mai et al. 2024a; Xie et al. 2023).
Foundation models that integrate vision and language modalities are transforming ERS by enabling more comprehensive and nuanced data analysis (Huo et al. 2025). Traditionally, remote sensing has relied on task-specific ML models tailored for specialized objectives like land cover classification or vegetation health assessment (Ma et al. 2019). In contrast, vision-language foundation models, pre-trained on extensive datasets in a task-agnostic manner, offer a generalized understanding of visual and textual relationships, enhancing adaptability for various remote sensing applications (Mai et al. 2024a; Mall et al. 2023; Manvi et al. 2024). For instance, vision-language models can process both image and text data to provide contextual awareness, allowing AI systems not only to classify images but also to generate natural language explanations of their observations (Lu et al. 2024; Mall et al. 2023). This capability is crucial in environmental monitoring, where interpretability is as important as accuracy. Recent advancements have demonstrated that such models can be adapted for remote sensing tasks using zero-shot learning (Li et al. 2024b; Wu and Osco 2023; Zhang et al. 2024), few-shot learning (Hu et al. 2023a; Mai et al. 2024a; Osco et al. 2023), or fine-tuning (Ferreira et al. 2025; Liu et al. 2024a), which bypass the need for extensive labeled datasets.
Other than simply adopting the general-purpose foundation models to remote sensing applications, massive efforts have also been devoted to developing remote sensing foundation models (RSFMs) such as Segment Any Change (Zheng et al. 2024), SatCLIP (Klemmer et al. 2023), ClimaX (Nguyen et al. 2023), SatMAE (Cong et al. 2022), SatMAE++ (Noman et al. 2024), CROMA (Fuller, Millard and Green 2024), SpectralGPT (Hong et al. 2024b), SkySense (Guo et al. 2024), GeoChat+ (Kuckreja et al. 2024) etc. These RSFMs show promising model performance and generalizability across diverse remote sensing tasks, showing their potential on many RS tasks which usually suffer from low performance due to low labeled data availability (Chang et al. 2024; Shoaib, Emara and Zhao 2023).
AI tools and resources for ERS
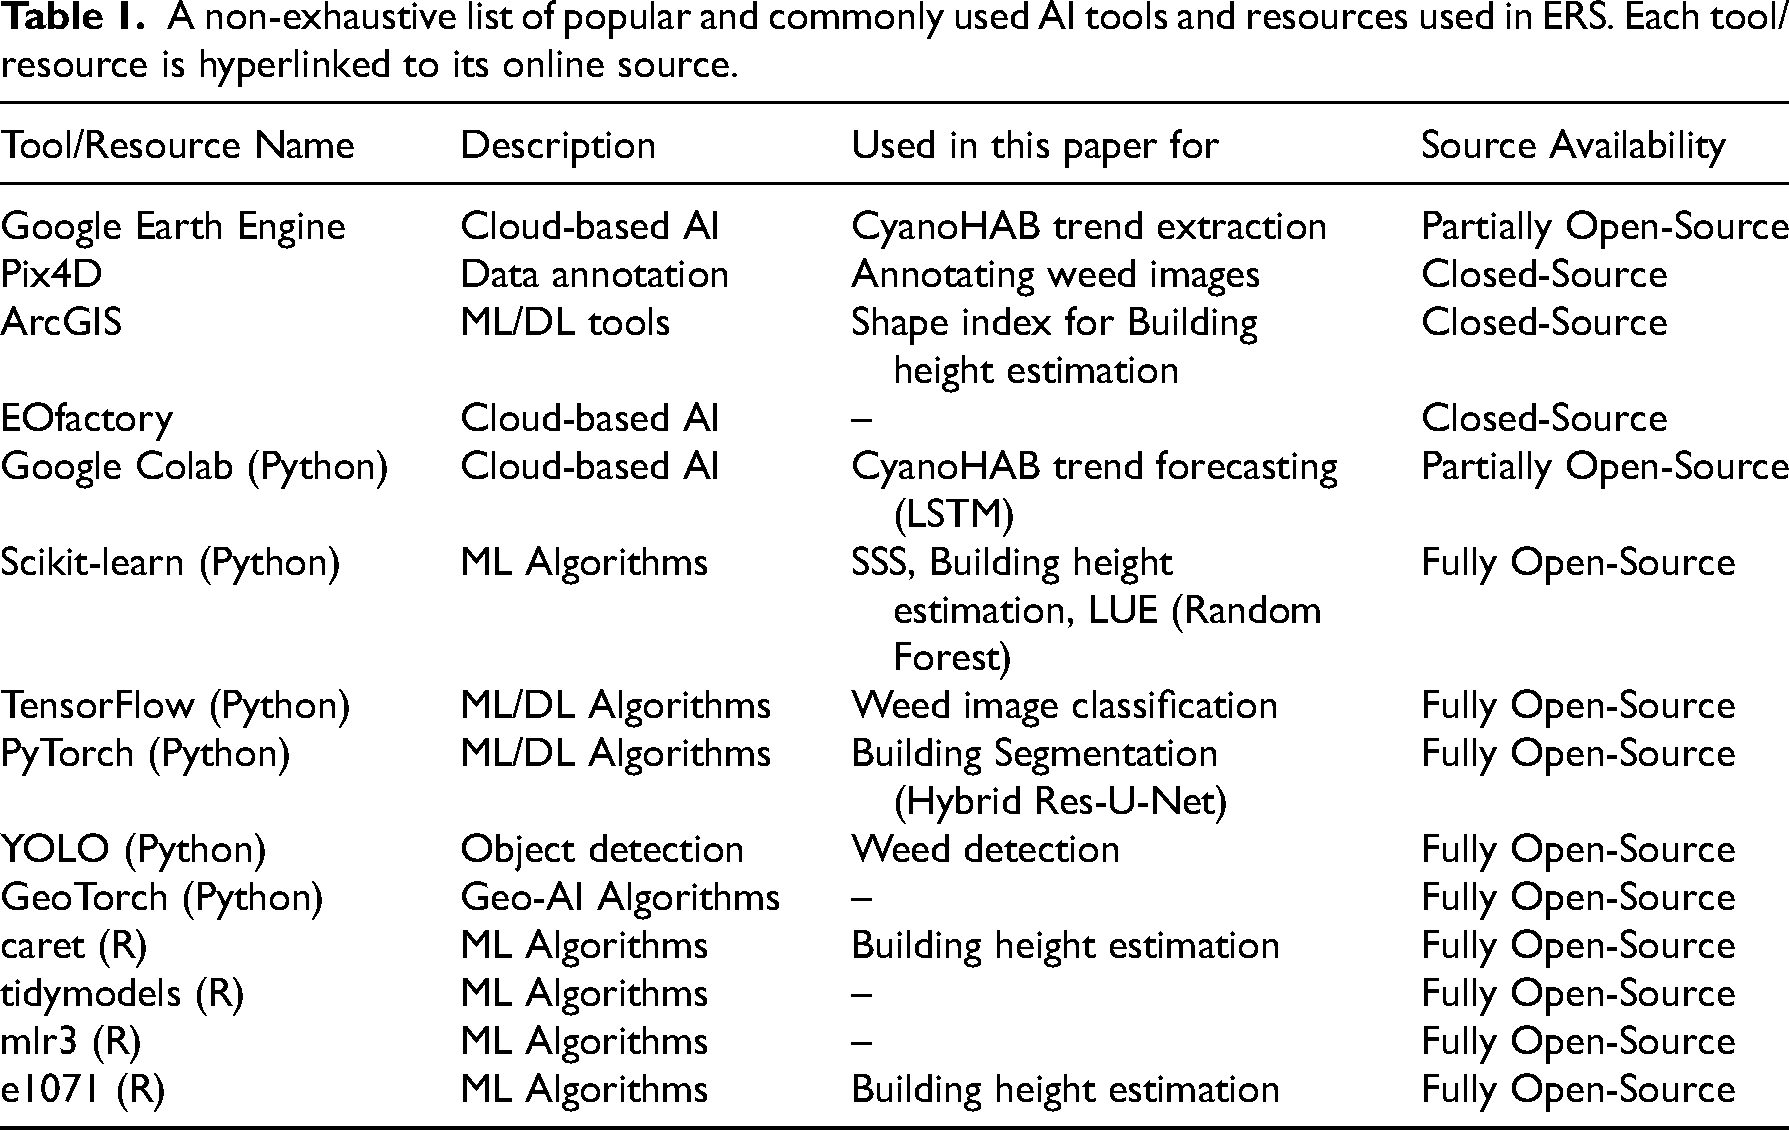
The integration of AI into ERS has been significantly enhanced by the evolution of R and Python packages, which now increasingly offer robust geospatial components. This development has democratized access to sophisticated geospatial analysis, enabling researchers from various disciplines to apply AI techniques without requiring extensive programming expertise. Moreover, the emergence of domain-specific AI tools has further facilitated the application of ML and DL in environmental studies, making these technologies more accessible to non-AI specialists. Table 1 lists some of the most popular tools and resources commonly used for AI-based analysis in ERS, identifying the ones used in this paper.
A non-exhaustive list of popular and commonly used AI tools and resources used in ERS. Each tool/resource is hyperlinked to its online source.
Key considerations
AI in ERS offers unprecedented capabilities for understanding, monitoring and managing Earth’s ecosystems. However, this advancement brings forth significant ethical concerns and technological limitations that necessitate careful consideration from the ERS community.
Ethical concerns in AI-driven ERS
One pressing issue is the potential generation of synthetic or manipulated satellite imagery, often referred to as deepfake geography (Zhao et al. 2021). While ancient map-making also showed a version of deepfake geography in the form of fake locations or inaccuracies, such falsified data can mislead policymakers, scientists, and the public, leading to erroneous conclusions and potentially harmful decisions (Abedi and Rajabifard 2024; Romano 2025). In the context of ERS, similar manipulations could distort environmental assessments and undermine trust in geospatial data (McKenzie, Zhang and Gambs 2023). Another concern is the inadvertent invasion of privacy through AI-enhanced remote sensing. High-resolution satellite imagery, combined with AI analysis, can inadvertently capture sensitive information, leading to potential misuse or unauthorized surveillance (Paolanti et al. 2024). For example, researchers using AI and camera imagery in wildlife surveys have unintentionally captured images of poachers and other illegal activities, raising ethical questions about privacy and consent (Jamrin 2024).
Additionally, maintaining transparency in AI-driven ERS applications is crucial to maintaining trust and scientific credibility. Explainable AI (XAI) plays a vital role in this context by enabling researchers and decision-makers to understand, interpret, and validate AI-generated insights. XAI refers to a set of techniques that make AI models more interpretable, providing insights into how decisions are made rather than treating models as opaque black boxes (Arrieta et al. 2020; Gunning et al. 2021). Recently, several efforts have been made to incorporate the geographic aspect into XAI model development such as Geoshapley (Li 2024) and SpaCE (Zhang et al. 2025). In ERS, where AI-driven analyses are used for tasks such as land cover classification, climate modeling, and pollution monitoring, the lack of interpretability can pose risks to decision-making and policy development (Gevaert et al. 2021). For example, an AI model predicting harmful algal blooms must not only provide results but also explain which spectral features or environmental parameters contributed to its decision (Karpatne, Jia and Kumar 2024; Veerman et al. 2024; Weber et al. 2020). Without explainability, AI systems may reinforce biases, misinterpret environmental patterns, or generate misleading conclusions, ultimately affecting resource management and mitigation strategies (Arashpour 2023; Gevaert et al. 2021). Techniques such as feature attribution, saliency maps, and attention mechanisms help reveal how AI models derive their predictions, allowing scientists to identify errors and refine models for greater reliability (Molnar 2020). Furthermore, incorporating XAI enhances accountability, as stakeholders can independently verify AI-generated outputs and ensure that models align with ecological and societal values. Promoting explainability in AI-based ERS applications is a fundamental step toward responsible AI adoption, fostering trust and ensuring that AI augments, rather than obscures environmental decision-making.
Challenges and limitations of AI in ERS
Despite its advantages, AI in ERS faces several challenges and limitations. One major concern is the high computational cost associated with training and deploying large AI models or foundation models. Training these learning models requires significant computing power and electricity, raising concerns about sustainability and carbon footprint (Shi et al. 2023; Strubell, Ganesh and McCallum 2020). Computational costs can be a limiting factor for many research institutions and organizations. Advanced AI models often require specialized hardware such as GPUs or TPUs, which may not be readily available in resource-constrained settings (Cottier et al. 2024). The cost of acquiring, processing, and storing large-scale environmental datasets further adds to the financial burden, potentially restricting access to cutting-edge AI solutions in ERS (Ghamisi et al. 2024). This necessitates the need for re-usable AI (Moradi and Uta 2021).
Additionally, many AI applications in ERS rely on large, high-quality labeled datasets, but environmental data availability remains a challenge. While satellite imagery is abundant, labeled datasets required for supervised learning are often scarce or inconsistent across different geographic regions (Tuia et al. 2022). This data limitation hinders model generalizability and transferability, especially in underrepresented or rapidly changing environments. Model interpretability also remains a critical issue. While XAI techniques are advancing, many complex AI models, such as deep neural networks and foundation models, still function as black boxes, making it difficult for researchers and policymakers to fully understand their decision-making processes (Arrieta et al. 2020; Molnar 2020). In ERS applications where AI-driven insights influence conservation policies or disaster response, a lack of interpretability could reduce stakeholder trust and lead to unintended consequences (Bruynseels, Asveld and van den Hoven 2025).
Responsible AI use in ERS
To address these ethical challenges, the research community must adopt a framework of responsible AI practices in ERS. Based on recent comprehensive reviews and interventions highlighting the importance of ethical AI practices in ERS (Bennett et al. 2024; Ghamisi et al. 2024; McKenzie, Zhang and Gambs 2023; Paolanti et al. 2024), we propose the following considerations:
Implementing robust verification protocols to help detect and mitigate the impact of synthetic or manipulated data. Safeguarding privacy and adhering to guidelines that protect individuals’ and communities’ rights when collecting and analyzing geospatial data. Maintaining transparency in AI methodologies to foster trust and allowing for independent verification of findings. Engaging with local communities and stakeholders to ensure that AI applications in ERS align with societal values and ethical standards.
By proactively implementing these ethical considerations through approaches like federated learning (Kairouz et al. 2021; Zhang et al. 2021) interpretable AI (Du, Liu and Hu 2019; Molnar 2020), and re-usable AI (Moradi and Uta 2021), the ERS community can benefit from AI while minimizing potential harms. This ensures that technological advancements contribute positively to environmental stewardship and societal well-being.
Conclusion
This technical intervention highlights the expanding role of state-of-the-art AI techniques in multiple domains of ERS. Specifically, we discussed AI applications in image classification, object detection and segmentation, time-series forecasting, and bio-optical modeling. Additionally, we reviewed the emergence of vision- and language-based foundation models and their potential to revolutionize ERS workflows. The increasing adoption of AI has significantly improved the performance, scalability, and accessibility of critical ERS applications, like climate monitoring and rapid response to extreme events and disasters. The current state of AI-driven research in ERS stands at the intersection of multiple disciplines, creating important new opportunities for interdisciplinary collaboration between computer scientists, remote sensing experts, ecologists, and policymakers. By integrating domain expertise from diverse fields, researchers can develop AI solutions that are both scientifically robust and directly applicable to pressing environmental challenges.
Beyond these immediate applications, AI is expanding the scope of remotely sensed data by enabling the estimation of environmental or biophysical parameters and phenomena that are not optically evident, that is, do not have apparent spectral characteristics. For example, ML models have successfully estimated dynamic and unapparent parameters such as sea surface salinity (discussed in this article), belowground biomass (O’Connell et al. 2021; Runion et al. 2024) and soil organic carbon (Sharma et al. 2022), by learning complex relationships between remotely sensed spectral data, aboveground or surface optically active proxies, co-related environmental variables and underlying in situ measurements. These advancements continue to broaden the future applicability of AI in environmental and ecological research, allowing scientists to: (a) derive new insights into ecosystem dynamics and biogeochemical processes, and (b) develop stronger linkages between large-scale long-term climate change stressors to ecosystem response; for example, sea level rise and belowground biomass in wetlands (O’Connell et al. 2021; Runion et al. 2024), and temperature extremes and CyanoHABs phenology in fresh waterbodies (Ho and Michalak 2020).
The rapid expansion of AI in ERS also raises ethical concerns, including issues of data integrity, model transparency, and potential biases. This review outlines key ethical challenges and provides considerations for responsible AI implementation in ERS to ensure trustworthy and equitable applications. While AI holds transformative potential, its application in ERS remains in its early stages, with several fundamental challenges and possibilities open to further investigation. Among these, crucial research directions relate to the generalizability of AI models in ERS and their explainability.
Footnotes
Acknowledgments
The work on Sea Surfaca Salinity was funded through a GA Space Consotrium Grant (NIF project #AWD-001629-G24). The work on CyanoHAB forecasting was mainly supported through a NASA FINESST Grant (Award #80NSSC24K0068) and a NASA ESROGSS Grant (Award #80NSSC23K1258). The authors thank Georgia Coastal Ecosystems LTER for providing in situ salinity data and flux tower data. The authors thank Mississippi State University’s Geosystems Research Institute for providing turf weed data, and their High Performance Computing Collaboratory for providing computational resources to support the work on turf weed management. The authors thank Indian Institute of Remote Sensing, ISRO for providing access to high resolution Cartosat-2F imagery as well as high performance computational resources to support the building segmentation work. Finally, authors thank the reviewers for their review and comments, which helped in improving the quality of this manuscript.
Declaration of conflicting interests
The authors declared no potential conflicts of interest with respect to the research, authorship, and/or publication of this article.
Funding
The authors received no financial support for the research, authorship, and/or publication of this article.