
Abstract
Neurodivergent university students are more likely to experience academic stress and have lower attainment. Various factors have been shown to predict performance in neurotypical populations, but there has been limited research into how these factors relate to neurodivergent traits and whether they predict performance in neurodivergent students. This exploratory cross-sectional study explored the relationship between traits associated with attention deficit hyperactivity disorder (ADHD), autism and dyslexia and several study-related factors: academic adjustment, achievement orientation, study engagement, time management, effort–reward imbalance and general health and well-being, as well as whether these factors could predict performance in 277 undergraduate university students with a diagnosis of ADHD, autism and/or dyslexia. Significant inverse associations were found between autism and ADHD traits and well-being. Additionally, those with higher ADHD traits showed poorer academic adjustment and time management and a higher effort–reward ratio. Regression analyses revealed that the main predictor of academic performance was academic adjustment. Taken together, this suggests that neurodivergence is not a direct determinant of academic performance, but rather a factor that shapes students’ academic trajectories indirectly through its impact on adjustment, skills, motivation and psychological experience. This highlights the importance of targeting modifiable academic and contextual factors when designing interventions to support neurodivergent students.
Lay Abstract
Keywords
Introduction
Over the past decade, the number of students entering Higher Education (HE) within the United Kingdom has increased by around 15%, with over two million students studying for undergraduate degrees alone according to the latest government statistics (Higher Education Statistics Agency, 2026a). With the overall number of students increasing, the number of neurodivergent individuals, a term that can encompass several conditions, most commonly attention deficit hyperactivity disorder (ADHD), autism spectrum conditions and dyslexia (Armstrong, 2010; Pollak, 2009) is also believed to have increased. Whilst exact numbers remain elusive, and recorded values are likely an underestimation, data from the Higher Education Statistics Agency indicate approximately 7.4% of those entering HE at the undergraduate level have ADHD, autism or dyslexia, and this percentage excludes those identifying multiple conditions (Higher Education Statistics Agency, 2026b).
Despite increased rates of neurodivergent students enrolling in HE, studies suggest that these students frequently face academic disadvantages, including a lower likelihood of academic progression, completion and achievement compared to their neurotypical peers (Clouder et al., 2020; Shaw & Anderson, 2018), meaning they are less likely to graduate (Dobson Waters & Torgerson, 2021; Stevens et al., 2022). Various studies, including systematic reviews, have identified internal factors such as self-advocacy, self-awareness, self-determination, self-esteem and external factors such as disability teams, staff and peers as influencing success in students with disabilities (Moriña & Biagiotti, 2022). Additionally, other research has indicated that difficulties with study skills related to communication, organisation and note-taking could negatively impact performance in neurodivergent students (Jansen et al., 2017; LaCount et al., 2018; Nightingale et al., 2019). Despite this, there is still comparatively little research into what factors underpin success in HE for neurodivergent students. Furthermore, this topic is of clear interest to neurodivergent students themselves, who identified the relationship between diagnosis, learning performance and success as an area of interest in a recent priority setting exercise (Le Cunff et al., 2025).
Research in neurotypical populations has shown that various study-related factors predict higher academic performance (Richardson et al., 2012). One study-related factor that may be particularly important in neurodivergent populations is academic adjustment (Vincent et al., 2017). Academic adjustment is an indicator of how well a student transitions into the university environment, and it was originally conceptualised over 40 years ago (Baker & Siryk, 1984). It refers to the extent to which students adapt to the academic demands of university and is formed by a student's academic motivation, achievement and lifestyle (Anderson et al., 2016). In studies of the general student population, this adjustment has been shown to be impacted by a range of factors, including self-efficacy and resilience, which positively impact adjustment and loneliness, which can negatively impact it (Hazan Liran & Miller, 2019; Jones & Schreier, 2023). It can also be negatively impacted by procrastination (Vlachopanou et al., 2025). Furthermore, better physical and mental health are associated with better academic adjustment (Quan et al., 2014). Critical for the current study, previous research in neurotypical students revealed that adjustment levels positively predict performance, possibly because well-adapted students have greater motivation to learn and meet the demands of HE (Van Rooij et al., 2018). Despite its link to performance and evidence suggesting that academic adjustment may be related to factors commonly altered in neurodivergent populations, there has been very limited research examining academic adjustment in neurodivergent students. One study using a relatively small sample of students declaring autism, ADHD or neither (N = 222), found differences in social adjustment between students declaring ADHD and neurotypicals (Baczewski et al., 2022), suggesting that adjustment is an area warranting further investigation.
A second factor of relevance is achievement goal orientations, which refers to how students perceive, experience and perform in relation to their academic goals, and has been associated with academic achievement in neurotypical students (Elliot & Church, 1997; Elliot & Murayama, 2008; Miller et al., 2021). There are four main dimensions: (1) mastery-approach – a desire to improve skills and abilities, (2) performance-approach – a desire to outperform others, (3) mastery-avoidance – a desire to avoid misunderstanding material and (4) performance-avoidance – a desire to avoid incompetence or being less able than others (Elliot & Murayama, 2008). Specifically, higher levels of mastery-approach and performance-approach orientations are associated with higher academic performance in neurotypical students, whilst avoidance goal orientations are associated with maladaptive characteristics, including test anxiety and overall lower academic performance (Wirthwein et al., 2013). Various factors have been identified to influence achievement goal orientation, but there has been little consideration of neurodiversity, with those studies that do exist focusing on ADHD only (Barron et al., 2006; Smith & Langberg, 2018). Another related factor to goal orientation, which has been found to be positively associated with academic performance in neurotypical students, is the level of engagement a student displays towards their studies (Gómez et al., 2015), and yet this has not been investigated in neurodivergent populations. Finally, time management has previously been shown to be important for academic performance in neurotypical students (El Menawy et al., 2025). Whilst there has been some research focused on this in individuals with ADHD (Kaminski et al., 2006; Reaser et al., 2007), other forms of neurodiversity are underrepresented.
Given the increased risk of mental health difficulties associated with ADHD (Choi et al., 2022), autism (Choi et al., 2022), dyslexia (Wilmot et al., 2024) and the known impact of poor mental health and well-being on academic performance (Tang & He, 2023), we also opted to include two general measures of mental health and well-being. Related to these measures is Effort–Reward Imbalance, which has been shown to be related to mental health and burnout in students (Usán Supervía et al., 2020) and a factor in determining academic performance (Wang et al., 2023), and yet, to date, has not been examined in neurodivergent students but could plausibly impact academic performance.
Despite various factors being identified in the general student population as important for academic performance, it is unclear whether the same factors predict higher academic achievement among neurodivergent students. In this study, we aimed to (a) examine how specific study-related factors relate to neurodivergent traits and (b) consider whether such factors and neurodivergent traits predict performance. Specifically, we opted to focus on traits associated with autism, ADHD and dyslexia as three of the most prevalent forms of neurodiversity in university students.
Method
Participants
To participate in this study, individuals had to be (i) campus-based undergraduate students at least one term into their degree, to ensure they had completed some assessment, (ii) studying in the United Kingdom, (iii) at least 18 years old and (iv) with a current diagnosis of any of ADHD, autism or dyslexia. Participants were recruited through institutional volunteer recruitment channels, student societies, volunteer platforms, social media accounts and the volunteer platform Prolific. All participants provided informed consent, and the study was ethically approved by the local Research Ethics committee at King's College London (LRS/DP-21/22-32289). Due to the exploratory nature of this study and the lack of prior research, power calculations were not conducted.
Procedure and Materials
Participants individually completed the online questionnaire on Qualtrics. Before accessing the survey questions, participants read the information sheet, completed the eligibility check and provided electronic consent. The survey took approximately 30 min to complete, with participants first providing demographic and academic information, including (i) age; (ii) gender; (iii) ethnicity; (iv) other physical, mental or long-term diagnosed health conditions excluding ASD, ADHD and dyslexia; (v) student status, choosing from ‘Home (UK)’, ‘EU’ or ‘International’; (vi) academic discipline; (vii) duration of their qualification; (viii) current year of study; (ix) if their qualification was formally interrupted at any stage, (x) academic performance from the previous term using a 7-point scale (less than 40%, 41–50%, 51–60%, 61–70%, 71–80%, 81–90%, 91–100%) and (xi) the university they study at. Individuals then selected the neurodivergent condition(s) they had a diagnosis for. Participants reporting a diagnosis of ADHD and/or autism indicated if they took medication for their condition(s), and, if applicable, provided details of their medication and adherence (Safren et al., 2007). All participants then provided details of other regular professional support they received for their neurodivergent condition(s). These questions regarding medication and other professional support were included to ensure the sample was well-characterised and because previous research has indicated that these factors may impact academic performance (Pagespetit et al., 2025). Participants then completed the following scales.
Adult ADHD Self-Report Scale
The Adult ADHD Self-Report Scale (ASRS) is an 18-item tool used to assess adult ADHD symptoms (Kessler et al., 2005) on a scale of 5-point scale (Never to Very Often). The scale can be used to provide an inattentive score by summing nine items (IA; Cronbach's α = .840) and a hyperactive-impulsive score by summing the remaining nine (HI; α = .823), as well as a total score derived from summing all items (α = .882).
Broad Autism Phenotype Questionnaire
The Broad Autism Phenotype Questionnaire (BAPQ) is a 36-item tool that measures three key personality (aloof personality α = .896, rigid personality α = .890) and language components (pragmatic language deficit α = .756) associated with the broader autism phenotype on a 6-point scale (Very Rarely to Very Often). Each subscale consists of the scores from 12 items being summed, but a total symptom score can also be calculated from averaging all 36 items (α = .922) (Hurley et al., 2007).
Adult Reading History Questionnaire
The Adult Reading History Questionnaire (ARHQ) is used to measure reading difficulty across 23-items (Lefly & Pennington, 2000). Participants rated items on a 5-point scale (Above Average to Below Average), which is summed across all items (α = .841). As participants in this study were UK students, the questionnaire was adapted to reflect the British education system. Specifically, ‘elementary school’ was replaced with ‘primary school’, ‘high school/college’ was replaced with ‘secondary school’, ‘grades’ was replaced with ‘years’ and ‘working’ was replaced with ‘studies’.
Academic Adjustment Scale
Academic adjustment was measured with this nine-item scale, with two items reverse-scored. There are three items each dedicated to academic lifestyle (α = .371), academic achievement (α = .822) and academic motivation (α = .540) (Anderson et al., 2016). Each item is rated on a 7-point scale (Never to Always), and all items can be summed to give an overall measure of adjustment (α = .740).
Achievement Goal Orientation Questionnaire – Revised Version
This 12-item scale was used to measure each of the four orientations (mastery-approach α = .823, mastery avoidance α = .863, performance-approach α = .822 and performance-avoidance α = .901) (Elliot & Murayama, 2008). Ratings are on a 5-point scale (Strongly Disagree to Strongly Agree) with orientations calculated by averaging the three items contributing to each orientation.
Utrecht Work Engagement Scale-Student
This nine-item scale assesses learning engagement in three dimensions: vigour, dedication and absorption (Schaufeli et al., 2002). Items are rated on a 7-point scale (Never to Always; α = .924) and summed to give an overall engagement score.
Time Management Questionnaire
Time management questionnaire (TMQ) was measured using the 27-item scale, with 8 items reverse-scored. The scale measures three factors relating to time management on a 5-point scale (Never to Always): time planning (α = .900), time attitudes (α = .616) and time wasters (α = .528), with students rating the frequency with which they undertake certain activities (Alay & Kocak, 2002). All items can be summed to give a total score (α = .893).
Effort–Reward Imbalance Questionnaire
This measured the perceived difference between the effort and reward of their studies. The 16-item scale, with four items reverse-scored, was adapted to relate to studies rather than work, as originally developed (Siegrist et al., 2014). For example, adjusting a statement from ‘People close to me say I sacrifice too much for my work’ to ‘People close to me say I sacrifice too much for my studies’. Items are rated on a 4-point scale (Strongly Disagree to Strongly Agree). This provides measures of effort (α = .655), reward (α = .784) and overcommitment (α = .753), all of which are used to calculate an effort–reward ratio, which captures the imbalance between efforts and rewards. A ratio of >1 indicates more effort than reward, and <1 indicates more reward than effort.
Warwick–Edinburgh Mental Well-being Scale (WEMWBS)
Mental well-being was measured using this 14-item scale, which assesses positive mental health (e.g. ‘I’ve been feeling optimistic about the future’) with ratings on a 5-point scale that are summed to give an overall score (None of the Time to All of the Time; α = .913) (Stewart-Brown et al., 2011).
General Population – Clinical Outcome Routine Evaluation (GP-CORE)
This 14-item scale assesses general health and well-being (e.g. ‘I have been troubled by aches, pains or other physical problems’) on a 5-point scale (Not at All to Most of the Time; α = .860). After reverse scoring of seven items, all are averaged to give a total score (Evans et al., 2005).
Data Processing and Analysis
Prior to data analysis, several steps were taken to prepare the data. Firstly, data were only included from participants who had completed the survey, that is, worked through the full survey to the end and clicked submit, even if they had some missing data within the survey. Incomplete surveys were therefore removed (n = 192). We excluded five people who completed the survey in less than one-third of the median response time, suggesting an absence of reflection (van Tilburg et al., 2023). All variables were checked for missingness. Where required, items were reverse-scored prior to calculating total values for individual scales. Totals were calculated where there were no missing items for that scale, or in the case of the WEMWBS where a total can still be calculated if there is one missing value only (Stewart-Brown et al., 2011). To characterise the sample, study and demographic variables were summarised as a mean and standard deviation or frequency counts and percentages for categorical variables.
The main analyses were designed to examine the relationships between neurodivergence-related traits, study-related factors and academic performance. Given the potentially vast number of variables if all subscales were to be considered, compared to the sample size, and recognising that subscales often show high correlations with each other, we opted to only use total scores for all scales. This also negates the slightly lower than ideal internal reliability for some subscales within the TMQ and Academic Adjustment Questionnaire. First, bivariate correlation analyses were used to characterise the overall pattern and direction of associations between neurodivergent trait scores (ASRS, BAPQ and ARHQ) and the study-related variables. This step provides a continuous, assumption-light overview of how constructs relate across the sample and serves as a descriptive foundation for subsequent analyses. Spearman's rank correlation coefficient (ρ) was used to quantify monotonic associations between trait scores and outcome variables. This non-parametric statistic is robust to non-normality and outliers, as it assesses the Pearson correlation between ranked values. Given the high number of correlations (n = 30) and the exploratory nature of this research, we corrected for multiple comparisons with a significant correlation being described if α < .0017).
Second, a penalised regression model with an explicit predictive focus was fitted to examine how all variables jointly relate to academic performance. This multivariable stage shifts the emphasis from pairwise association to simultaneous prediction, allowing identification of variables that retain predictive value after accounting for shared variance and multicollinearity. Least Absolute Shrinkage and Selection Operator (LASSO) regression was selected to support automatic variable selection and to produce a parsimonious model that generalises beyond the observed sample. Thirteen variables were included in the regression, and participants omitting the measure of academic performance (the dependent variable) were omitted, leaving a sample size of 276 for this analysis. All predictors were standardised (mean-centring and scaling to unit variance) prior to modelling to prevent predictors measured on different scales from disproportionately influencing the penalty term, and this allows coefficients to be interpreted as standardised effects. The model was fitted using 10-fold cross-validation to select the optimal regularisation parameter λ, following the standard LassoCV implementation. In each fold, the model was trained on 90% of the data and evaluated on the remaining 10%, yielding an out-of-sample estimate of predictive performance. Averaging across folds provides a stable estimate of how well each candidate value of λ generalises to unseen data. LASSO introduces an ℓ1 penalty on the regression coefficients, shrinking smaller coefficients towards zero and performing automatic variable selection. Conceptually, this penalty increases the likelihood that predictors with weak or redundant contributions are eliminated entirely. As a result, LASSO is particularly well suited to settings with correlated predictors or when the true predictive signal is expected to be distributed unevenly across variables. Cross-validation selects the value of λ that maximises predictive accuracy on held-out data, balancing model complexity and generalisability. Larger values of λ produce sparser models with fewer retained predictors, whereas smaller values allow more coefficients to remain non-zero at the cost of increased variance. The selected λ, therefore, represents an empirically determined compromise between bias and variance. Model performance was evaluated using the in-sample R2, representing the proportion of variance explained by the training data and the cross-validated R2, representing the average predictive performance on the unseen data across the 10 folds, proving a conservative estimate of generalisability.
Across these two analyses, different missing-data handling strategies were applied to reflect the statistical requirements of each method. Pairwise deletion was used for the correlation analysis to maximise available data for each comparison, while median imputation was employed for regression modelling to pre-serve a complete predictor matrix. Details of the missingness and sample sizes for the different analyses are reported in the Supplemental Material (S1). Together, this layered approach provides a coherent and triangulated understanding of how neurodivergence-related traits, academic functioning and performance interrelate.
Results
Sample Characteristics
After exclusions, 277 participants were included in the final sample. Of these 273 provided the name of their university, allowing us to determine representation from 88 universities spread across the United Kingdom (England, Scotland, Wales and Northern Ireland). The age of participants was 24.57 ± 8.06 (M ± SD) years. Table 1 summarises the categorical characteristics of the sample. It is noteworthy that most of the participants were female and did not have any physical health conditions, but around half had a mental health condition, with most also having other long-term conditions, which may be expected in a neurodivergent sample. Most were home students, studying health-aligned disciplines. Students were spread across year groups, but the largest proportion was in the second year. The age of the sample appears older than might be expected for students in their second year, but neurodivergent students are known to have a complex journey to HE and so often be slightly older on entry (Unite Students, 2023).
Demographic Data by Counts and Percentages for Categorical Variables.
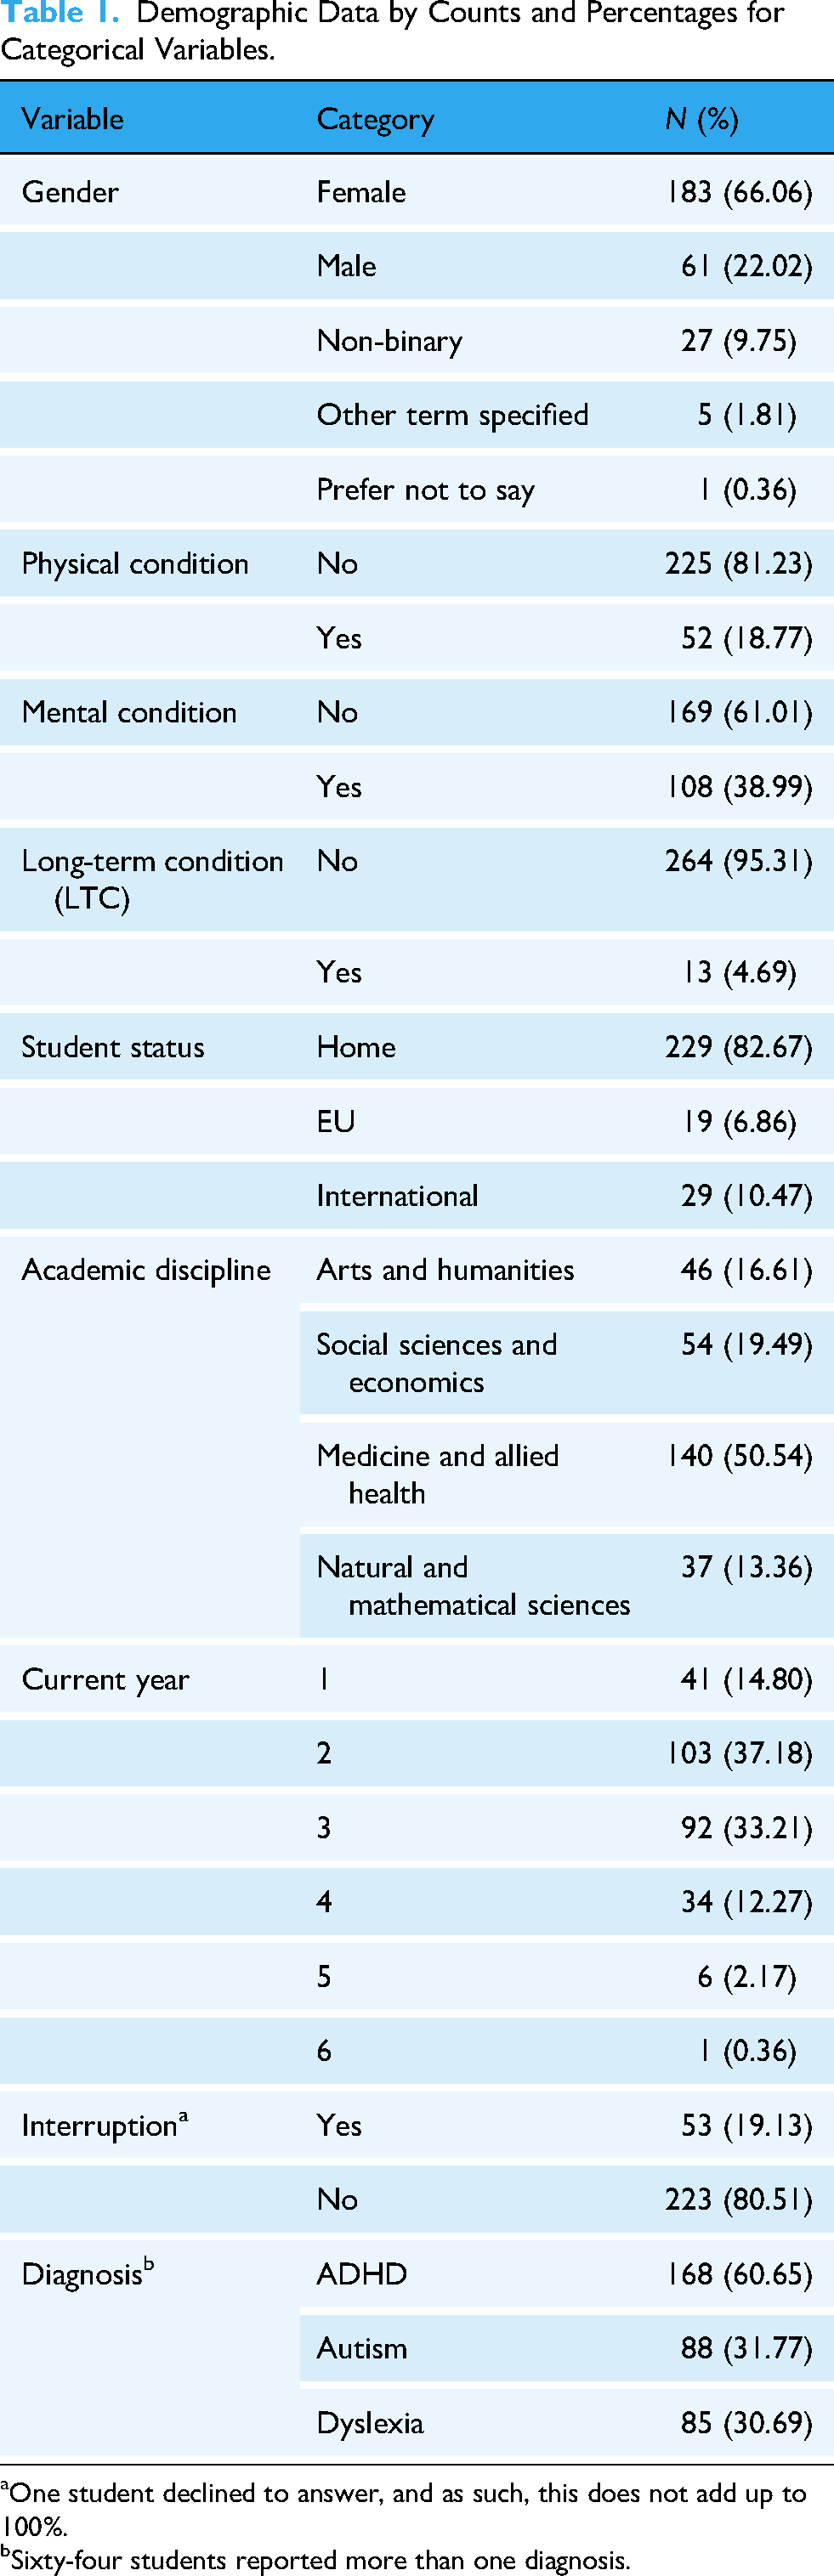
One student declined to answer, and as such, this does not add up to 100%.
Sixty-four students reported more than one diagnosis.
Of those with ADHD, 89 (52.98%) received medication (95.40% stimulants, 2.30% non-stimulants, 2.30% other) with good adherence (M ± SD, 78.18 ± 27.88%). Fifty-nine individuals identified other forms of support which could be categorised as study support or skills training (N = 25, 42.37%), talking therapies (N = 31, 52.54%), check-ins with their psychiatrist (N = 3, 5.08%) and ADHD coaching (N = 2, 3.39%), with some noting multiple approaches. Only 8 (9.09%) individuals with autism reported receiving medication (62.50% selective serotonin reuptake inhibitors, 37.50% other) with good adherence (72.11 ± 37.24%). Forty-four individuals were receiving non-pharmacological support for their autism. Half reported receiving some kind of therapy, ranging from talking therapies to speech and language or occupational therapy (N = 22, 50.00%). The next most common support was some kind of study skills or mentoring (N = 20, 45.45%). Finally, a small number (N = 2, 4.55%) reported access to mental health support, and one (2.27%) was working with a life coach. Thirty-seven of those with dyslexia (43.53%) reported receiving extra help. Most commonly (N = 26, 70.27%), this involved receiving study skills support, but there were also reports of assistive technology and mitigation (e.g. longer in exams, note-takers) (N = 16, 43.24%).
The Relationship Between Neurodivergence Traits and Study-Related Factors
Table 2 shows the correlations between the total trait scores of ADHD, autism and dyslexia and each of the study-related factors. Means and standard deviations for these measures are provided in Supplementary Material 1. After correcting for multiple comparisons, there were no significant relationships between the AHRQ score and any of the study-related variables. The BAPQ measure of autism traits shows two significant correlations, both indicating poorer well-being in those with high trait scores. The ASRS measure of ADHD traits showed several correlations. Firstly, there was a significant negative correlation with academic adjustment, indicating that those with higher ADHD traits show poorer academic adjustment to university. Secondly, higher ADHD traits were associated with poorer time management. Thirdly, as with the autism trait measure, ADHD traits were associated with poorer mental well-being, as measured by the WEMWBS, and poorer general health and well-being, as measured by the GP-CORE. Finally, ADHD trait scores showed a positive association with the effort–reward ratio, indicating that those with higher ADHD traits are more likely to have higher ratio scores, where effort outweighs reward.
Spearman Correlations Between Neurodivergence-Related Traits and Psychological and Academic Measures (Pairwise Deletion).

Correction for multiple comparison adopts an α < .0017 to indicate significance. This is shown in the table with an asterisk.
Predictors of academic performance.
Cross-validation selected an optimal regularisation parameter of λ = 0.0833, indicating a moderate level of shrinkage. The model achieved an in-sample R2 = 0.213, suggesting that approximately 21.3% of the variance in academic performance was explained within the sample. Predictive performance was lower under cross-validation, with R2 = 0.102 ± 0.176. In the context of behavioural and educational research, where outcomes such as academic performance are influenced by numerous unobserved factors, cross-validated R2 values in the 5–15% range are common. The positive mean R2 indicates a meaningful predictive signal beyond a baseline mean-only model, while the relatively large variability across folds reflects heterogeneity and noise in the underlying relationships. Table 3 reports the standardised coefficients of the five predictors retained after penalisation of zero-value coefficients. From the table, it can be noted that the strongest predictor of self-reported performance is academic adjustment. Both the mastery-approach orientation and time management are similarly positive predictors. Autism traits have a small positive predictive power, such that higher autism traits would predict higher performance. Finally, the ER Ratio was a negative predictor of performance, consistent with the interpretation that students perceiving a higher imbalance between effort and reward were achieving lower levels of performance.
Five Predictors Are Retained With Non-Zero Values After Penalisation in the Regression Model to Predict Academic Performance.

Discussion
In this study, we aimed to (a) examine how specific study-related factors relate to neurodivergent traits for ADHD, autism and dyslexia, and (b) consider whether such factors and the traits predicted performance. For the first aim, we found relatively few associations between the tested study-related variables after correcting for multiple comparisons. Indeed, there were no significant associations between dyslexia and any tested variable and only two associations, both related to health and well-being, with autism. In contrast, ADHD trait scores were associated with poorer academic adjustment and time management and a higher ER ratio, indicating students with higher ADHD traits feel they put in more effort than they gain in reward. Similar to autism traits, ADHD traits were also associated with poorer health and well-being. For the second aim, we found that only five predictors were retained in the regression model, with academic adjustment showing the greatest predictive power for performance. Notably, trait scores for ADHD and dyslexia were reduced to zero in the regression model. This pattern suggests that any relationship between such traits and performance is largely indirect, operating through more proximal mechanisms such as academic adjustment, time management, motivational orientation and perceived effort–reward balance. Overall, the LASSO model identifies a coherent and interpretable predictive structure: academic adjustment as the primary driver of performance, supported by smaller contributions from mastery-oriented motivation, time management, effort–reward perceptions and a weak residual signal associated with autism traits.
Given the dearth of research examining these study-related factors in neurodivergent students previously, there is limited prior research to compare the current study to. However, the findings showing an association between both autism and ADHD traits and poorer health and well-being are in line with previous studies focused on HE (Clouder et al., 2020) and studies examining co-occurrence of mental health conditions with autism (Hossain et al., 2020; Lai et al., 2019) and ADHD (Njardvik et al., 2025). Similarly, the inverse association between ADHD traits and time management also aligns with previous research, which indicates that those with ADHD may have difficulties with organisation, planning and specifically time blindness (Abikoff et al., 2009; Sibley et al., 2016; Tolani & Venkatesan, 2025). We also found poorer academic adjustment in those with higher ADHD traits but no link to autism or dyslexia traits. One previous study, looking across conditions, found no relationship between condition and adjustment but only looked at one aspect of adjustment (Hunter, 2022). A second study looking at diagnostic groups rather than traits reported no differences in intellectual self-confidence, which they considered part of academic adjustment, although they did report differences in social adjustment (Baczewski et al., 2022). Additionally, a study looking at the general student population reported that executive function predicted academic adjustment more than ADHD traits (Sheehan & Iarocci, 2019). In contrast to this, two other studies with the general student population did report that higher ADHD traits were associated with lower adjustment (Mohamad et al., 2025; Norwalk et al., 2009). The current findings, therefore, add to the varying evidence base around ADHD and academic adjustment. We also noted a positive correlation between ADHD traits and effort–reward ratio. There is limited research investigating effort–reward imbalance in ADHD, although it is suggested that individuals with ADHD may have difficulty allocating sufficient effort to tasks (Sergeant, 2005) and that reward processing may be different in ADHD (Sonuga-Barke et al., 1992). One prior study investigated this in children, using a study where participants chose between high effort-high reward and low effort-low reward options and reported similar choices, that is, those with ADHD were not more or less likely to select the high effort condition, but did have difficulties implementing high effort activities (Winter et al., 2019). Additionally, higher effort–reward imbalance is associated with burnout (Bouche et al., 2025), and burnout is associated with ADHD (Godfrey-Harris & Shaw, 2023; Syharat et al., 2023). Therefore, the finding that those with higher ADHD traits have a higher ER ratio is in keeping with other research in this area, even though no direct comparisons are available.
The regression analysis revealed that five factors significantly predicted academic performance: academic adjustment was the primary driver of performance, supported by smaller contributions from mastery-oriented motivation, time management, effort–reward perceptions and a weak residual signal associated with autism traits. Interestingly, neither dyslexia nor ADHD traits significantly predicted academic performance. Of the five traits identified, three were shown in the correlation analysis to be significantly correlated with ADHD. Therefore, these three may be suitable constructs to target in interventions designed to support students with ADHD. For example, supporting better academic adjustment, time management and effort rewards may improve academic performance for students with ADHD.
Taken together, these findings indicate that neurodivergence should not be conceptualised as a direct determinant of academic performance, but rather as a factor that shapes students’ academic trajectories indirectly through its impact on adjustment, skills, motivation and psychological experience. From a practical perspective, this highlights the importance of targeting modifiable academic and contextual factors – such as academic adjustment processes, time-management support and perceptions of fairness and reward – as well as providing suitable mental health support, when designing interventions to support neurodivergent student populations. With this in mind, it would also be pertinent to consider whether existing support approaches within universities are targeting these constructs and how effectively they influence them through thorough evaluation.
Several limitations of the current study should be acknowledged. Firstly, measures were self-reported, which may introduce shared-method variance. Relatedly, except for the scales designed to assess neurodivergent traits, the measures used have been previously validated in general student populations, which are likely to be largely based on neurotypical individuals. As such, future studies should consider further validation of the existing scale, for example, checking factor structure in neurodivergent populations. Secondly, the cross-sectional design precludes causal inference, and predictive performance, while meaningful, remained modest, reflecting the multifactorial nature of academic outcomes. Thirdly, the sample was female-dominated, meaning that findings may differ in a more male sample. Finally, for the correlations, we used the Bonferroni correction for multiple comparisons. This correction, whilst valid, is highly conservative, and this may have masked other important relationships. In addition to these limitations, this study was not designed with neurodivergent student stakeholders, which would have been beneficial to ensure accessibility, improved relevance and reflection of lived experience, whilst also making sure data is ethically collected for meaningful use. Future work would benefit from a participatory approach, which is considered the gold standard in neurodiversity research (Fletcher-Watson et al., 2021) with longitudinal designs, objective performance indicators and explicit mediation modelling to test the indirect pathways suggested by the present findings. The findings of future longitudinal studies can then be integrated into existing frameworks, for example, compassionate pedagogy (Hamilton & Petty, 2023), to improve student experience for all students, including those who are neurodivergent. Despite these limitations, by integrating descriptive and predictive perspectives, this study provides a coherent framework for understanding how neurodivergent traits relate to academic performance through a network of study-related processes and offers a principled foundation for both further research and applied support strategies in HE.
Supplemental Material
sj-docx-1-ndy-10.1177_27546330261462255 - Supplemental material for Investigating the Relationship Between Study-Related Factors and Neurodivergent Traits in Undergraduate University Students: An Exploratory Study
Supplemental material, sj-docx-1-ndy-10.1177_27546330261462255 for Investigating the Relationship Between Study-Related Factors and Neurodivergent Traits in Undergraduate University Students: An Exploratory Study by Tianhua Chen, Angela-Mikella Tawfig, Lina Fahmy, Paul G. Overton and Eleanor J. Dommett in Neurodiversity
Supplemental Material
sj-docx-2-ndy-10.1177_27546330261462255 - Supplemental material for Investigating the Relationship Between Study-Related Factors and Neurodivergent Traits in Undergraduate University Students: An Exploratory Study
Supplemental material, sj-docx-2-ndy-10.1177_27546330261462255 for Investigating the Relationship Between Study-Related Factors and Neurodivergent Traits in Undergraduate University Students: An Exploratory Study by Tianhua Chen, Angela-Mikella Tawfig, Lina Fahmy, Paul G. Overton and Eleanor J. Dommett in Neurodiversity
Footnotes
Ethical Approval and Informed Consent Statements
Ethical approval was obtained in advance from the Local Ethics Committee at King's College London (LRS/DP-21/22-32289). All participants provided consent to participate and consent for the anonymous data and findings of the study to be published.
Funding
The authors received no financial support for the research, authorship and/or publication of this article.
Declaration of Conflicting Interests
The authors declared no potential conflicts of interest with respect to the research, authorship and/or publication of this article.
Data Availability Statement
Fully anonymised data is available on reasonable request from the corresponding author.
Supplemental Material
Supplemental material for this article is available online.
References
Supplementary Material
Please find the following supplemental material available below.
For Open Access articles published under a Creative Commons License, all supplemental material carries the same license as the article it is associated with.
For non-Open Access articles published, all supplemental material carries a non-exclusive license, and permission requests for re-use of supplemental material or any part of supplemental material shall be sent directly to the copyright owner as specified in the copyright notice associated with the article.