
Abstract
Although prior research has shown that behavioral and nonbehavioral items are not equivalent, researchers have failed to recognize that these items elicit reliance on different memory processes and predict different outcomes. The typical use of multidimensional scales compounds this problem even further when researchers ignore the multidimensional nature of the construct and smash disparate dimensions based on semantic and episodic memory sources into a single composite score, a practice we refer to as DIMSmash. We conduct a literature review of four popular leadership measures to examine the prevalence of DIMSmash, demonstrate how a memory-based approach to measurement suggests that DIMSmash is ill-advised, and conduct a computer simulation to show that the consequences of DIMSmash are not trivial. We found that the practice of DIMSmash is pervasive; 89% of the reviewed articles collapsed multidimensional leadership measures into a single score, even though the consequences of DIMSmash matter. Proceeding with DIMSmash despite the warning signs yields misleading results that obscure relationships with outcomes, which leads to incorrect conclusions. We suggest that the use of a bifactor model can overcome the limitations of DIMSmash.
Words matter. Yet researchers routinely assume that scale items are equivalent and act on that assumption by engaging in practices that undermine construct validity. This problem is illustrated by the widespread conflation of behavioral and nonbehavioral items (Banks et al., 2023) in scales developed to measure a wide range of constructs in the management domain, with leadership being a prime example. As observed by Fischer (2023), measures intended to be behavioral are often composed of multiple items with highly abstract language that refers to the leader's character or the leader's effect on followers. While mixing different types of items within a single scale has been criticized, both behavioral and nonbehavioral items are necessary to capture complex multidimensional leadership constructs because the dimensions typically focus on both what the leader does and trait-based attributions of who the leader is (Lord, 1985). However, problems arise with the typical use of multidimensional scales because researchers act as if the behavioral and nonbehavioral dimensions are equivalent and collapse them into a single composite score.
We argue that researchers are largely unaware that the dimensions in their multidimensional measures may not only reflect different dimensions of a construct but also tap into distinct memory processes in a way that profoundly affects construct and predictive validity. Indeed, cognitive research has long distinguished between two distinct memory processes: one relying on abstract general impressions (semantic memory) and the other relying on behaviors or events in a specific context (episodic memory). Prior research has documented that there are meaningful differences between behavioral and nonbehavioral items; they are associated with different memory processes, and they predict different outcomes (Hansbrough et al., 2021). The practice of collapsing all dimensions into a single composite score, regardless of the memory system reflected by these items, not only potentially misrepresents the overall construct but also may obfuscate relationships predicted by our theories. We refer to this practice as DIMSmash because all of the items that are intended to represent different dimensions of the multidimensional construct are smashed into a single score. As observed by Rhemtulla et al. (2020), the assumption that all items measure the same thing is plausible in some contexts; however, when measuring broader and more conceptually complex constructs, the items used in the scale are not interchangeable manifestations of the multidimensional construct. Nevertheless, common factor models are routinely assumed and applied without any justification, and the misapplication of those models can result in incorrect interpretations (Rhemtulla et al., 2020). When a construct's multidimensional structure has been conceptually and empirically verified, believing that the smashed composite score will adequately represent the intended construct is more of a hope or a wish than sound science.
While we focus on the practice of DIMSmash in the leadership domain, it should be noted that these concerns apply more broadly to both micro and macro levels of research. For example, Boon et al. (2019) observed that the human resource (HR) systems literature assumes an additive relationship between individual practices by summing scores on individual practices to create a single HR system score. Similarly, the strategic human capital literature has been criticized for conflating knowledge, skills, abilities, and other characteristics (KSAO) into a single human capital resource (HCR) score (Nyberg et al., 2014). As such, the ideas presented here have widespread applicability.
In the present paper, we (a) detail how a memory-based approach to measurement raises questions about the advisability of DIMSmash and how it undermines theory testing; (b) present the results of a literature review of four popular leadership measures to examine the prevalence of DIMSmash and the justification provided for doing so; (c) present the results from a computer simulation to explore the pitfalls of DIMSmash; and (d) provide recommendations to consider prior to DIMSmash to strengthen theory testing of multidimensional constructs. We begin our discussion with a review of the distinction between semantic and episodic memory.
Semantic and episodic memory
Semantic memory consists of general knowledge and broad cognitive schemas that include representations of people in terms of their traits, attributes, and group memberships (i.e., leader/non-leader). Semantic memory entails a pattern completion process that fills in the gaps in our memories and operates at a preconscious level (Hanges et al., 2000; Lord et al., 2001; Smith & DeCoster, 2000). For example, people may rely on general schemas such as implicit personality and implicit leadership theories when they have incomplete information about another person (Fiske & Taylor, 2013). Reliance on semantic memory may contribute to inaccuracy in ratings because people endorse items that seem familiar but did not actually occur (Hansbrough et al., 2015; Shondrick et al., 2010). It should be noted that semantic memory tends to be the default mode of processing due to its general relevance and ease of use in guiding retrospective judgments (Srull & Wyer, 1989).
In contrast, episodic memory is a context-specific memory for events and personal experiences that is integrated with information about the self and consists of rich, vivid details about the spatial context for an event, when the event occurred, and the emotions experienced during encoding (Allen et al., 2008; Tulving, 2002). Because episodic memory enables individuals to consciously re-experience past events upon retrieval (Tulving, 2002), it enables them to provide explanations or justifications for their conclusions. As indicated by Smith and DeCoster (2000), this differs from semantic memory, which may render perceivers unable to provide any justification for their answers other than intuition. Episodic and semantic memories are both aspects of declarative memory, yet they generally emphasize different brain structures (temporal lobes for semantic memory and the hippocampus and limbic systems for episodic memory; Addis & Schacter, 2012; Allen et al., 2008), which is consistent with dual-process models of memory.
It is important to note that one type of memory is not inherently better than the other. Rather, we maintain that the memory system being tapped must be consistent with the nature of the intended dimension. We recommend that ratings should be drawn from semantic memory when the dimensions focus on general impressions of the leader, whereas ratings should be drawn from episodic memory when the dimensions focus on leader behaviors.
It should be noted that developing measures that are purely episodic or semantic is challenging, in part, because raters have different experiences with leaders. Therefore, no item will evoke an episodic or semantic-based response from all individuals. Nevertheless, carefully written items can have markedly different tendencies to elicit responses based on semantic or episodic memory for both leadership and criterion measures (Hansbrough et al., 2021).
Winocur et al. (2010) contended that there is a dynamic interplay between semantic and episodic memory. Over time, the gist of an episodic memory is consolidated into semantic memory while still preserving the episodic memory. Thus, a rater may have two very different types of memories regarding a specific leader. For example, an individual may encode in episodic memory an event where a leader helped them complete a specific work task on a particular afternoon so they could leave early for an important event. The consolidated semantic representation of this experience may only be that the leader is considerate and helpful. The type of memory that raters use depends upon the availability of the information, the cues that are present, and the demands of the particular task.
The words used in an item have been shown to influence the cognitive processing and memory sources people rely on when responding to the item (ter Doest & Semin, 2005). For example, Hansbrough et al. (2021) found that abstract items centered on adjectives or generalized impressions were associated with semantic memory, whereas items focusing on behaviors were associated with episodic memory. Similarly, Lord et al. (2021) reported that episodic memory increased when an item referenced repeated events and specified a particular context. Recently, Balthazard et al. (2023) reported preliminary neurological evidence showing that abstract and concrete items differentially activate regions in the brain associated with either semantic or episodic memory.
Our focus on the memory system used by raters is consistent with the call from multiple psychometricians (e.g., Furr, 2021; Kane, 2006; Messick, 1990) to explore response process validity. This call has been codified in the 1999 Standards for Educational and Psychological Testing (American Educational Research Association [AERA], American Psychological Association [APA], & National Council on Measurement in Education [NCME], 1999), which explicitly states the need for researchers to explore the response process validity of their measures. Response process validity concerns the alignment of people's thought processes as they respond to measures with the thought processes researchers assume respondents use when responding to these measures (Zumbo & Chan, 2014).
From a memory-based perspective, when researchers intend to assess constructs consistent with semantic memory, such as implicit leadership theories or overall leadership impressions, raters will tend to emphasize semantic memory while responding to items. Alternatively, when researchers intend to assess constructs consistent with episodic memory, such as leader behaviors, raters will tend to emphasize episodic memory when responding to items. Construct validity improves as the overlap between the actual and hypothesized thought processes increases (Böckenholt, 2012; Böckenholt, 2017).
The common practice of combining dimensions based on behavioral and nonbehavioral items into a single composite score overlooks the fact that they may reflect two distinct memory processes and predict different outcomes. As shown by Hansbrough et al. (2021), scales based on episodic memory better predicted specific, event-based constructs and outcomes (i.e., trust 1 and empowerment), whereas scales based on semantic memory better predicted general, abstract constructs (i.e., perceived organizational support) or global outcomes. We contend that combining semantic and episodic items into a single composite score may hide support for some of a theory's predictions, whereas other predictions may be overestimated simply as an artifact of a larger percentage of items that tap into one particular memory sourcewhich is consistent with the nature of the outcome.
To summarize, we contend that the practice of collapsing dimensions based on behavioral and nonbehavioral items into a single composite score (i.e., DIMSmash) (1) ignores the meaningful distinction between dimensions based on semantic memory and those based on episodic memory, undercutting response process validity, and (2) results in misleading conclusions regarding the support of our theories.
Use of Multidimensional Scales
Although many leadership constructs are conceptualized and empirically validated as multidimensional, these constructs are typically collapsed into single composite scores. Ignoring the multidimensional nature of a construct and treating it as unidimensional is inappropriate (Carver, 1989; Chen et al., 2012; Hull et al., 1991) and reflects a lack of understanding of common factor models. Researchers erroneously assume that a common factor model reflects a combination of a measure's items. In reality, common factor models reflect only what is shared (i.e., common) among all items in a measure (Rhemtulla et al., 2020). Any variance that is not shared among all of the items is considered to be random error.
As noted by Edwards (2001), the determination of the appropriate model depends on whether the multidimensional construct is a superordinate or aggregate construct. A superordinate construct is top-down whereby the construct is manifested by its dimensions (e.g., leader–member exchange [LMX] as indicated by Affect, Loyalty, Contribution, and Professional Respect). Thus, multidimensional leadership theories are superordinate constructs. In contrast, an aggregate construct is bottom-up whereby the construct is an additive combination of its dimensions (e.g., overall job satisfaction as a composite of satisfaction with specific job facets). While there are aggregate constructs in organizational behavior (Edwards, 2001), the majority of researchers conceptualize their constructs as superordinate (Credé & Harms, 2015). In keeping with this practice and our objective to focus on the use of multidimensional models in the leadership domain, we will confine our discussion to superordinate constructs.
Although superordinate constructs are often operationalized by summing the scores on all dimensions to create a single composite score (i.e., DIMSmash), this fails to recognize that there may be meaningful differences among the first-order dimensions, and these dimensions are expected to differentially relate to various dependent variables. As noted by Edwards (2001, p. 185), “If the dimensions were not distinct, then the construct would be unidimensional rather than multidimensional.” A bifactor model reflects the general factor that is common among the items as well as the individual dimensions. As such, a bifactor model allows researchers to examine the influence of the different dimensions apart from that of the common factor on criteria. Bifactor models are particularly useful when researchers are interested in the predictive validity of both the general factor and the different dimensions (Chen et al., 2006). Therefore, bifactor models are particularly relevant for multidimensional leadership theories where different dimensions are anticipated to predict different outcomes. We contend that a bifactor model is a more appropriate model because the contribution of each dimension is preserved. 2
Following Kim et al. (2020), the search was constrained to 26 high-quality and peer-reviewed journals in management, psychology, and leadership published in 2018–2023 (see Appendix A for a complete list of the journals included). All journals are indexed in PsycINFO. A keyword search was conducted using the terms “transformational leadership,” “LMX,” “authentic leadership,” and “servant leadership.” The initial search yielded a total of 343 articles. We then applied the following inclusion/exclusion criteria as depicted in Figure 1. Articles were excluded from the sample if they were not based on original empirical, quantitative data; did not use one of the mulitdimensional measures of interest; did not use all of the items in the scale; or used modified scale items. A total of 55 articles met the inclusion criteria and were included in our sample. All articles included in the sample are denoted by an asterisk (*) in the references.
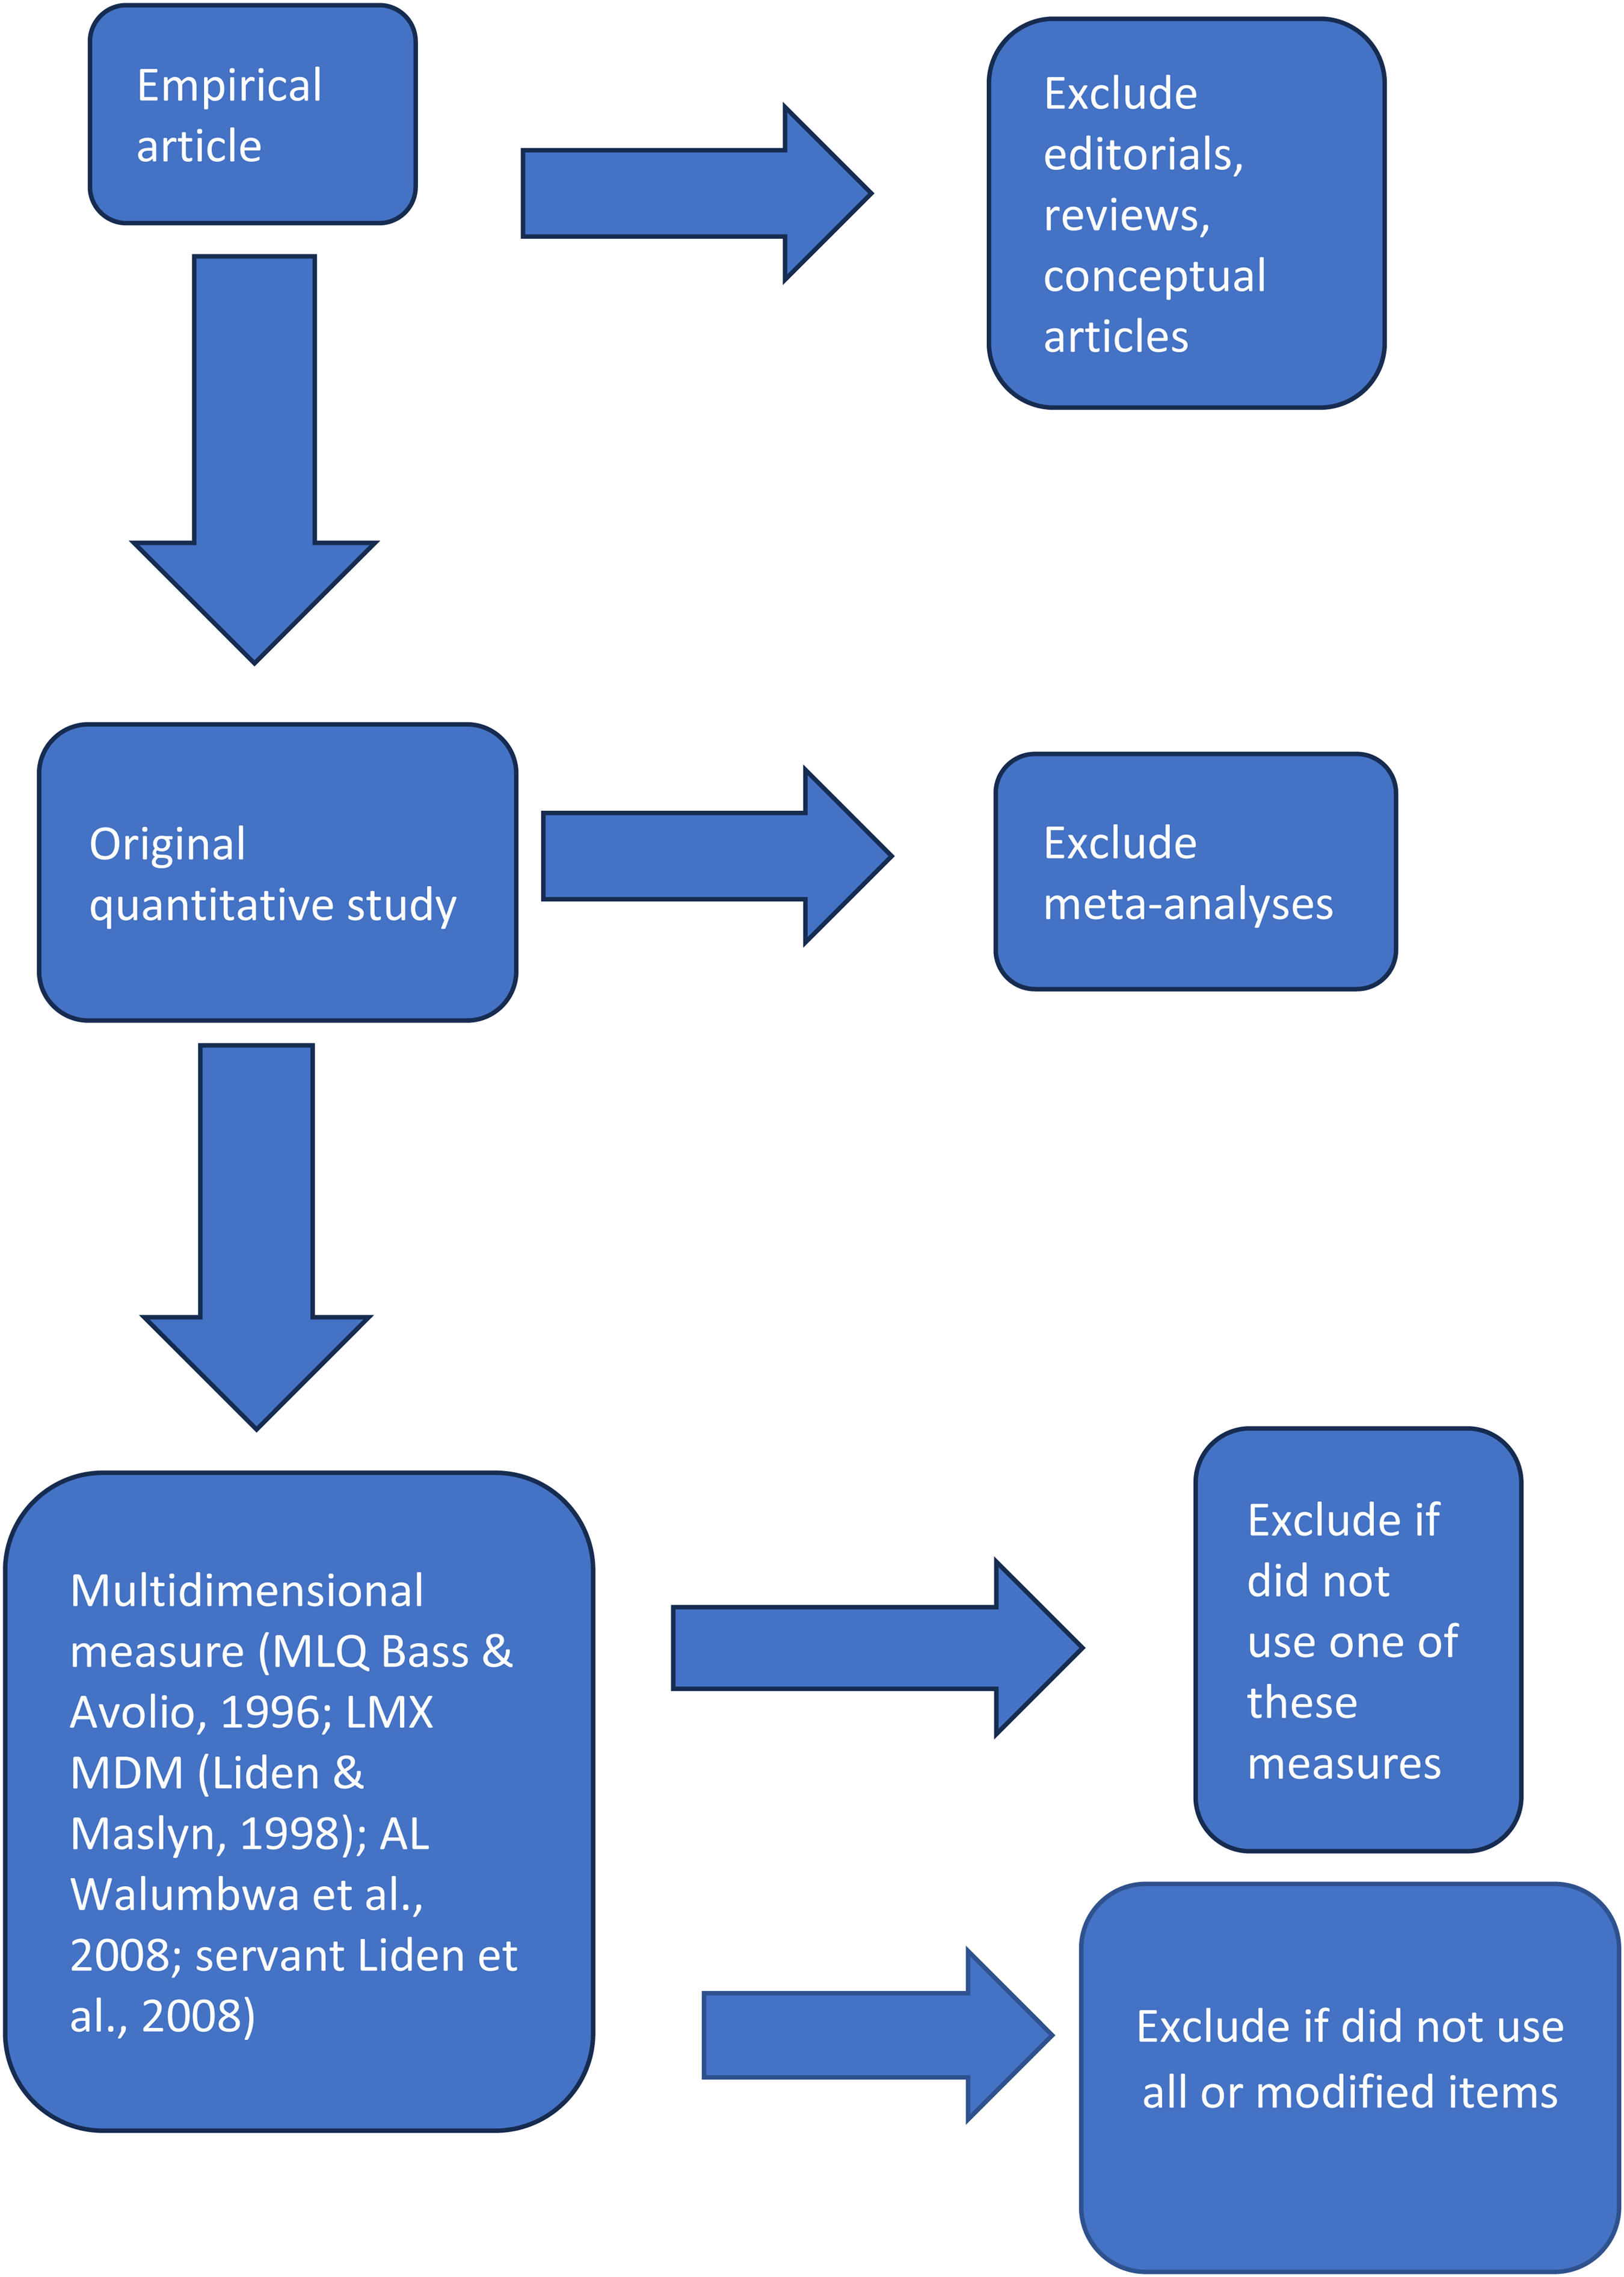
Inclusion/Exclusion Criteria. Note. LMX MDM = Leader–Member Exchange MDM; MLQ = Multifactor Leadership Questionnaire.
We found that DIMSmash was widespread as evidenced by approximately 89% of the articles engaging in this practice. As shown in Table 1, DIMSmash is not confined to a particular measure but is a consistent practice across measures. This suggests that DIMSmash is the norm rather than the exception. Furthermore, 63.27% of the studies provided no evidence to justify DIMSmash, and another 12.24% relied on the explanation that it is a common practice (e.g., everybody does it).
Prevalence of DIMSmash and Justification.
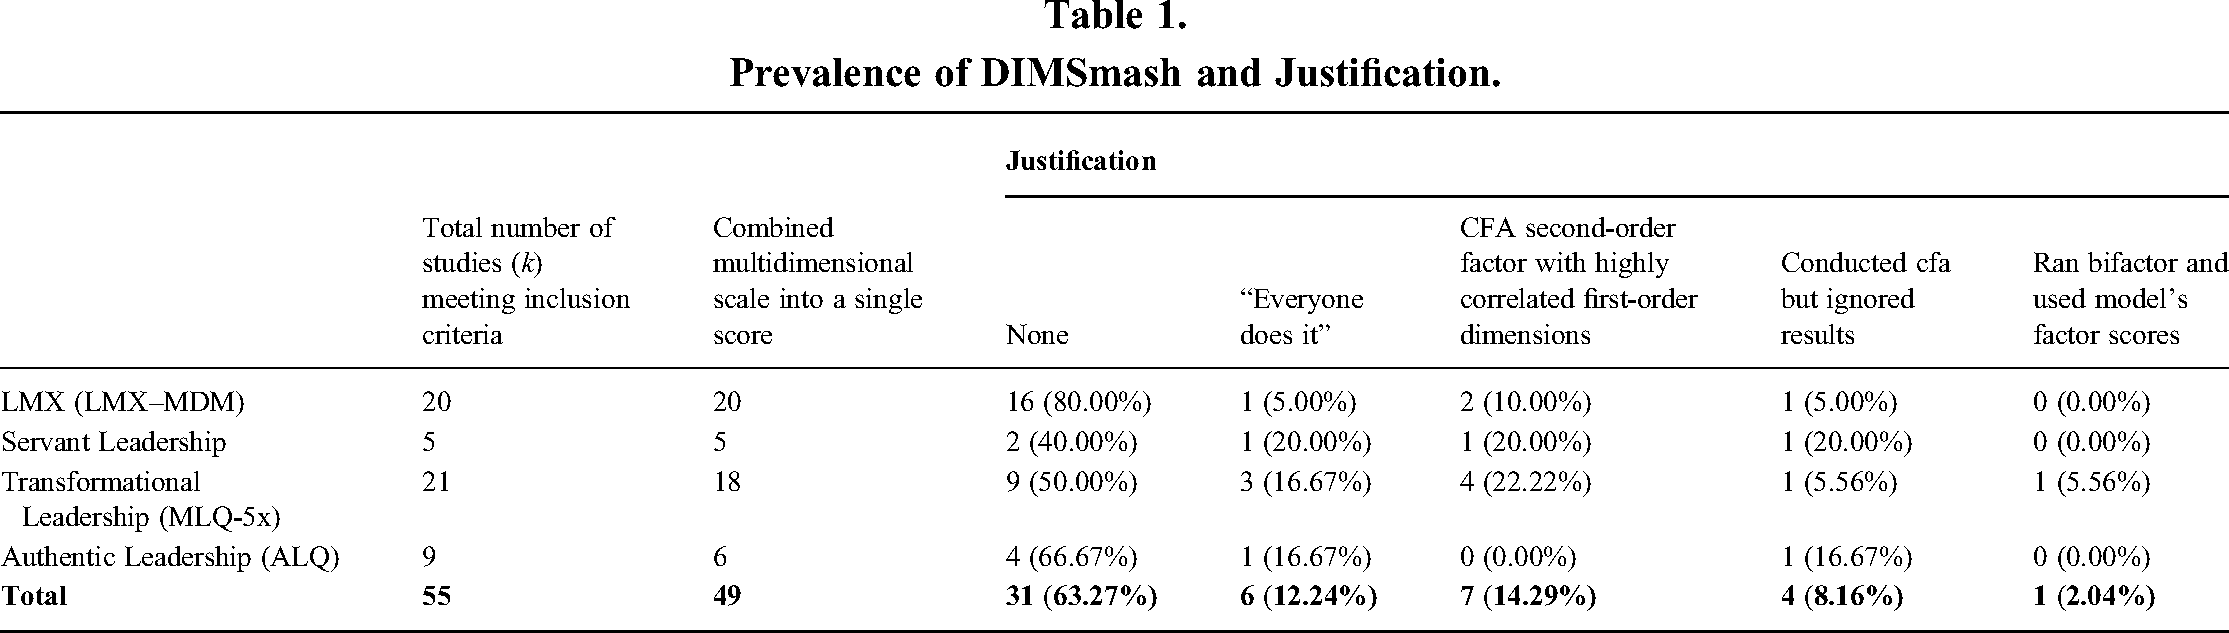
Additionally, 14.29% of the articles conducted a confirmatory factor analysis (CFA) and argued that the obtained higher-order common factor was highly correlated with the first-order dimensions, thereby justifying smashing the dimensions into a single composite score. However, as Credé and Harms (2015) pointed out, this is insufficient. Researchers must also demonstrate that the second-order factor completely accounts for the relationships among the first-order dimensions as well as among all the scale's items. If the second-order factor cannot account for these relationships, only focusing on the second-order composite score ignores any unique relationships that can be predicted by the first-order dimensions. The readily available χ2 fit test can be used to assess this property (Credé & Harms, 2015). If a second-order CFA is imposed on the data and the χ2 fit test is non-significant, this provides evidence that the property is satisfied. However, caution is warranted when interpreting a non-significant χ2 fit test due to possible alternative explanations (e.g., low statistical power or alternative models with superior global fit). We agree with Credé and Harms (2015) that a second-order factor should be used only if it has been shown that the higher-order factor completely explains the relationships below it (i.e., items and first-order relationships). Here, we discuss the consequences of using a single higher-order factor when that factor cannot explain all of the lower-level relationships. Unfortunately, this is a common occurrence; therefore, researchers need to be cognizant of the serious pitfalls of DIMSmash.
In other cases, the results of the CFA were not used to inform subsequent analyses; 8.16% of the articles presented CFA results that showed that the multidimensional model was a better fit but ignored those results and used the single composite score. Only one article (2.04%) ran a bifactor model, which we contend is the most appropriate model for multidimensional leadership measures.
Taken together, the results indicate that not only are multidimensional measures typically used in a manner that is inconsistent with the conceptualization of the intended constructs but also that DIMSmash is a widely accepted practice in the leadership literature. Indeed, the high percentage of articles that provided no justification for DIMSmash suggests that neither researchers nor reviewers view this practice as problematic.
Memory and Advisability of DIMSmash: An Example Based on LMX MDM
A memory-based approach questions the advisability of DIMSmash. We contend that researchers must consider the underlying nature of the dimensions, the item characteristics within the dimensions, and the outcomes predicted by the different dimensions prior to engaging in DIMSmash. We apply this approach using one of the leadership measures identified in the review, LMX MDM, to explore how taking memory into account might impact our decision to engage in DIMSmash and how engaging in DIMSmash despite the warning signs might change our conclusions. Our intention is not to criticize LMX, or the LMX MDM, but rather to reflect on how the measure, and other multidimensional measures, are typically used.
Next, we recruited six subject matter experts to classify the 11 LMX MDM items from Liden and Maslyn (1998) into one of two categories. The items were randomly presented to the raters, who were provided with precise definitions of the two intended categories. Specifically, each item was to be classified as either semantic or episodic.
Semantic items were defined as those that refer to a generalized impression of the leader, inferences about the leader's internal state or motives, likely future behavior, or an enduring emotional state in relation to the leader. In contrast, episodic items were defined as those that refer to specific behaviors or events that respondents could recall and mentally re-experience when responding, respondents’ self-knowledge in a particular context, or respondents’ anticipated future behavior.
The classification task was explained to all raters during a single Zoom session. Raters were guided through four practice items, and after each classification, the responses were reviewed collectively. Once the practice phase concluded and any questions were addressed, the raters completed the task independently. Of these raters, 100% classified the Contribution items as episodic whereas 33% classified any of the other items as episodic. Thus, the results replicated our classification of items.
The examination of item characteristics within the dimensions and the outcomes they predict can be used to guide the selection of the most relevant models to compare using CFA. Based on our observation that Contribution differs from the other dimensions, the most relevant comparison would be a bifactor factor model in which the global semantic factor more strongly loads on the Loyalty, Affect, and Professional Respect items than the Contribution items and the Contribution items also load on a unique factor. 3 The intercorrelations among the latent factors reported by Liden and Maslyn (1998, Figure 1) support this interpretation. The average correlation between the Contribution latent factor and the other three factors is .52, whereas the average correlation between the three non-Contribution factors is .73. These results suggest that Contribution is acting in a systematically different way than the other three dimensions. Therefore, DIMSmash may be particularly inadvisable in this situation.
But let us assume that despite all of the warning signs, we proceed with DIMSmash anyway. Our example using LMX MDM, as detailed above, shows that Contribution is the only dimension that predicts satisfaction with work. Rhemtulla et al. (2020) cautioned that when a dimension uniquely predicts a variable, collapsing the scale into a single composite score may obscure relationships with outcomes. We conducted a simulation to demonstrate this assertion.
Does DIMSmash Matter? A Simulation
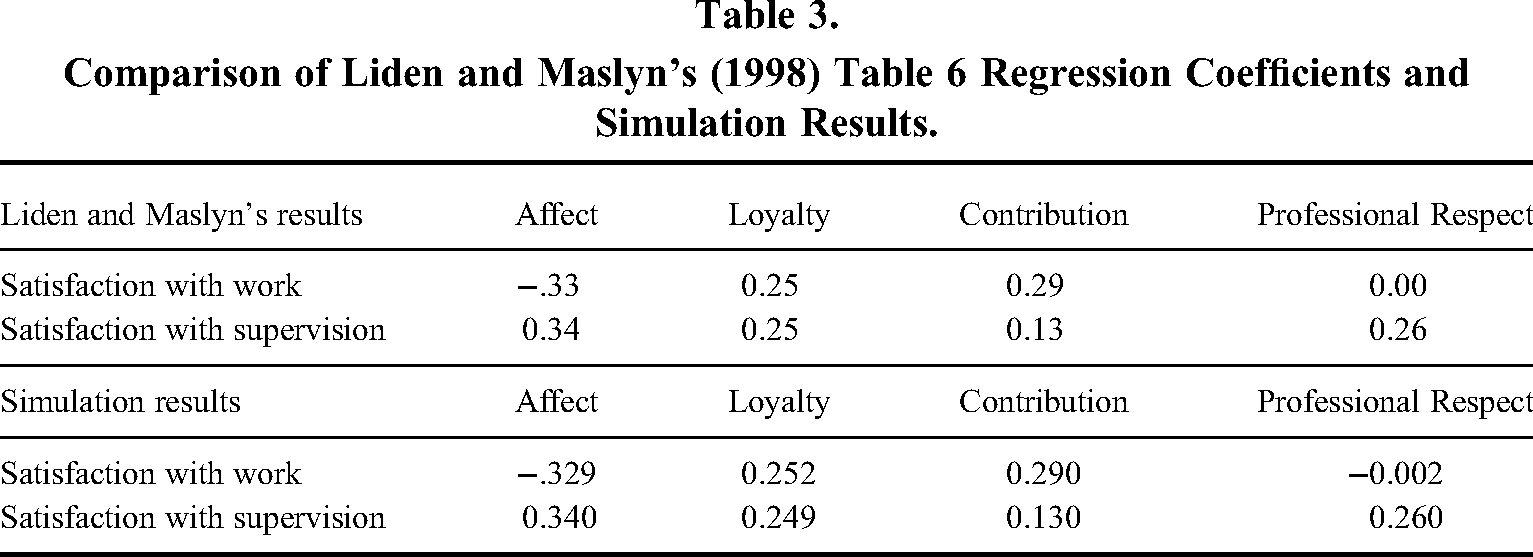
We chose the two dependent variables discussed earlier (i.e., “satisfaction with work” and “satisfaction with supervision”) to demonstrate any potential biasing effect of DIMSmash in our simulation. As shown by Liden and Maslyn (1998; see Table 6), these two variables exhibited different patterns of results with the four LMX dimensions. We used the standardized regression coefficients shown in Liden and Maslyn's Table 6 for satisfaction with work and satisfaction with supervision to generate the dependent variables in our simulation. We were able to recapture the values that Liden and Maslyn (1998) obtained for the correlations among the LMX dimensions (see Table 2) as well as the standardized regression coefficients with the dependent variables (see Table 3) in our simulation. This replication of Liden and Maslyn's (1998) results confirmed that our simulation code was working and that our results are interpretable.
Comparison of Liden and Maslyn's (1998) Table 5 Correlations among the LMX Dimensions and Simulation Results.
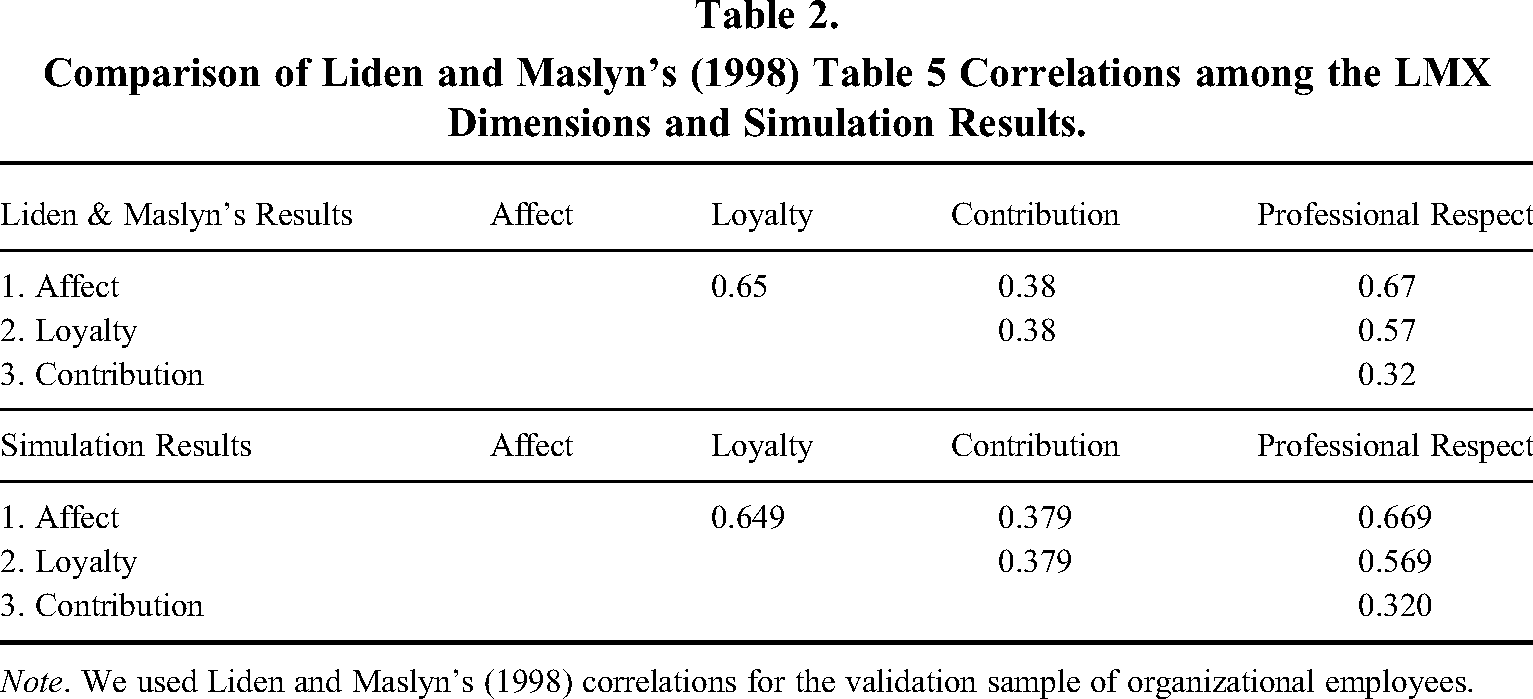
Note. We used Liden and Maslyn's (1998) correlations for the validation sample of organizational employees.
Comparison of Liden and Maslyn's (1998) Table 6 Regression Coefficients and Simulation Results.
Next, we used RStudio 2025.05.0+496 “Mariposa Orchid” Release for Windows to run our simulation. One of the authors of this paper wrote the R code for this simulation (see Appendix C). Our results are based on the same sample size as the Liden and Maslyn (1998) validation sample of organizational employees (n = 249) per sample, and we randomly generated 50,000 samples. After generating the data for the variables, we committed DIMSmash in two ways. First, we combined the four LMX dimensions into a single composite by simply averaging the dimension scores together into a single score. In the original scale development study, the four LMX dimensions differed in terms of the number of items used to measure each dimension; the Contribution dimension was measured with two items whereas all the other LMX dimensions had three items. When the number of items for each dimension varies, the overall score more strongly reflects the dimensions with the most items. Therefore, we also created a differentially weighted composite to equally reflect all dimensions. The second composite score, hereafter referred to as the differentially weighted composite, was created by differentially weighting each LMX dimension by the number of items in that dimension. We correlated the two composite scores with the dependent variables and recorded the results. We repeated this process 50,000 times. Our results represent the average correlations obtained across the 50,000 replication samples.
The opposite result was obtained with satisfaction with supervision as the criterion. Both the Unit Composite and the Differentially Weighted Composite showed significant correlations with this dependent variable (Unit Composite:
Although we focused on how dimensions based on different types of memory are related to different outcomes, it should be noted that there may be other reasons why the dimensions relate to outcomes. For example, Liden and Maslyn (1998) reported that both Loyalty and Contribution were related to leader-rated performance. This is likely because they reflect different aspects of performance (e.g., relationships and task) that are associated with both semantic and episodic memory. However, the association between Loyalty and leader-rated performance (.48) is much higher than the association between Contribution and leader-rated performance (.32). DIMSmash would have obscured this distinction. The Contribution dimension items center on the follower's self-reported behavior. Therefore, another possibility is that social desirability or self-presentational concerns may be driving the Contribution results. However, as pointed out by Liden and Maslyn (1998) while Contribution was significantly related to social desirability (.16, p < .05), it was not practically significant nor were any of the correlations between social desirability and Affect, Loyalty, and Professional Respect significant. Moreover, the reported means of Contribution were similar to those of the other dimensions, which suggests that Contribution was not inflated by impression management.
To illustrate what the bifactor model does and how it shows the specific dimensions independent from the common factor, we applied this model using data generated based on Liden and Maslyn’s (1998) LMX MDM data. Liden and Maslyn (1998) reported that their data fit the correlated first-order CFA model in Figure 1. We used the standardized coefficients in this figure to generate simulated data that conformed to their original data. We chose a bifactor model because Edwards (2001) argued that it is the most appropriate model for superordinate multidimensional theories.
We used R Studio 2025.05.0+496 “Mariposa Orchid” Release for Windows to run our simulation, and one of the authors of this paper wrote the R code for this simulation (see Appendix D). The program generated 500 observations using the standardized coefficients shown in Liden and Maslyn's Figure 1. Before examining what happens when the bifactor model is applied to this simulated data, we needed to verify that this R code worked properly. We did this by fitting the generated data back to Liden and Maslyn's (1998) Figure 1 correlated first-order CFA model. We expected that the simulated data would fit exceptionally well. As shown in Figure 2, the fit of the correlated first-order factor model was almost perfect. The obtained factor loadings closely converged to those reported by Liden and Maslyn (average discrepancy = −0.002, min/max discrepancy = −0.057 to 0.038) as did the correlation between the first-order factors (average discrepancy = 0.0135, min/max discrepancy = −0.03 to 0.041). Therefore, we concluded that our R code worked correctly and generated data corresponding to Liden and Maslyn's (1998) data.
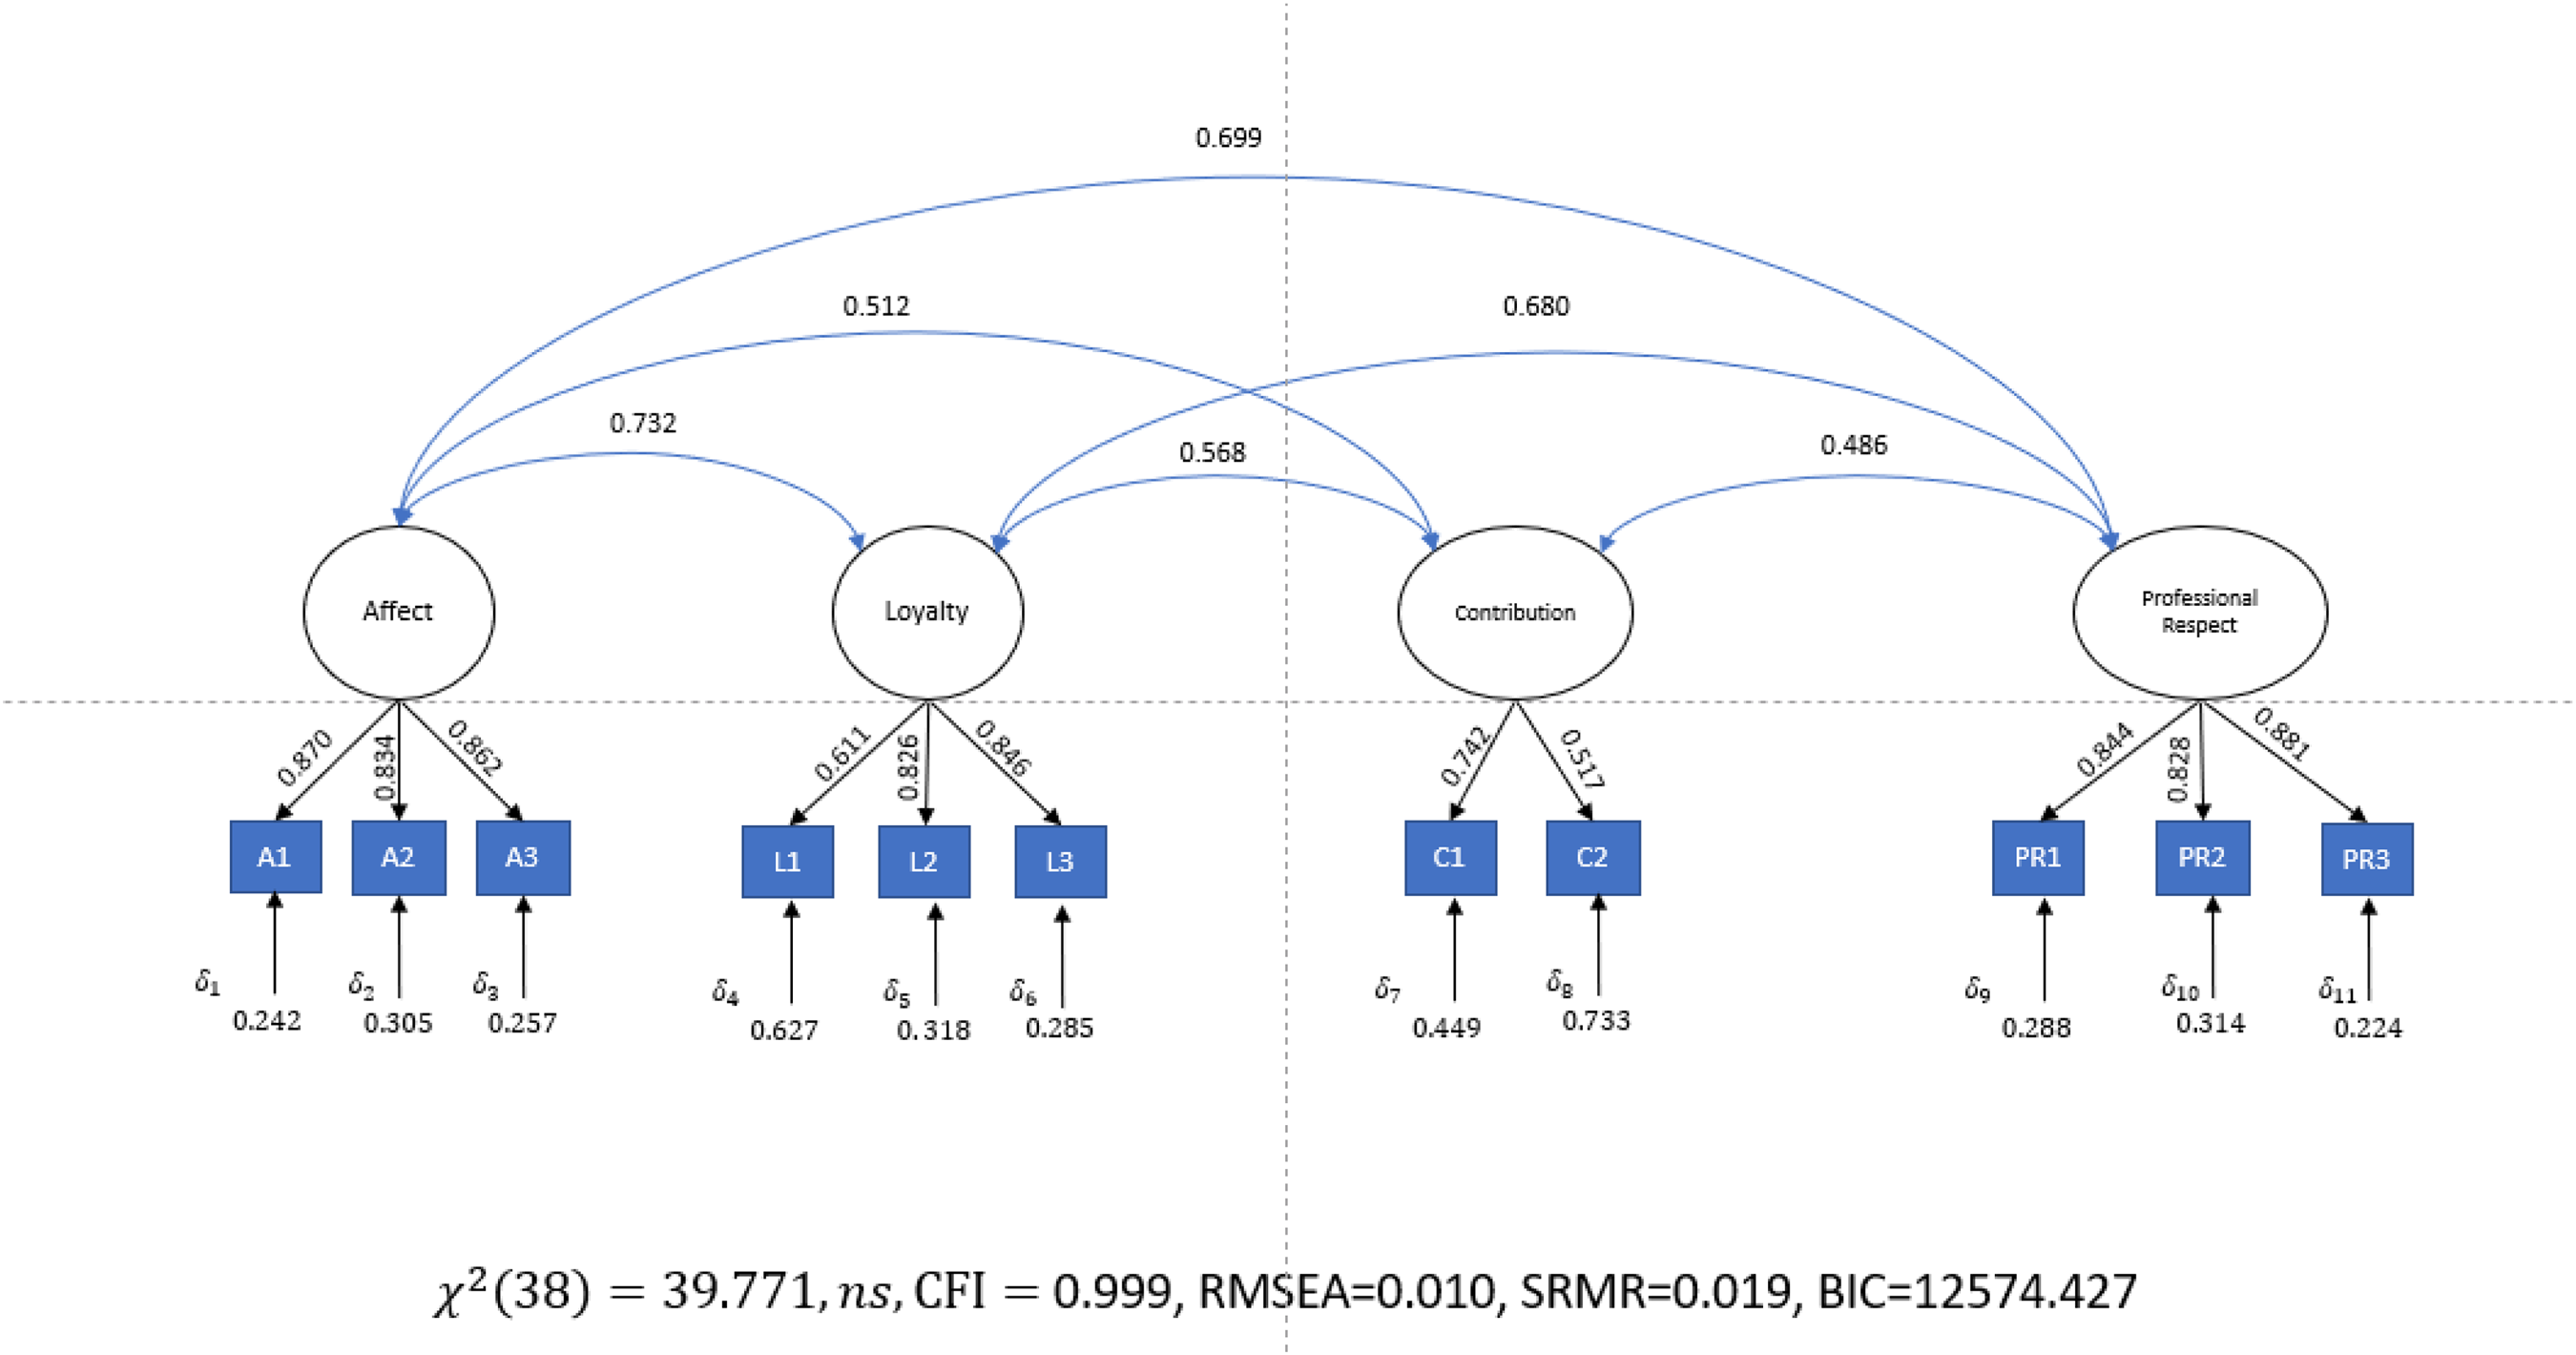
Results for Correlated First-order Confirmatory Factor Analysis (CFA) to Confirm Appendix D Program is Working. Note. BIC = Bayesian information criterion; CFI = comparative fit index; RMSEA = root mean square error of approximation; SRMR = standardized root mean square residual.
Next, we applied the bifactor model to these data. As shown in Figure 3, the fit of this model was almost identical to the correlated first-order factor model. Comparing the fit of the correlated first-order model to the fit of the bifactor model reveals a non-significant difference between these models (
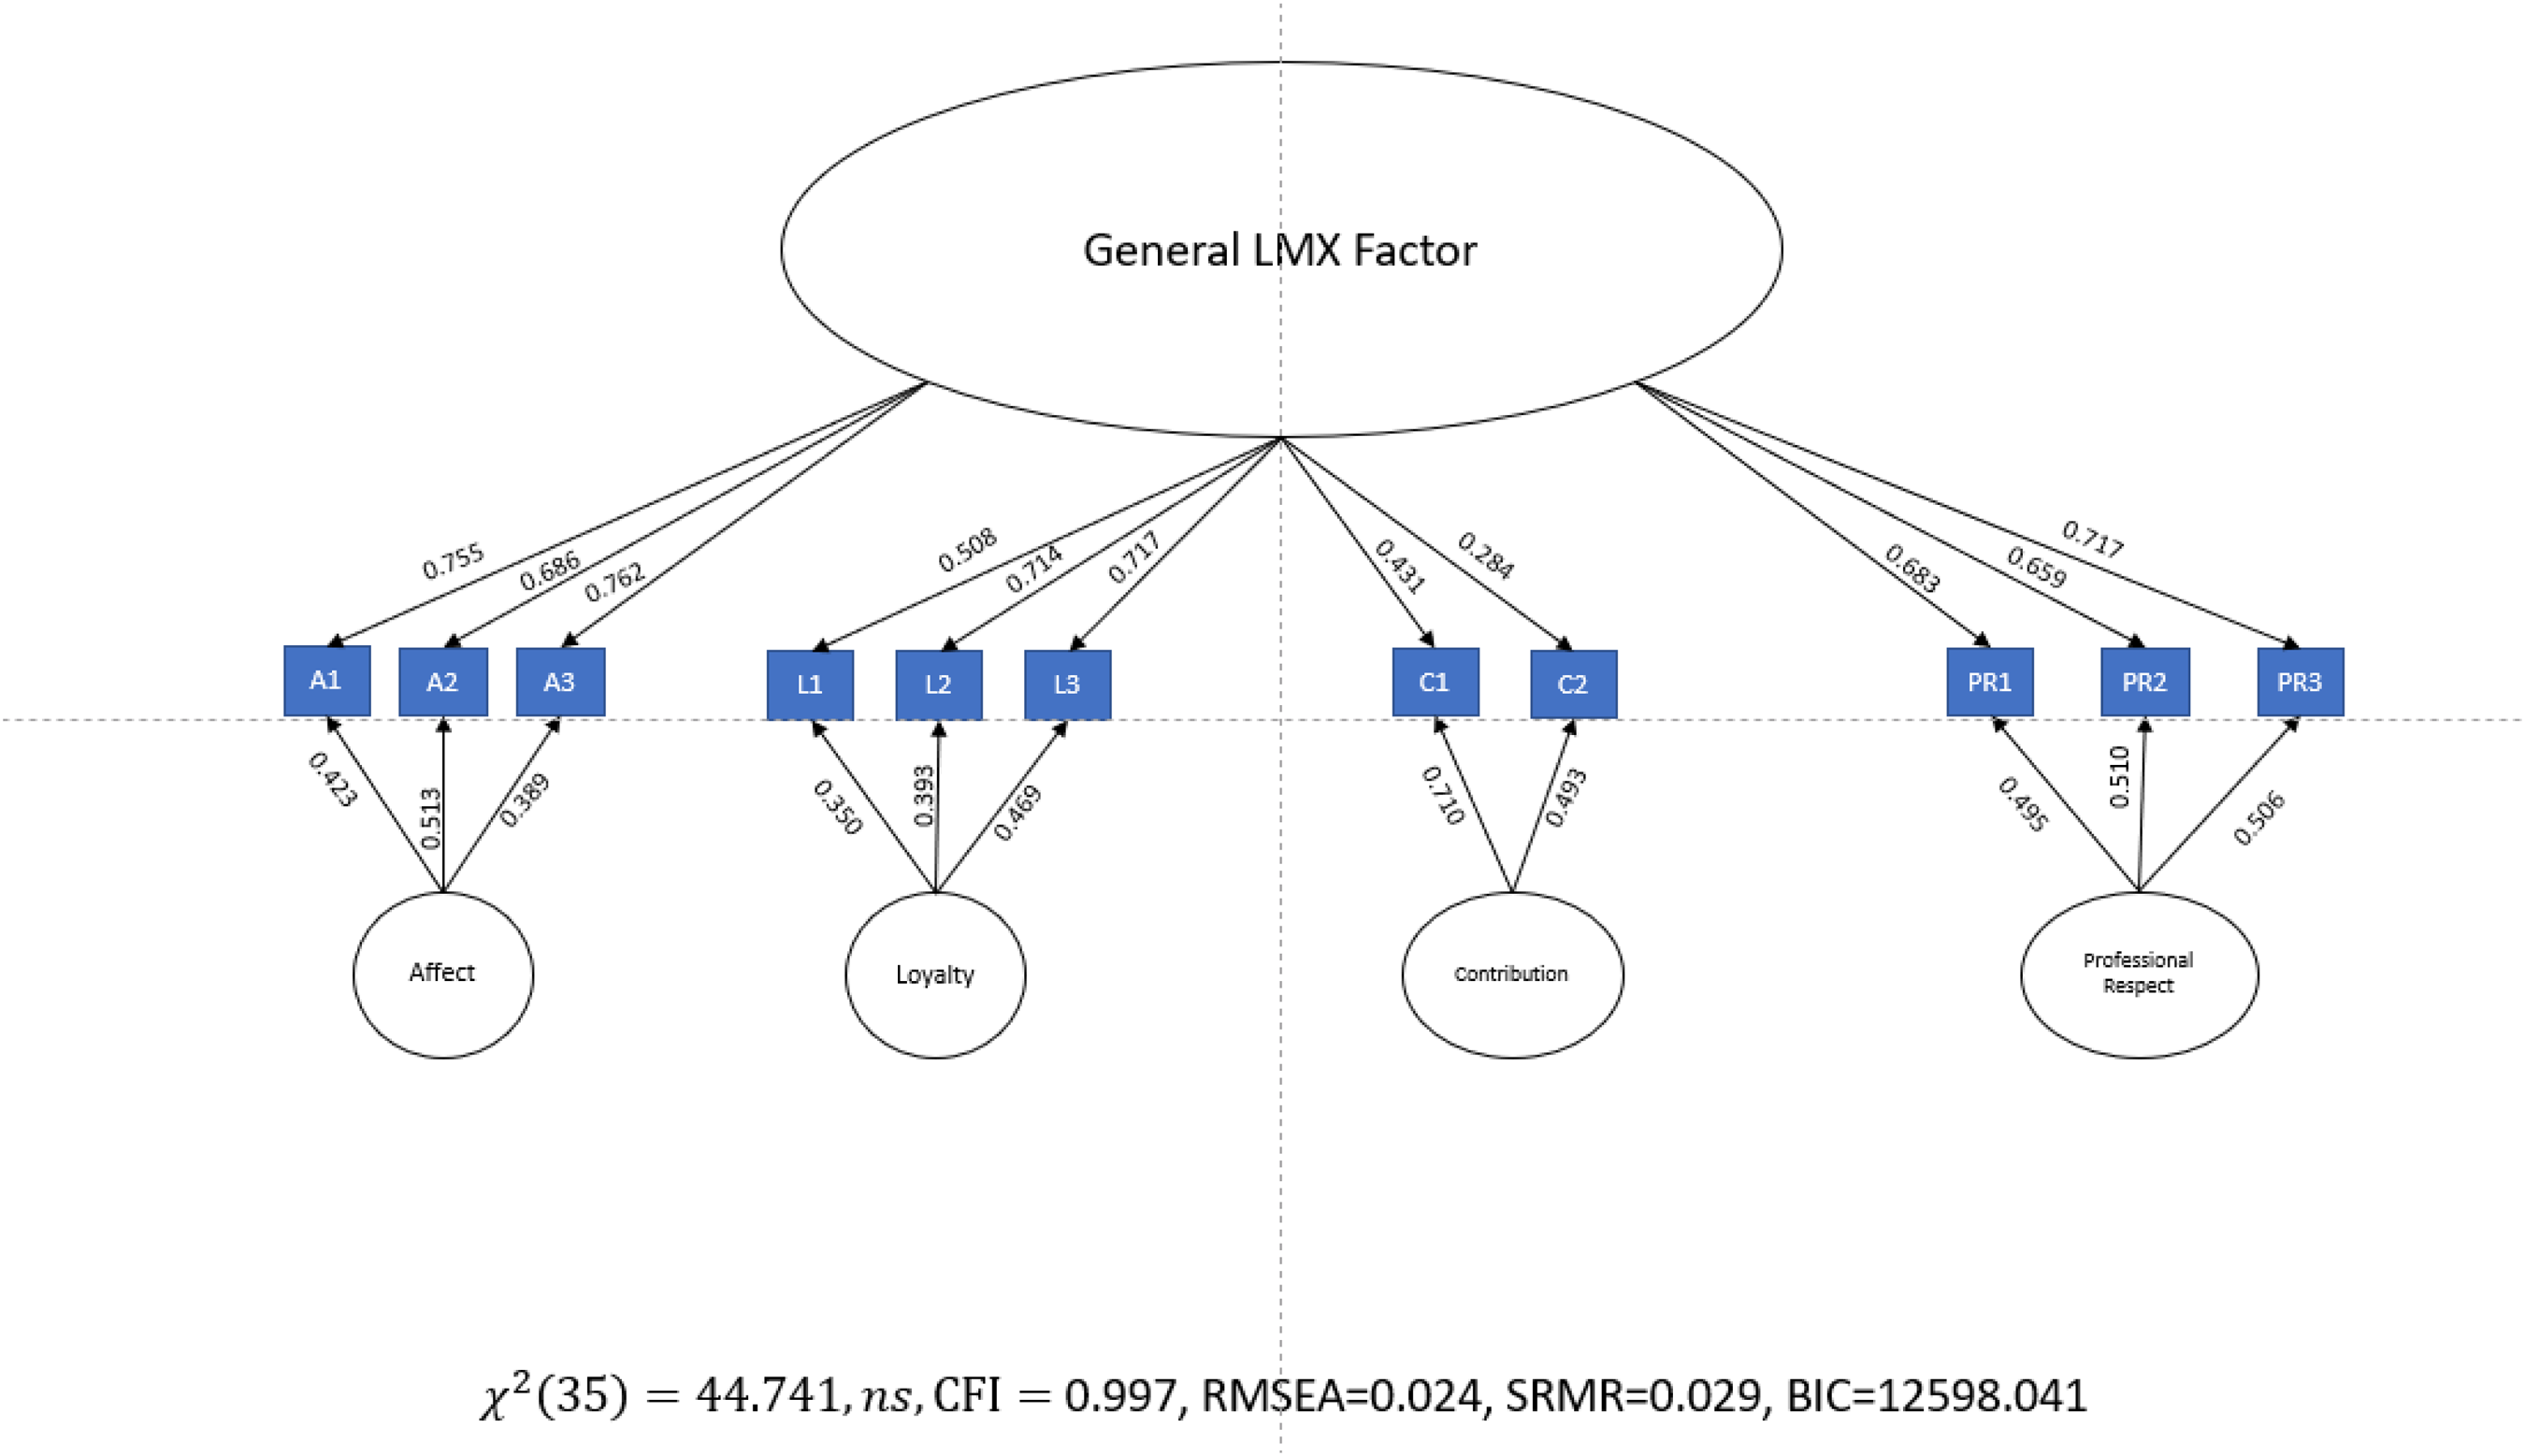
Results for Bifactor Confirmatory Factor Analysis (CFA) Using the Simulated Liden and Maslyn (1998) data. Note. BIC = Bayesian information criterion; CFI = comparative fit index; LMX = leader–member exchange; RMSEA = root mean square error of approximation; SRMR = standardized root mean square residual.
Discussion
Researchers inadvertently engage in practices that undermine validity. We contend that this stems from a failure to recognize that behavioral and nonbehavioral items reflect two very different memory processes and predict different outcomes. The ubiquitous practice of smashing dimensions based on semantic and episodic memory into a single composite score (DIMSmash) compounds this problem even further. Indeed, 89% of the articles examined in our review collapsed multidimensional measures into a single composite score. Not only was DIMSmash pervasive across all of the measures examined, over 75% of the studies either offered no justification for doing so or observed that it was consistent with prior practice. However, DIMSmash undermines theory testing because it no longer represents the theory as intended. Going forward, we contend that researchers must provide more rigorous evidence (or any!) prior to DIMSmash. Failure to address the issue or simply observing that “everybody does it” is insufficient. Moreover, we call on reviewers to request compelling justification for DIMSmash.
Taking memory into account questions the advisability of DIMSmash. As shown in our example using LMX MDM, examining the intended nature of the underlying dimensions, item characteristics within each dimension, and the outcomes predicted by the different dimensions indicates that Contribution is acting in a systematically different way from that of the other dimensions. Therefore, this observation suggests that DIMSmash is ill-advised. As previously noted, collapsing a multidimensional measure into a single composite score conflates different types of memory and obscures relationships with dependent variables, resulting in incorrect conclusions.
Our simulation, based on Liden and Maslyn's (1998) data, highlights this point. Because Contribution is the only dimension that predicts satisfaction with work, DIMSmash obscures this relationship. Conversely, DIMSmash heightens the relationship with satisfaction with supervision because three of the four dimensions predict satisfaction with supervision, while Contribution is poorly correlated with the other dimensions as well as the dependent variable. In contrast, we contend that a bifactor model represents the theory as intended and will not yield misleading results because it shows the influence of the different dimensions on outcomes apart from that of the common factor.
Although our focus here was on the use of multidimensional leadership scales, our concerns regarding DIMSmash also apply to dependent variables such as organizational citizenship behaviors (OCBs). This is particularly relevant because OCBs are often used as a key outcome linked to leadership. If both multidimensional scales are smashed, the interpretation of the results becomes muddied. This issue also applies beyond the leadership domain. For example, general intelligence is often conceptualized as having both crystallized and fluid components, which show only modest correlations and predict different criteria. Furthermore, fluid intelligence declines with advancing age whereas crystallized intelligence is more stable (Allen et al., 2008; Persson & Nyberg, 2008). Yet these dimensions are typically combined into a G factor.
Nevertheless, DIMSmash appears to be the rule rather than the exception. It should be noted that the implications of the routine practice of DIMSmash are not trivial and extend well beyond a single study. For example, because relationships with key dependent variables may be obscured, researchers may erroneously conclude that portions of the theories they intended to test are not supported. Multiplied over many studies, DIMSmash raises significant concerns about whether we know what we think we know about the effect of leadership on outcomes. Meta-analyses composed of studies that use DIMSmashed composites may yield true scores that are entirely meaningless and uninterpretable because they do not represent the theory as intended. Moreover, there may be cascading effects when measures subjected to DIMSmash are used to provide evidence of construct validity/discriminant validity for new scale development. In the next section, we provide recommendations to consider prior to DIMSmash, which can be applied to many areas of organizational science.
Recommendations to Consider Prior to DIMSmash
Future Research and Implications
Tulving (1985) proposed that raters have metacognitions about memory and can distinguish between ratings based on episodic memory, referred to as remember judgments, and those based on semantic memory, referred to as know judgments. The cognitive neuroscience literature has shown that episodic and semantic memories align with remember and know judgments (Diana et al., 2006, 2007). For example, Martell and Evans (2005) asked raters to indicate after responding to each item whether their response was based on a vivid recollection of a specific event (remember judgment) or was based on a general feeling or impression (know judgment). This technique could be used in scale development to identify items that are more likely to be associated with episodic or semantic memory. Think-aloud protocols are another technique that relies on rater metacognition. This technique can provide insight into peoples’ cognitive processes and responses as they complete items. For example, Erickan et al. (2010) applied the think-aloud protocol to identify and confirm sources that contribute to differential item functioning (DIF) in standardized assessments. However, concerns have been raised that asking people to reflect on their cognitive processes changes them (i.e., reactivity). This seems particularly relevant if we want to determine whether responses are based on automatic processes (e.g., schemas) or recollection of specific leader behaviors, because asking people to report their cognitive processes may move them away from default semantic memory processes. Furthermore, it should be noted that there is a lag between brain activity and free recall; put differently, free recall is an afterthought. As shown by Fried (2022), neurons in the hippocampus that code for a specific episodic memory activate 1 to 2 s before a person becomes aware of recalling that memory.
Response times may offer another helpful technique to identify different memory processes. For example, response times have been widely used in educational testing to identify when people are guessing (e.g., Sireci et al., 2008). Generally, search time in the memory literature is conceptualized as the time between the presentation of the memory probe (item to be recalled or items to be rated) and the initiation of the response to items. Because semantic memory is based on automatic associations, responses based on semantic memory should be shorter than those based on episodic memory. Consistent with this expectation, Dehaene (2014) found a key boundary between local, automatic, and conscious brain-scale processes occurred around 300 ms. Therefore, in terms of scale development, responses that are less than 300 ms are more likely to be associated with semantic memory. However, it is important to note that the relationship between response time and memory is unlikely to be linear. Memory search requires time and effort. If people are unable to recall a specific behavior, at some point they will give up and rely on a gut feeling (e.g., semantic memory). As observed by De Boeck and Jeon (2019, p. 8), “Early on in the response process the cost of spending more time is compensated by an increasing chance to find the correct response, but the longer it takes to find the correct response, the higher the cost becomes while the perceived chance of finding the correct response may decrease so that the expectation of a correct response no longer compensates for the cost of effort.”
Finally, the use of physiological measures might provide useful information regarding the memory source of items. Pupillometry measures the diameter of participants’ pupils over time and has been used to reflect both emotional arousal (Laeng et al., 2012) and cognitive effort (Kahneman & Beatty, 1966). Research has shown pupil dilation increases when episodic memories are activated as the activation of these memories requires greater cognitive load (Goldinger & Papesh, 2012). Therefore, pupillometry may provide confirmation that items elicit the intended memory processes. Neurological measures, such as EEG, can also be used to capture neural activation in the moment when people respond to items to examine the impact of item characteristics on the memory source. Neurological data enable researchers to obtain a more direct measure of response processes rather than an indirect proxy such as verbal protocols. Because the cognitive networks involved in episodic memory differ from those typical of semantic memory, indications of what brain systems initiate a rater's response to an item can be a helpful indicator of the memory source. Although the neurocognitive literature has primarily relied on functional magnetic resonance imaging (Diana et al., 2007), recent developments in neuroimaging suggest that less invasive devices, such as magnetoencephalography (MEG) recording using an external cap, can detect activation of core neural processes (Pizzo et al., 2019). Neuroimaging data could also be used to understand how specific incidents (i.e., episodic memory) get consolidated into semantic memory and how those memories are accessed at a later time. Taken together, these techniques may be useful to inform scale development and validation as well as the development “purer” scales (Fischer, 2023; Hansbrough et al., 2021) composed of items that reflect the same memory source.
Conclusion
We hope that our discussion will help researchers to recognize the meaningful distinction between items based on different types of memory and stop the widespread practice of collapsing dimensions that are intended to represent multidimensional constructs into a single composite score (DIMSmash) which creates significant misalignment between theory and method. Put differently, when researchers engage in DIMSmash they may be testing a different theory rather than the theory that is assumed. Moreover, as shown by our simulation, DIMSmash is inadvisable because it can produce misleading results. Multiplied over many studies, the practice of DIMSmash raises significant concerns about whether we know what we think we know about the effect of leadership on outcomes. In conclusion, we can no longer assume that items across different dimensions are equivalent and act on that assumption by smashing multidimensional scales into a single composite score. It is time for us to begin the cleanup.
Footnotes
Funding
The authors disclosed receipt of the following financial support for the research, authorship, and/or publication of this article: This research is supported by the grant, “Rater Memory: The Missing Link to Improve Measurement and Validity” (W911NF-23-1-0336) U.S. Army Research Institute for the Behavioral and Social Sciences (ARI) awarded to the first and second authors and “Advancing Leadership Research” (W911NF-18-2-0049) U.S. Army Research Institute for the Behavioral and Social Sciences (ARI) awarded to the third author. The views, opinions, and/or findings contained in this paper are those of the authors and shall not be construed as an official Department of the Army position, policy, or decision unless so designated by other documents.
Notes
Appendix C
This is the R-code used to run the simulation described in the paper.
#
#
#
#
Sat_Work = −0.33*val_datz[,1] + 0.25*val_datz[,2] + .29*val_datz[,3] + .0*val_datz[,4] + (sqrt(1 − 0.098181818))*rnorm(samplesize,0,1.18)
Sat_Sup = 0.34*val_datz[,1] + 0.25*val_datz[,2] + .13*val_datz[,3] + .26*val_datz[,4] + (sqrt(1 − 0.671538462))*rnorm(samplesize,0,1)
#
#
#
#
#
Appendix D
dat < - rnorm_multi(n = samplen,
mu = c(0, 0, 0, 0),
sd = c(1, 1, 1, 1),
r = c(0.763, 0.544, 0.74, 0.563, 0.692, 0.456),
varnames = c(“Affect”, “Loyalty”, “Contribution”, “PRespect”),
empirical = FALSE)
dat$A1 = .851*dat$Affect + sqrt(.275)*rnorm(samplen,0,1)
dat$A2 = .864*dat$Affect + sqrt(.254)*rnorm(samplen,0,1)
dat$A3 = .875*dat$Affect + sqrt(.234)*rnorm(samplen,0,1)
dat$L1 = .554*dat$Loyalty + sqrt(.693)*rnorm(samplen,0,1)
dat$L2 = .775*dat$Loyalty + sqrt(.400)*rnorm(samplen,0,1)
dat$L3 = .856*dat$Loyalty + sqrt(.267)*rnorm(samplen,0,1)
dat$C1 = .738*dat$Contribution + sqrt(.455)*rnorm(samplen,0,1)
dat$C2 = .551*dat$Contribution + sqrt(.697)*rnorm(samplen,0,1)
dat$PR1 = .846*dat$PRespect + sqrt(.285)*rnorm(samplen,0,1)
dat$PR2 = .866*dat$PRespect + sqrt(.251)*rnorm(samplen,0,1)
dat$PR3 = .867*dat$PRespect + sqrt(.248)*rnorm(samplen,0,1)
model.1st = ‘# Factors
L_Affect =∼ A1 + A2 + A3
L_Loyalty =∼ L1 + L2 + L3
L_Contrib =∼ C1 + C2
L_ProfRespect =∼ PR1 + PR2 + PR3’
fit_1st < - cfa(model.1st, data = dat, std.lv = TRUE, information=“observed”)
summary(fit_1st, fit.measures = TRUE, standardized = TRUE)
model.bi < - ‘
# Specific factors
L_Affect =∼ A1 + A2 + A3
L_Loyalty =∼ L1 + L2 + L3
L_Contrib =∼ 0.78*C1 + 0.512*C2
L_PR =∼ PR1 + PR2 + PR3
# General factor
LMX =∼ A1 + A2 + A3 + L1 + L2 + L3 + C1 + C2 + PR1 + PR2 + PR3
# Orthogonality constraints (bifactor structure)
LMX ∼∼ 0*L_Contrib
LMX ∼∼ 0*L_Affect
LMX ∼∼ 0*L_Loyalty
LMX ∼∼ 0*L_PR
L_Contrib ∼∼ 0*L_Affect
L_Contrib ∼∼ 0*L_Loyalty
L_Contrib ∼∼ 0*L_PR
L_Affect ∼∼ 0*L_Loyalty
L_Affect ∼∼ 0*L_PR
L_Loyalty ∼∼ 0*L_PR’
fit_bi < - cfa(model.bi, data = dat, std.lv = TRUE, information = "observed”)
summary(fit_bi, fit.measures = TRUE, standardized = TRUE)
anova(fit_1st, fit_bi)