






Abstract
All-optical thermometry using nano- and submicron diamond particles containing negatively charged nitrogen vacancy (NV−) centers enables high-sensitivity temperature sensing at the microscale. However, its extension to imaging with temporal resolution has been limited by the requirement for picometer-level accuracy in wavelength determination. We developed an optical fiber-bundle-based imaging thermometry system that simultaneously acquires zero-phonon line spectra from multiple spatial channels and resolves their peak wavelength shifts using a high-dispersion Czerny–Turner spectrometer with in situ wavelength calibration. The total wavelength uncertainty was reduced to 4–6 pm, corresponding to a temperature accuracy of 0.4–0.6 °C at 25.0 °C. Imaging thermometry was demonstrated for an ensemble of submicron diamond particles at 34.0 °C and 40.0 °C.
This is a visual representation of the abstract.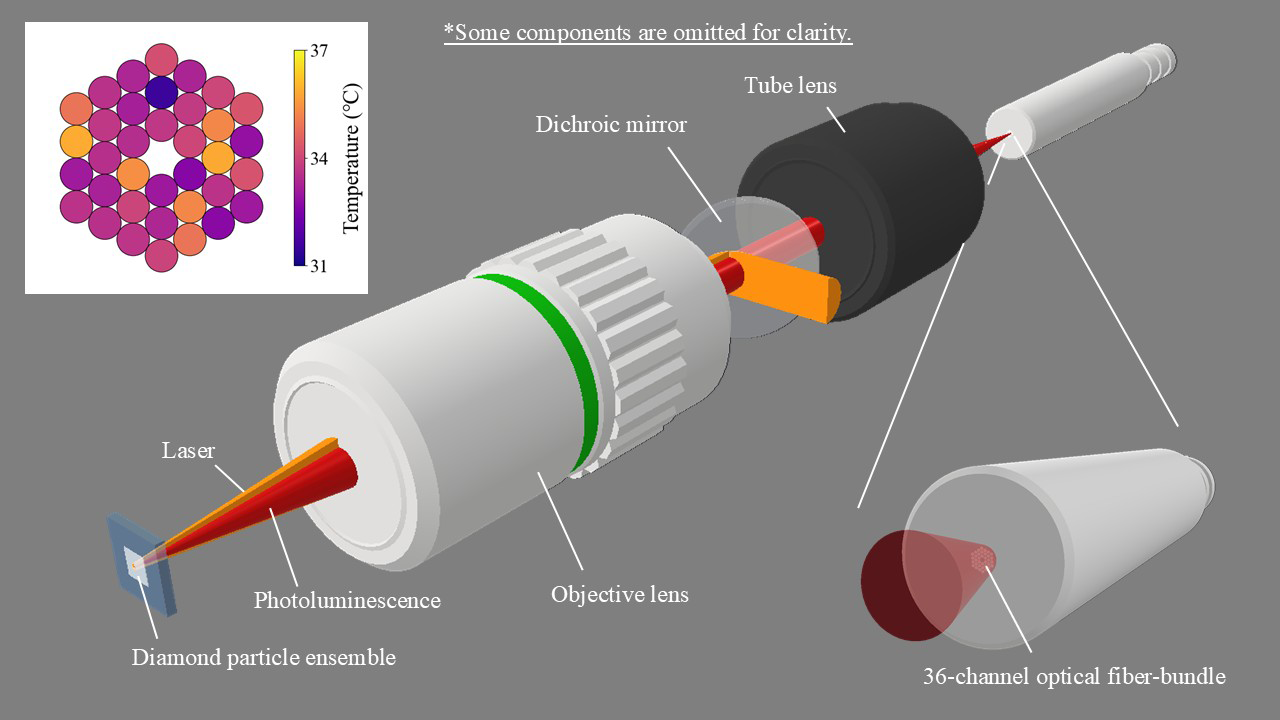
Keywords
Introduction
All-optical thermometry using nano- and submicrometer diamond particles has been proposed as an alternative to conventional optically detected magnetic resonance thermometry owing to its experimental simplicity and comparable sensitivity at room temperature (25 °C). The method is based on the temperature dependence of the zero-phonon line (ZPL) spectrum (Figure 1), including a redshift of the peak wavelength,1,2 line broadening, 3 and a reduction of the Debye–Waller factor 4 with increasing temperature. Among these spectral variations, the peak wavelength shift is most widely used because it is less susceptible to sensitivity-calibration errors. It has been applied to a wide variety of targets, such as metallic wires, 5 cellular environments,6,7 microfluidic devices, 8 cryogenic substrates, 9 and microscope stages, 10 and including this study, the temperature sensitivity near room temperature has been reported to be 10–19 pm/ °C.
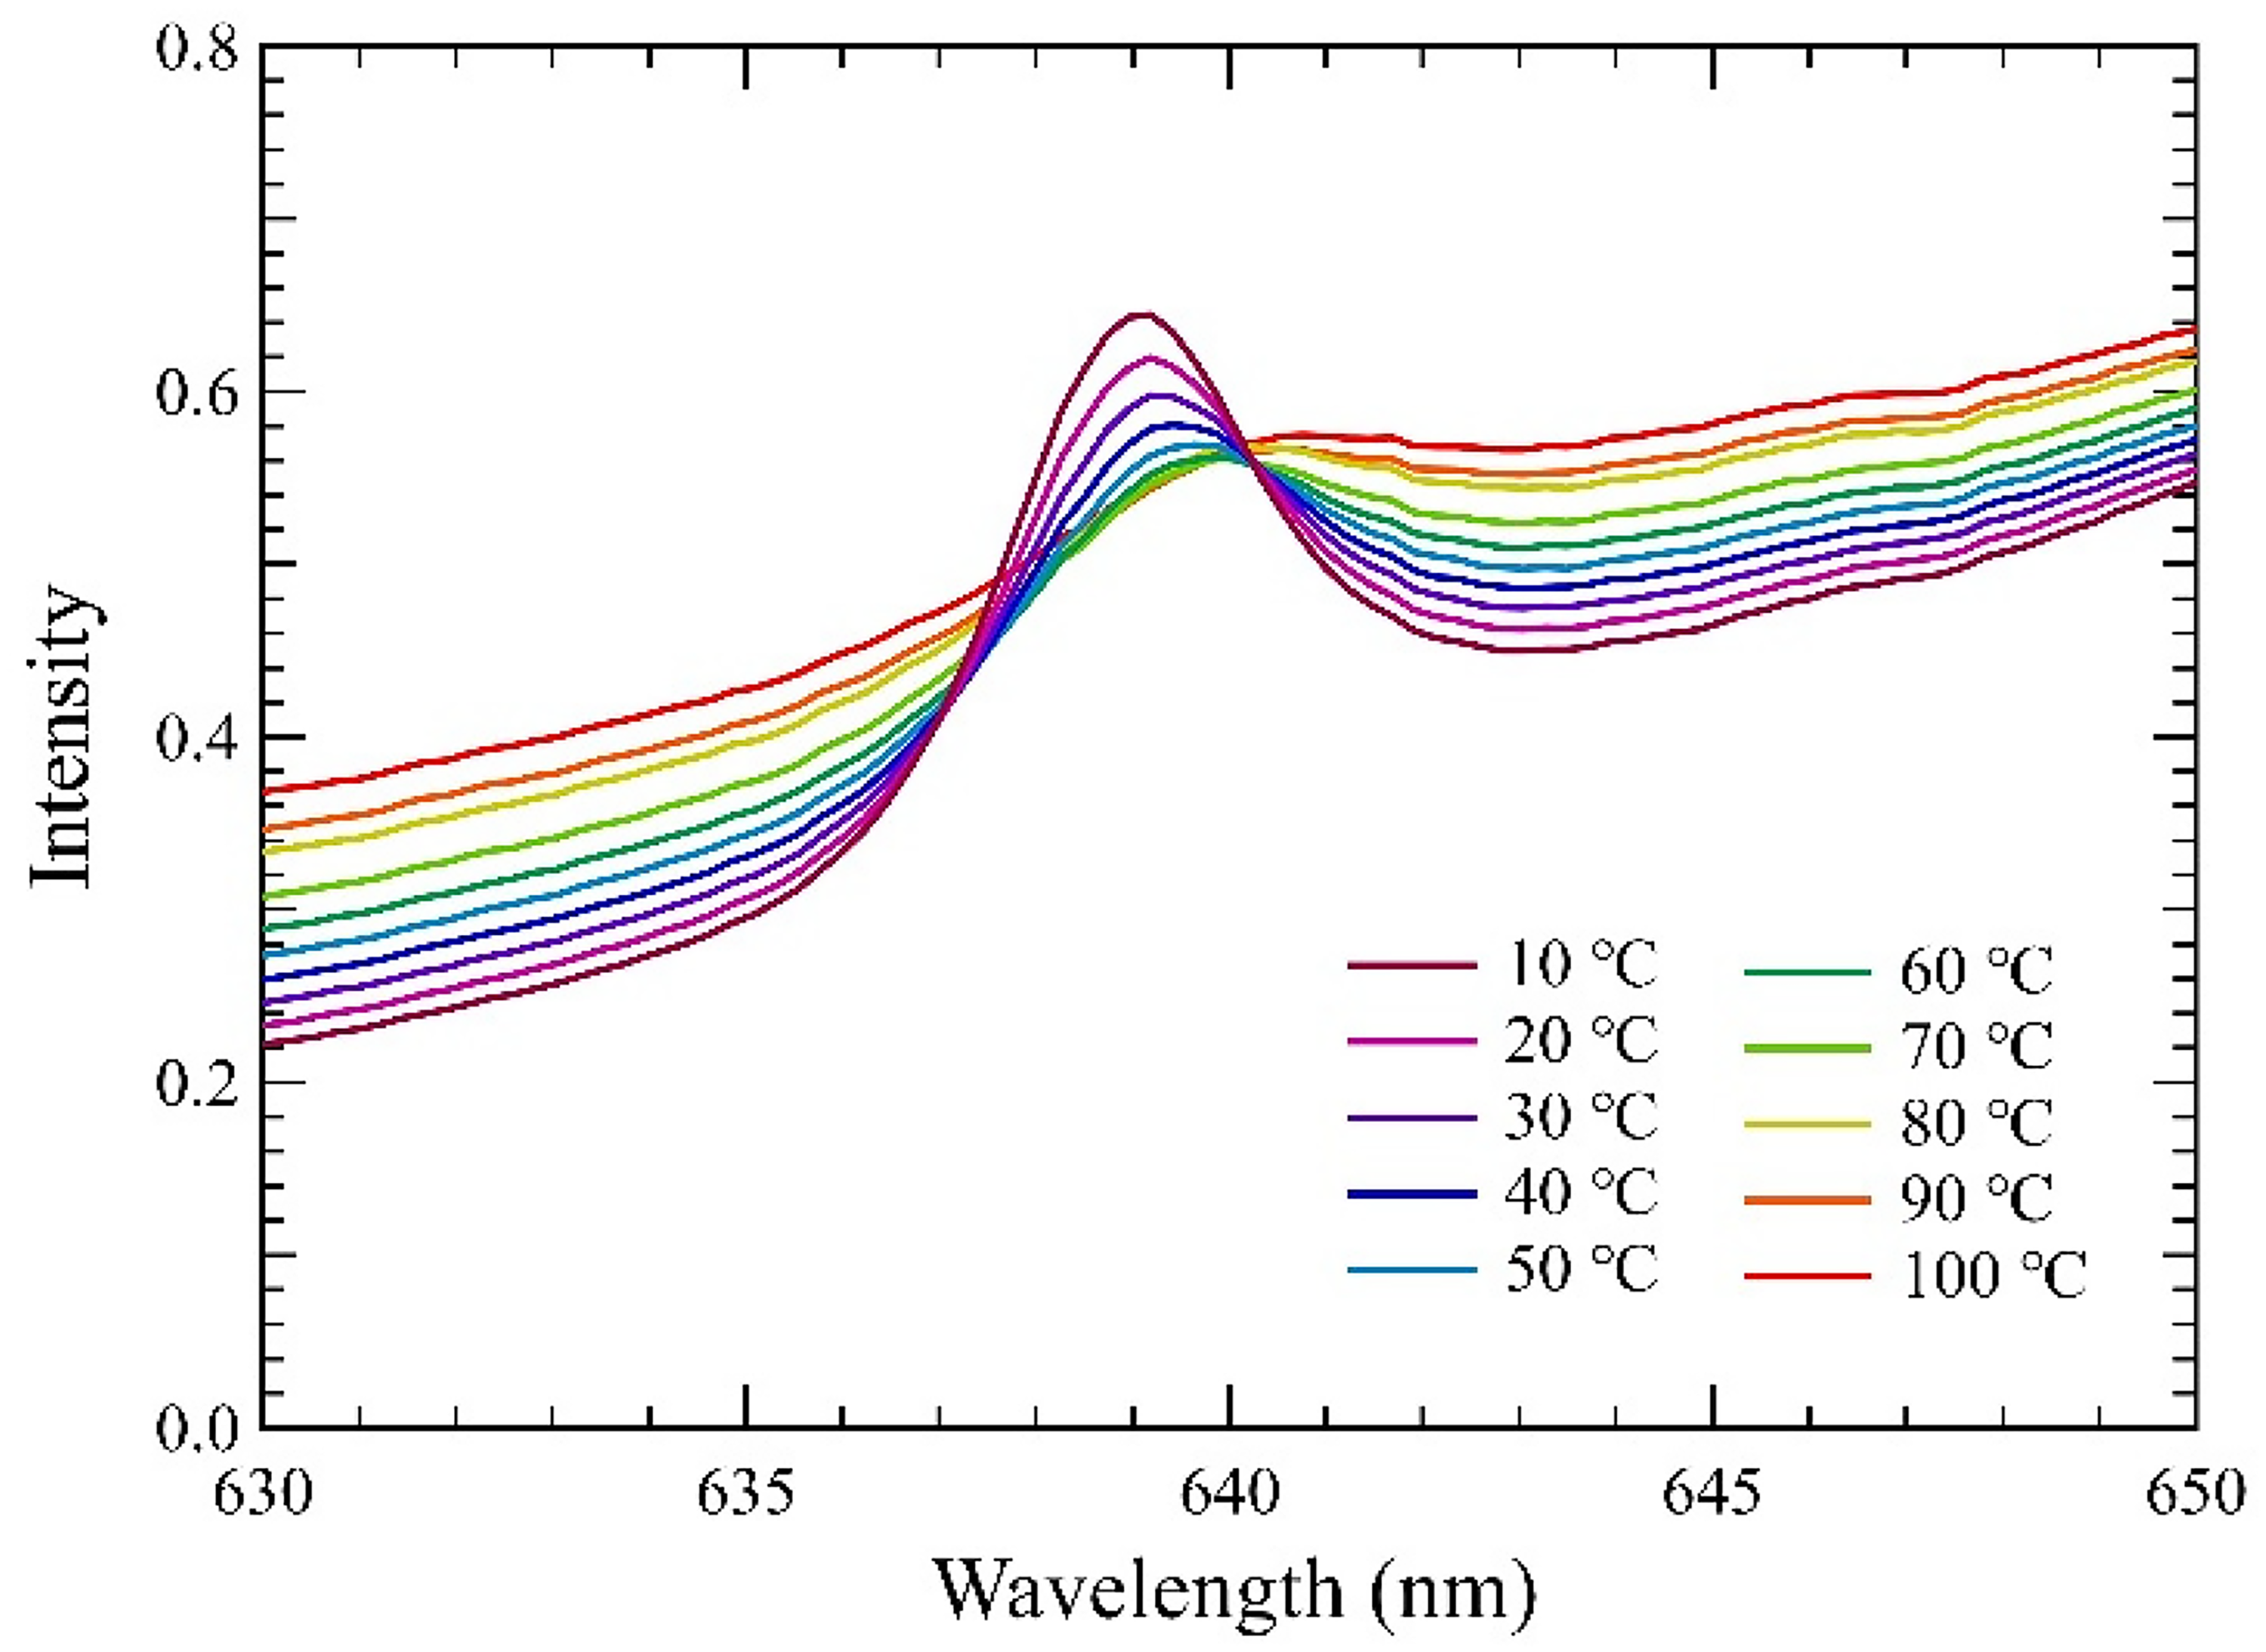
Temperature dependence of the ZPL spectrum of a bulk diamond (Element Six diamond nitrogen vacancy (DNV)-B1; 300 parts per billion NV content) measured over the range of 10–100 °C with a wavelength resolution of 1.5 nm.
In these applications, a temperature accuracy better than 1 °C is typically required, corresponding to a ZPL peak wavelength determination accuracy of better than 10–19 pm. To achieve such high wavelength accuracy, the ZPL spectrum has been measured at a single spatial channel using a spectrometer, and the spatial distribution has been obtained by scanning the measurement position. This approach, however, requires a long acquisition time to cover a wide spatial region. If simultaneous multichannel measurement becomes feasible, it is expected to significantly reduce the acquisition time for a wide spatial region measurement and to provide a tool for studies of heat conduction.
Motivated by this expectation, we developed a system that can simultaneously measure at 36 spatial channels, enabling discretized temperature imaging, in which each channel corresponds to a spatial sampling point, with a ZPL peak wavelength determination accuracy better than 6 pm. The system performs in situ wavelength calibration by simultaneously acquiring the ZPL and the wavelength reference spectra, which in principle enables higher wavelength accuracy than pre- or postexperiment calibration. The purpose of this study is to show the system performance for multichannel measurement with picometer-level accuracy in wavelength determination.
Experimental
Optical Fiber-Bundle-Based Imaging Thermometry System
A schematic of the system is shown in Fig. 2. In this system, the microscope field of view (FoV) is spatially discretized and imaged through an optical fiber bundle. The spectra of the light collected by the individual fibers are simultaneously recorded using a high-dispersion Czerny–Turner spectrometer. In contrast to previously reported systems,11,12 a wavelength reference light source is measured simultaneously to improve the wavelength accuracy, and a high-throughput spectrometer is employed to enhance the light-collection efficiency.
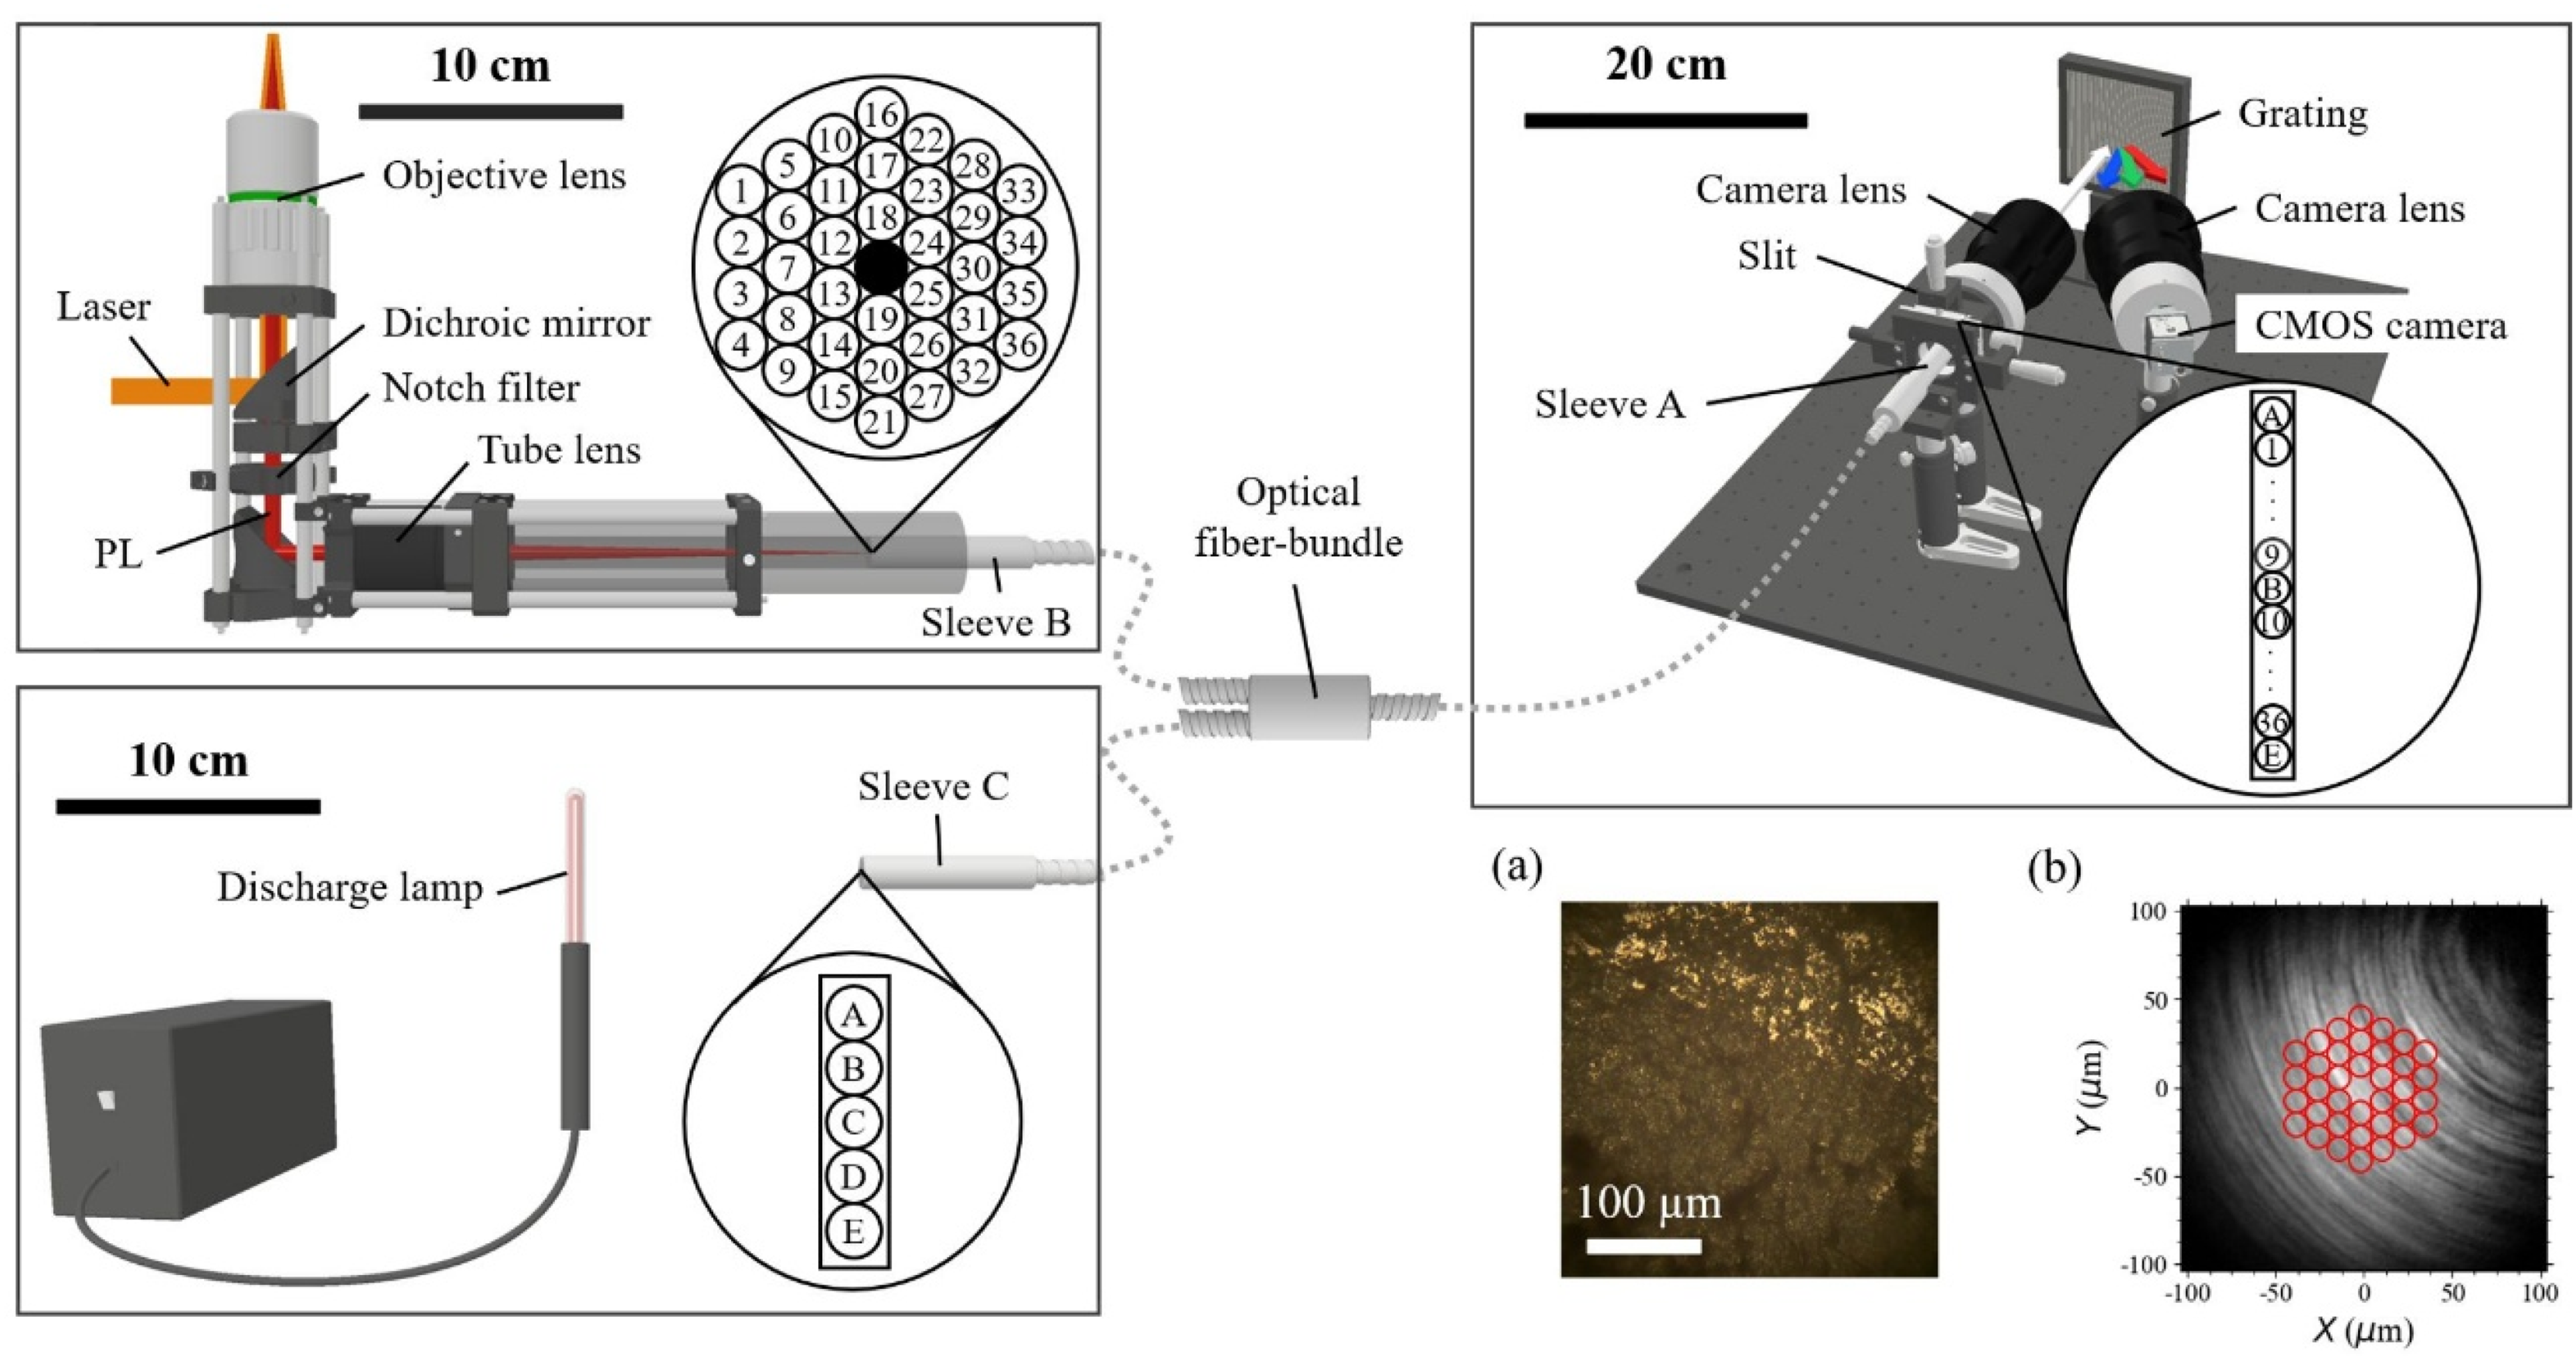
Schematic illustration of the optical fiber-bundle-based imaging thermometry system. The insets show (a) a microscope image of an ensemble of sub-micrometer diamond particles with an average diameter of 750 nm and (b) the laser intensity profile at the sample plane with a schematic of the hexagonal FoV.
The system consists of an epifluorescence microscope coupled to a Czerny–Turner spectrometer. A 594 nm diode laser (Cobolt Mambo; 50 mW maximum power, 0.7 mm beam diameter) was used for excitation. The laser beam was expanded fivefold, and its spatial profile was homogenized into a top-hat distribution using a rotating diffuser (Thorlabs EDG5CD5; 0.5° diffusion angle, 25°/s rotation speed) and a plano-convex lens (150 mm focal length). The beam was then focused onto the sample plane through an objective lens (OptoSigma PAL-20-L-A; 20×, 0.3 NA). The depth of focus of the objective lens was ±3.1 μm; therefore, the measurement was primarily sensitive to this axial range along the optical axis. The total laser power at the sample plane was 60–80 μW, and the full width at half-maximum (FWHM) of the laser spot was ∼135 μm (Figure 2b).
The excitation beam profile in Figure 2b was not perfectly uniform because of incomplete homogenization by the diffuser. Owing to the 135 μm FWHM of the laser spot, the laser intensity at the edge channels was approximately half that at the center channels. As a result, the photoluminescence (PL) intensity and spectral signal-to-noise (S/N) ratio were reduced at the edge channels. In the following measurements, the exposure time was set sufficiently long to compensate for this reduction and to ensure an adequate S/N ratio across all channels.
Photoluminescence from the diamond particles was collected by the objective lens and separated from the excitation light using a short-pass dichroic mirror (Thorlabs DMLP605; 605 nm cut-on) and a notch filter (Thorlabs NF594-23; 594 nm central wavelength, 23 nm FWHM). The PL image was formed on the detector plane with a tube lens (OptoSigma TL-VIS-1.0X; 1×). The end surface of an optical fiber-bundle sleeve (sleeve B; channels 1–36) consisting of 36 hexagonally packed fibers (MF Optex ST230D; 230 μm core diameter, 250 μm cladding diameter, 0.2 NA) was placed at the detector plane, where the PL image was spatially discretized and collected. The central fiber was used as a dummy for positional alignment. On the sample plane, the collection diameter corresponding to a single fiber was 11.5 μm, the spatial sampling interval determined by the fiber pitch was 12.5 μm, and the hexagonal FoV had a side length of 50 μm. Interchannel crosstalk was assessed by launching light into sleeve A and recording the image formed on the sample plane, which confirmed that it was sufficiently small. A second optical fiber-bundle sleeve (sleeve C; channels A–E), consisting of five fibers, simultaneously collected neon (Ne) I emission lines from a discharge lamp (UVP Pen-Ray Lamp) as the wavelength reference. The lamp provides multiple emission lines with known wavelengths in the vicinity of the ZPL.
The Czerny–Turner spectrometer consisted of an entrance slit, a collimating lens (Sigma ART; 135 mm F1.8 DG HSM; 135 mm focal length, f/1.8), a diffraction grating (Richardson Gratings; 1200 grooves/mm), a focusing lens (Sigma ART; 105 mm F1.4 DG HSM; 105 mm focal length, f/1.4), and a complementary metal-oxide-semiconductor (CMOS) camera (Basler a2A5320-23umPRO; 14.58 mm × 8.31 mm sensor size, 2.74 μm × 2.74 μm pixel size, 12 bits). The simultaneously detectable wavelength range was designed to be 595–685 nm to cover the wavelength region around the ZPL at 638 nm. The reciprocal linear dispersion was 17 pm/pixel, and the wavelength resolution was 0.4–0.5 nm (FWHM) with a slit width of 100 μm. At the entrance slit, 41 fibers from sleeves B and C were aligned in a single row, with one fiber from sleeve C inserted after every nine fibers from sleeve B. Owing to the difference in focal lengths between the collimating and focusing lenses, the spectral image was demagnified by a factor of 105/135 = 0.78. The image length in the slit direction was therefore 250 μm × 41 fibers × 0.78 = 8.0 mm.
The relative channel sensitivities and their wavelength dependence were calibrated using the spectrum of a standard tungsten–halogen lamp (Labsphere IHLS-100-100) coupled to an integrating sphere (Labsphere US-080-SF). The collection solid angle of the entire system corresponded to f/2.45 (0.2 NA), which was limited by the NA of the optical fiber bundle. In this study, the optical fibers in sleeve B were arranged in a close-packed configuration; however, the configuration can be optimized depending on the measurement target. In addition, the number of fibers from sleeves B and C at sleeve A can be adjusted according to the required accuracy in wavelength determination and the available effective detector area.
Sample Preparation
Temperature-controlled diamond particles themselves were used as the measurement target. To obtain a spatial temperature distribution, particle ensembles were dispersed over a 4 mm × 4 mm square area. The use of dispersed particle ensembles to measure spatially continuous temperature distribution has been reported previously. 13
An ensemble of diamond particles with an average diameter of 750 nm (Adámas Nanotechnologies; MDNV1 µmHi10 mg; 3.5 ppm NV content) was used. Individual particles have slight variations in their ZPL spectra and temperature sensitivities,5,13 which might originate from impurities and surface effects. By measuring an ensemble, these variations were mitigated, while the total PL intensity was increased, resulting in an improved S/N ratio of the ZPL spectrum.
A total of 50 μL diamond suspension (1 mg/mL) was drop-cast onto a slide glass over a 4 mm × 4 mm square area and dried. A microscope image of the sample is shown in Fig. 2a. The total number of particles was ∼7 × 10⁷. Assuming a uniform particle density in both the lateral and depth directions, the number of particles integrated along the line of sight was estimated to be ∼500 per channel. Although the total thickness of the particle layer was not directly measured, it was expected to exceed 10 μm. Since the measurement was primarily sensitive to particles within the depth of focus (±3.1 μm), the obtained temperature represented an averaged value over this axial range. The slide glass was mounted on a temperature-controlled stage-top incubator (Tokai Hit TPiD-KW; 0.1 °C temperature accuracy) and observed through a 10 mm × 15 mm glass window.
The sample was used as a model to evaluate the fundamental performance of the thermometry system, particularly the wavelength determination accuracy and multichannel capability, without the influence of environmental complexity. For practical applications, reducing the particle layer thickness below the depth of focus would be desirable to minimize the influence of axial temperature gradients and improve spatial resolution. However, reducing the layer thickness would also decrease the total PL intensity, potentially degrading the spectral S/N ratio and temporal resolution.
Results and Discussion
Wavelength Calibration
Figure 3 shows the Ne I emission line spectrum measured for channel A. The CMOS camera exposure time and gain were set to 100 ms and 1 dB, respectively, and 100 spectra were averaged. Fifteen Ne I lines were fitted with Gaussian functions to determine their peak pixel positions. The relation between the known wavelengths taken from the NIST Atomic Spectra Database and the corresponding pixel positions is shown in Fig. 3. This relation was fitted with a quadratic function:
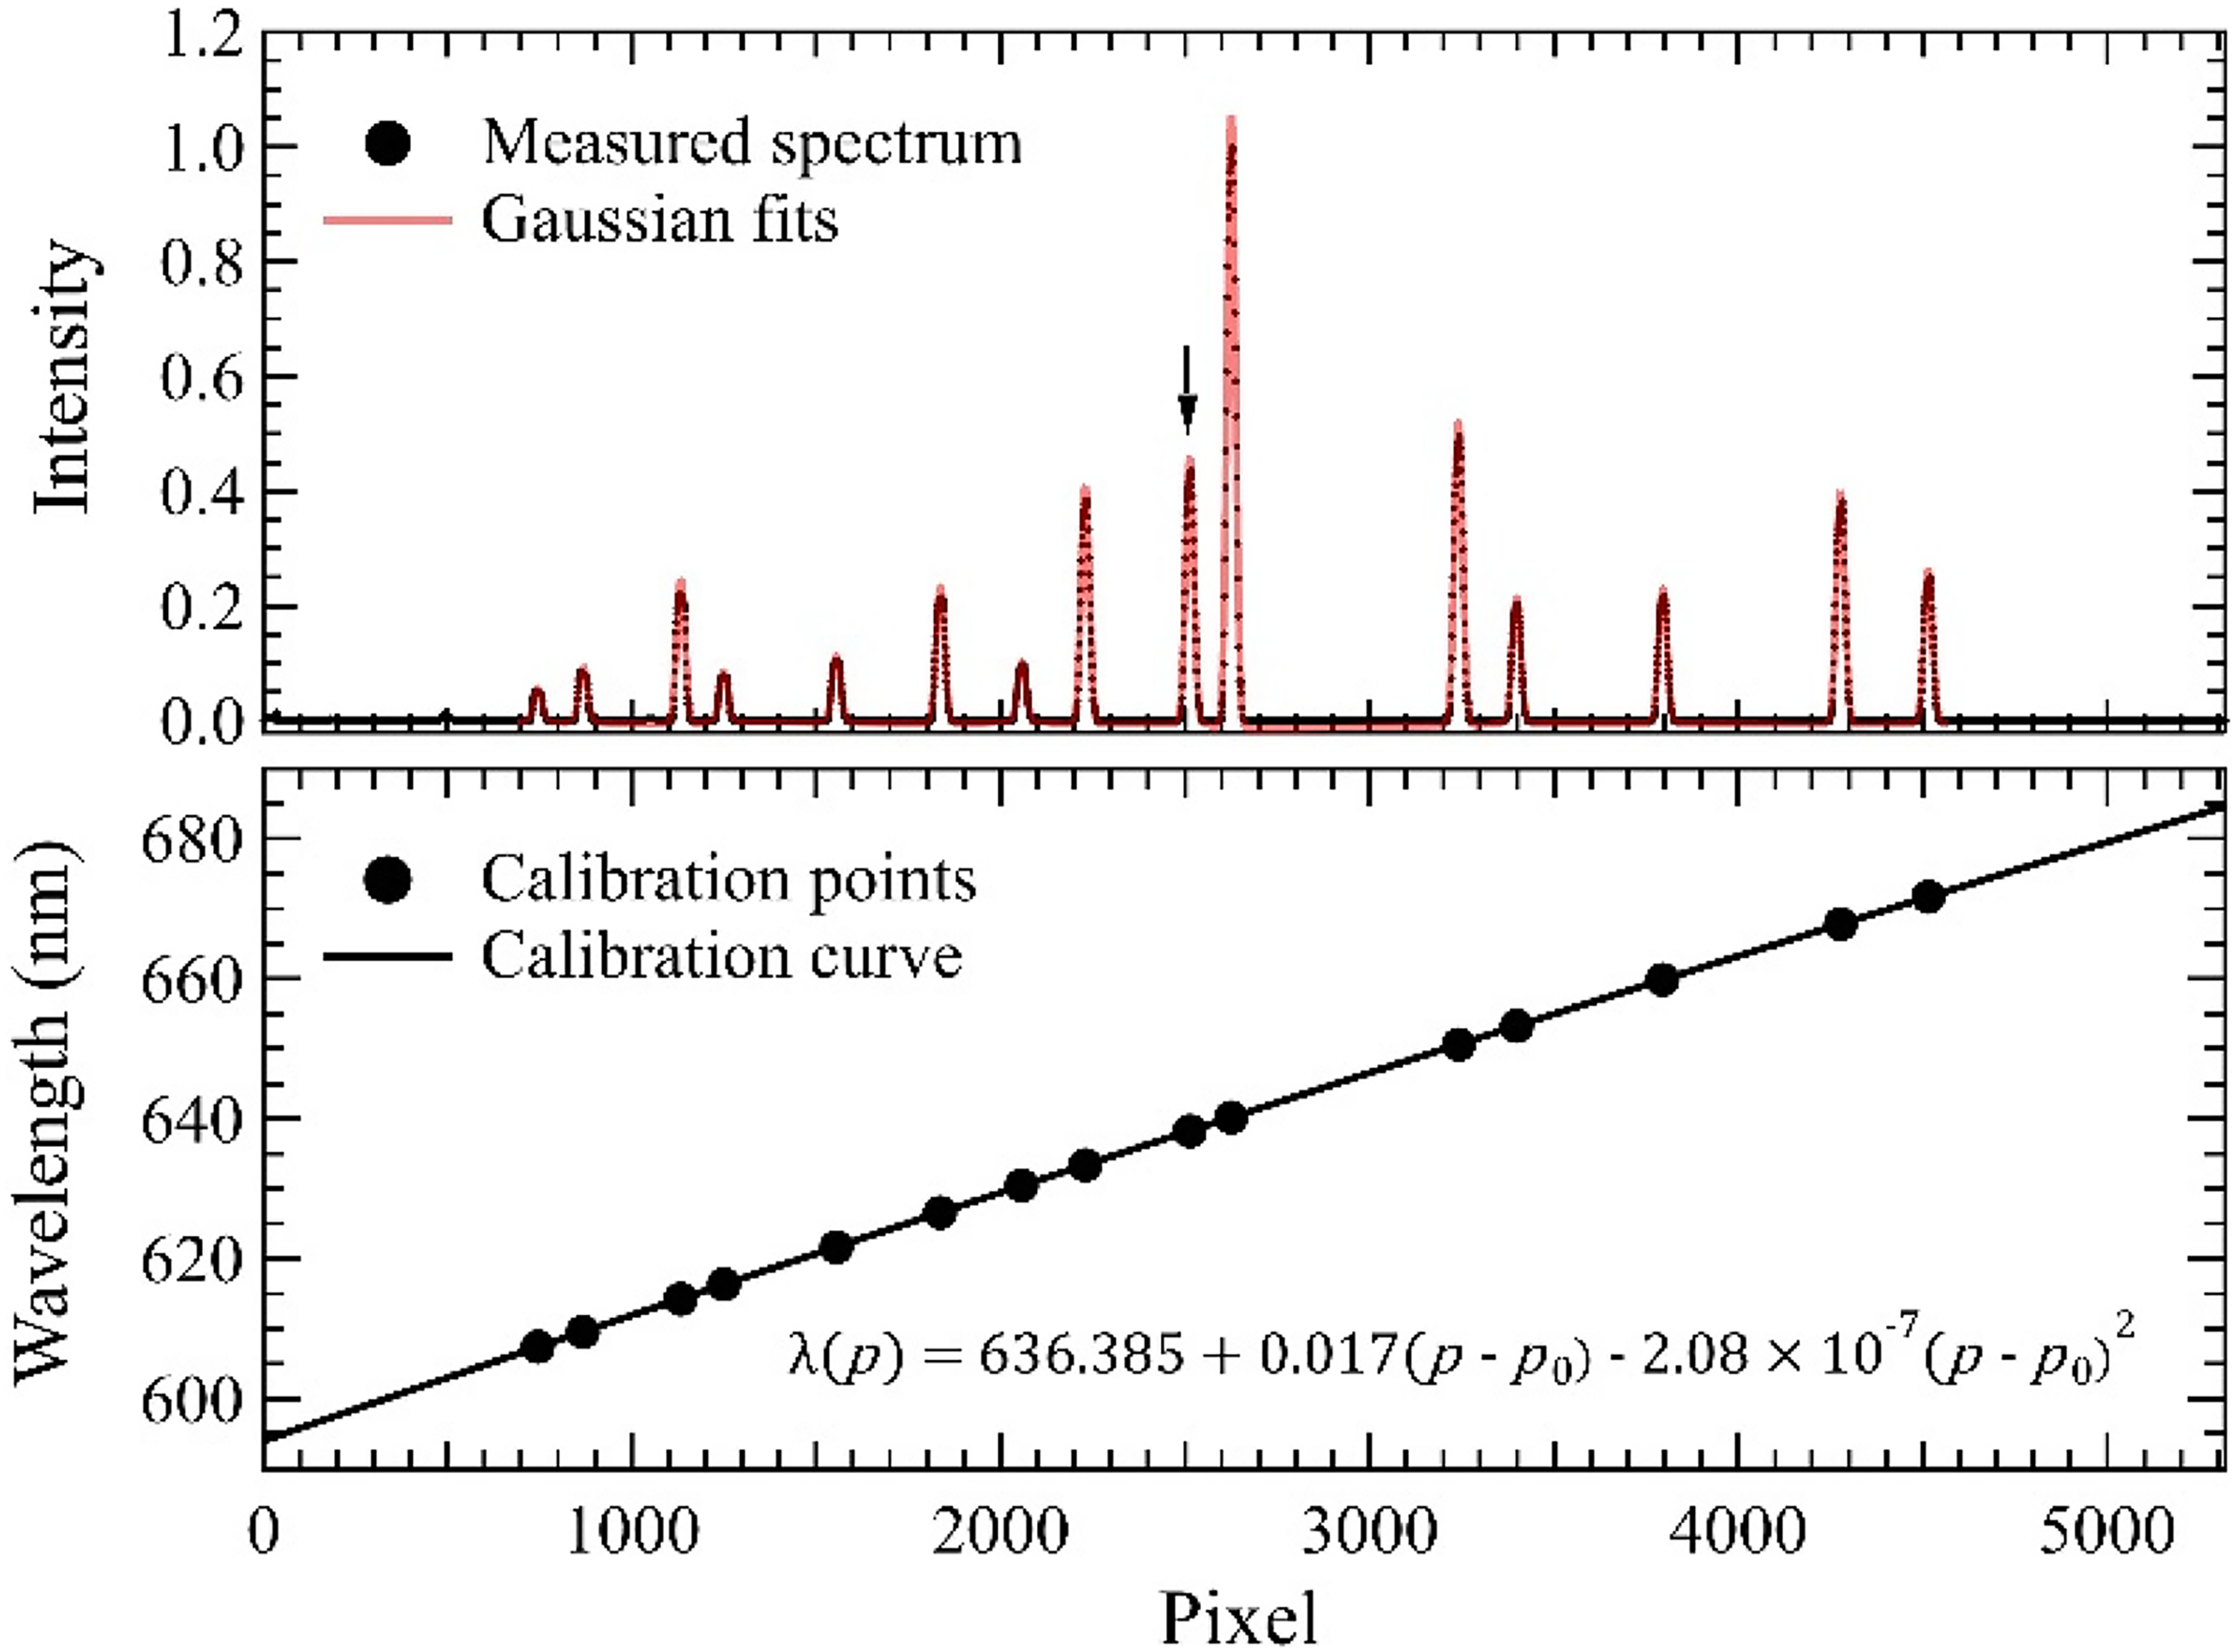
(Top) Fifteen Ne I emission line spectra; (bottom) wavelengths as a function of pixel positions with a quadratic fit. The emission line used for evaluation of the instrumental function is indicated by using the arrow.
Precalibration was performed for all channels, whereas in situ calibration was performed only for channels A–E to compensate for temporal drift of the spectrometer during the measurement. The relative wavelength differences between channels obtained in the precalibration were assumed to be invariant, and the absolute wavelength was corrected by the in situ calibration. The resulting σcalib for channels 1–36 was less than 2.1 pm, as shown in Fig. 4. The Gaussian function fitted to the Ne I emission line at 638.29914 nm was used as the instrumental function for the fitting analysis of the ZPL spectrum. Without the in situ calibration, the spectrometer temperature drift results in a wavelength drift of ∼4 pm per hour.
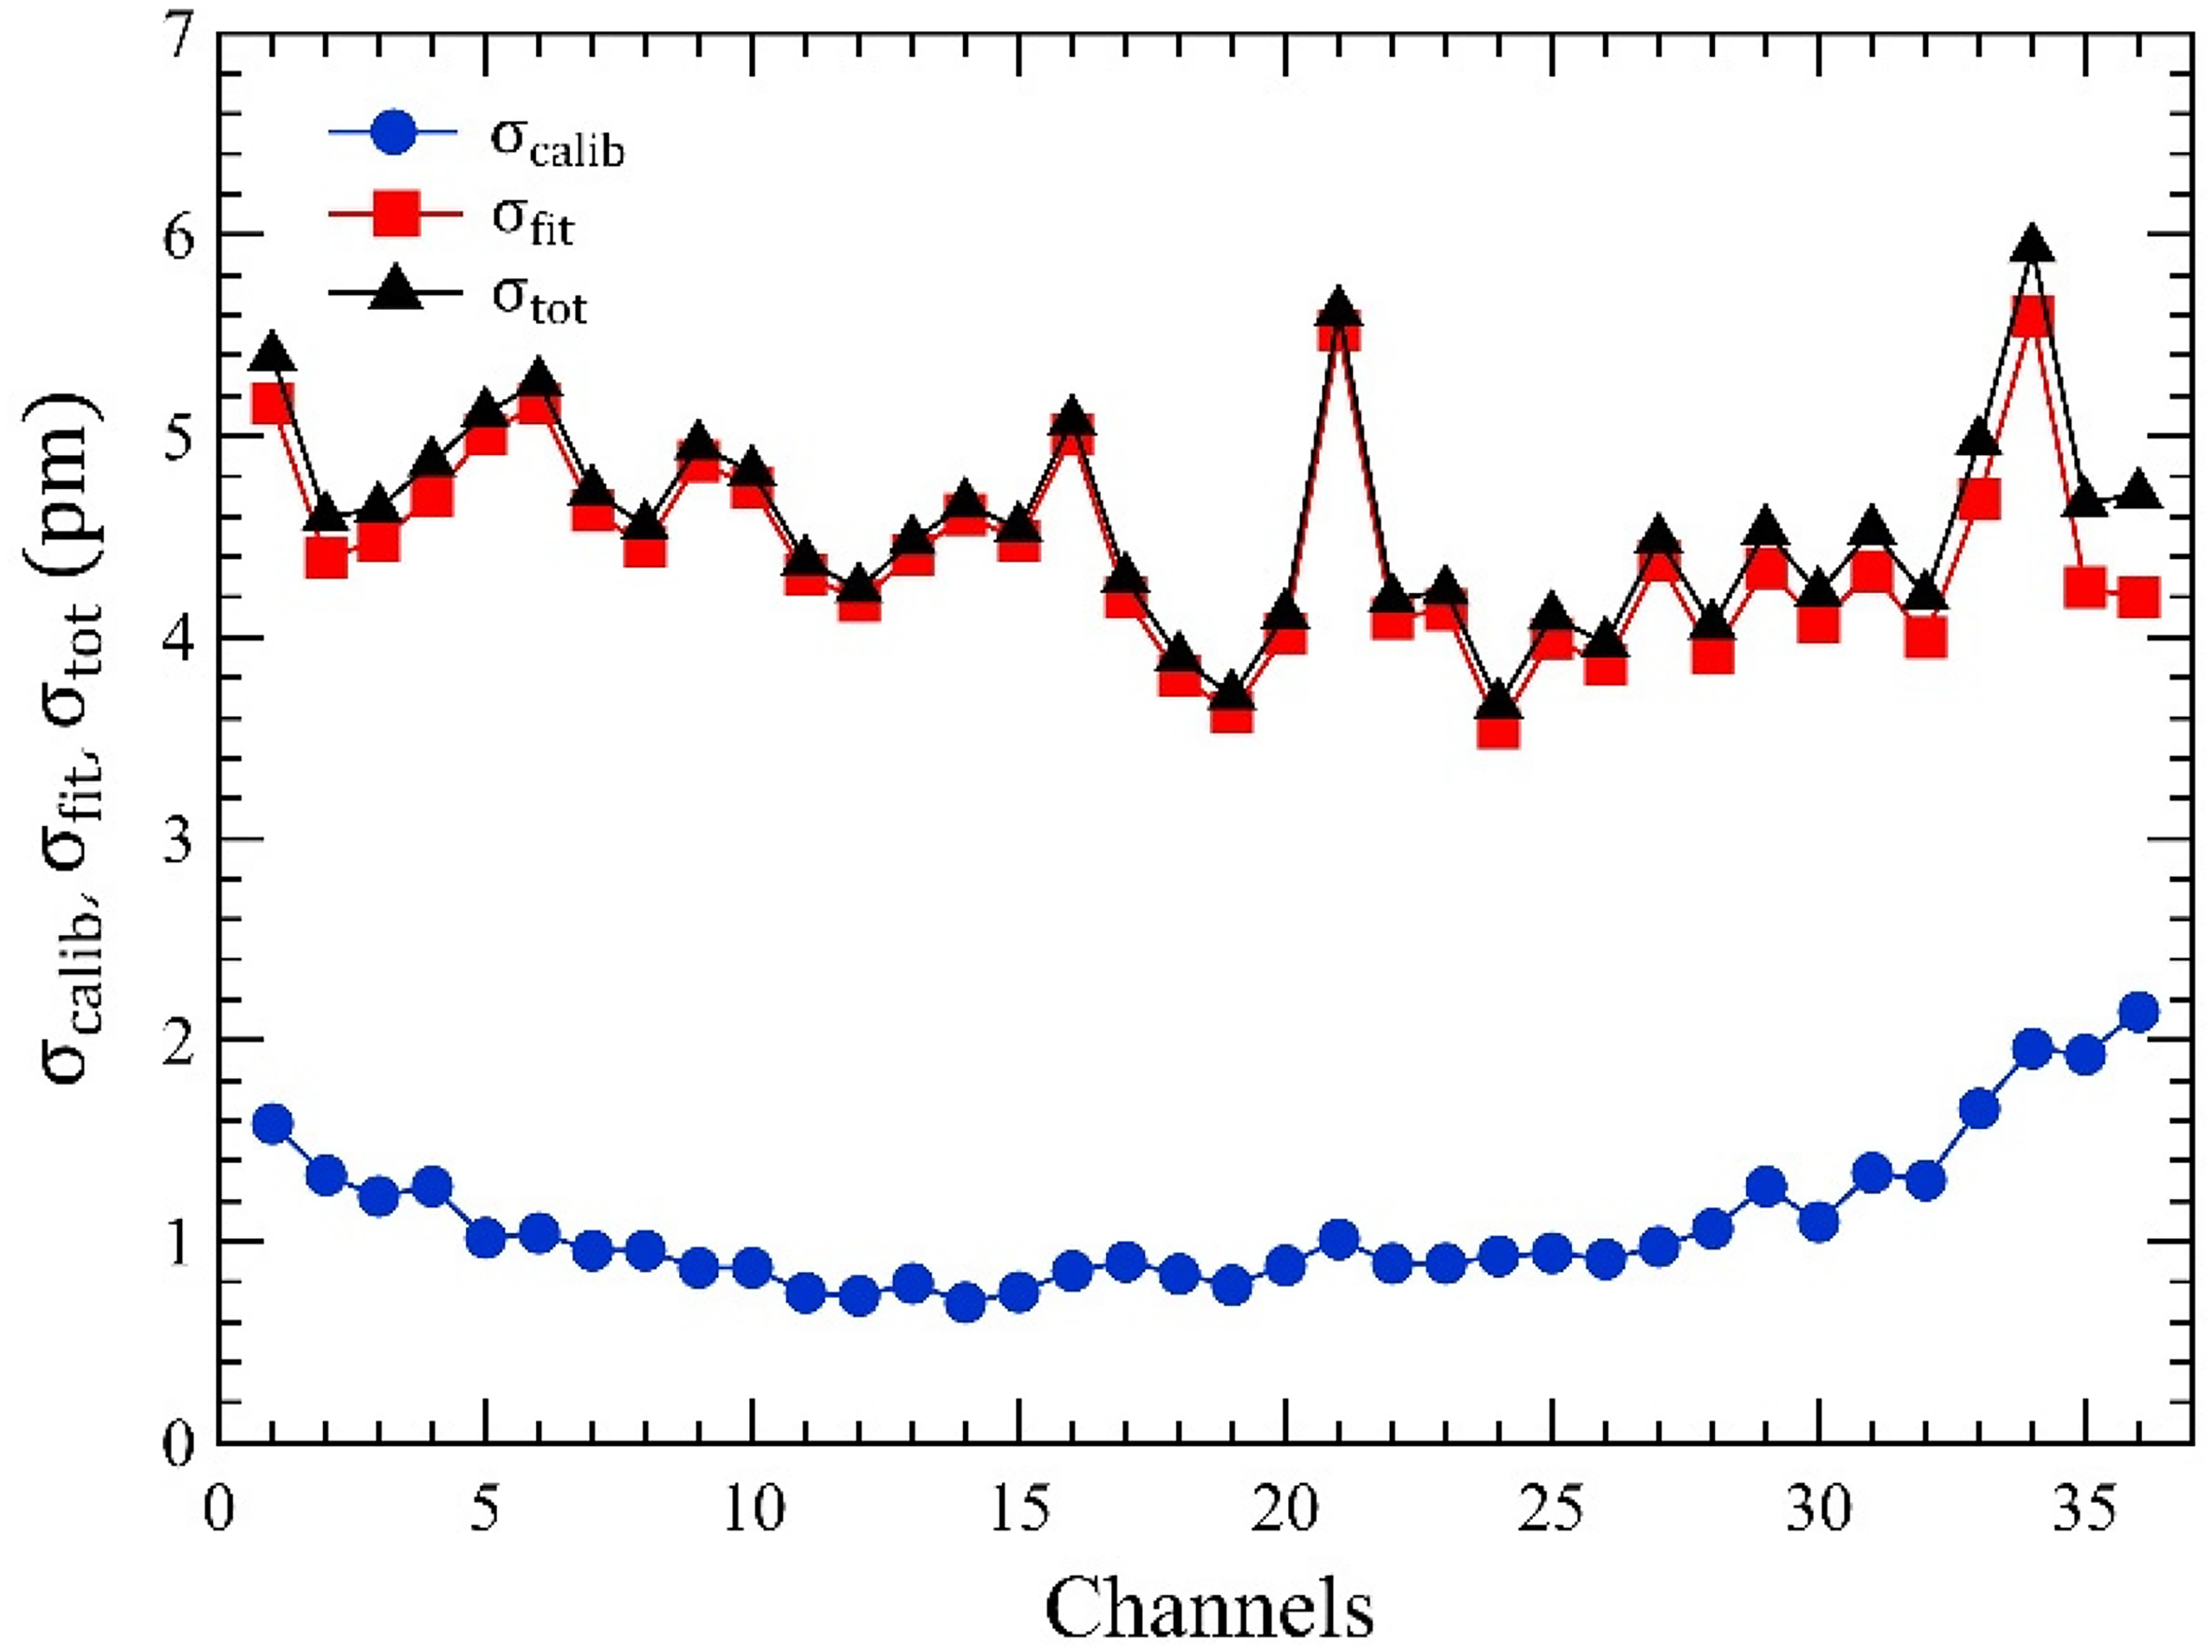
Errors in the determined ZPL peak wavelength at 25.0 °C. Here, σcalib represents the wavelength calibration error, σfit denotes the fitting error of the ZPL spectrum, and σ
Zero-Phonon Line Spectrum Fitting
Because the ZPL of the negatively charged nitrogen-vacancy (NV−) center is superimposed on the phonon sideband (PSB), the relative PSB intensity was reduced by using a 594 nm laser instead of a 532 nm laser.
4
Nevertheless, the PSB still affected the determination of the ZPL peak wavelength. To accurately determine the ZPL peak wavelength, the PL spectrum was fitted with the following analytical function,4,10 which represents the sum of the theoretical spectral profiles of the ZPL and the PSB:
The PL spectra were measured at 25.0 °C with an exposure time of 1 s and a gain of 1 dB, and 100 spectra were averaged to sufficiently reduce the noise. An example spectrum obtained for channel 18 with the fitting result is shown in Fig. 5. The fitting range was set to 630–643 nm to minimize the standard deviation of λ0, denoted as σfit. The obtained σfit values for channels 1–36 are shown in Fig. 4. By combining σcalib and σfit, the total error in the evaluated ZPL peak wavelength was estimated as
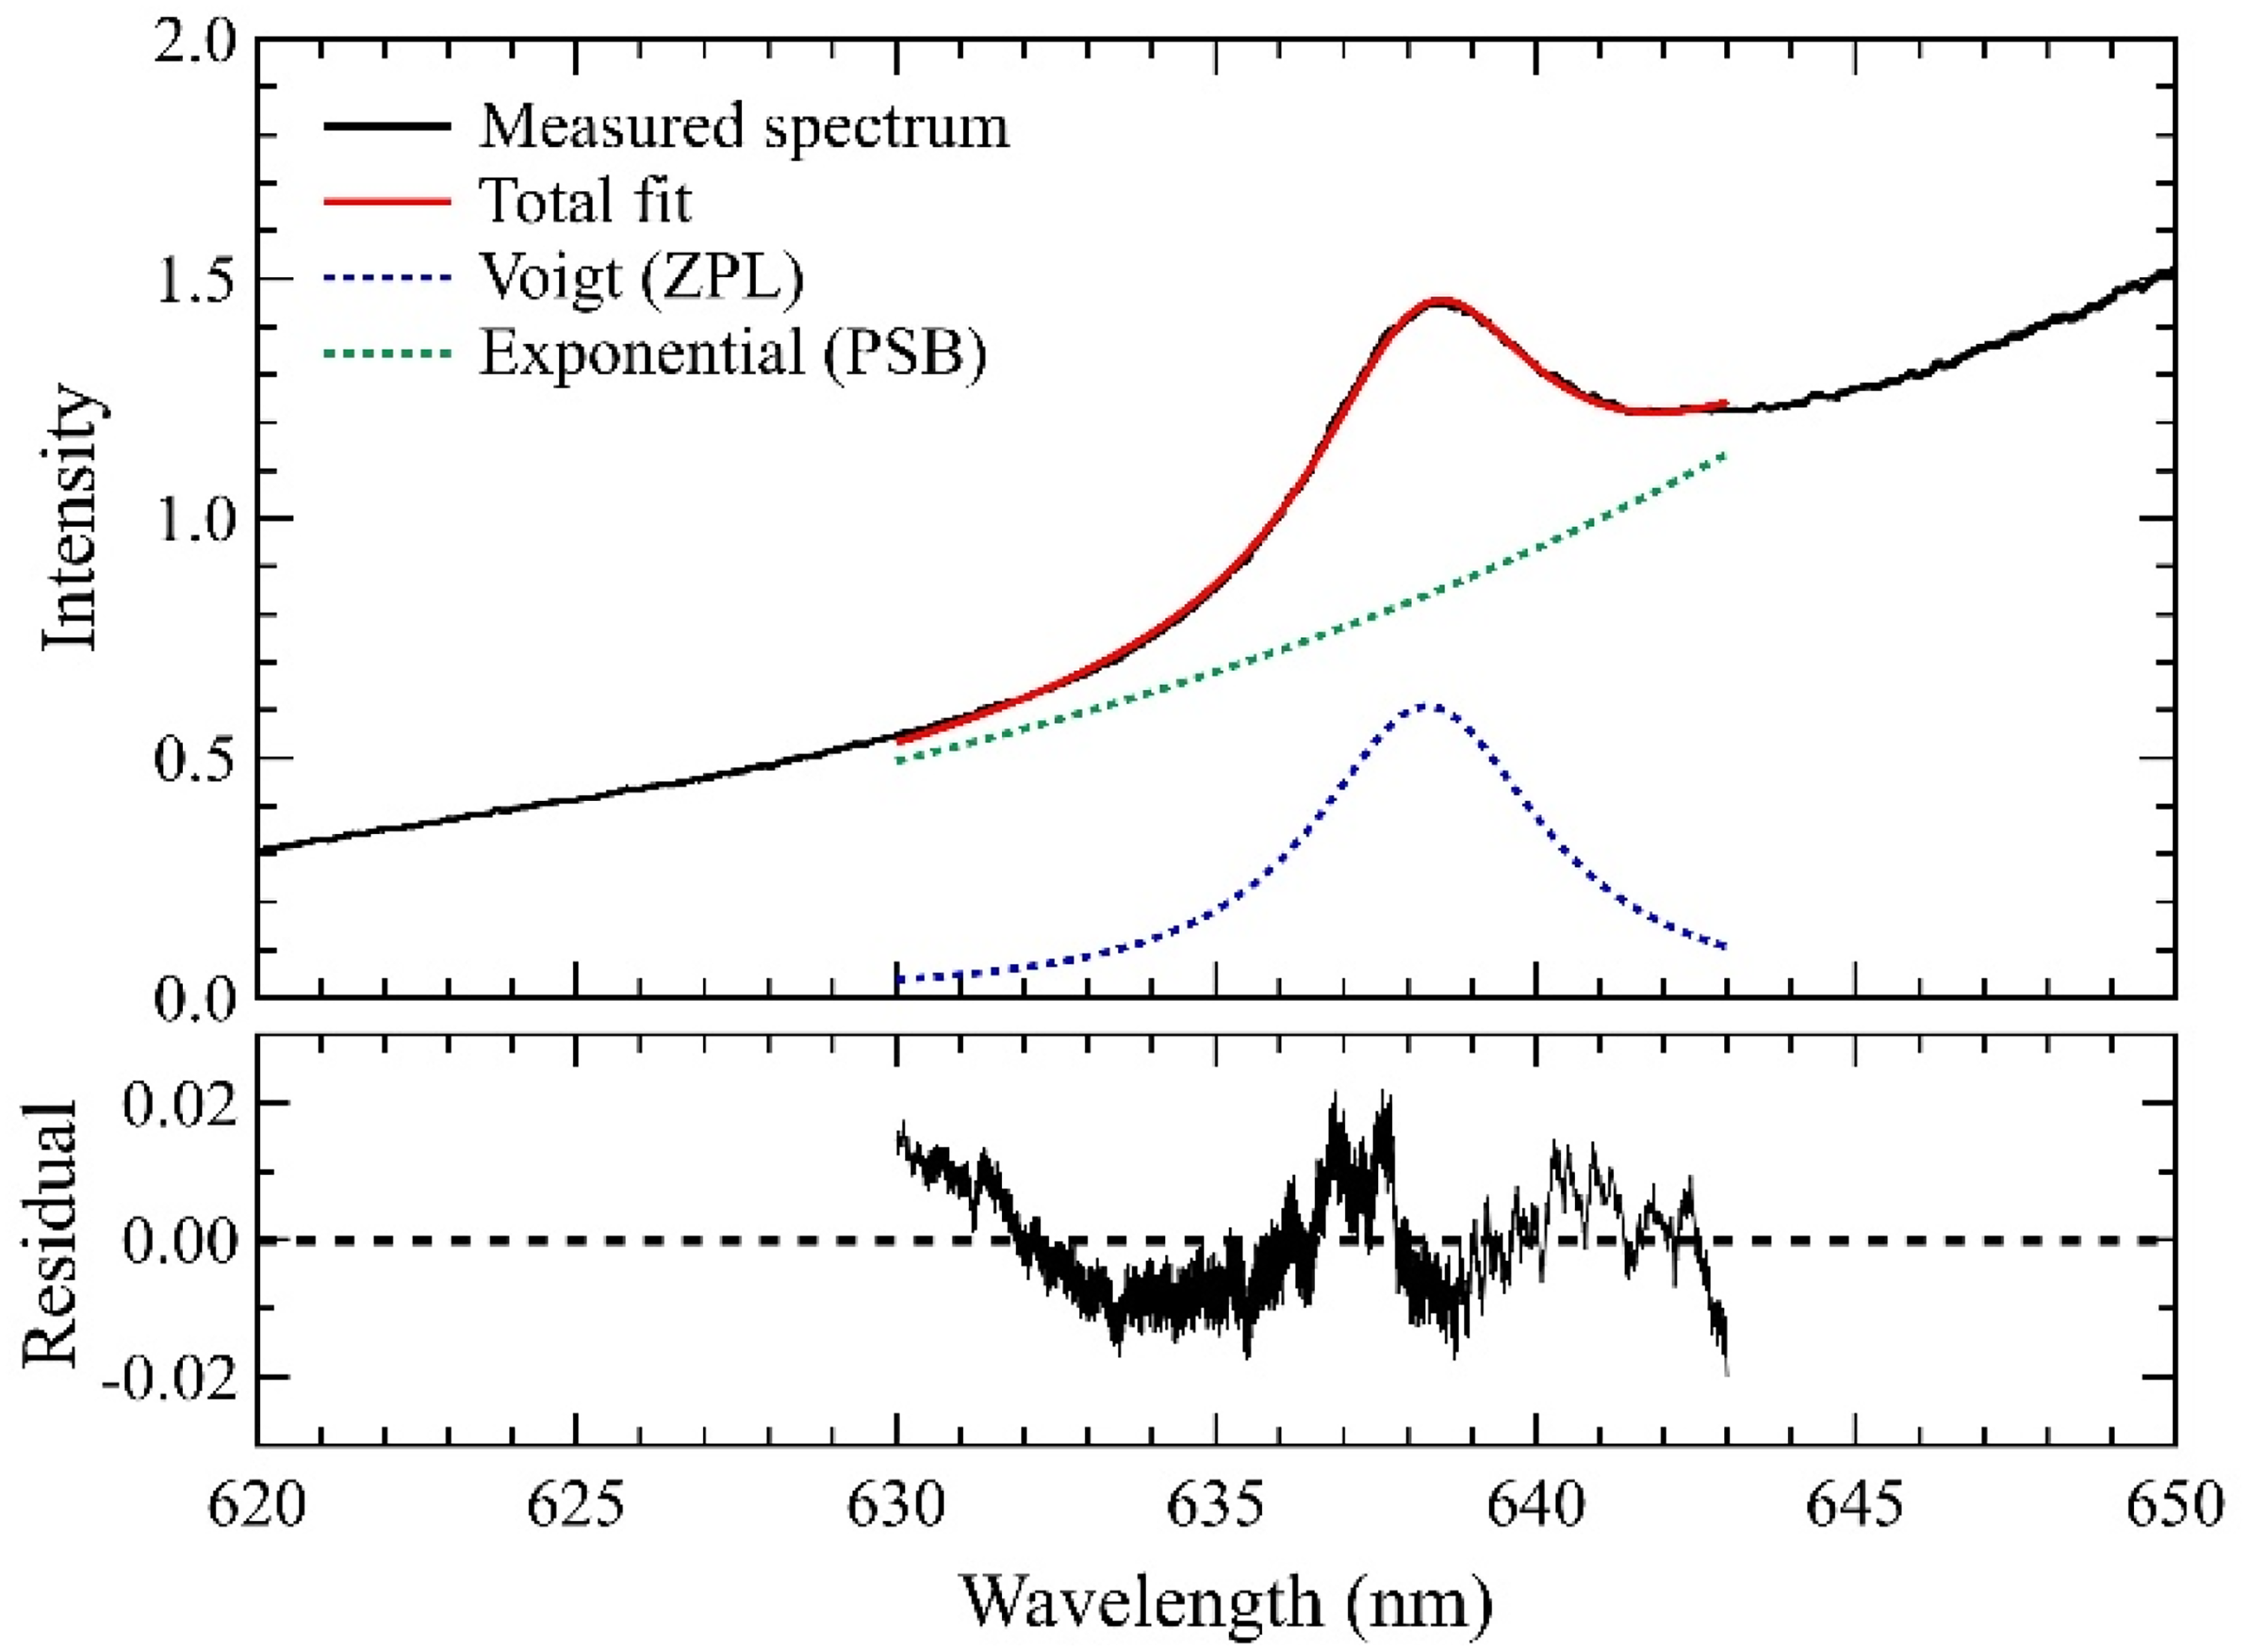
ZPL spectrum measured for channel 18 at 25.0 °C with the fitted curve based on Eq. (2).
The σfit mainly originates from a slight mismatch between Eq. 2 and the actual PL spectral shape under high spectral S/N conditions. When the exposure time or the number of averaged spectra is reduced, the spectral S/N ratio is degraded due to additional noise such as photon shot noise and CMOS camera dark noise, leading to an increase in σfit.
Confirmation of Imaging Thermometry
To confirm the performance of the imaging thermometry, the sample was maintained at 34.0, 37.0, and 40.0 °C. Owing to individual variations in the ZPL spectra, slight channel-to-channel differences in the ZPL peak wavelength remained even after ensemble averaging. To compensate for this effect, the ZPL peak wavelengths measured at 37.0 °C were used as references, and the temperatures at 34.0 and 40.0 °C were determined from the relative ZPL peak wavelength shifts assuming a temperature sensitivity of 10.2 pm/ °C.
Figure 6 shows the temperatures evaluated for channels 1–36 and their spatial distributions. The bottom panels present discretized temperature images, in which each channel corresponds to a spatial sampling point within the FoV (Fig. 2b). The channel-to-channel variations observed in Fig. 6 mainly originate from systematic offsets associated with the diamond particle ensemble rather than from actual temperature differences. The average temperatures and their standard deviations were 33.8 ± 0.9 °C for the nominal temperature of 34.0 and 39.8 ± 0.8 °C for 40.0 °C. Despite the presence of channel-dependent offsets, imaging thermometry with a mean temperature error below 1 °C across all channels was achieved by evaluating relative wavelength shifts.
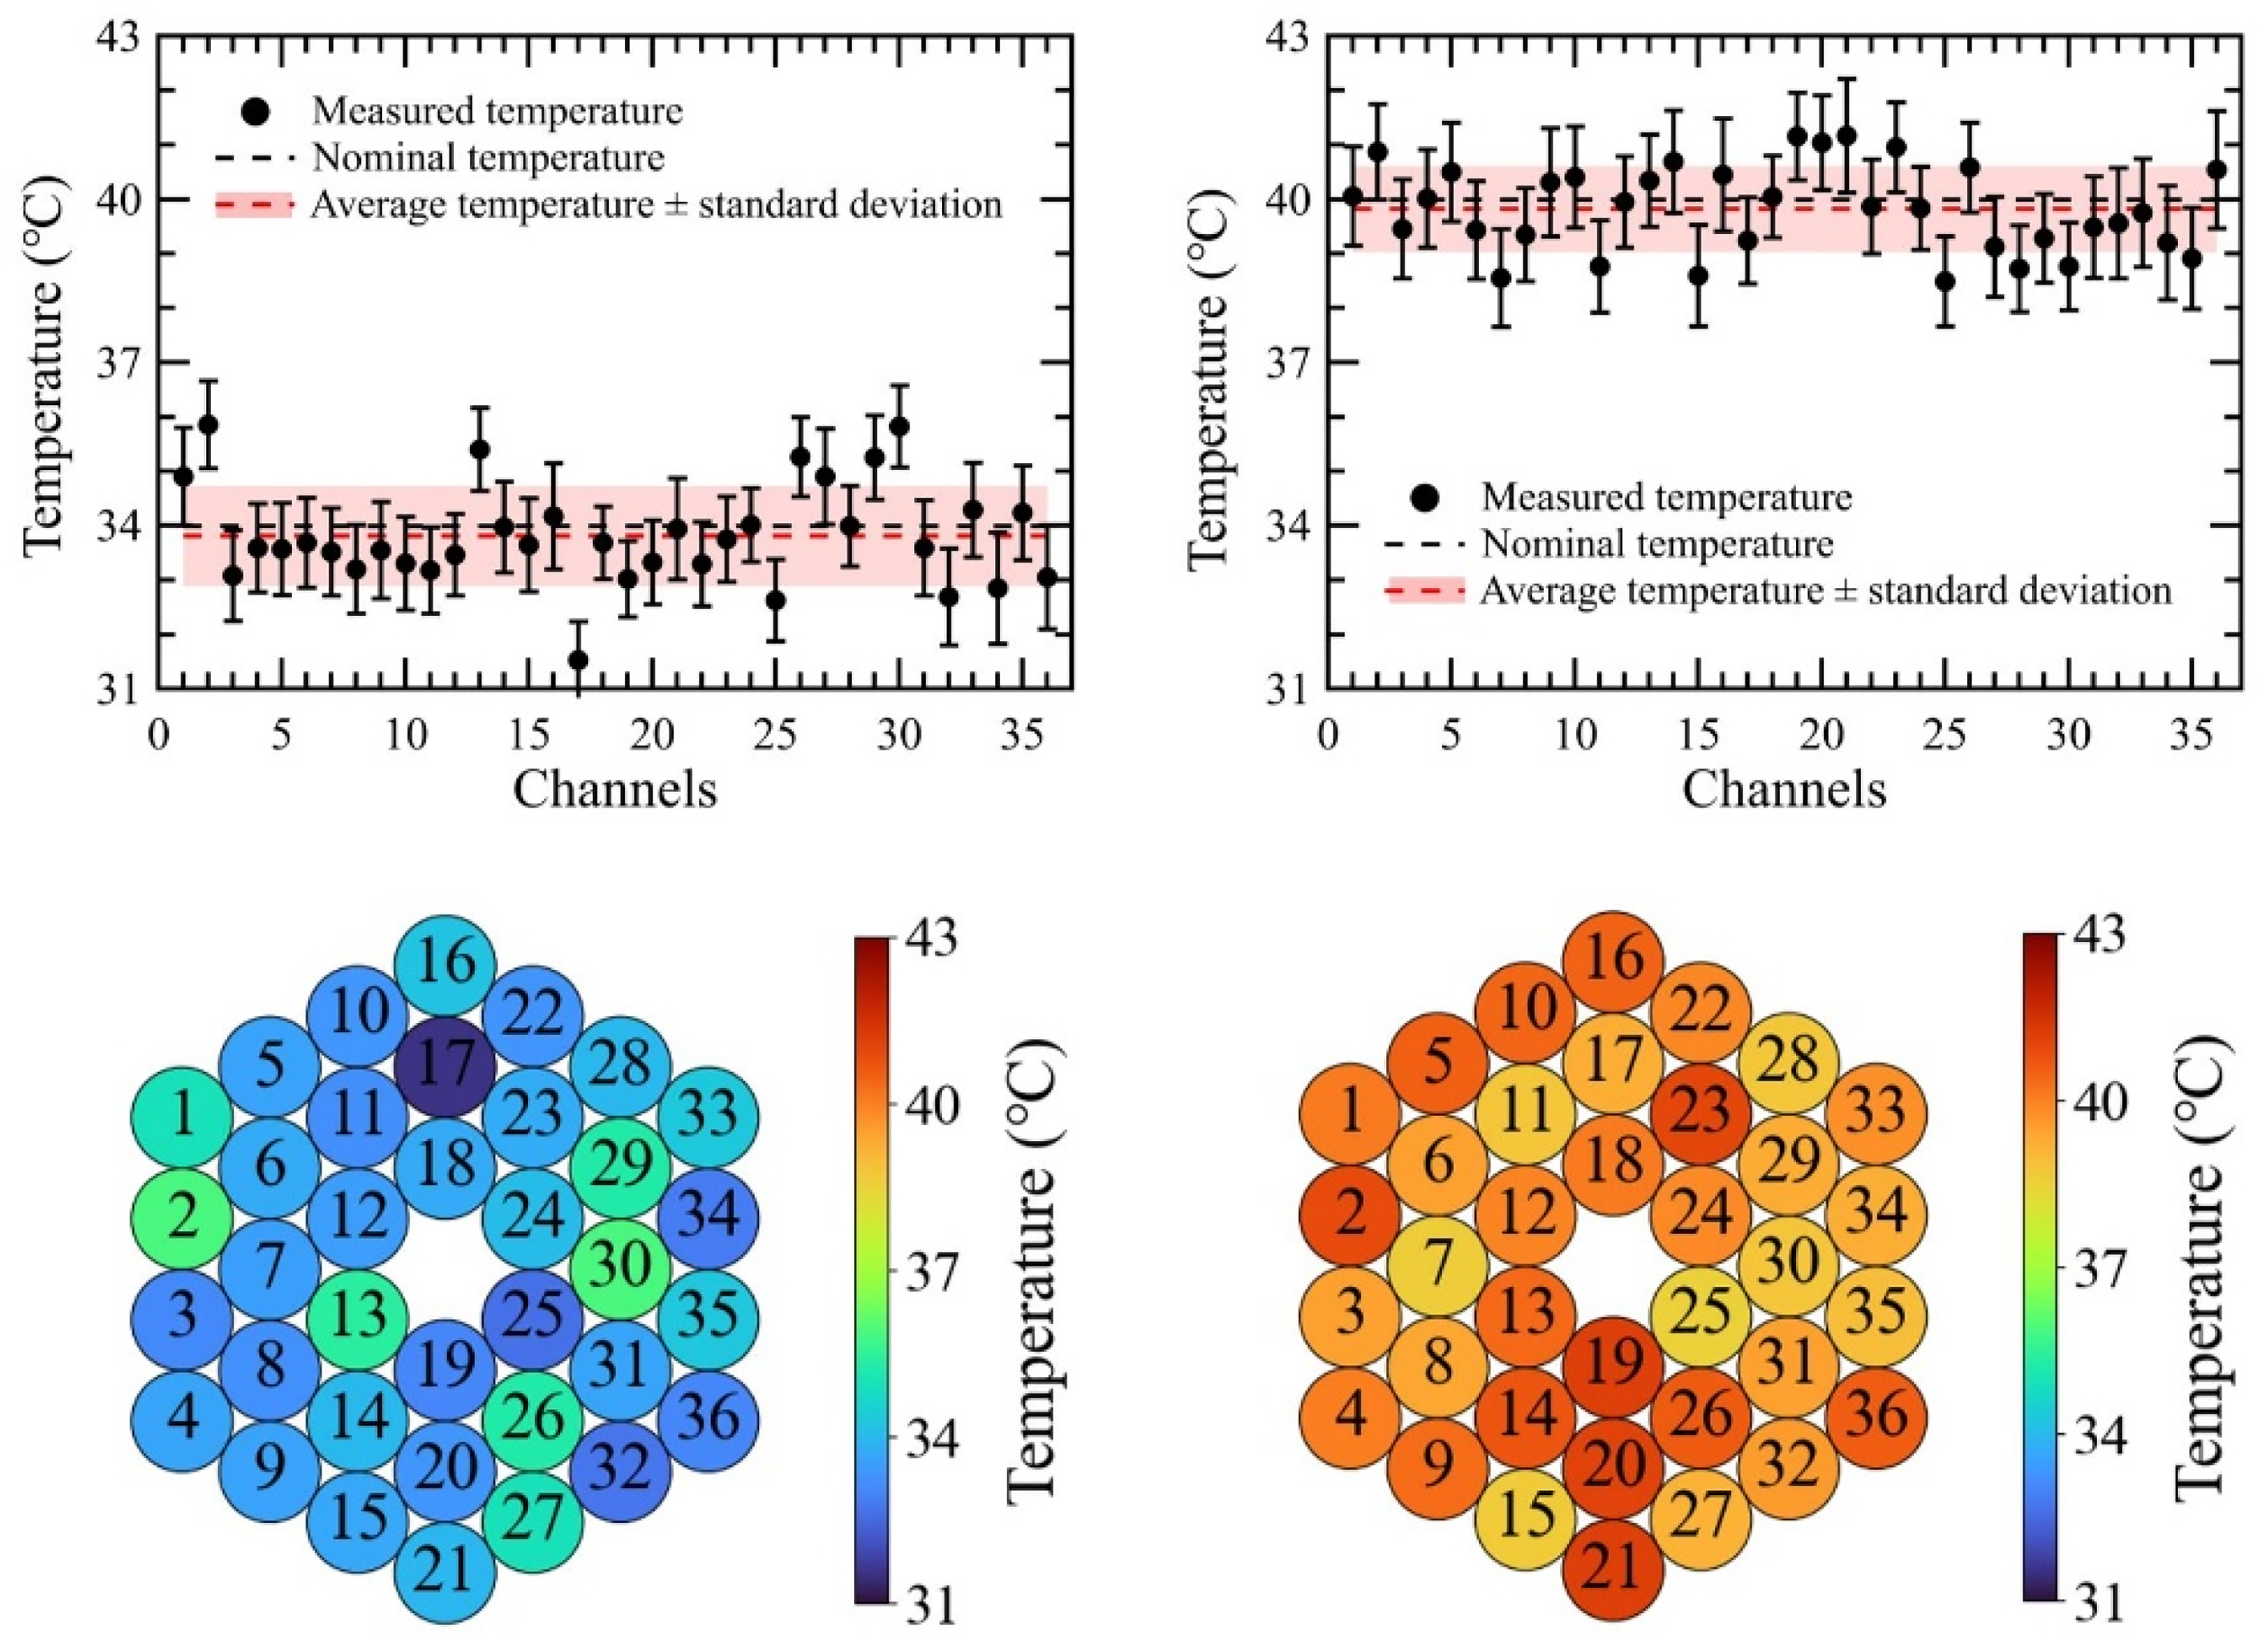
Measured temperatures for channels 1–36 (top) and their spatial distributions (bottom) representing discretized temperature images of the diamond-particle ensemble at uniform temperatures of 34.0 and 40.0 °C.
In the present analysis, a single ensemble-averaged temperature sensitivity of 10.2 pm/ °C was used for all channels. Since the sensitivity varies slightly from channel to channel, the use of a single sensitivity introduced systematic offsets. The systematic offsets could be reduced by calibrating and applying a channel-specific sensitivity for each channel. However, such an approach requires an additional calibration procedure for every channel, reducing the practical simplicity of the method.
In practice, the choice of calibration strategy should depend on the intended application. Using a single ensemble-averaged temperature sensitivity obtained from a large number of particles prior to the experiment provides a simple approach, whereas using channel-specific sensitivities offers higher absolute accuracy at the expense of additional calibration effort. The influence of sensitivity variations decreases as the temperature range to be measured becomes narrower. Therefore, the optimal strategy should be selected according to the required temperature accuracy and the temperature range of interest. Moreover, the systematic offsets can in principle be further reduced by using diamond particles with improved particle-to-particle uniformity.
Conclusion
We developed an optical fiber-bundle-based all-optical imaging thermometry system that enables simultaneous acquisition of ZPL spectra at 36 spatial channels with in situ wavelength calibration. The ZPL peak wavelength determination accuracy of 4–6 pm, corresponding to a temperature accuracy of 0.4–0.6 °C, was achieved at room temperature. The concept of in situ wavelength calibration is applicable to a wide range of fluorescence-based spectroscopic measurements requiring high accuracy in wavelength determination.
Imaging thermometry of an ensemble of submicron diamond particles was demonstrated at 34.0, 37.0, and 40.0 °C. Channel-dependent systematic offsets were observed because a single ensemble-averaged temperature sensitivity of 10.2 pm/ °C was applied to all channels, despite slight channel-to-channel variations in the actual temperature sensitivity. Nevertheless, a mean temperature error below 1 °C across all channels at 34.0 and 40.0 °C was achieved.
Since the achievable temporal resolution depends on factors such as the number of NV− centers, laser power, sample transmittance, and the required temperature accuracy, detailed investigation of time-resolved performance will be carried out in future work.
In practical environments, additional factors such as autofluorescence, scattering, absorption, and spatial variations in excitation and collection efficiency may affect the ZPL spectral shape and wavelength determination accuracy. Evaluation of these effects will be important for extending the present method to practical temperature imaging applications.
Footnotes
Acknowledgments
The authors would like to express their gratitude to Professor Osamu Tabata of Kyoto University of Advanced Science, Professor Kenichiro Kamei of New York University Abu Dhabi, and Dr. Mazin Jouda of Karlsruhe Institute of Technology for their valuable comments and encouragement.
Declaration of Conflicting Interests
The authors declared no potential conflicts of interest with respect to the research, authorship, and/or publication of this article.
Funding
The authors disclosed receipt of the following financial support for the research, authorship, and/or publication of this article: This work was partially supported by JSPS KAKENHI (Grant Numbers 18KK0306, 23H00260, and 24K00604).
